Article

Experimental Assessment of an Electrofilter and a Tandem Positive-Negative Corona Charger for the Measurement of Charged Nanoparticles formed in Selective Catalytic Reduction Systems

by
Matthias Schwelberger
1,
Athanasios Mamakos
2,
Martin Fierz
3 and
Barouch Giechaskiel
4,*
1
Institute for Internal Combustion Engines and Thermodynamics, Graz University of Technology, 8010 Graz, Austria
2
AVL GmbH; 8020 Graz, Austria
3
Naneos Particle Solutions GmbH, 5210 Windisch, Switzerland
4
European Commission, Joint Research Centre, 21027 Ispra, Italy
*
Author to whom correspondence should be addressed.
Appl. Sci. 2019, 9(6), 1051; https://doi.org/10.3390/app9061051
Submission received: 15 February 2019 / Revised: 9 March 2019 / Accepted: 11 March 2019 / Published: 13 March 2019
(This article belongs to the Special Issue Air Pollution)

Abstract

:

Featured Application

Application of an electrofilter and a tandem negative-positive corona charger to a diffusion charger based instrument to mitigate the influence of highly charged aerosol.

Abstract

Onboard measurement of non-volatile particle number (PN) emissions with portable emissions measurement systems (PEMS) was introduced for the type-approval of passenger cars in Europe since 2017 and is foreseen for heavy-duty (HD) vehicles in 2021. First studies on the performance of PN-PEMS with HD engine exhaust revealed larger differences between established PN-PEMS techniques than what was observed for passenger cars. Particles forming in selective catalytic reduction (SCR) systems for NOx of late technology HD engines have recently been identified as a potential reason for the observed differences. The formed particles have a size distribution peaking below the regulatory limit of 23 nm and most importantly acquire high (more than one) positive charges at the elevated exhaust temperatures. Precise measurement of such highly charged nanosized particles with PN-PEMS instrumentation utilizing diffusion charger (DC) based counters requires proper conditioning of these charges. Two approaches were investigated in this study: (a) an electrofilter (EF) to completely remove charged particles below the regulated size and (b) a tandem negative-positive corona (TC) charger to directly condition pre-charged particles. The two technical solutions were tested alongside the unmodified DC-based PN-PEMS, a PN-PEMS utilizing a condensation particle counter (CPC) and a reference stationary PN system using exhaust of two SCR-equipped HD engines. The results confirmed that the particles forming in such SCR systems are responsible for the observed inconsistencies and that both technical solutions efficiently address the interferences of these pre-charged nanoparticles.

Graphical Abstract

1. Introduction

Air pollution is recognized as an important global environmental and health risk factor. In Europe, the most serious pollutants in terms of harm to human health are particulate matter (PM), nitrogen dioxide (NO2) and ground-level ozone (O3) [1]. PM causes damage to ecosystems and cultural sites, and reduced visibility and is recognized as an important global risk factor for disease [2]. Vehicle PM emissions have been addressed with very low PM mass limits in the United States of America (USA) and the introduction of the non-volatile particle number (PN) method in the European Union (EU). This method counts non-volatile (sometimes called solid) particles, defined as those surviving a thermal pre-treatment stage at 350 °C, with a diameter greater than 23 nm [3]. The limit value is 6 × 10¹¹ particles per km (#/km) for passenger cars or per kWh (#/kWh) for heavy duty (HD) engines. At the same time, there is an on-going discussion about reducing the lower detection size to 10 nm in order to cover engines that have a high fraction of sub-23 nm particles (e.g., some spark ignition vehicles) [4].
Recently, a PN limit was introduced for in-service conformity testing of light-duty vehicles (2017) in the EU and will be introduced for heavy-duty vehicles in the next regulatory amendment Euro VIe (2021). Owing to the challenges imposed by onboard measurements, including power consumption, weight and harsh operating conditions, the specifications for onboard sensors are relaxed. While the reference laboratory procedure does not explicitly specify a sensor principle, the specifications necessitate the use of a full flow condensation particle counter (CPC). A CPC optically counts the particles after their growth in a condensation section. The regulation requires that the CPCs have a detection efficiency of 50% ± 12% at 23 nm and above 90% at 41 nm [3,5]. PN-PEMS systems can use any type of CPCs or diffusion charger (DC) based detectors to count particles. The key element of a DC-based detector is a unipolar charger that electrically charges the particles. The charging efficiency follows a power-law dependence on particle diameter with an exponent that is typically around 1.1–1.6 [6]. The EU regulation 2017/1154 [7] requires a much tighter size dependence, thus necessitating the use of advanced DC-based sensor concepts to reduce the size influence [8,9]. Measurements with light duty exhaust [10] suggested equivalent performance between PN-PEMS instrumentation utilizing such advanced DC sensors and CPCs. Differences of either PN-PEMS system was less than ~±35% from laboratory-grade PN instrumentation when all sampling from tailpipe [11].
Subsequent measurements with HD vehicles and engines equipped with selective catalytic reduction (SCR) systems, however, revealed quite high differences (>50%) between advanced DC and CPC based PN PEMS systems [12,13]. Follow-up investigations [14] indicated the particles forming following urea injection in the SCR as a possible reason for the observed differences. The exact chemistry and formation mechanism of these particles is not well understood. It has been suggested that these are ammonium sulfates and bisulfates [15,16] or byproducts of the ammonium reduction process (i.e., ammelides, ammelines) [14]. These produced particles were found to be non-volatile (in the sense that they survive thermodilution at 350 °C) exhibiting a size distribution that peaks below 20 nm, i.e., below the regulatory limit of 23 nm. Most importantly, these particles were found to acquire high positive charges at exhaust temperatures exceeding approximately 300 °C at the inlet of the SCR system. While the exact charge distribution is not precisely quantified, it was shown that even the lowest particles detected (~5–10 nm) can carry as high as two positive charges on average.
The proper operation of any diffusion-charger-based instrumentation requires that the charge state of the particles is precisely controlled by the corona charger. The corona charger efficiency is an essential part of the instrument kernel function and accordingly the data inversion. The thermally treated automotive exhaust aerosol is predominantly composed of fractal soot [17] that is bipolarly charged with an overall neutral charge [18]. It is well established that fractal particles are more efficiently charged than compact spherical/cubic particles [19,20,21,22,23]. Accordingly, the regulation requires that the calibration of DC systems is performed with neutralized soot-like fractal particles. However, if particles entering the DC are pre-charged, the actual charging efficiency may be different than established during calibration [24,25] and this will affect the data inversion process. The actual effect will depend on the charge level and size of the particles as well as the design characteristics of the corona. The charging efficiency of commercial corona chargers is typically less than one for neutral particles smaller than 30 nm [6]. Therefore, when highly charged particles of the same polarity in this size range (like those produced in the SCR) pass through them, their charge level can only increase and will thus be much higher than if they were neutral.
In this study, two technical solutions for the conditioning of pre-charged particles were developed:
  • The use of an electrofilter (hereinafter EF) upstream of a corona charger to remove all charged particles below the lowest detection size required by the regulation before entering the sensor. The concept is similar to the use of an elevated ion trap to adjust the cut-off size of DC-based instruments [26]. However, by applying the electric field upstream of the corona, the EF only tackles the charged fraction of the sampled aerosol, thus selectively targeting the particles formed in the SCR.
  • The use of a negative and a positive corona charger in tandem to condition (neutralize) the sample aerosol by exposing it to a bipolar ion-environment (hereinafter referred to as TC = Tandem Negative-Positive Corona). Similar approaches have been previously successfully established in other commercial instruments [27].
The design and parametrization of both solutions were designed for application on the DC-based detector from Naneos (Windisch, Switzerland) employed in the PN-PEMS from AVL GmbH (Graz, Austria). Their performance in conditioning charged aerosol was first characterized by monodisperse graphite aerosol of different charge levels. Subsequently they were introduced in AVL PN-PEMS systems and tested alongside the original AVL PN-PEMS system, a commercial PN-PEMS on-board system (OBS) from Horiba (Kyoto, Japan) utilizing a CPC, and a stationary laboratory grade reference PN system from AVL (Graz, Austria) in exhaust measurements of two HD engines equipped with SCR systems.
The results of the present study proved that the previously reported overestimations of DC-based PN-PEMS instrumentation originates from the formation of positively charged nanoparticles in the SCR of heavy-duty diesel engines. The study also illustrates that the two technical solutions evaluated can effectively suppress the interference of these positively charged nanoparticles in RDE measurements with DC-based PN-PEMS systems.

2. Materials and Methods

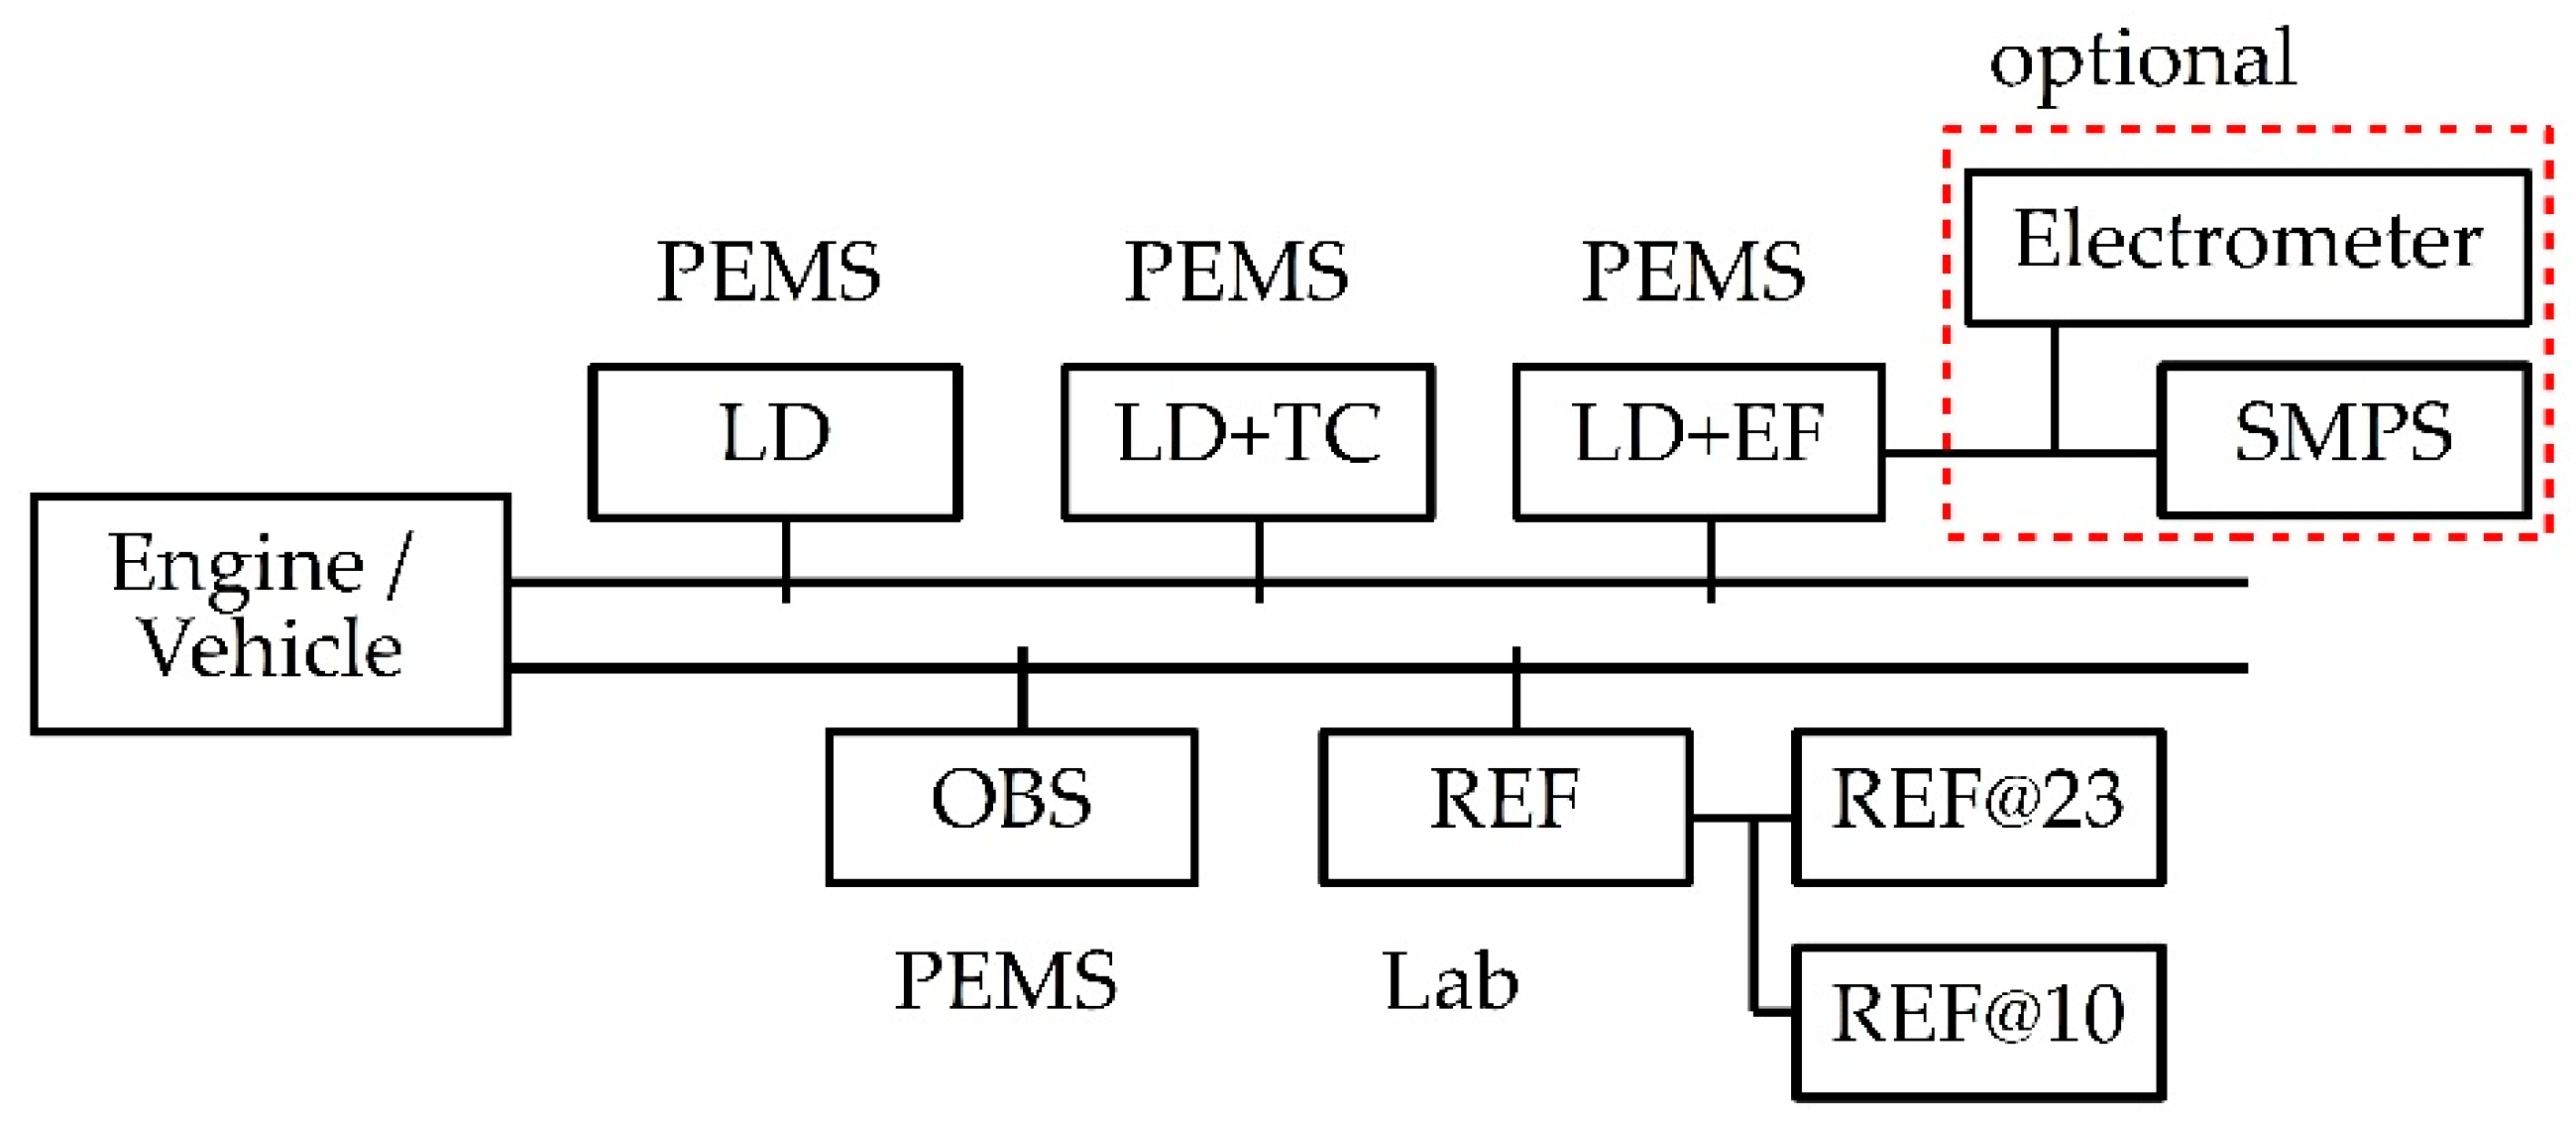
2.1. Setup and Measurement Protocol

2.1.1. Characterization of Technical Solutions

The layout of the experimental setup employed for the characterization of the two technical solutions is shown in Figure 1. Following the regulatory requirements, soot-like particles, produced by a spark graphite generator (DNP 3000 from Palas, Karlsruhe, Germany) were employed [28]. Thermal treatment was performed by passing through an AVL catalytic stripper (CS) operating at 350 °C [29]. To precisely characterize the performance of the two technical solutions it is important to produce monodisperse particles of well-defined charge state. This was achieved by means of employing two differential mobility analyzers (DMA) in tandem as described in Appendix A. Both of them were model 3081 DMAs from TSI (MN, Shoreview, MS, USA) and were equipped with a 10 mCi 85Kr neutralizer (model TSI 3077A). A third neutralizer of the same type was also employed in selected tests to neutralize particles exiting the tandem DMA setup. Number concentrations were quantified with a TSI 3775 CPC having a nominal 50% detection efficiency at 4 nm, while a TSI 3068B electrometer was used for the measurement of the total charge of the transmitted particles.
The performance of the EF is characterized by the penetration of charged particles as a function of their size. For the experimental determination of the EF penetration, singly charged, monodisperse particles were produced with the tandem DMA setup shown in Figure 1a. The particles were sampled through the EF at the nominal flow rate of the AVL sensor (2 L/min), and their concentration was measured with the TSI 3775 CPC. Since the CPC operated at a flow rate of 0.3 L/min, the excess 1.7 L/min was extracted via a mass flow controller set at 1.7 L/min. The percentage drop in the concentration resulting when switching on the EF corresponds to the fraction of single charged particles removed by the EF. Sequential measurements were performed at each size evaluated, with the EF alternatively switched on and off and the concentrations recorded for 60 s. The ratio of the average concentrations at the different states was used to calculate particle losses and therefore penetration through the EF. In the specific tests, the DMAs operated at a sheath flow of 16 L/min, leading in a sheath over sample ratio of 8:1 that is within the recommendation of greater than 7:1 for aerosol instrument calibration [30].
The main performance characteristic of a corona charger is its charging efficiency, defined as the average number of charges acquired per particle as a function of particle size. This includes also any particle losses inside the corona. Experimental quantification of the charging efficiency is typically performed by parallel measurement of the concentration of neutralized monodisperse particles entering the corona and the total charge carried by the particles exiting the corona [31]. Figure 1b shows the instrument layout employed for the characterization of the various corona chargers evaluated. The characterization was performed with both neutral, singly and doubly charged monodisperse particles. Single charged particles were produced by operating the two DMAs at the same voltage, while double charged particles were extracted by operating the first DMA at double the voltage of the second (as described in Appendix A). Neutralized particles were produced by means of passing the extracted single charged particles through a third TSI 3077A neutralizer. The concentration of the produced particles was measured with the TSI 3775 CPC, while the total charge acquired by the particles in the corona was measured with the TSI 3068B electrometer connected at the outlet of the charger. The operating flow of the electrometer (and thus the charger) was set at the default flowrate of the AVL sensor (2 L/min). The sheath flow of the two DMAs was increased to 18 L/min to maintain the sheath over sample flow ratio above the recommended 7:1. Charging efficiencies measurements were performed for the original charger of the AVL sensor operating at the default (LD) and elevated ion concentrations (employed in the device where the EF was installed) and for the novel tandem negative-positive corona charger (TC).

2.1.2. Exhaust Measurements

Figure 2 shows the layout of the instrumentation in the exhaust aerosol measurements. The measurements took place in three laboratories at approximately 23 °C: an engine dynamometer and two chassis dynamometers. In the first one, a bi-fuel HD engine (5.2 L, 154 kW, 706 Nm) was used, which was retrofitted with a diesel particulate filter (DPF) and an SCR in addition to the pre-existing diesel oxidation catalyst. The engine operated on different mixtures of diesel and compressed natural gas. In the two chassis dynamometers, the same diesel HD vehicle (13 L, 335 kW, 2200 Nm) was tested. The vehicle was equipped with diesel oxidation catalyst, DPF, SCR and ammonia slip catalyst. All tests were conducted with market fuel diesel (EN-590) with sulphur content <10 ppm. The natural gas was provided by gas cylinders of G20 (100% methane) or G25 (86% methane) quality. The lubricant was 5W-30. Urea dosing was controlled by the engine control unit.
The measurement instruments were located within 1.5 m (engine) to 4 m (vehicle) from the after-treatment devices and sampling from the tailpipe. The reference PN instruments (all from AVL) [32] in all laboratories were UNECE 49 regulation compliant systems (called REF from now on). They dilute the sample at least 10 times with hot air at 150 °C and then remove the semi-volatile particles in an evaporation tube at 350 °C. A final dilution with room temperature filtered air cools down the sample bringing it to the appropriate concentration levels for the CPC. In addition to the default reference CPC having a 50% counting efficiency at 23 nm (REF@23), a second reference one having a corresponding 50% efficiency at 10 nm (REF@10), was employed sampling in parallel.
The two technical solutions (EF and TC) were installed in two PN-PEMS compliant with the light-duty requirements (2017/1154) (called LD from now on). Note that there are no PN-PEMS technical requirements for HD applications yet. The original DC-based PN-PEMS (AVL, Graz, Austria) consists of a primary diluter using hot air at 150 °C (dilution 2:1), followed by an evaporation tube in series with a catalytic stripper (both set at 300 °C) and a secondary dilution 3:1 at 60 °C. The diluted sample is transferred to the particle detector (Naneos, Switzerland) [33] with a 1.3 m heated line at 60 °C. In the detector, particles are first charged in a positive unipolar diffusion charger and subsequently passed through a specially designed electrostatic precipitator to which a pulsating electric field is applied. The resulting modulation in the charge state of the sampled aerosol is subsequently detected in a Faraday cage electrometer [33]. The corona of the charger was set to operate at elevated ion concentrations in the EF configuration. For some tests, the particle detector was replaced with a scanning mobility particle sizer (SMPS) and an electrometer for particle charge estimation. The same PEMS units (LD, LD + EF, LD + TC) were used at all three laboratories.
A CPC-based PN-PEMS from Horiba (Kyoto, Japan) (OBS from now on) [34] was additionally used. The first diluter (10:1) of the OBS is located directly at the sample probe at the tailpipe. With a 6 m heated line at 60 °C, the diluted aerosol is brought to the main cabinet where a heated catalytic stripper at 350 °C removes the volatile and semi-volatile particles. A second dilution (10:1) brings the concentration to the measuring range of the isopropyl alcohol-based CPC with a counting efficiency of 50% at 23 nm (based on a TSI CPC 3007 with modified saturator and condenser temperatures). The system has shown very good agreement (40%) with reference systems for light-duty [35] and heavy-duty [36] applications.
On the engine dynamometer, the regulated cold (oil temperature at 23 °C) and hot (oil temperature at 90 °C) start cycles were conducted (2–3 repetitions each). These are the world harmonized transient cycle and world harmonized steady cycle. On the chassis dynamometers, the world harmonized vehicle cycle with a cold and hot start was conducted (two repetitions each). Additionally, some torque ramp tests (45% to 55% load) at constant engine speed (1100 rpm) were conducted to investigate the charge of the particles. The DPF fill state is similar in all tests.

2.2. Calculations

The particle penetration through the EF at each size was calculated by the ratio of the CPC concentrations with the EF alternatively switched on and off. The charging efficiency (η) of the TC was calculated from the CPC particle number concentration (N) and the electrometer current (I) readings through:
η = I N e Q ,
where Q is the operating flow rate of the electrometer and e is the elementary charge (1.602 × 10⁻¹⁹ C).
Some numerical calculations of diffusion charging efficiencies were also performed using the Fuchs charging model [37] as amended later [38]. The ion mobilities (1.15 cm2/Vs for positive and 1.425 cm2/Vs for negative ions) and masses (290 amu (atomic mass unit) for positive and 140 amu for negative ions) suggested by [39] were used in the calculations. Calculations were performed both for unipolar positive corona chargers as well as for a tandem negative-positive corona (TC) configuration. The initial condition was that of uncharged, singly charged and doubly charged particles. In the TC configuration the Fuchs model was applied in two steps (first for the negative corona and then for the positive one), using the output of the first stage (charge levels at different particle sizes) as the initial condition for the second stage. Calculations were performed for different products of ion concentration (Ni) times residence time (t) to fit the experimental data and investigate the effect of increasing ion concentration.
The particle concentrations of the instruments were time aligned with the exhaust flow rate (given by the engine control unit). Their product divided by the cycle work gave the emissions in #/kWh as required in the regulation. More details can be found in Reference [36]. The particle charge was estimated by the SMPS and electrometer signals as described in Reference [14].

3. Results

3.1. Characterization of Technical Solutions

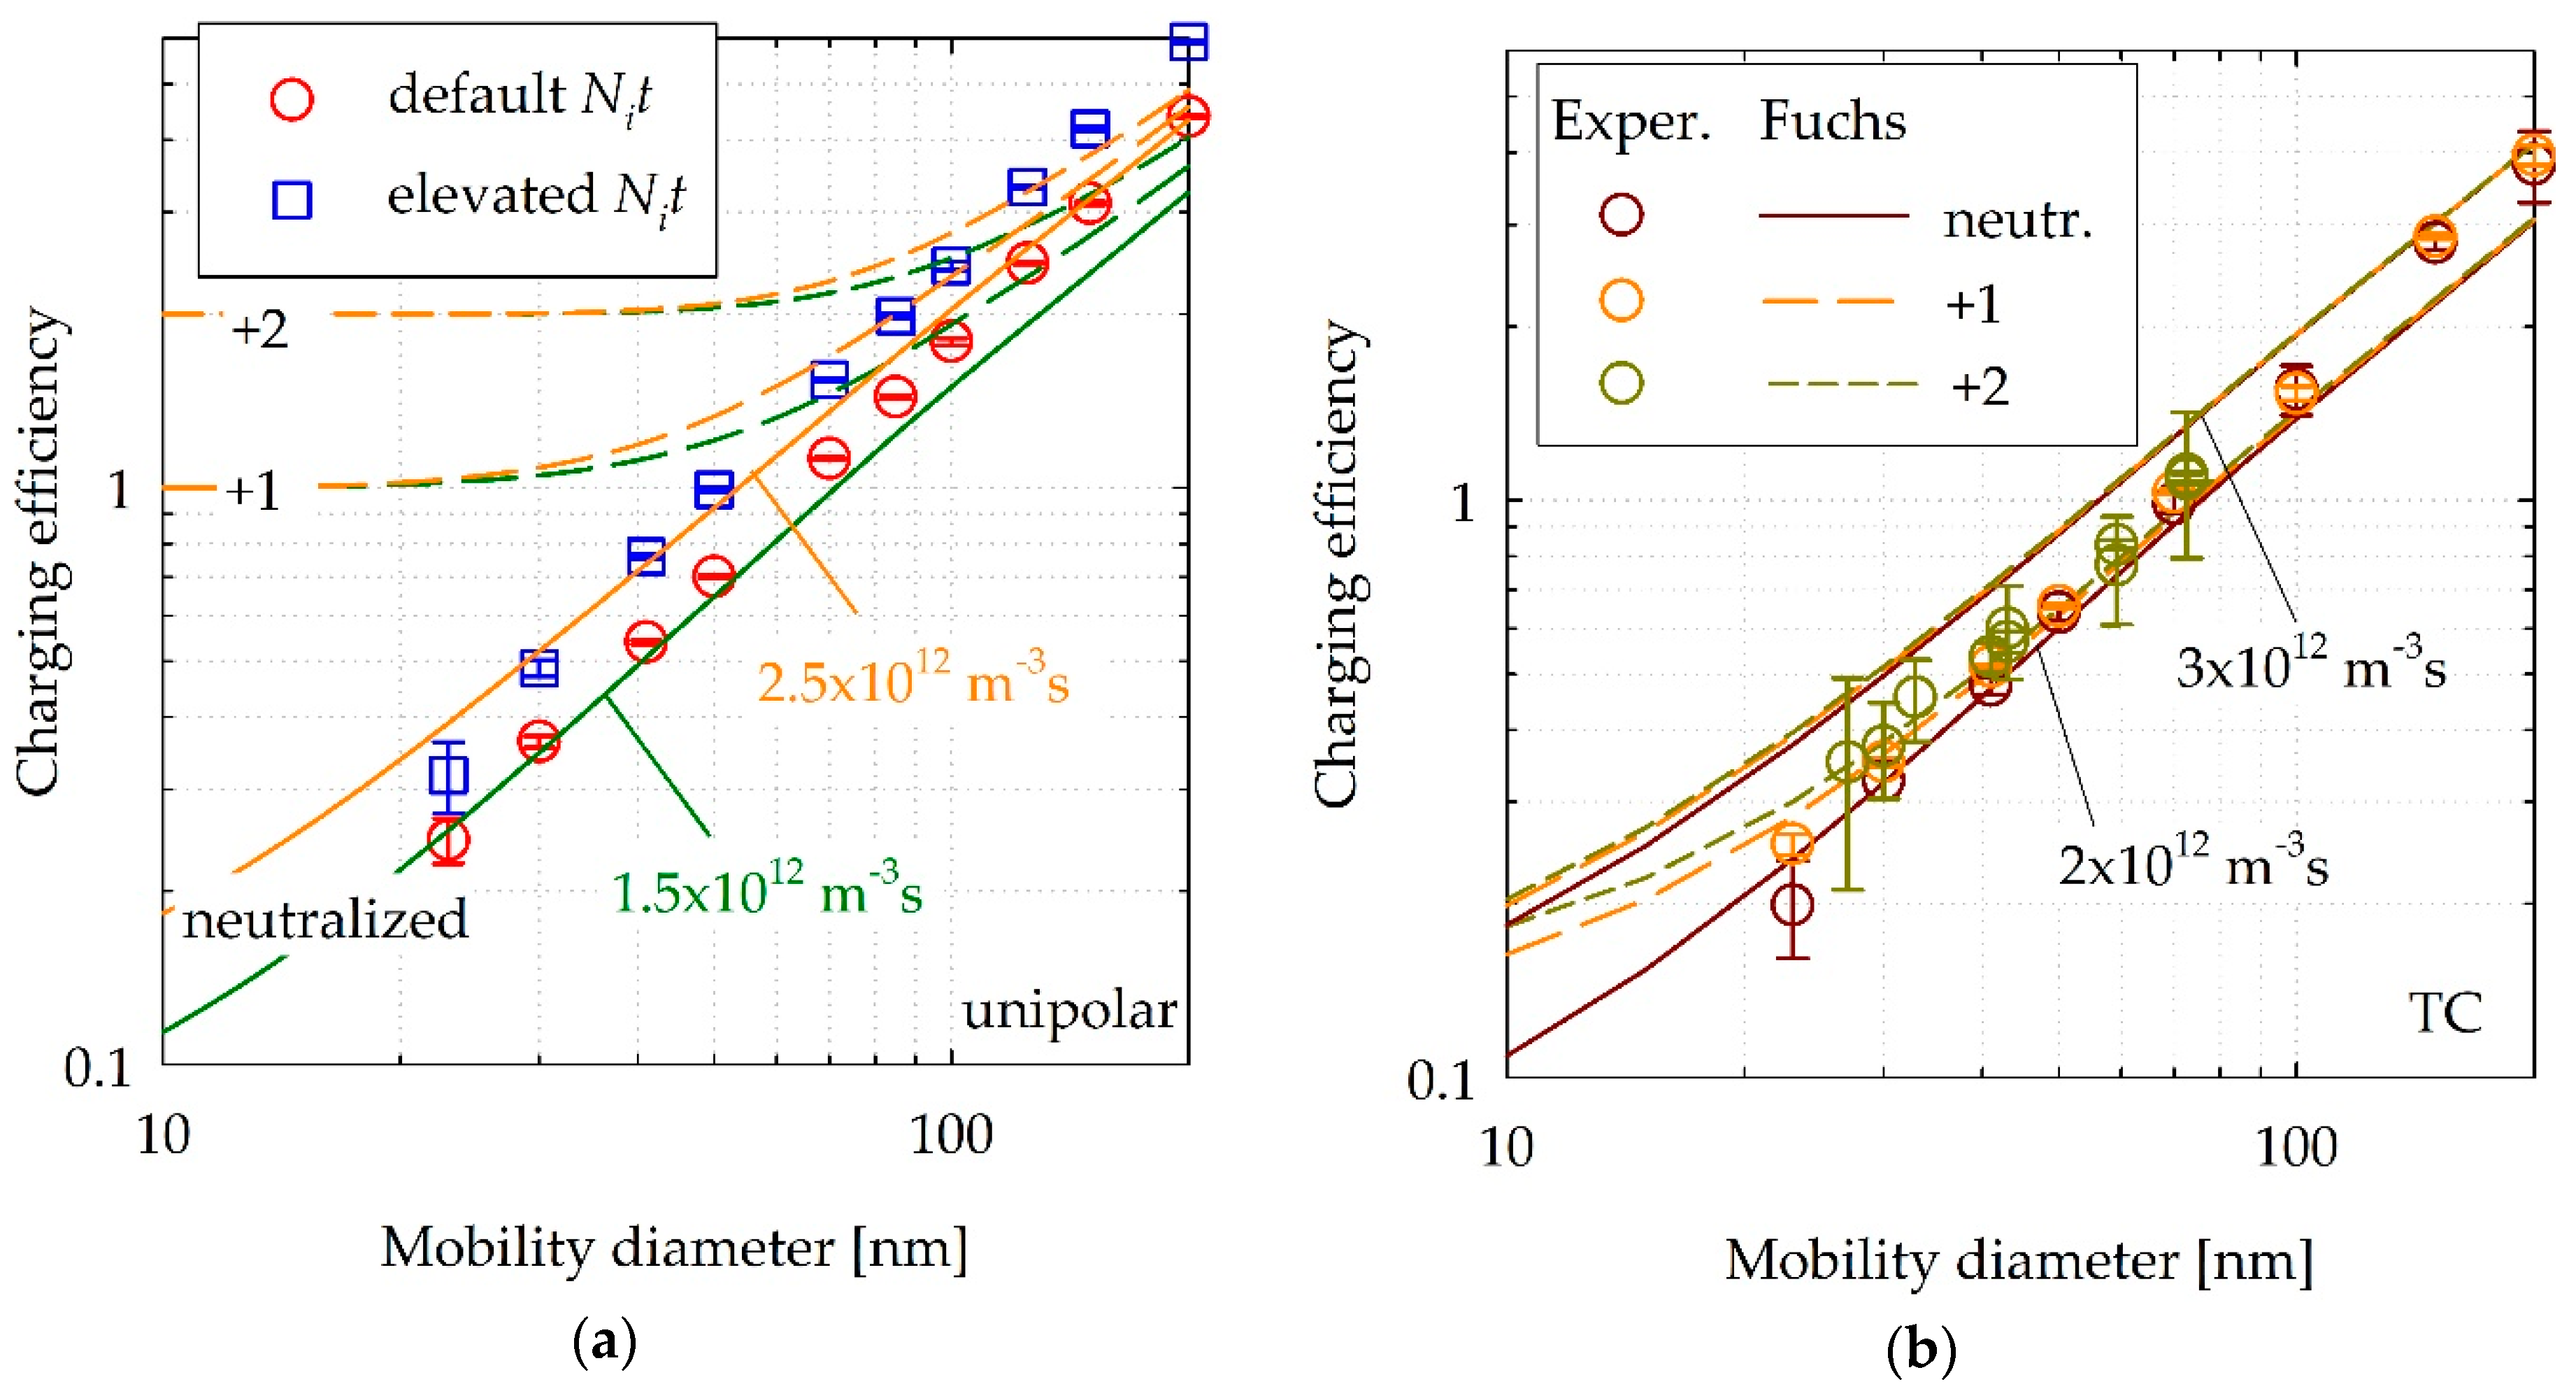
3.1.1. Unipolar Corona of Light-Duty (LD) System

The experimentally determined charging efficiencies for the unipolar corona of the AVL PN-PEMS sensor are shown with dots in Figure 3a. The charging efficiency for neutralized graphite particles exhibits a power law dependence with an exponent of 1.34 at both settings tested. In the default configuration, it ranged from 0.25 at 23 nm to 1.8 at 100 nm. The operation at the elevated Nit settings resulted in approximately 35% higher levels, spanning from 0.3 to 2.4 over the same size range. The measured slope is similar to what has been reported for other commercial unipolar corona chargers tested with soot aggregate particles (i.e., 1.41 [40] and 1.36 [21]). The absolute values were within the range values of other commercial unipolar coronas tested with soot particles (0.23 to 1.72 [21] and 0.53 to 4.23 [40] from 23 to 100 nm).
Calculations of the charge probabilities with the Fuchs model yield less steep efficiency curves with slopes of 1.15–1.19 over the size range of the experimental data (23–200 nm) (Figure 3b). This discrepancy is in line with the well-known differences in charging mechanism between spherical particles assumed in Fuchs theory and aggregate graphite particles [20]. The experimental data at the lowest size ranges, where morphology effects are not expected to be significant, suggest Nit products of 1.5 × 10¹² m−3s for the default configuration and 2.5 × 10¹² m−3s for the elevated corona settings employed in the campaign.
The Fuchs model was also employed to evaluate the performance of such a unipolar corona charger when challenged with particles carrying +1 and +2 charges (dashed lines in Figure 3a). When sampled particles are already positively charged, their charge level can only increase when entering the positive ion environment of the corona. Their charge level asymptotically approaches that of initially neutralized particles and flattens out at their original charge below a certain size. Advanced DC sensors utilize some mechanism to apply a weight on the charging efficiency and thus reduce the contribution of large sizes in the signal [8,9]. Therefore, the effect of such a distortion in the charging efficiency caused by charged nanoparticles will be further amplified in advanced DC configurations. Increasing the Nit product would be beneficial as it would bring closer the efficiency curves for neutralized and charged particles. However, there are practical limitations in increasing the ion-concentrations and thus alternative more efficient approaches are more suitable.

3.1.2. Tandem Negative Positive Corona (TC)

The experimentally determined charging efficiencies for the TC charger is shown with dots in Figure 3b. The dependence of product on mobility diameter follows a power law curve with an exponent of ~1.3. Similar exponents have been reported for unipolar corona chargers and soot particles [21,40]. The results illustrate that such a tandem configuration can substantially reduce the effect of pre-existing particle charge. Figure 3b also shows the Fuchs model computations for the TC configuration. The experimental data were found to be within the range of charging efficiencies calculated for Nit products of 2 and 3 × 10¹² m−3s. The slope of the calculated charging efficiency curves is less steep, exhibiting an exponent of ~1.05, which is close to what similar calculations for unipolar chargers predict at such Nit products [6]. The steeper curve in the experimental data is anticipated owing to the fractal-like structure of graphite particles [20]. Particle losses in the charger can also contribute to the observed differences at smaller sizes. The percentage change in the charging efficiency when the particle charge stage changes from neutral to +1 and +2 is summarized in Table 1 for both experimental data and numerical calculations and for the sizes that are currently considered in the RDE regulations (Regulation 2017/1154) [7]. The experimental results are closer to what the Fuchs model predicts for Nit products of 2 × 10¹² m−3s. The influence of pre-existing charge is, therefore, dropping from +18% at 23 nm to +5% at 50 nm for singly charged particles. Similarly, doubly charged particles result in +26% and 8% higher charging efficiencies over the same size range. The performance of this tandem corona configuration can be improved by operating the corona chargers at higher Nit products (thus increasing the ion concentrations). A 50% increase in the Nit product is calculated to lead to smaller than 5% differences in the acquired mean charge between neutral, singly and doubly charged particles of 23 nm.

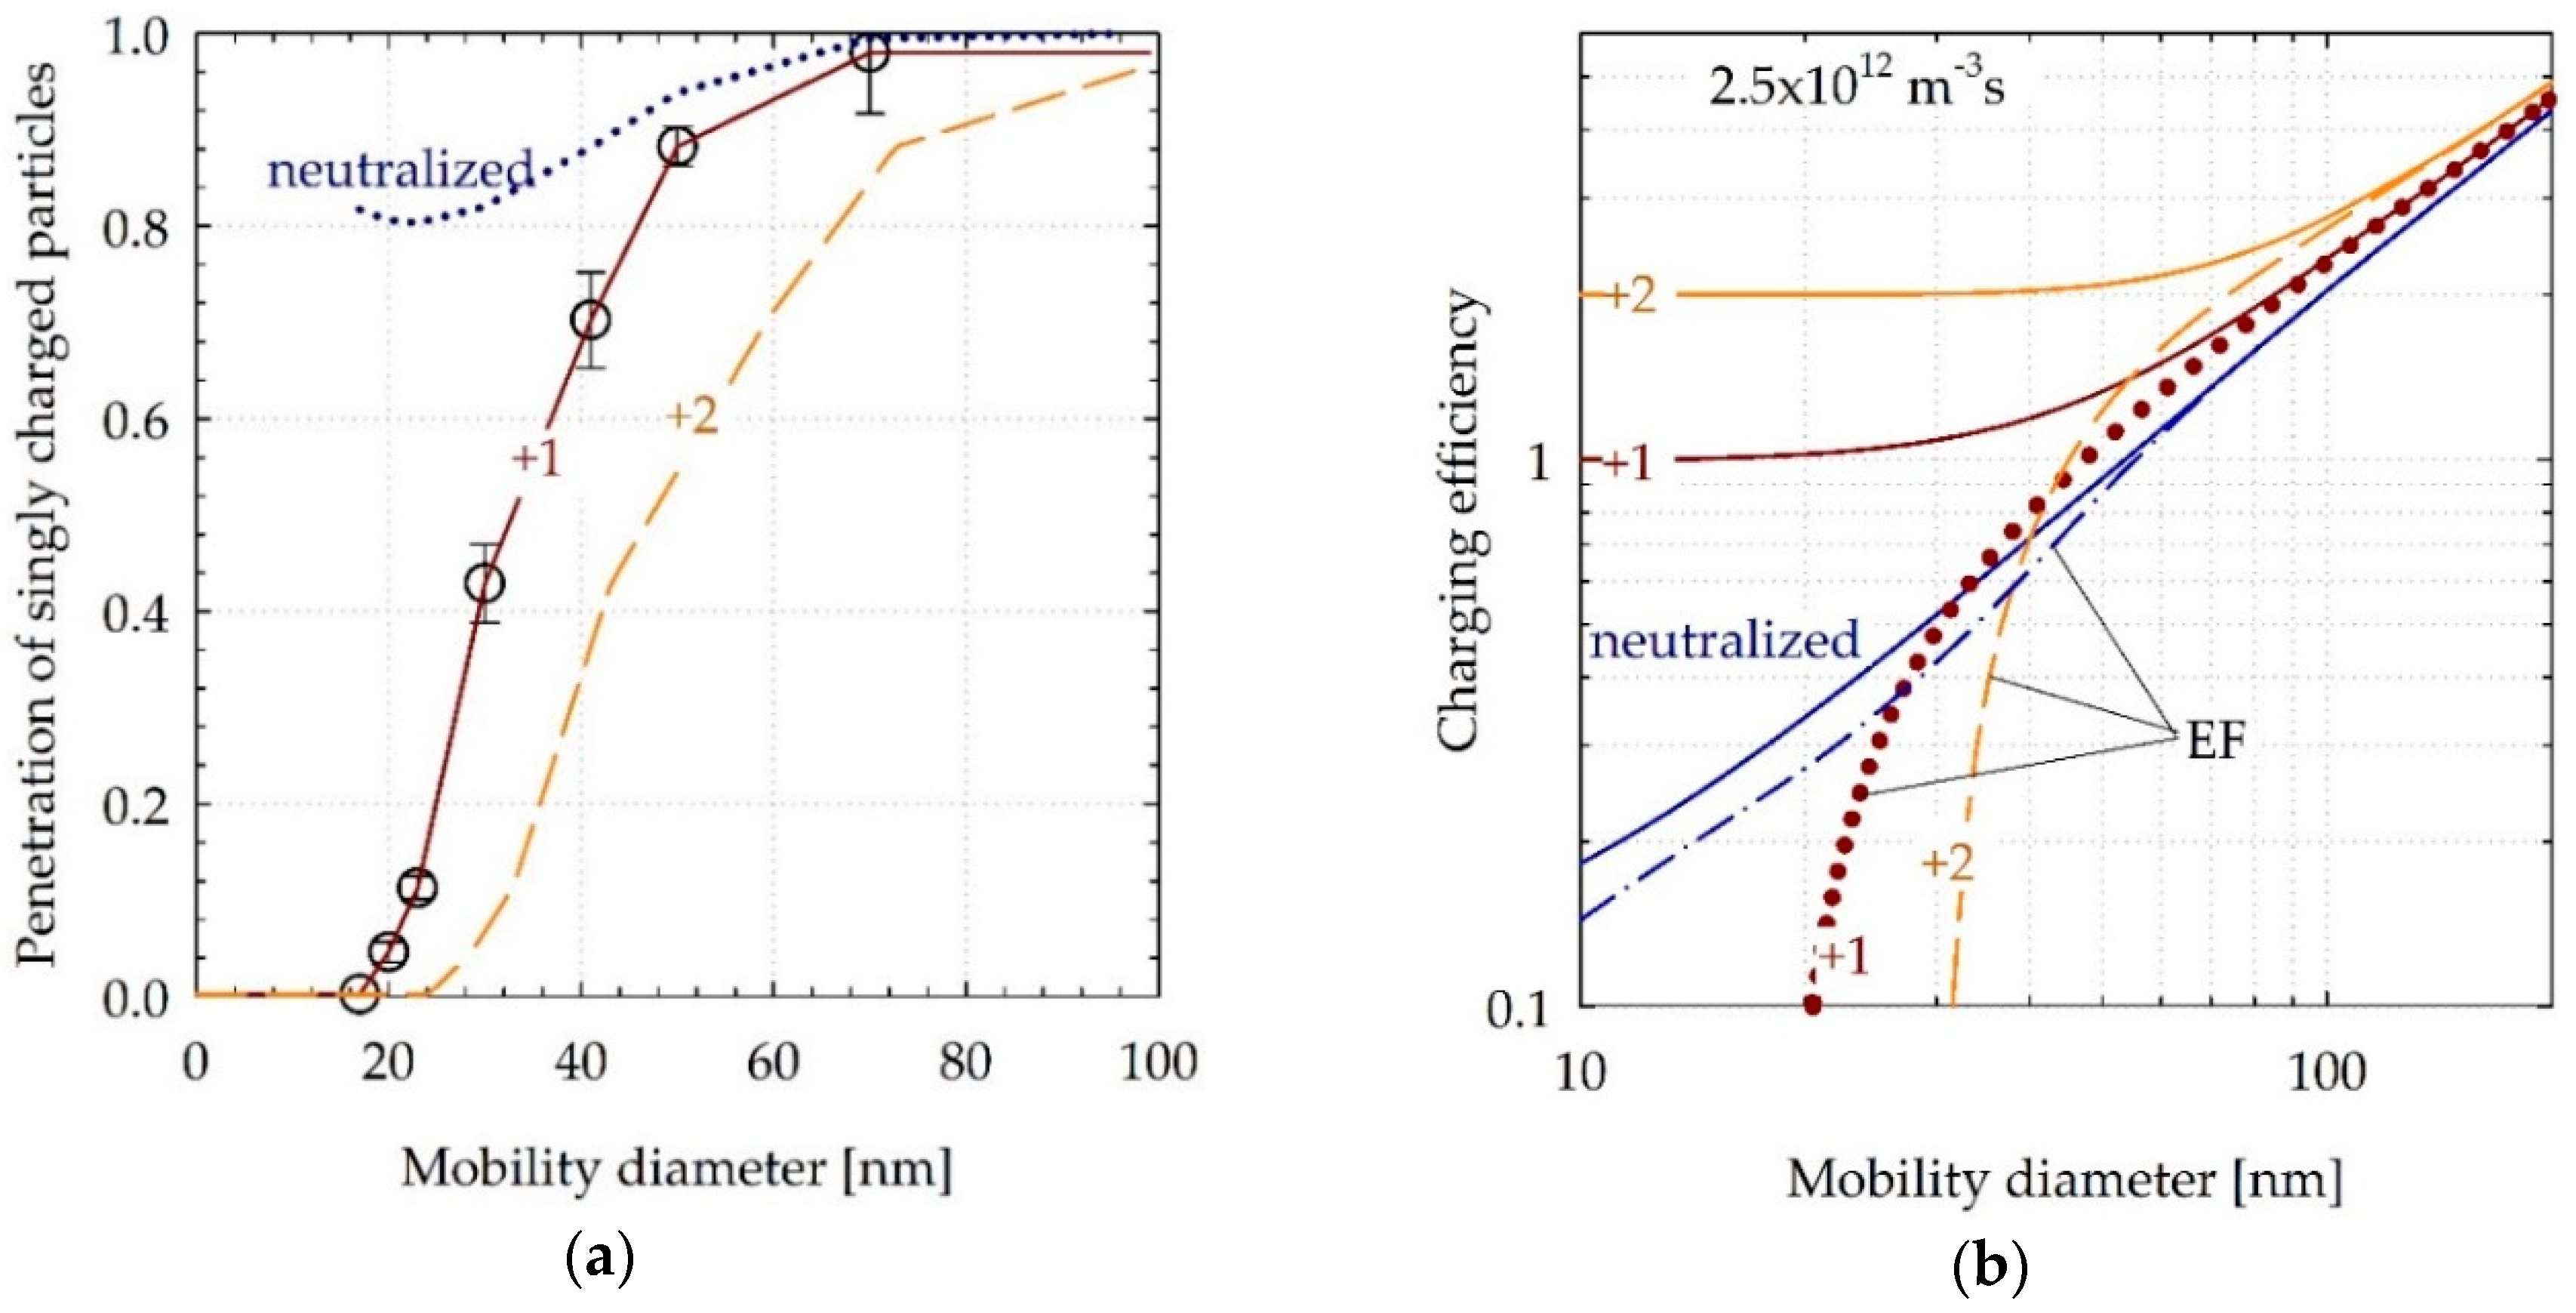
3.1.3. Electrofilter (EF)

Figure 4a summarizes the results of the EF penetration measurements. The EF removed all singly charged particles smaller than 17 nm. The penetration of singly charged 23, 30 and 50 nm particles was 11%, 42% and 88%, respectively, and reached 98% at 70 nm. Since particle collection in the EF depends on the electrical mobility, the penetration will depend on the actual charge state of the particles. Multiple charged particles will exhibit the same electrical mobility as smaller singly charged particles and therefore the penetration curve will be shifted towards larger particle sizes. The shift can be calculated from the measured penetrations for singly charged particles through [41]:
Z ( d n ) = Z ( d 1 )   d n n C c ( d n ) = d 1 C c ( d 1 ) ,
where dn is the diameter of a particle carrying n charges, having the same electrical mobility with a particle carrying one charge (having diameter d1), while Cc is the Cunningham correction factor and Z the electrical mobility. The calculated penetrations for particles carrying up to two charges are shown as dashed curves in Figure 4a.
For bipolarly charged particles being on average neutral, like typical engine exhaust [18], only the charged fractions will be affected by the EF. Accordingly, the interference of the EF with such particles will be limited since the uncharged fractions are expected to increase with decreasing size. For example, the dotted curve in Figure 4a illustrates the calculated penetration of neutralized particles based on the commonly assumed charging probability distribution of Wiedensohler [42].
To better illustrate the performance of the EF some numerical calculations were performed with the Fuchs model for the Nit product of 2.5 × 10¹² m−3s of the corona on which the EF was installed. Figure 4b illustrates the effect of the EF on the average charge exiting the corona for neutralized, singly charged and doubly charged particles. The percentage differences on the average acquired charges between singly or doubly charged and neutralized particles for this configuration are summarized in Table 2 for selected sizes. The installation of the EF will introduce a small (maximum 20%) reduction in the baseline charging efficiencies of neutralized particles at sizes below 50 nm. In the case of singly charged particles, the EF can effectively constrain the change in the average particle charge to less than ±30% over the regulated size range (>23 nm). Doubly charged particles are more efficiently removed leading to a complete removal of charges below 30 nm. Since the EF is targeting the small size range, the performance of this technical solution at large sizes can only be improved by increasing the Nit product (Figure 3a).

3.2. Exhaust Aerosol Measurements

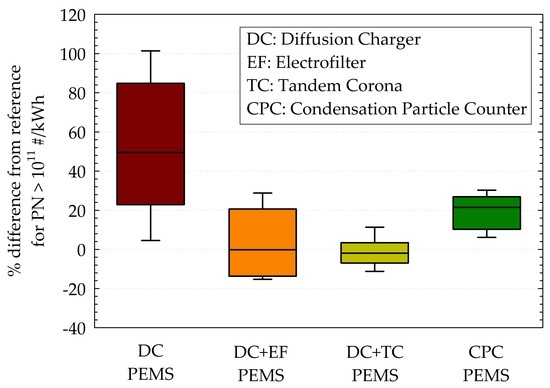
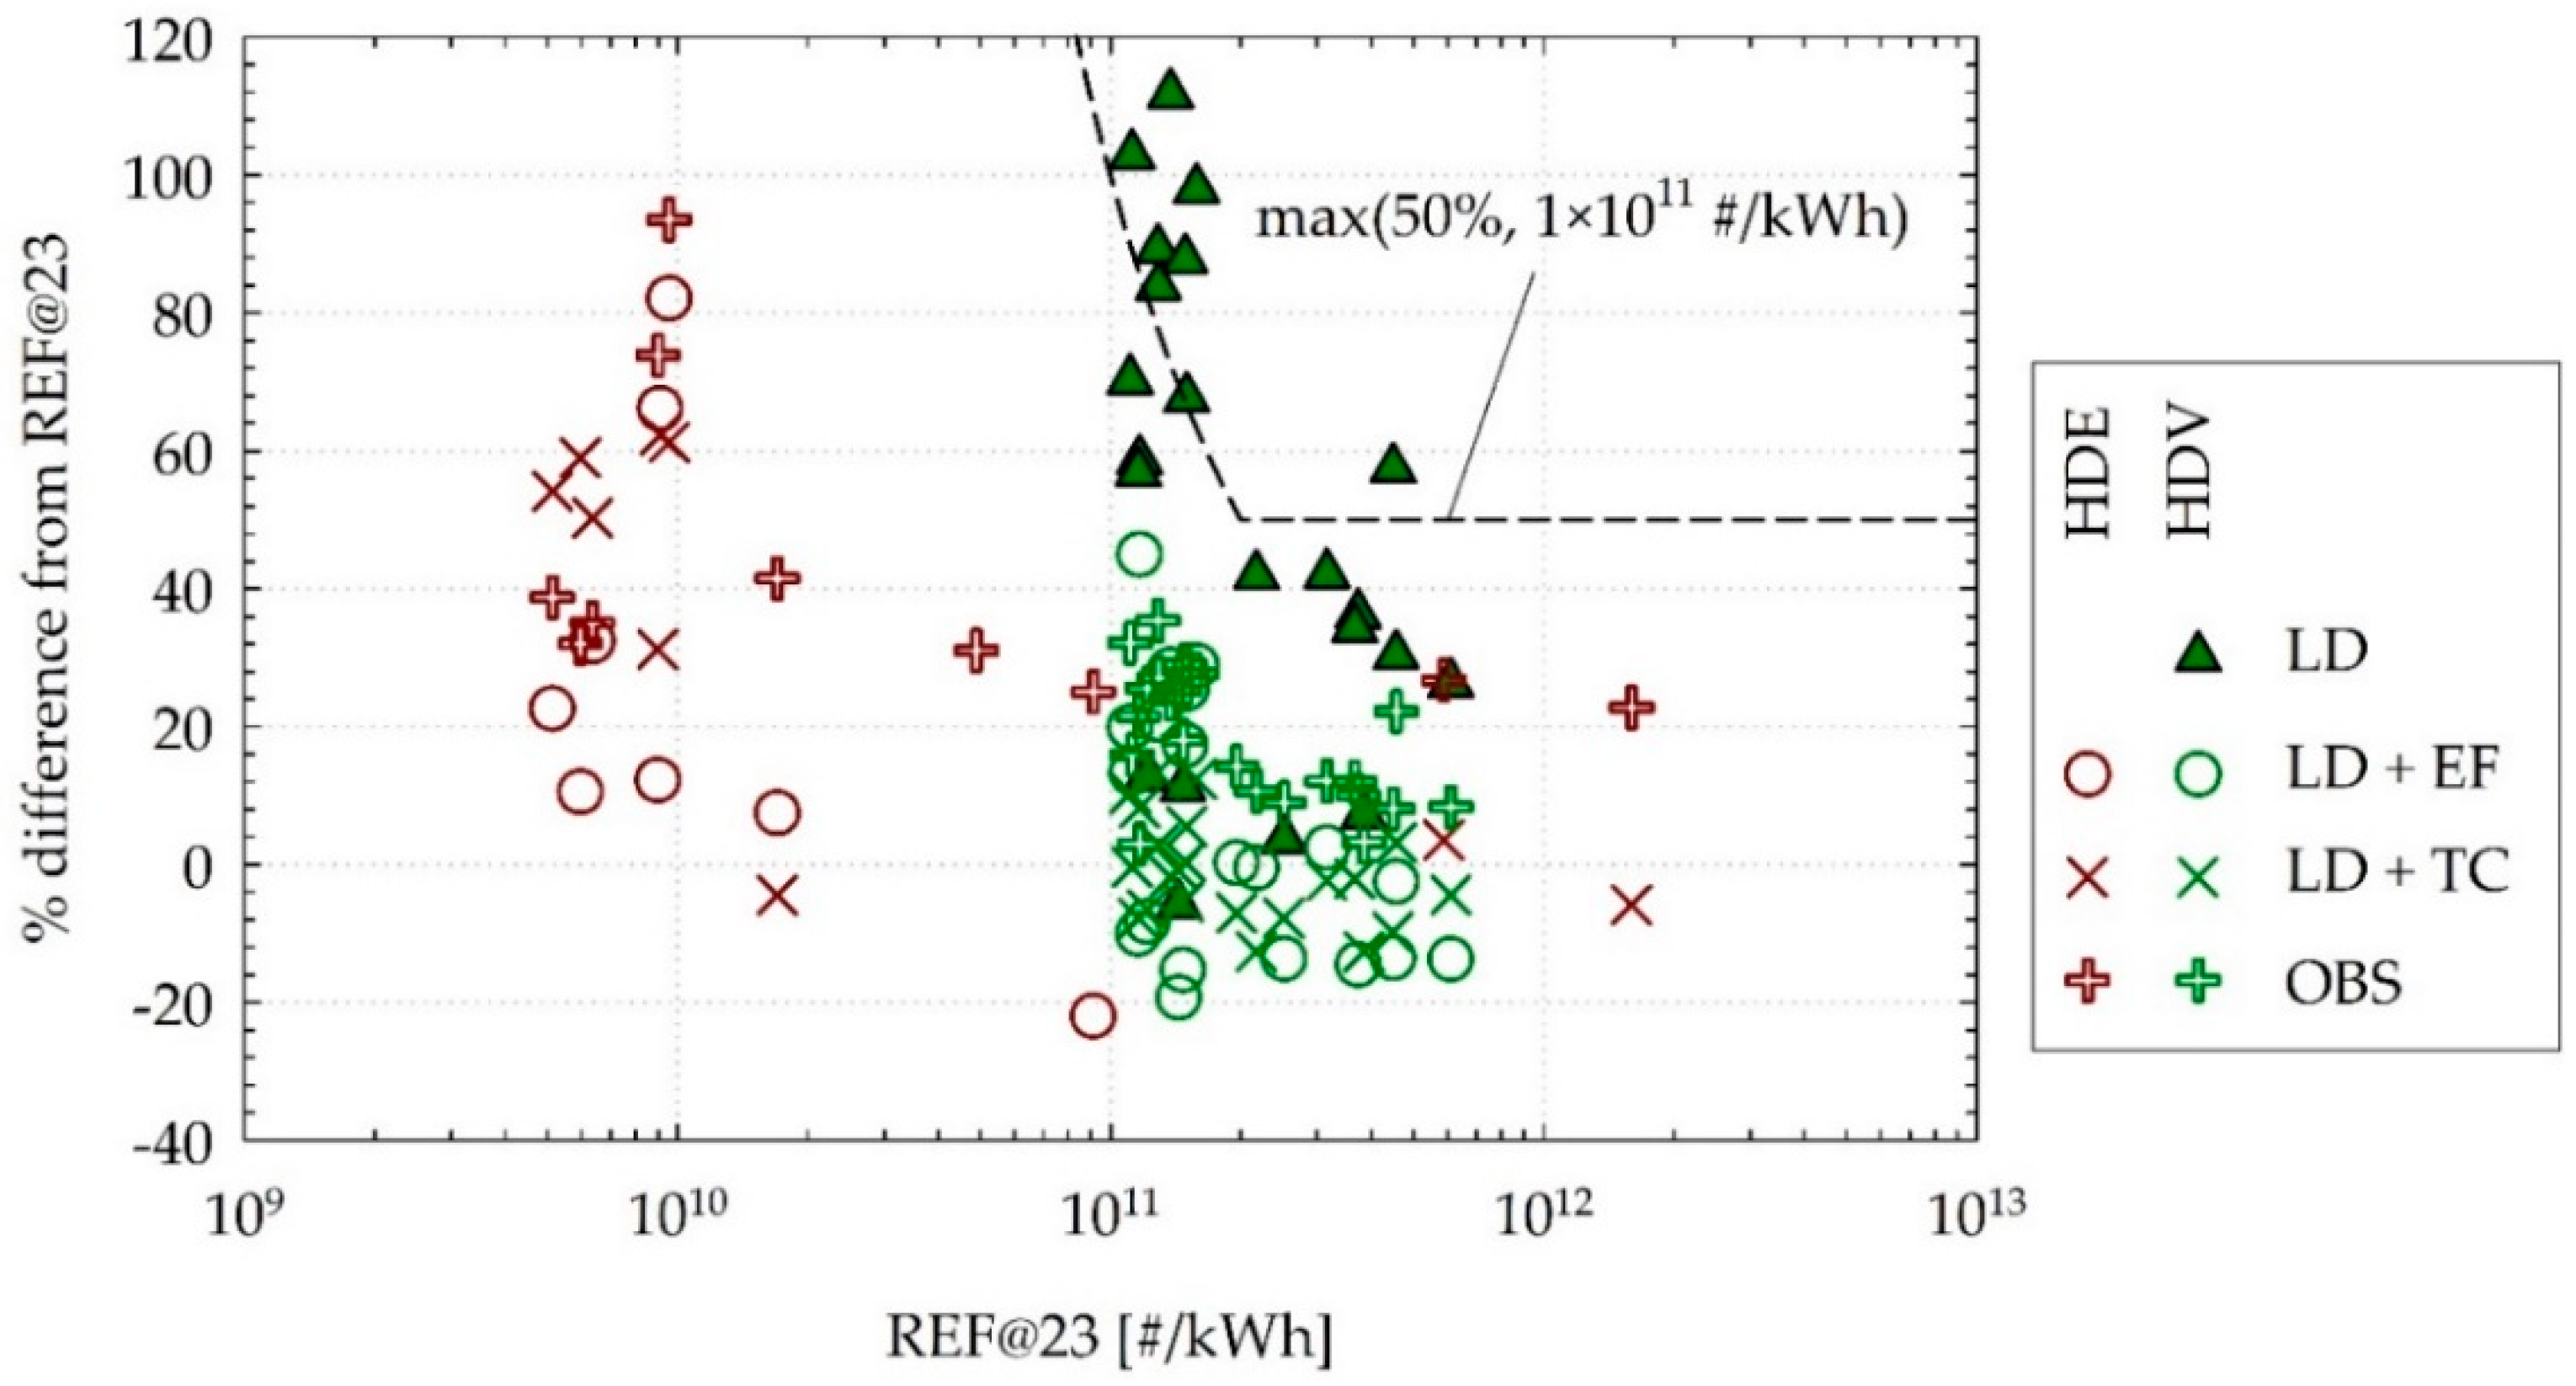
3.2.1. Cycle-Average Emissions

Figure 5 provides a summary of the relative performance of all four PN-PEMS systems (OBS, LD, LD + EF, LD + TC) in quantifying the cycle-average emission rates. The dashed line corresponds to the maximum allowed deviation of PN-PEMS instrumentation from reference PN measurements in the LD regulation (UNECE 2017/1154) [7] (50% or 1 × 10¹¹ #/kWh, whichever is greater). This curve should only serve as a guideline since (a) it applies for measurements conducted at different sampling locations and (b) it is derived from the passenger car application and thus does not consider the higher and more dynamic range of exhaust temperatures and flows at the tailpipe of their HD counterparts.
The results obtained with the DC-based instrument that did not incorporate a charge conditioning stage (LD) exhibited a much higher variability, yielding on average higher emission rates than all other PEMS instruments. The difference from the reference PN was 31% ± 17% at emissions above 2 × 10¹¹ #/kWh and 65% ± 38% at lower emission levels. Similarly to what was observed in previous campaigns [12,13], the overestimation was not systematic and in 5 out of the 22 HDV tests the instrument agreed within ±20% with both the reference PN and the remaining PEMS solutions. When a clear overestimation was observed, the effect was found to increase with decreasing emission levels, from approximately 30% at 5 × 10¹¹ #/kWh to as high as 110% at ~1 × 10¹¹ #/kWh.
The cycle average results for both technical solutions (LD + EF and LD + TC) were found to agree with the reference PN technique within ±20% at levels down to 2 × 10¹¹ #/kWh. More specifically the difference was −8% ± 7% (average ± one standard deviation) for the LD + EF and −5% ± 6% for the LD + TC. At levels below 2 × 10¹¹ #/kWh, the deviations increased to 17% ± 26% and 16% ± 25% for the LD + EF and LD + TC, respectively. The CPC-based PEMS system (OBS) exhibited similar performance with the deviation from the reference technique being 13% ± 7% and 31% ± 17% at levels above and below 2 × 10¹¹ #/kWh, respectively. The similar performance of the LD + EF and LD + TC solution to the OBS suggests that the observed overestimation with the LD is indeed associated with the presence of charged particles.

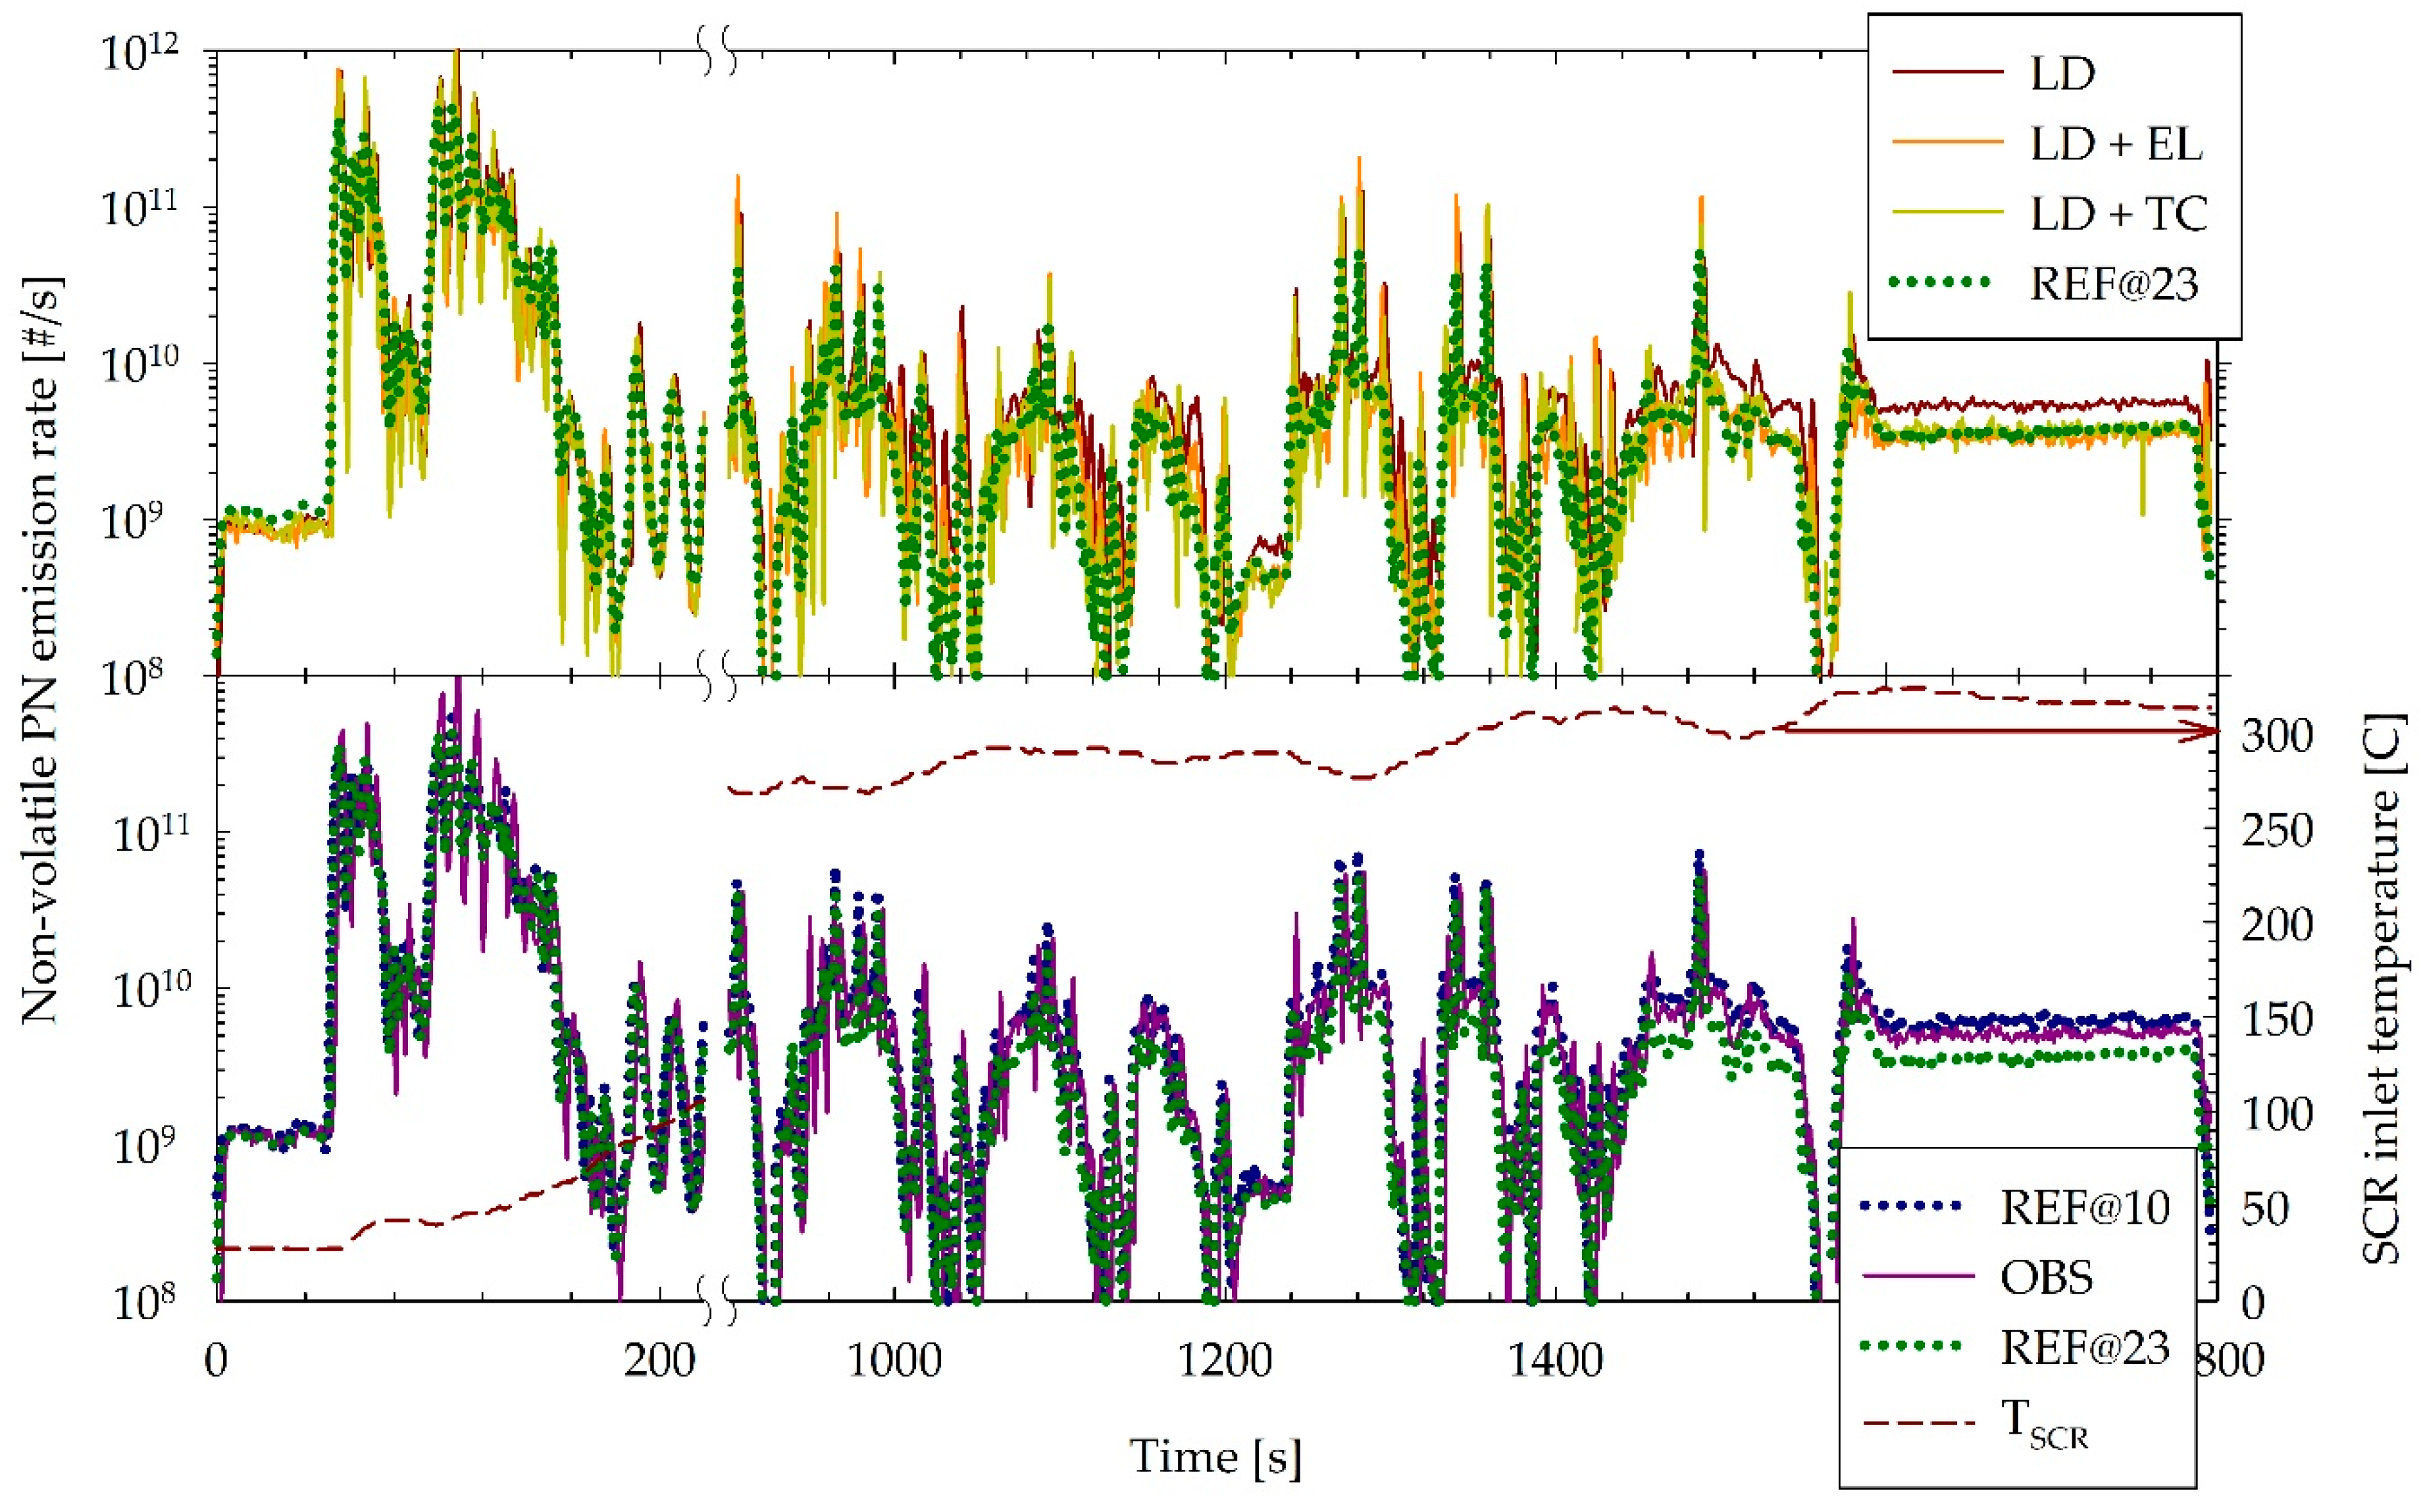
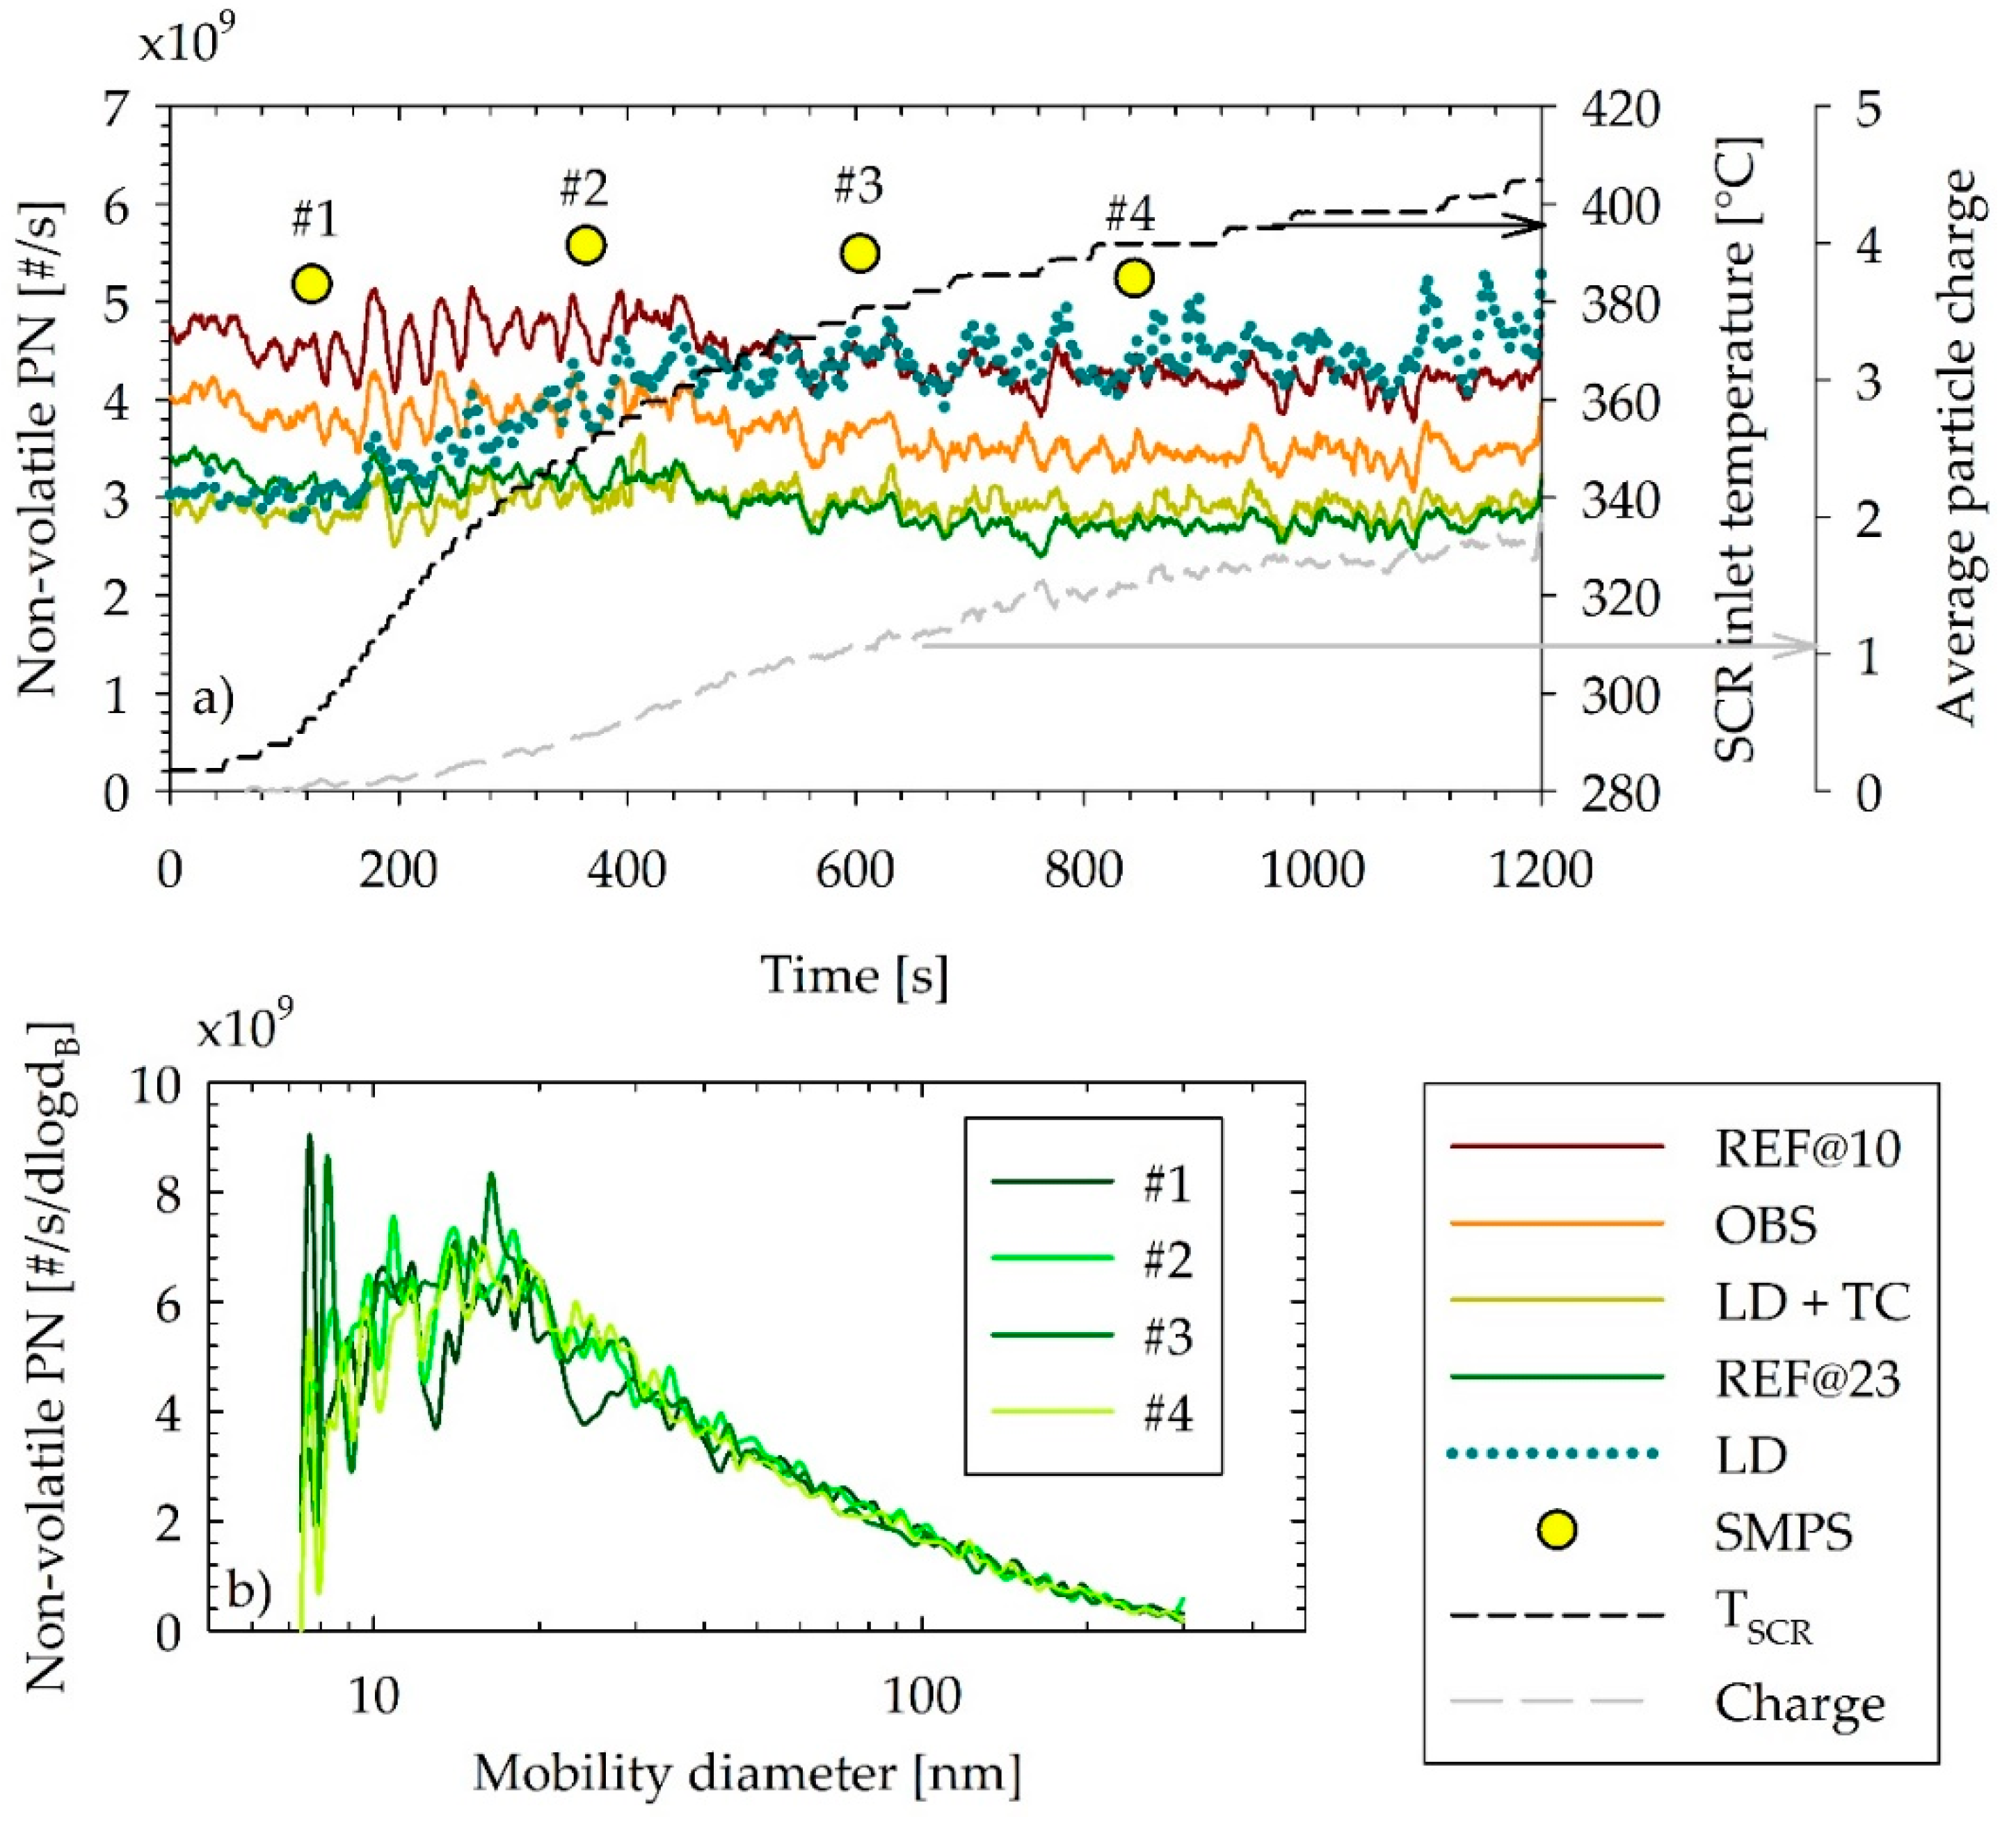
3.2.2. Real-Time Emission Traces

Figure 6 shows example real-time traces of non-volatile PN of the HD vehicle over a cold start WHVC test performed. Over the first 200 s of the cycle, the inlet SCR temperature (dashed dark-red curve) was below the operating range of the SCR and no urea was injected. The emission levels were also elevated as is typically the case during cold start operation of vehicles equipped with wall-flow particulate filter [36]. All PEMS instruments agreed to within ~25% with the reference PN methodology (REF@23) over this period. Similarly, the 10 nm CPC (REF@10) installed on the reference system measured only 5% higher concentrations than the REF@23, suggesting that the mode of the emitted particles lies well above the regulated size limit.
After approximately 1000 s, the LD PN-PEMS started progressively measuring higher concentrations than the reference PN, yielding on average 65% higher concentrations over the last 800 s of the cycle. Urea injection was already activated and the exhaust temperature at the inlet of the SCR ranged between 290 to 320 °C. The excess particle counts registered with the 10 nm CPC compared to the 23 nm one of the reference PN system increased also to 60% over this section, suggesting that the size of the distribution has shifted to lower particle sizes. Despite these changes in the exhaust aerosol, the agreement between the two technical solutions and the reference PN (REF@23) remained within 25% (23% for LD + EF and 12% for LD + TC). The performance of the CPC based PEMS system (OBS) was also affected by the presence of such small particles, yielding on average a 35% difference from the REF@23 concentrations.
Figure 7 summarizes the results obtained over a segment of a torque-ramp test (1000 rpm/55% load) of the HD vehicle. The concentrations measured with the reference PN system with both the 23 and 10 nm CPC remained relatively stable (±10%). The 10 nm CPC (REF@10) measured on average ~50% higher concentrations than the 23 nm one (REF@23) (Figure 7a). The SMPS measurements (Figure 7b) revealed a stable size distribution peaking at ~15 nm, which explains the higher particle counts registered by the 10 nm CPC. The LD + TC and OBS systems exhibited a constant difference from the reference PN, of <5% and 25%, respectively. The LD system agreed to within 5% with the reference PN over the first 200 s of the test, but then gradually started measuring higher concentrations with the difference reaching 70% over the last 100 s of the test. This gradual deterioration of the LD performance coincided with an increase in the inlet SCR temperature from ~300 °C to 400 °C and an accompanying increase of the average exhaust aerosol charge from ~0 to as high as 1.9 charges/particle.

4. Discussion

Several studies have reported that urea injection in HD engine SCR systems leads to non-volatile particle formation [14,16,43]. These particles exhibit a mode that peaks below 20 nm and accordingly they are only partially detected by the regulated PN methodology which requires a 50% counting efficiency at 23 nm. It was also recently found that these particles can acquire a large positive charge at elevated exhaust temperatures that can increase the average exhaust aerosol charge to as high as +3 depending on the background (bipolarly charged) soot concentrations [14].
The presence of positive charges on particles in the nucleation mode range (<30 nm) can pose challenges for corona-charger-based sensors. They typically employ positive coronas that are more stable in their control and produce less ozone [41]. At typical corona settings, the average charge acquired on initially uncharged particles is less than +1 at sizes below 50 nm. When positively charged particles at this size range enter the positive ion environment of the corona, their charge level can only increase (although in practice the change in the charge level will be minor owing to the repulsive electric field of these positively charged nanoparticles). Accordingly, in the presence of such particles, the actual charge level of the aerosol exiting the corona will be higher than anticipated for neutral particles, as will be the measured signal and therefore the reported concentrations [24]. Such effects explain the overestimations observed in experimental evaluations of DC-based PEMS instrumentation with SCR equipped HD engines [12].
Since a large fraction of the formed particles lies below the 23 nm detection threshold of the regulation, one straightforward solution would be to remove all charged particles below this size via an electrofilter. A more advanced solution is to expose the pre-charged aerosol in a bipolar ion environment produced by a combination of a negative and a positive corona charger. Both technical solutions were realized and incorporated in the corona charger section of AVL’s PN-PEMS system (LD). Dedicated exhaust measurements with an SCR-equipped HD engine and an SCR equipped vehicle confirmed that the overestimation observed with the original PEMS (LD) was associated with the formation of positively charged nanoparticles in the SCR. Both technical solutions were found to efficiently address interferences from such particles, leading to deviations of less than ±30% from the reference technique at levels above 1 × 10¹¹ #/kWh. Over the same tests, the default (LD) system showed much higher differences which increased with decreasing concentrations, reaching up to 120% at emission levels of 1 × 10¹¹ #/kWh. The dependence of the overestimation on the cycle emission levels reflects the relative contribution of neutral soot particles on the tailpipe aerosol. Cold start operation and the fill state of the diesel particulate filter (DPF) will have a strong effect on the concentration of engine exhaust particles reaching the tailpipe [36]. On the other hand, the concentration of particles forming on the SCR was found to be relatively stable while charge builds up only at elevated exhaust temperatures (above ~300 °C) [14]. Furthermore, the exact after-treatment configuration can have a strong effect. The size of the particles forming in the SCR is ideal for filtration on DPFs. Accordingly, combined SCR/DPF systems or after-treatment configurations employing the SCR upstream of the DPF will efficiently capture these particles [44].
The size of the particles formed in the SCR poses an additional challenge in their measurements. The current PN methodology was not designed for such small particles. The regulatory specifications imply that both the detector efficiency curve and the particle penetrations through the sampling system exhibit a sharp drop below 30 nm. Accordingly, differences in the designs of various commercial implementations fully compliant with the regulation specifications can lead to large differences. This was, for example, evident in the CPC-based PEMS system tested, which was found to overestimate particle concentrations compared to the reference system in the presence of these particles by up to ~30%, depending on the underlying soot concentration.
In the context of the current regulation, the contribution of these nanoparticles formed in the SCR was calculated to be a fraction (at maximum 20–30% [14]) of the currently applicable limit (6 × 10¹¹ #/kWh). These levels should not pose a challenge in the implementation of a PN-PEMS regulation provided that some means of conditioning the electrical charge is implemented. Both technical solutions considered in the present study were proven to be very efficient in this respect.

5. Conclusions

We measured the particle number emissions of a heavy-duty engine and a heavy-duty vehicle with reference instruments and portable systems based on condensation particle counters and diffusion chargers. Urea injection in the after-treatment of late heavy-duty technology engines was found to produce highly charged nanosized particles, smaller than the 23 nm cut-off size in the current regulation. Such positively charged nanoparticles were shown to interfere with corona chargers of diffusion charging-based particle number portable instrumentation leading to overestimations. Two technical solutions were presented and were shown to successfully mitigate the effect of these pre-existing charges on the performance of a commercial diffusion charging-based portable system. The first one was an electrofilter and the second a tandem positive-negative corona charger.

Author Contributions

Conceptualization, A.M., M.F.; methodology, M.S.; formal analysis, M.S., A.M.; writing—original draft preparation, M.S., A.M.; writing—review and editing, B.G., M.F.; supervision, A.M., B.G.

Funding

This research received no external funding.

Acknowledgments

B.G. would like to thank Massimo Carriero and Francois Montigny for the engine dynamometer tests and Andrea Bonamin, Mauro Cadario, Giancarlo Peruccio, and Alessandro Zappia for the chassis dynamometer tests.

Conflicts of Interest

A.M. is employed by AVL Lish GmbH and M.F. is the CEO of Naneos GmbH which is the supplier of the DC-based sensor for the AVL PN-PEMS. The technical solutions developed and evaluated in this study served as prototypes for the development of the commercial technical solution by AVL.

Disclaimer

The opinions expressed in this manuscript are those of the authors and should in no way be considered to represent an official opinion of the European Commission. Mention of trade names or commercial products does not constitute endorsement or recommendation by the authors.

Appendix A

The DMA is a well-established technique employed for particle size classification [45]. Particles are first brought to a controlled charge state in a neutralizer (radioactive source) and subsequently classified according to their electrical mobility. Accordingly, in addition to singly charged particles of the desired particle size, larger multiple charged particles of the same electrical mobility will also be transmitted [46]. If the transmitted particles are neutralized once more and fed to a second DMA, they will be segregated according to their size and charge.
For example, Figure A1 illustrates experimentally determined modes at the outlet of two DMAs connected in series. The first DMA was set to classify particles of 150 nm, while the second operated in scanning mode [47]. The recovered distributions obtained with the commercial AIM software from TSI were purposely not corrected for multiple charges. That is the signal was inverted assuming that all particles exiting the second DMA are singly charged, in order to illustrate the entire mobility spectrum exiting the second DMA of a tandem setup. The two DMAs operated at sheath and sample flows of 3 and 0.3 L/min, respectively. The second DMA operated at a voltage ramp of 300 s.
Figure A1. Example tandem DMA size scan. First DMA was set to classify particles of 150 nm, and second DMA operated in scanning mode (300 s scan time). Concentrations were measured with a TSI 3775 CPC operating at full flow mode (0.3 L/min). Both DMAs operated at sheath and sample flow rates of 3 and 0.3, respectively.
Applsci 09 01051 g0a1
The largest peak (d) in the recovered distribution practically corresponds to singly charged particles at the set size of the first DMA. However, the peaks at smaller size bins (a–c) also correspond to 150 nm particles. All 150 nm particles exiting the first DMA carried a single positive charge, but after being neutralized once more, their charge state was redistributed. When passing through the second DMA, the single charged fraction was classified at the anticipated size bin, but the multiple charged fractions exhibited higher electrical mobility and thus were classified at smaller size bins. In fact, the area of these peaks is proportional to the fraction of single, double, triple and quadruple charged 150 nm particles exiting the second neutralizer [48].
On the other hand, the peaks at larger size bins (e and f) correspond to larger particles that were classified in the first DMA because they were initially carrying multiple charges (+2 and +3 for 235 and 312 nm, respectively). After passing the neutralizer of the second DMA, their charge level was redistributed. The single charge fraction had lower electrical mobility than singly charged 150 nm particles and was therefore classified at larger size bins. Double charged 235 nm particles and triply charged 312 nm particles were classified at the same bin as single charged 150 nm particles, so in principle, these cannot be discriminated. Therefore, some multiply charged fractions will still be present at 150 nm in this tandem DMA configuration. However, the two-stage neutralization and classifications are guaranteed to reduce the multiple charge fraction interference compared to a single DMA approach.
In the present work, the two DMAs were set at fixed voltages. When both were set at the same voltage, (predominantly) single charged particles of the desired size are classified (i.e., peak d in Figure A1). Selected tests were also performed with the second DMA set at double the voltage of the first one, thus transmitting double charged particles of the size selected in the first DMA (i.e., peak c in Figure A1).

References

  1. European Environmental Agency. Air Quality in Europe 2018; EEA Report, No. 123/2018; Publications Office of the European Union: Luxembourg, 2018. [Google Scholar]
  2. Health Effects Institute. State of Global Air 2018: A Special Report on Global Exposure to Air Pollution and Its Disease Burden; HEI: Boston, MA, USA, 2018. [Google Scholar]
  3. Giechaskiel, B.; Mamakos, A.; Andersson, J.; Dilara, P.; Martini, G.; Schindler, W.; Bergmann, A. Measurement of automotive nonvolatile particle number emissions within the European legislative framework: A review. Aerosol Sci. Technol. 2012, 46, 719–749. [Google Scholar] [CrossRef]
  4. Giechaskiel, B.; Lähde, T.; Suarez-Bertoa, R.; Clairotte, M.; Grigoratos, T.; Zardini, A.; Perujo, A.; Martini, G. Particle number measurements in the European legislation and future JRC activities. Combust. Eng. 2018, 174, 3–16. [Google Scholar]
  5. Giechaskiel, B.; Bergmann, A. Validation of 14 used, re-calibrated and new TSI 3790 condensation particle counters according to the UN-ECE Regulation 83. J. Aerosol Sci. 2011, 42, 195–203. [Google Scholar] [CrossRef]
  6. Dhaniyala, S.; Fierz, M.; Keskinen, J.; Marjamäki, M. Instruments based on electrical detection of aerosols. In Aerosol Measurement: Principles, Techniques, and Applications, 3rd ed.; Kulkarni, P., Baron, P., Willeke, K., Eds.; John Wiley & Sons, Inc.: New York, NY, USA, 2011. [Google Scholar]
  7. Commission Regulation (EU). Commission Regulation (EU) 2017/1154 of 7 June 2017 amending Regulation (EU) 2017/1151 supplementing Regulation (EC) No 715/2007 of the European Parliament and of the Council on type-approval of motor vehicles with respect to emissions from light passenger and commercial vehicles (Euro 5 and Euro 6) and on access to vehicle repair and maintenance information, amending Directive 2007/46/EC of the European Parliament and of the Council, Commission Regulation (EC) No 692/2008 and Commission Regulation (EU) No 1230/2012 and repealing Regulation (EC) No 692/2008 and Directive 2007/46/EC of the European Parliament and of the Council as regards real-driving emissions from light passenger and commercial vehicles (Euro 6). Off. J. Eur. Un. 2017, L175, 708–732. [Google Scholar]
  8. Schriefl, M.; Bergmann, A.; Fierz, M. Design principles for sensing particle number concentration and mean particle size with unipolar diffusion charging. IEEE Sens. J. 2019, 19, 1392–1399. [Google Scholar] [CrossRef]
  9. Fierz, M.; Houle, C.; Steigmeier, P.; Burtscher, H. Design, calibration, and field performance of a miniature diffusion size classifier. Aerosol Sci. Technol. 2011, 45, 1–10. [Google Scholar] [CrossRef]
  10. Giechaskiel, B.; Riccobono, F.; Bonnel, P. Feasibility Study on the Extension of the Real Driving Emissions (RDE) Procedure to Particle Number (PN): Chassis Dynamometer Evaluation of Portable Emission Measurement Systems (PEMS) to Measure Particle Number (PN) Concentration: Phase II; Ispra: EU Report 27451; Publications Office of the European Union: Luxembourg, 2015. [Google Scholar]
  11. Giechaskiel, B.; Maricq, M.; Ntziachristos, L.; Dardiotis, C.; Wang, X.; Axmann, H.; Bergmann, A.; Schindler, W. Review of motor vehicle particulate emissions sampling and measurement: From smoke and filter mass to particle number. Aerosol Sci. Technol. 2014, 67, 48–86. [Google Scholar] [CrossRef]
  12. Schwelberger, M.; Giechaskiel, B. Evaluation of Portable Number Emission Systems for Heavy-Duty Applications under Steady State and Transient Vehicle Operation conditions on a Chassis Dynamometer; SAE Technical Paper, 2018-01-0348; Society of Automotive Engineers, Inc.: Detroit, MI, USA, 2018. [Google Scholar]
  13. Giechaskiel, B.; Schwelberger, M.; Delacroix, C.; Marchetti, M.; Feijen, M.; Prieger, K.; Andersson, S.; Karlsson, H. Experimental assessment of solid particle number portable emissions measurement systems (PEMS) for heavy-duty vehicles applications. J. Aerosol Sci. 2018, 123, 161–170. [Google Scholar] [CrossRef]
  14. Mamakos, A.; Schwelberger, M.; Fierz, M.; Giechaskiel, B. Effect of selective catalytic reduction on exhaust non-volatile particle emissions of Euro VI heavy-duty compression ignition vehicles. Aerosol Sci. Technol. 2019, in press. [Google Scholar]
  15. Schaber, P.M.; Colson, J.; Higgins, S.; Thielen, D.; Anspach, B.; Brauer, J. Thermal decomposition (pyrolysis) of urea in an open reaction vessel. Thermochim. Acta 2004, 424, 131–142. [Google Scholar] [CrossRef]
  16. Amanatidis, A.; Ntziachristos, L.; Giechaskiel, B.; Bergmann, A.; Samaras, Z. Impact of selective catalytic reduction on exhaust particle formation over excess ammonia events. Environ. Sci. Technol. 2014, 48, 11527–11534. [Google Scholar] [CrossRef] [PubMed]
  17. Kittelson, D. Engines and nanoparticles: A review. J. Aerosol Sci. 1998, 29, 575–588. [Google Scholar] [CrossRef]
  18. Maricq, M. On the electrical charge of motor vehicle exhaust particles. J. Aerosol Sci. 2006, 37, 858–874. [Google Scholar] [CrossRef]
  19. Biskos, G.; Mastorakos, E.; Collings, N. Monte-Carlo simulation of unipolar diffusion charging for spherical and non-spherical particles. J. Aerosol Sci. 2004, 35, 707–730. [Google Scholar] [CrossRef]
  20. Rogak, S.; Flagan, R. Bipolar diffusion charging of spheres and agglomerate aerosol particles. J. Aerosol Sci. 1992, 23, 693–710. [Google Scholar] [CrossRef]
  21. Jung, H.; Kittelson, D. Characterization of aerosol surface instruments in transition regime. Aerosol Sci. Technol. 2005, 39, 902–911. [Google Scholar] [CrossRef]
  22. Kaminski, H.; Kuhlbusch, T.; Rath, S.; Götz, U.; Sprenger, M.; Wels, D.; Polloczek, J.; Bachmann, V.; Dziurowitz, N.; Kiesling, H.; Schwiegelshohn, A.; Monz, C.; et al. Comparability of mobility particle sizers and diffusion chargers. J. Aerosol Sci. 2013, 57, 156–178. [Google Scholar] [CrossRef]
  23. Stabile, L.; Cauda, E.; Marini, S.; Buonanno, G. Metrological assessment of a portable analyzer for monitoring the particle size distribution of ultrafine particles. Ann. Occup. Hyg. 2014, 58, 860–876. [Google Scholar] [PubMed]
  24. Maricq, M. Monitoring motor vehicle PM emissions: An evaluation of three portable low-cost aerosol instruments. Aerosol Sci. Technol. 2013, 47, 564–573. [Google Scholar] [CrossRef]
  25. Qi, C.; Asbach, C.; Shin, W.; Fissan, H.; Pui, D. The effect of particle pre-existing charge on unipolar charging and its implication on electrical aerosol measurements. Aerosol Sci. Technol. 2009, 43, 232–240. [Google Scholar] [CrossRef]
  26. Amanatidis, S.; Maricq, M.; Ntziachristos, L.; Samaras, Z. Measuring number, mass, and size of exhaust particles with diffusion chargers: The dual Pegasor particle sensor. J. Aerosol Sci. 2016, 92, 1–15. [Google Scholar] [CrossRef]
  27. Johnson, T.; Caldow, R.; Pöcher, A.; Mirme, A.; Kittelson, D. A New Electrical Mobility Particle Size Spectrometer for Engine Exhaust Particle Measurements; SAE Technical Paper, 2004-01-1341; Society of Automotive Engineers, Inc.: Detroit, MI, USA, 2004. [Google Scholar]
  28. Roth, C.; Ferron, G.; Karg, E.; Lentner, B.; Schumann, G.; Takenaka, S.; Heyder, J. Generation of ultrafine particles by spark discharging. Aerosol Sci. Technol. 2004, 38, 228–235. [Google Scholar] [CrossRef]
  29. Amanatidis, S.; Ntziachristos, L.; Giechaskiel, B.; Katsaounis, D.; Samaras, Z.; Bergmann, A. Evaluation of an oxidation catalyst (catalytic stripper) in eliminating volatile material from combustion aerosol. J. Aerosol Sci. 2013, 57, 144–155. [Google Scholar] [CrossRef]
  30. ISO 27891:2015. Aerosol Particle Number Concentration—Calibration of Condensation Particle Counters; International Organization for Standardization: Geneva, Switzerland, 2005. [Google Scholar]
  31. Marjamäki, M.; Keskinen, J.; Chen, D.; Pui, D. Performance evaluation of the electrical low-pressure impactor (ELPI). J. Aerosol Sci. 2000, 31, 249–261. [Google Scholar] [CrossRef]
  32. Giechaskiel, B.; Cresnoverh, M.; Jörgl, H.; Bergmann, A. Calibration and accuracy of a particle number measurement system. Meas. Sci. Technol. 2010, 21, 4. [Google Scholar] [CrossRef]
  33. Fierz, M.; Meier, D.; Steigmeier, P.; Burtscher, H. Aerosol measurement by induced currents. Aerosol Sci. Technol. 2014, 48, 350–357. [Google Scholar] [CrossRef]
  34. Kim, S.; Kondo, K.; Otsuki, Y.; Haruta, K. A New On-Board PN Analyzer for Monitoring the Real-Driving Condition; SAE Technical Paper, 2017-01-1001; Society of Automotive Engineers, Inc.: Detroit, MI, USA, 2007. [Google Scholar]
  35. Giechaskiel, B.; Casadei, S.; Mazzini, M.; Sammarco, M.; Montabone, G.; Tonelli, R.; Deana, M.; Costi, G.; Di Tanno, F.; Prati, M.V.; et al. Inter-laboratory correlation exercise with portable emissions measurement systems (PEMS) on chassis dynamometers. Appl. Sci. 2018, 8, 2275. [Google Scholar] [CrossRef]
  36. Giechaskiel, B. Solid particle number emission factors of Euro VI heavy-duty vehicles on the road and in the laboratory. Int. J. Environ. Res. Public Health 2018, 15, 304. [Google Scholar] [CrossRef]
  37. Fuchs, N. On the stationary charge distribution on aerosol particles in a bipolar ionic atmosphere. Geofis. Pura E Appl. 1963, 56, 185–193. [Google Scholar] [CrossRef]
  38. Hoppel, W.; Frick, G. Ion-aerosol attachment coefficients and the steady-state charge distribution on aerosols in a bipolar environment. Aerosol Sci. Technol. 1986, 5, 1–21. [Google Scholar] [CrossRef]
  39. Reischl, G.; Mäkelä, J.; Karch, R.; Necid, J. Bipolar charging of ultrafine particles in the size range below 10 nm. J. Aerosol Sci. 1996, 27, 931–949. [Google Scholar] [CrossRef]
  40. Ntziachristos, L.; Giechaskiel, B.; Ristimäki, J.; Keskinen, J. Use of a corona charger for the characterisation of automotive exhaust aerosol. J. Aerosol Sci. 2004, 35, 943–963. [Google Scholar] [CrossRef]
  41. Hinds, W. Aerosol Technology: Properties, Behavior, and Measurement of Airborne Particles, 2nd ed.; Willey Interscience: New York, NY, USA, 1999. [Google Scholar]
  42. Wiedensohler, A. An approximation of the bipolar charge distribution for particles in the submicron size range. J. Aerosol Sci. 1988, 19, 387–389. [Google Scholar] [CrossRef]
  43. Robinson, M.; Backhaus, J.; Foley, R.; Liu, Z. The Effect of Diesel Exhaust Fluid Dosing on Tailpipe Particle Number Emissions; SAE Technical Paper, 2016-01-0995; Society of Automotive Engineers, Inc.: Detroit, MI, USA, 2016. [Google Scholar]
  44. Czerwinski, J.; Zimmerli, Y.; Mayer, A.; D’Urbano, G.; Zürcher, D. Emission reduction with diesel particle filter with SCR coating (SDPF). Emiss. Control. Sci. Technol. 2015, 1, 152–166. [Google Scholar] [CrossRef]
  45. Knutson, E.; Whitby, K. Aerosol classification by electric mobility: Apparatus, theory, and applications. J. Aerosol Sci. 1975, 6, 443–451. [Google Scholar] [CrossRef]
  46. Kulkarni, P.; Baron, P.; Willeke, K. (Eds.) Aerosol Measurement: Principles, Techniques, and Applications, 3rd ed.; John Wiley & Sons, Inc.: New York, NY, USA, 2011. [Google Scholar]
  47. Wang, S.; Flagan, R. Scanning electrical mobility spectrometer. Aerosol Sci. Technol. 1990, 13, 230–240. [Google Scholar] [CrossRef]
  48. Mamakos, A. Methodology to quantify the ratio of multiple-to single-charged fractions acquired in aerosol neutralizers. Aerosol Sci. Technol. 2016, 50, 363–372. [Google Scholar] [CrossRef]
Figure 1. (a) Experimental setup employed for the characterization of the penetration of monodisperse charged particles through the electrofitler (EF). (b) Experimental setup employed for the quantification of the charging efficiencies of the different corona chargers for monodisperse particles of different charge levels. CS = catalytic stripper; Kr = krypton; DMA = differential mobility analyzer; CPC = condensation particle counter; HEPA = high efficiency particle air filter; MFC = mass flow controller.
Applsci 09 01051 g001
Figure 2. The layout of the employed instrumentation in the heavy-duty (HD) engine and vehicle testing. Samples were extracted from tailpipe using a dedicated sampling probe for each instrument. A CPC with a 10 nm cut-off size (REF@10) was connected in the reference particle number instrument sampling in parallel to the default 23 nm CPC (REF@23). In selected tests, an electrometer and an SMPS were connected in the LD + EF system to measure the total charge and size distribution of the emitted particles during steady-state operation. LD = light-duty; TC = tandem negative positive corona charger; EF = electrofilter; SMPS = scanning mobility particle sizer; OBS = on-board system; REF = reference PN; CPC = condensation particle counter.
Applsci 09 01051 g002
Figure 3. (a) Experimentally determined charging efficiencies (dots) for the corona charger of the light-duty (LD) portable emissions measurement system (PEMS) for neutralized graphite particles at the default and elevated Nit settings. Lines show the calculated charging efficiencies from Fuchs theory for Nit products of 1.5 × 10¹² m−3s (green lines) and 2.5 × 10¹² m−3s (orange lines), and for initially neutralized, singly and doubly charged particles (b) Experimentally determined charging efficiencies (dots) for the TC, for neutralized, singly and doubly charged particles. Lines show the calculated charging efficiencies from Fuchs theory for Nit products of 2 × 10¹² m−3s and 3 × 10¹² m−3s on both stages, and for initially uncharged, singly and doubly charged particles.
Applsci 09 01051 g003
Figure 4. (a) Particle penetration through the EF as a function of mobility diameter and particle charge. Experimental results for singly charged particles are shown in circles. The dashed curves correspond to extrapolation of the experimental results for neutralized and multiply charged particles; (b) Average particle charge downstream of a corona charger operating at Nit products of 2.5 × 10¹² m−3/s with (dashed lines) and without (solid lines) an EF.
Applsci 09 01051 g004
Figure 5. Percentage difference in the cycle-average emission results between the PN-PEMS systems and the reference PN for all conducted tests, as a function of the reference PN emission rates. Each point is a test cycle. Dotted lines show acceptable differences for systems sampling from the same position.
Applsci 09 01051 g005
Figure 6. Real-time PN and SCR inlet temperature traces over a cold start world harmonized vehicle cycle test of the HD vehicle. The section of the cycle from 200 to 900 s is removed for the sake of clarity.
Applsci 09 01051 g006
Figure 7. (a) Real-time non-volatile PN traces at steady cruise driving of the HD vehicles at 1000 rpm and 55% load as determined with the reference (REF) and PEMS (LD, LD + TC, OBS) instrumentation (colored lines). The increase in the SC inlet temperature (black dashed curve) was accompanied with an increase in the average particle charge (grey dashed line), which was accompanied by a similar rise in the recordings with the default LD PEMS system (dotted blue curve). (b) Number weighted size distribution over the same test. Numbers indicate the SMPS scan sequence, with the corresponding total non-volatile PN rates shown in panel a as yellow dots. HD = Heavy-duty; SMPS = Scanning mobility particle sizer.
Applsci 09 01051 g007
Table 1. Percentage difference in the charging efficiencies between singly or doubly charged particles and neutralized particles in tandem positive-negative corona charger (TC), as determined experimentally and by Fuchs theory for Nit products of 2 × 10¹² m−3s and 3 × 10¹² m−3s.
Diameter (nm)ExperimentalFuchs 2 × 10¹² m−3sFuchs 3 × 10¹² m−3s
+1+2+1+2+1+2
2327%(±7%)noise 118%26%4%5%
308%(±2%)23%(±17%)12%18%3%4%
418%(±2%)19%(±13%)7%11%2%3%
503%(±2%)10%(±14%)5%8%1%2%
705%(±4%)3%(±25%)3%5%1%1%
100−2%(±9%)noise 12%3%0%1%
2004%(±57%)noise 11%1%0%0%
1 Concentrations were at the noise levels of the electrometer.
Table 2. Percentage difference in the charging efficiencies between singly (+1) or doubly charged (+2) particles and neutralized particles by introducing the electrofilter (EF) upstream of a unipolar corona operating at Nit product of 2.5 × 10¹² m−3s for various diameters (d).
d (nm)2330415070100200
+1−32%14%27%24%17%13%6%
+2−100%−99%19%41%41%30%13%

