Voltage/Frequency Deviations Control via Distributed Battery Energy Storage System Considering State of Charge


1
The College of Electronics and Information, Hangzhou Dianzi University, Hangzhou 310018, China
2
College of Electrical Engineering, Zhejiang University, Hangzhou 310027, China
*
Author to whom correspondence should be addressed.
Appl. Sci. 2019, 9(6), 1148; https://doi.org/10.3390/app9061148
Submission received: 26 February 2019
/
Revised: 17 March 2019
/
Accepted: 18 March 2019
/
Published: 18 March 2019
(This article belongs to the Special Issue Energy Management and Smart Grids)
Abstract
:In recent years, the installation of distributed generation (DG) of renewable energies has grown rapidly. When the penetration of grid-integrated DGs are getting high, the voltage and frequency of the power system may cause deviation. We propose an algorithm that reduces voltage and frequency deviation by coordinating the control of multiple battery energy storage systems (BESSs). The proposed algorithm reduces the total number of charging and discharging times by calculating the sensitivity coefficient of BESS at different nodes and then selecting the appropriate BESSs to operate. The algorithm is validated on a typical distribution testing system. The results show that the voltage and frequency are controlled within the permissible range, the state of charge of BESSs are controlled within the normal range, and the total number of charging and discharging cycles of BESSs are reduced.
1. Introduction
In order to fulfil the growing demand for energy, there has been a rapid expansion of renewable energies such as wind power and solar power in recent years [1]. Renewable energies are rapidly emerging and showing significant value in the entire energy system with the advantage of sustainable, less pollution, and reducing the costs of mitigating climate change [2]. However, renewable energies are easily affected by weather conditions and have features of intermittent generation.
When the distributed generation (DG) of renewable energies is integrated to the grid, the voltage and frequency of the grid will fluctuate due to the intermittent output of DG [3]. If the voltage exceeds the allowable range, electrical equipment will operate at an over-voltage or under-voltage condition, which will cause the insulation of electrical equipment to accelerate aging, increase the power loss of the distribution network and may result in voltage collapse, and partial power grid collapse. The frequency deviation in the power system adversely affects the operation of users and power plants. For example, a frequency deviation of power system will change the speed and the power of motors, resulting in a change in the output of the transmission machinery and affecting the production efficiency.
Traditionally, traditional generators’ droop control is a typical method to address the frequency issues in the power system. The droop control uses the real power output of a generator to calculate the ideal operating frequency. This relaxing of a stiff frequency allows the grid to dampen the fast effects of changing loads, increasing the stability of the system [4]. However, traditional generators may be phased out in the future due to the constraint of the greenhouse gas emissions on a global scale, making the traditional generators insufficient to deal with the increasing requirements of frequency regulation [5]. The change of the load’s operating power can provide frequency regulation service when the system frequency fluctuates [6]. Moreover, the operating power of the Demand-side resource can be regulated rapidly, while the generator regulates its power generation through a series of processes, such as the speed governor process and the reheat steam turbine process, leading to a larger inertia compared with Demand-side resource [5]. In terms of voltage, different types of regulators are used to maintain the voltage within an acceptable range in traditional distribution systems, such as, on-load tap changer (OLTC), step voltage regulators (SVRs), and shunt capacitors (SCs) [7,8,9,10,11,12]. The tap operation of an OLTC and an SVR can directly regulate the distribution system voltage from the system operator [13]. SCs can solve a series of problems caused by electrical loads’ reactive power consumption, which can improve the voltage profile and reduce system losses. However, when the penetration of grid-integrated DGs is getting large, those types of regulators are not efficient enough to regulate the voltage in the fast nonlinear dynamics [14]. Moreover, frequent switching operation will reduce regulating efficiency. PV inverters can inject or absorb reactive power, in order to mitigate the overvoltage problems [15]. In addition, it is necessary to splits distribution networks into several separate control areas to control the voltage profile of each area in an admissible time calculation for online operation [16]. Because the resistance/reactance (R/X) ratio is relatively large in a low-voltage distribution system, the effectiveness of reactive power in voltage control is limited. As a result, active power adjustment should be considered for the voltage control of distribution systems. In addition, demand response is an effective way to keep the voltage in a permissible range [17]. Demand response changes consumers’ inherent power consumption mode, reduce or shift the power load for a certain period of time, thus ensuring the stability of the power grid.
In order to solve the shortcomings of traditional regulation methods, researchers have proposed many solutions using battery energy storage systems (BESSs) to adjust voltage and frequency recently. The BESSs with fast dynamic response characteristic can maintain power balance in the grid. The voltage and frequency deviation of the grid can be alleviated by the charging and discharging of BESSs [18]. Installing a BESS in a suitable place, utilizing battery charging and discharging to solve the voltage/frequency deviation is becoming a trend of future power system development [19,20,21,22]. Several studies have been conducted recently on the voltage and frequency regulation by using BESS. Reference [23] analyses the effect of BESS on the short-term frequency control in autonomous microgrids. Load factor has been improved by BESSs in References [24,25]. Reference [26] configures capacity of the BESS according to the renewable energy production rate and proposes a control strategy to track the power reference. According to the researches of [27,28], BESS applications can stabilize renewable energy output. Predictably, BESS will be more commonly employed in the distribution system because of its advantages. When the number of BESSs is getting larger in the distribution system, the charging and discharging of BESSs should be properly controlled because different locations of BESSs have different effects on the grid. Lee et al. propose a coordinated control algorithm for distributed BESSs [29]. In Lee’s algorithm, the main control center sends charging or discharging commands to BESSs when the voltage or frequency deviation exceeds the normal range. When the state of charge (SOC) of the selected BESS reached the upper or lower limits, then the algorithm selected another BESS to operate. Voltage regulation and frequency regulation are performed independently in this algorithm, simultaneous voltage and frequency regulation are not considered in Lee’s algorithm. Moreover, the control of SOC needs further exploration.
Therefore, we propose a novel control algorithm for coordinated control of BESSs, which enable power systems to deal with emergencies and combines voltage regulation and frequency regulation in one process by using the operating reserve. Through the coordinated charging and discharging of multiple BESSs, the grid voltage and frequency are controlled within the permissible range, and the adverse effects caused by deviation are alleviated. BESSs’ adjusting speed is outstanding, it can reach the required power within the time set by the Union for the Coordination of Transmission of Electricity in Europe (30s) [30]. The number of charging and discharging cycles of BESSs is minimized to save the life time. The contributions of this study are as follows:
- (1)
- The proposed coordinated control algorithm firstly calculates the required power for voltage and frequency deviation control, respectively, and then compares the two values and obtains an optimal regulating power for simultaneously solving the voltage and frequency deviation, which reduces the number of BESSs charging and discharging cycles, and improves the life time of the batteries.
- (2)
- The proposed method is compared with Lee’s algorithm [29] through the case studies. In Lee’s algorithm, the voltage and frequency regulation by BESSs are operated in a sequential order, which operates the BESSs more frequently. The results of the case study illustrate that a smaller number of charging/discharging cycles and better SOC control can be achieved by our proposed algorithm.
The remainder of this paper is organized as follows. Section 2 describes the proposed system architecture. Section 3 presents the problem formulation and solution algorithm. The simulation results in a 33-node distribution system is provided in Section 4. Section 5 presents the conclusion of this study.
2. System Framework of Distribution System with DGs and BESSs
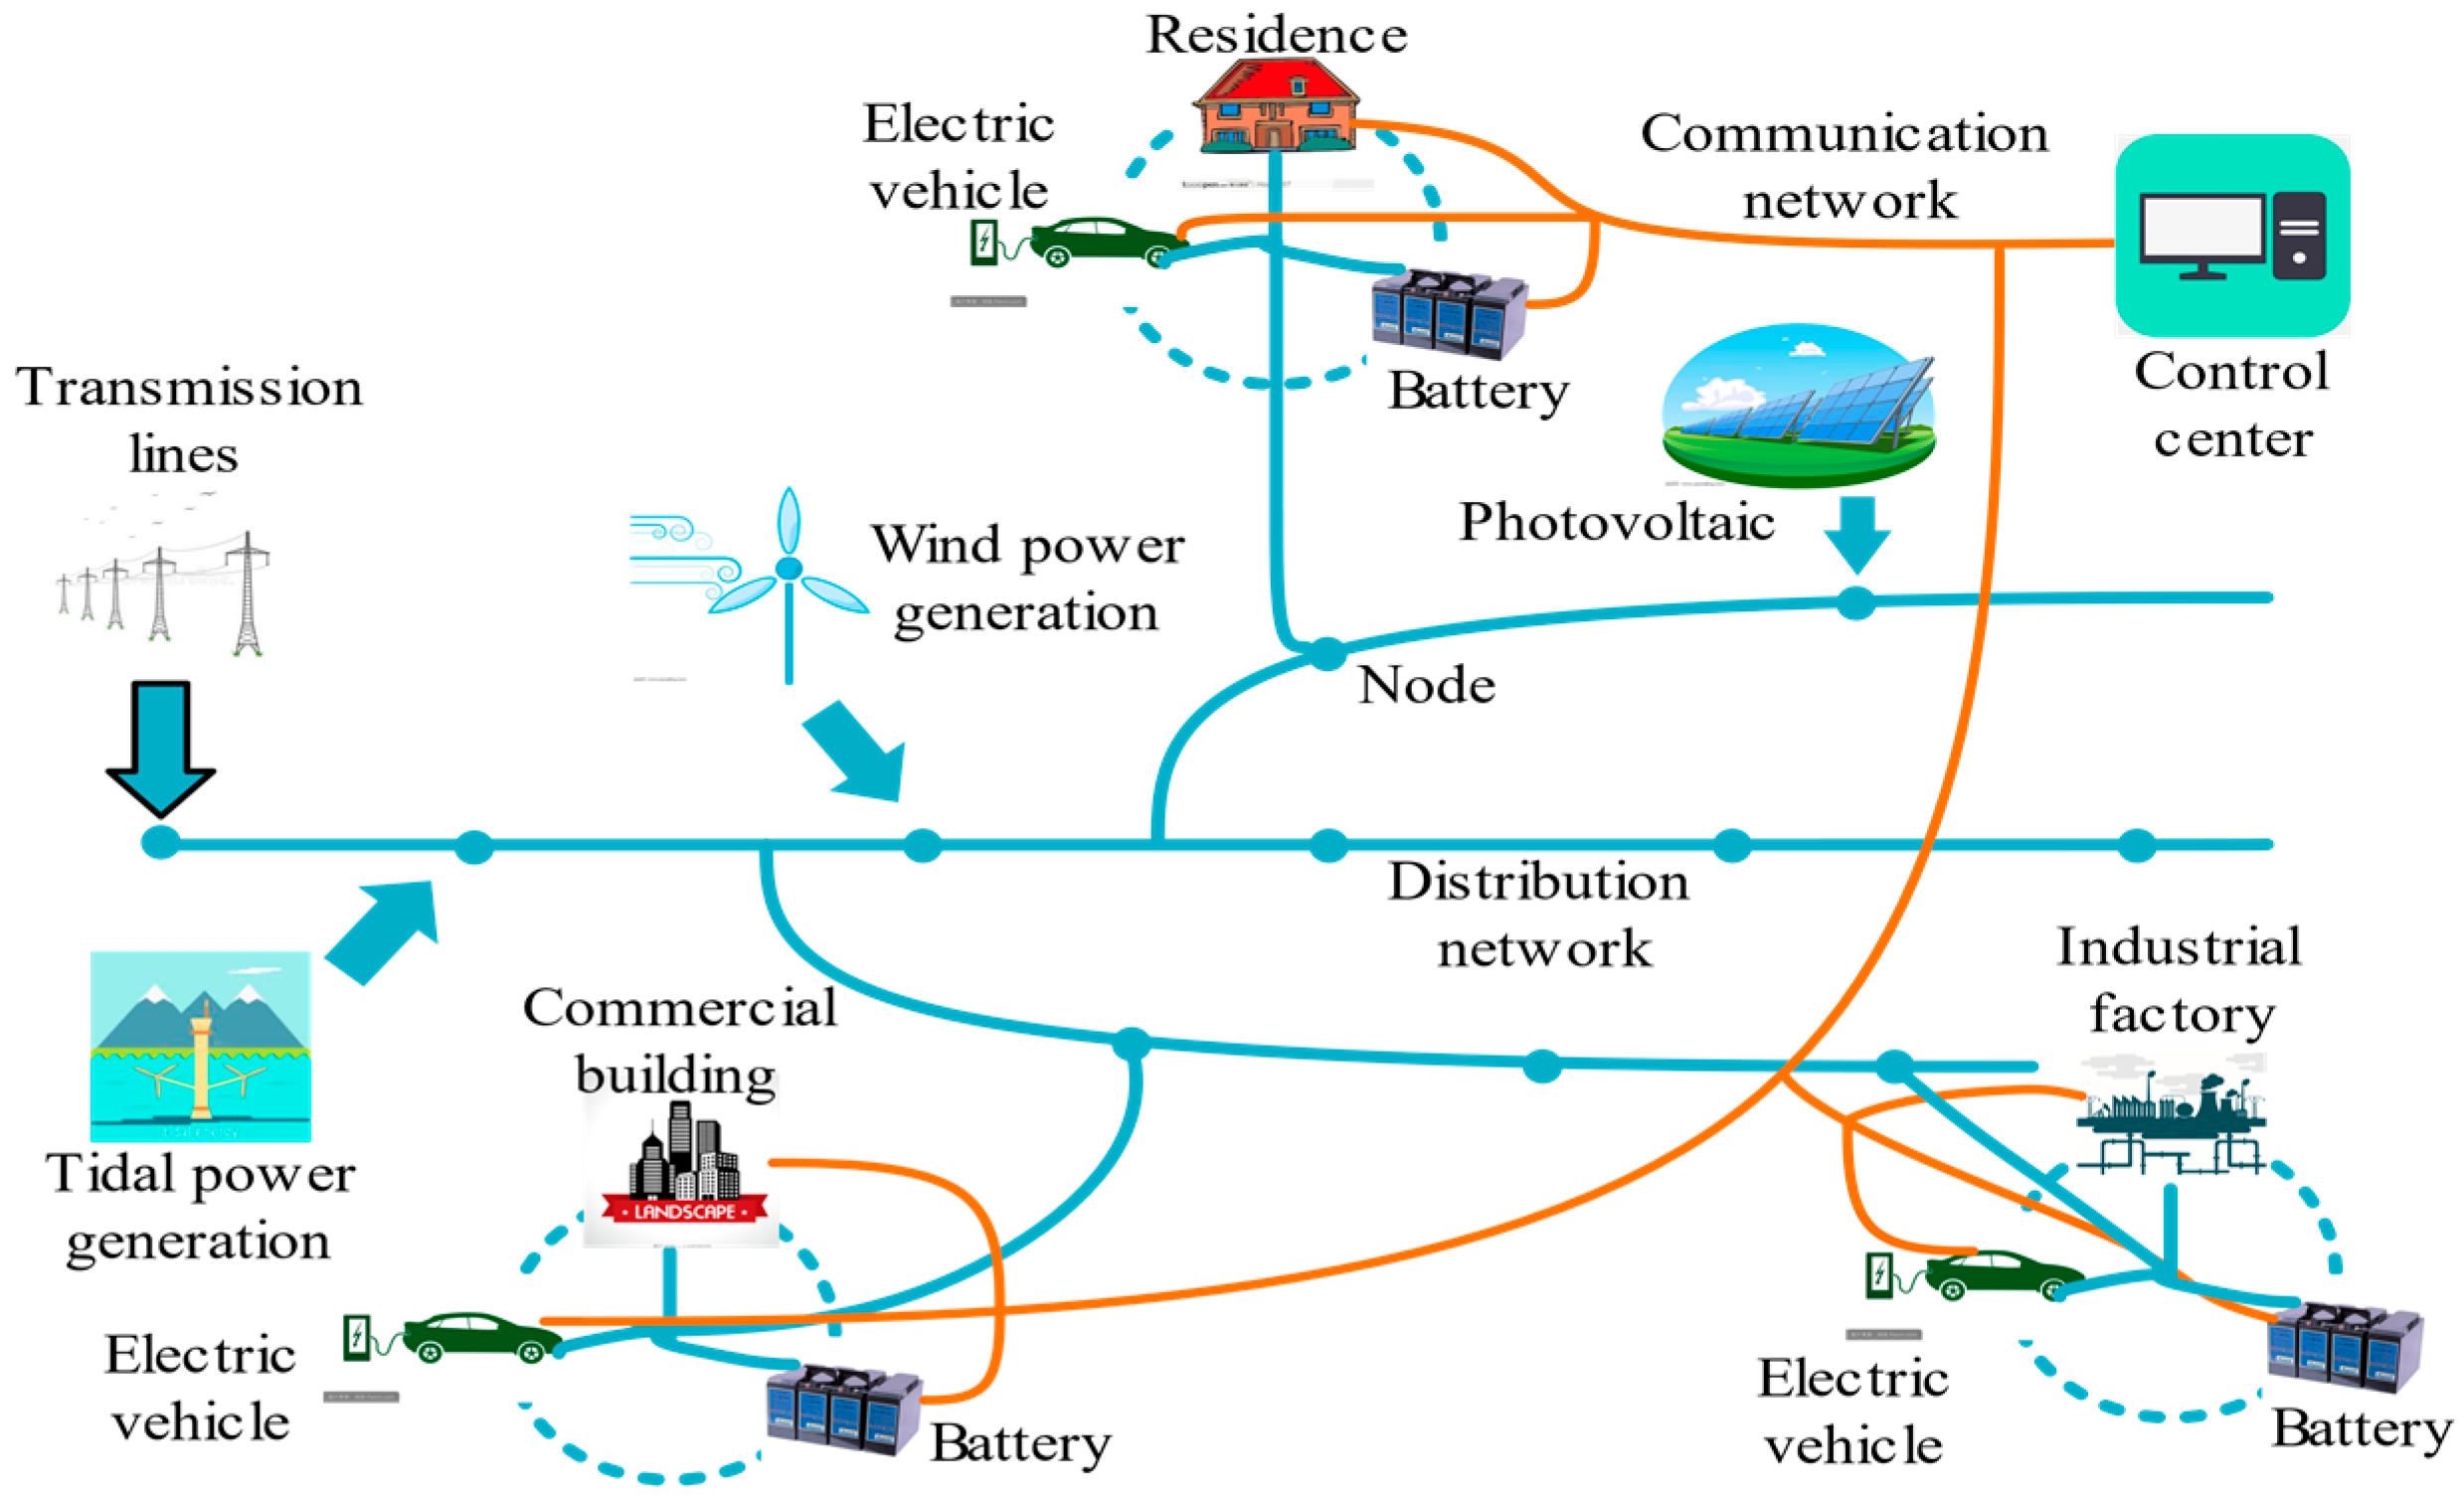
The specific architecture proposed in this study is shown in Figure 1. Distributed generations convert renewable energy into electricity and integrate to the distribution system. There are several BESSs such as electric vehicles and batteries, which can be used for voltage/frequency regulation. The BESSs can interact with the control center through the communication network. The owner of BESSs can get profit by providing voltage/frequency regulation service [31,32,33,34,35,36]. The cost-benefit of a Smarter Network Storage project of 6 MW/10 MWh-BESSs in Great Britain has been investigated in [34]. Total social cost, such as battery cells, construction, and operating costs, is £7,402,284 (average value). The social benefit streams from BESSs like frequency response, arbitrage and carbon abatement can get £9,731,525 (average value). Comparing the costs and benefits, the profit can be taken by BESSs as £2,329,241, i.e., 31.5% of the cost.
In the structure, control center collects status information of BESSs through the communication network. To achieve the coordinated control of the BESSs, it is necessary to know the energy storage status. As show in Figure 2, status information includes the upper limit state of charge (), the lower limit state of charge (), the location information, the capacity of the energy storage device, and the connection status.
Status information is consisted by information matrix H, and we use the matrix representation of the characteristics of the BESS model. Specific steps are as follows:
The control center obtains the distance according to the position information of BESSs, and then formulates the distance matrix of Formula (1).
where n indicates the number of the nodes in the distribution systems.
The control center formulates energy capacity matrix of Formula (2) according to the capacity of the BESSs.
The SOC limit is formulated as matrix of Formula (3) and Formula (4) according to the upper and lower limits of the current state of the BESSs.
Control center formulates SOC matrix of (5) according to the current SOC of the BESSs.
Finally, the information matrix H can be formulated as:
After developing the information matrix H, the control center optimizes the coordinated control according to the proposed algorithm, and sends the commands of the charging or discharging power to BESSs. BESSs receive commands from the control center, and then complete the corresponding operations. In the charging and discharging operation, the regulation power is completed by all the BESSs of each node. As a result, SOC of a single BESS will not be too high or too low.
3. Proposed Collaborative Control Algorithm
3.1. Full-time SOC Control
The SOC of BESSs should be considered during the operation. The SOC of BESSs should be considered during the operation. Charging and discharging processes have different effects on SOC. The represents the charging power, and the value is positive. The represents the discharging power, and the value is negative. The characteristics of the BESSs are as follows:
- SOC dynamicswhere is the SOC at time t; and is the capacity of the battery, and is the charging and discharging power of battery, respectively.
- SOC limitswhere and are the minimum and the maximum SOC, respectively.
- Power limitswhere , and , are the minimum and the maximum charging, discharging power, respectively.
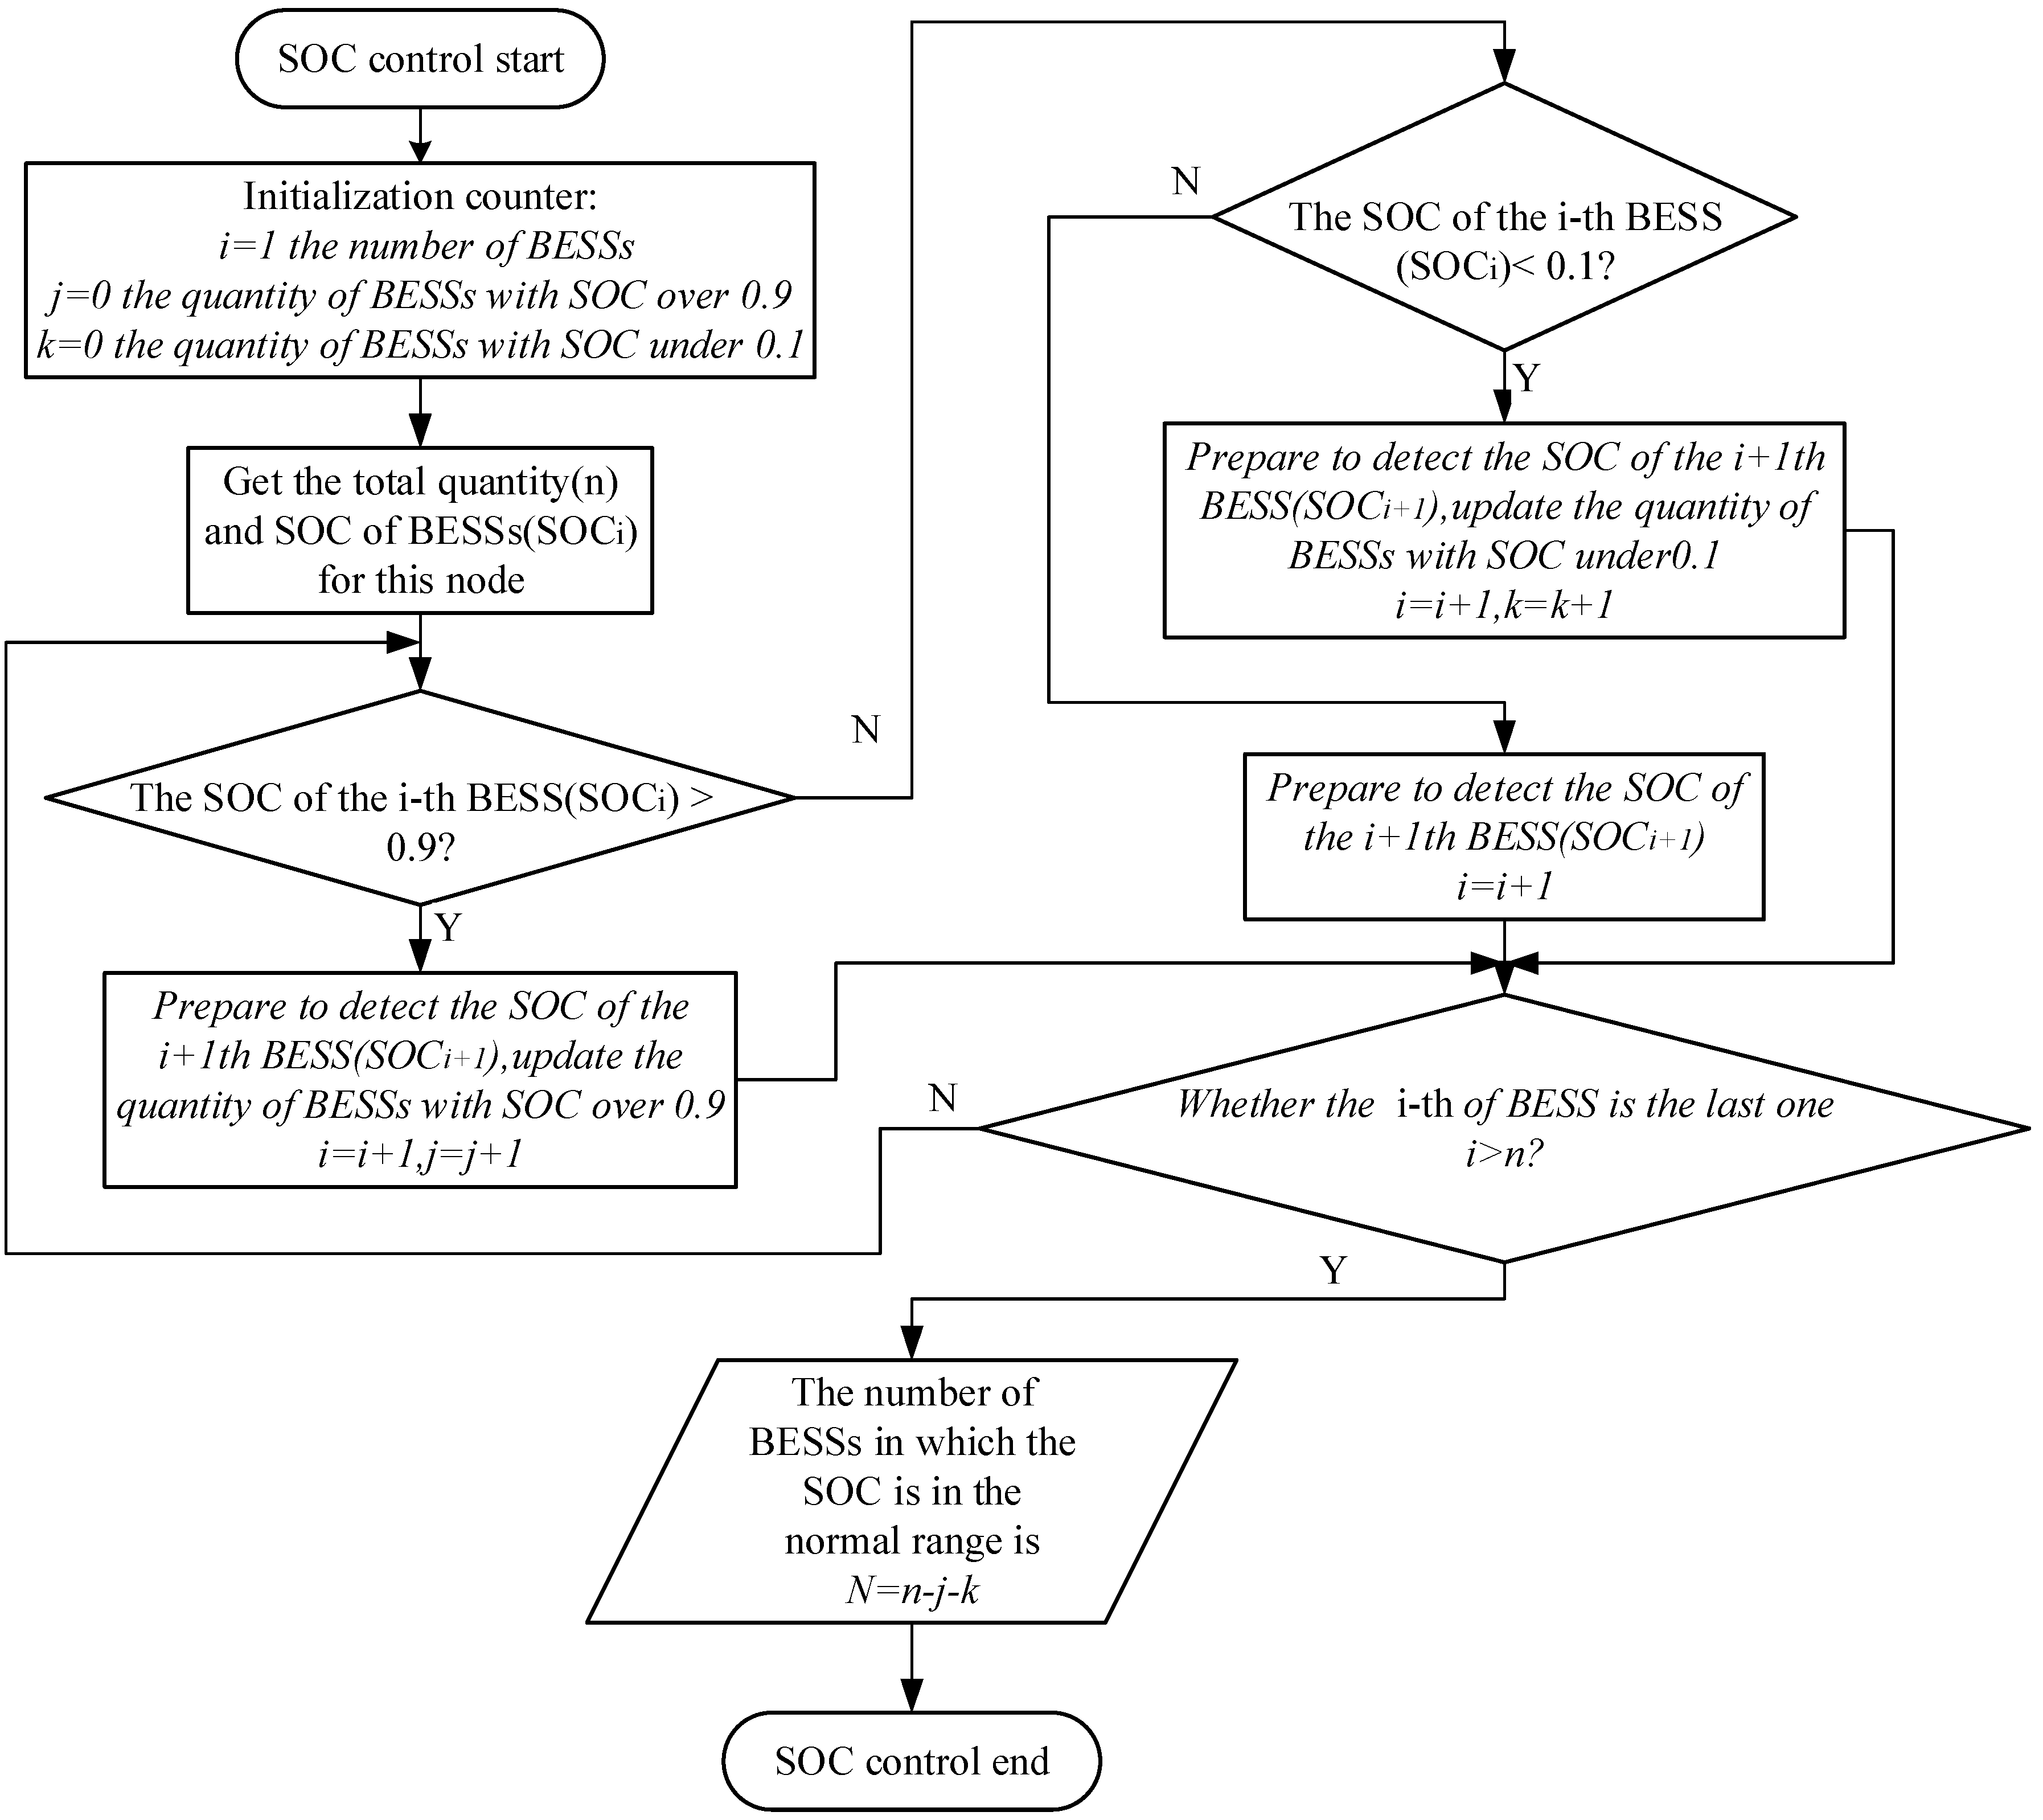
For each node, the flow chart of SOC control is shown in the Figure 3.
As shown in Figure 3, for each node, the control center collects the SOC data of the BESSs and counts the quantity of BESSs of which the SOC is in the normal range. This process helps determine the specific amount of regulation for each BESS, which will be used in the coordinated control.
3.2. Independent Voltage Regulation Algorithm
According to the voltage tolerance range of the IEEE 1159-2009 standard [37], voltage deviation is divided into voltage rise and voltage drop, respectively. A voltage drop indicates that the root mean square of voltage is between 0.1 and 0.9 p.u. of the rated voltage for a duration of between 0.5 and 1 min, and a voltage drop of more than 1 min is considered to be an undervoltage. A voltage rise indicates that the voltage is between 1.1 and 1.8 p.u. of the rated voltage for a duration of between 0.5 and 1 min, and a voltage rise of more than 1 min is considered to be an overvoltage.
In the distribution network, the power injected to a node will affect the voltage of other nodes. As a result, the charging and discharging of BESSs at different locations of the grid has different impact on the voltage regulation. Voltage sensitivity matrix control strategy is applied for determining the optimal active power adjustment of each node for the voltage regulation in this study. According to the sensitivity matrix, the nodes with high sensitivity coefficient are preferentially selected in the voltage regulation, and the nodes with low sensitivity coefficient are chosen for the coordinated frequency regulation.
The voltage sensitivity coefficient [38] can be obtained by the following two power flow calculation formulas
where denote the nodes number. and θ denote, respectively, the active power flow, reactive power flow, phasor bus voltage, voltage angle, line admittance, and impedance angle.
The system Jacobian matrix is updated at each iteration until convergence tolerance is satisfied, and the resultant Jacobian matrix J is inversed to compute the S matrix.
Let the S matrix equal to the J−1
The variation of the voltage amplitude and the variation of the phase angle is decoupled by Equation (14). can be calculated by Equation (16).
If only the active power regulating of the BESSs is considered, then Equation (17) will become
where is the power which can regulate the voltage to the permissible range.
The specific voltage regulation algorithm of each node is divided into five steps, which is shown in Figure 4.
Step 1: Get the voltage regulation power () of this node from control center.
Step 2: In order to prevent the BESSs suffering damage while grid voltage being too high or too low, it is necessary to perform grid voltage detection. If the voltage is between 0.1 and 0.9 p.u., the BESS is ready to be discharged. On the other hand, if the voltage is between 1.1 and 1.8 p.u., the BESS is ready to be charged. When the magnitude of the voltage is less than 0.1 p.u or greater than 1.8 p.u., the BESS is disconnected from the system [29,37].
Step 3: Detect the SOC value of BESSs in this node by the SOC control strategy shown in Figure 3. Count the number (N) of BESSs which the SOC is in the normal range. The total regulation amount of this node is evenly distributed to the N BESSs.
Step 4: BESSs perform charging or discharging operations.
Step 5: Perform grid voltage detection again. If Vs is not between 0.9 and 1.1p.u., steps 1–4 are repeated.
3.3. Independent Frequency Regulation Algorithm
According to the GB/T15945 “Power Quality Power System Frequency Permissible Deviation”, in China, the power grid frequency is normally 50 Hz. For grid capacity of 3 million kW and above, the upper and lower limits of grid frequency deviation are 0.2 Hz and −0.2 Hz, respectively. For those with a capacity of less than 3 million kW, the upper and lower limits of grid frequency deviation are 0.5 Hz and −0.5 Hz, respectively.
Frequency regulation is the process of controlling the frequency within the normal range. Since the BESSs charging and discharging at different positions has almost the same influence on the grid frequency, therefore, the nodes with small sensitivity coefficients are preferred for the frequency regulation.
The control center calculates the regulated power by frequency and grid information, including the following formula:
Formula (19) and (20) can be obtained according to the frequency characteristics of the power system load. Where is the rated frequency 50 Hz, is the current frequency value; (Hz) is the system frequency deviation; (MW) is the active load variation; (MW/Hz) is the load frequency regulating effect coefficient, which is obtained by:
where is the total load at the rated frequency, and is the total load at the value. The power of frequency regulation can be obtained by Formula (22):
The block diagram of the frequency regulating algorithm is shown in Figure 5.
The frequency regulation algorithm of each node is divided into five steps:
Step 1: Obtain the frequency regulation power () of this node from the control center.
Step 2: In order to prevent the BESSs suffering damage while grid frequency being too high or too low, it is necessary to perform grid frequency detection. If the frequency is between 47.5 and 49.8 Hz, the BESS is ready to be discharged. On the other hand, if the frequency is between 50.2 and 52.0 Hz, the BESS is ready to be charged. When the grid frequency is less than 47.5 Hz or greater than 52.0 Hz, the BESS is disconnected from the system.
Step 3: Perform the SOC control as shown in Figure 3. And then evenly distributed total regulation amount to the N BESSs.
Step 4: BESSs perform charging or discharging operations.
Step 5: Perform grid frequency detection again. If f is not between 49.8 and 50.2Hz, steps 1–4 are repeated.
3.4. Coordinated Voltage and Freguency Regulation Algorithm
Section 3.3 and Section 3.4 describe the independent voltage/frequency regulation process, however, the two independent regulation processes will frequently operate the BESSs to charge and discharge, which is not conducive for the long-term use of energy storage equipment. Therefore, a further optimal coordinated regulation algorithm is proposed in this study.
Figure 6 shows the overall flow chat of the BESS coordinated control algorithm proposed in this paper, which is mainly composed of four parts: (1) The full-time SOC control, it is used to confirm the situation of the BESSs, which includes the quantity of power-adjustable batteries, charging/discharging power of batteries and the SOC of each battery. The information will be used for the selection of BESSs. (2) The independent voltage regulation algorithm, it is used to calculate the power required for voltage regulation of each node at the current time. The sum of the power adjustments of each node is calculated at the end of this step. (3) The independent frequency regulation algorithm, it calculates the required power for the entire distribution frequency regulation. (4) The coordinated voltage and frequency regulation algorithm, it compares the frequency regulating power of the distribution network and the sum of each node’s voltage regulating power. If voltage regulating power is larger than the frequency regulating power, the voltage regulating power will be the final regulation power. If frequency regulating power is larger than the voltage regulating power, the frequency regulating power will be the final regulation power. The larger part of the power will be allocated to the nodes with lower sensitivity coefficient according to Section 3.4.
The coordinated control algorithm consists the following eight steps:
Step 1: Obtain the status of battery from information matrix H (Formula (6)).
Step 2–3: Calculate the sensitivity coefficient and voltage regulation power of all nodes (the specific steps are shown in Section 3.2), and then select some nodes (x) with low sensitivity coefficient for frequency regulation compensation.
Step 4–5: Calculate the total power for voltage regulation () and frequency regulation ().
Step 6: Compare the voltage regulation power () and the frequency regulation power ().
Step 7–8: If , there is no need to complete frequency regulation compensation at this time, therefore . If , it is necessary to perform frequency regulation compensation in the candidate nodes and the power of compensation is .
Step 9: Get the total regulation amount . And then send regulation commands to each node.
4. Test and Result Analysis
4.1. Test Model and Parameters
IEEE 33-node power distribution system is applied to verify the proposed coordinated control algorithm (as shown in Figure 7) [39]. Node 1 is the reference node and the voltage is fixed at 1 p.u. The other 32 nodes are user nodes, and the allowed range of each node voltage is [0.9, 1.1] p.u. The test data are based on the generated power of PV and the load in Ota city, on June 1st, 2007 [40]. The simulation is carried out during one day, 24 h period is divided equally into 2880 slots, i.e., each slot is 30s.
In this paper, a Li-ion battery is considered as the BESSs. Figure 8 shows the change of SOC in different states. The horizontal axis of Figure 8 is 24 h, indicating a full-day SOC operation. In order to make the BESSs have a charging and discharging margin and prevent over charge and over discharge, SOC should be controlled in 0.1 ≤ SOC(t) ≤ 0.9.
In Figure 8, number of 1–5 indicates the BESS operation as follows:
- (1)
- T3, T6: Standby period, voltage and frequency are in the normal range, and no regulation required.
- (2)
- T1, T4: Discharging period, BESS is discharged power
- (3)
- T2, T5: Charging period, BESS is charged power from the power system.
We assumed each battery with the capacity of 23 kWh. The initial SOC of the batteries is assumed by the Gaussian distribution on [0.3, 0.4] with the mean value of 0.35, and the standard deviation is 1. The number of candidate nodes which are used to perform frequency regulation compensation is assumed as one third of the total number of BESSs of the node (x = n/3).
We assume 100 users in a node, and each user is equipped with a photovoltaic (PV) system. In this paper, the daily load data and PV generation data are referenced in the literature [40], which are showed in Figure 9. The PV output is large during the period of 9:15–11:40 and 12:15–15:10. The peak power is 9032 kW. Daily load curve fluctuates between 2306 kW and 4994 kW.
4.2. Result Analysis
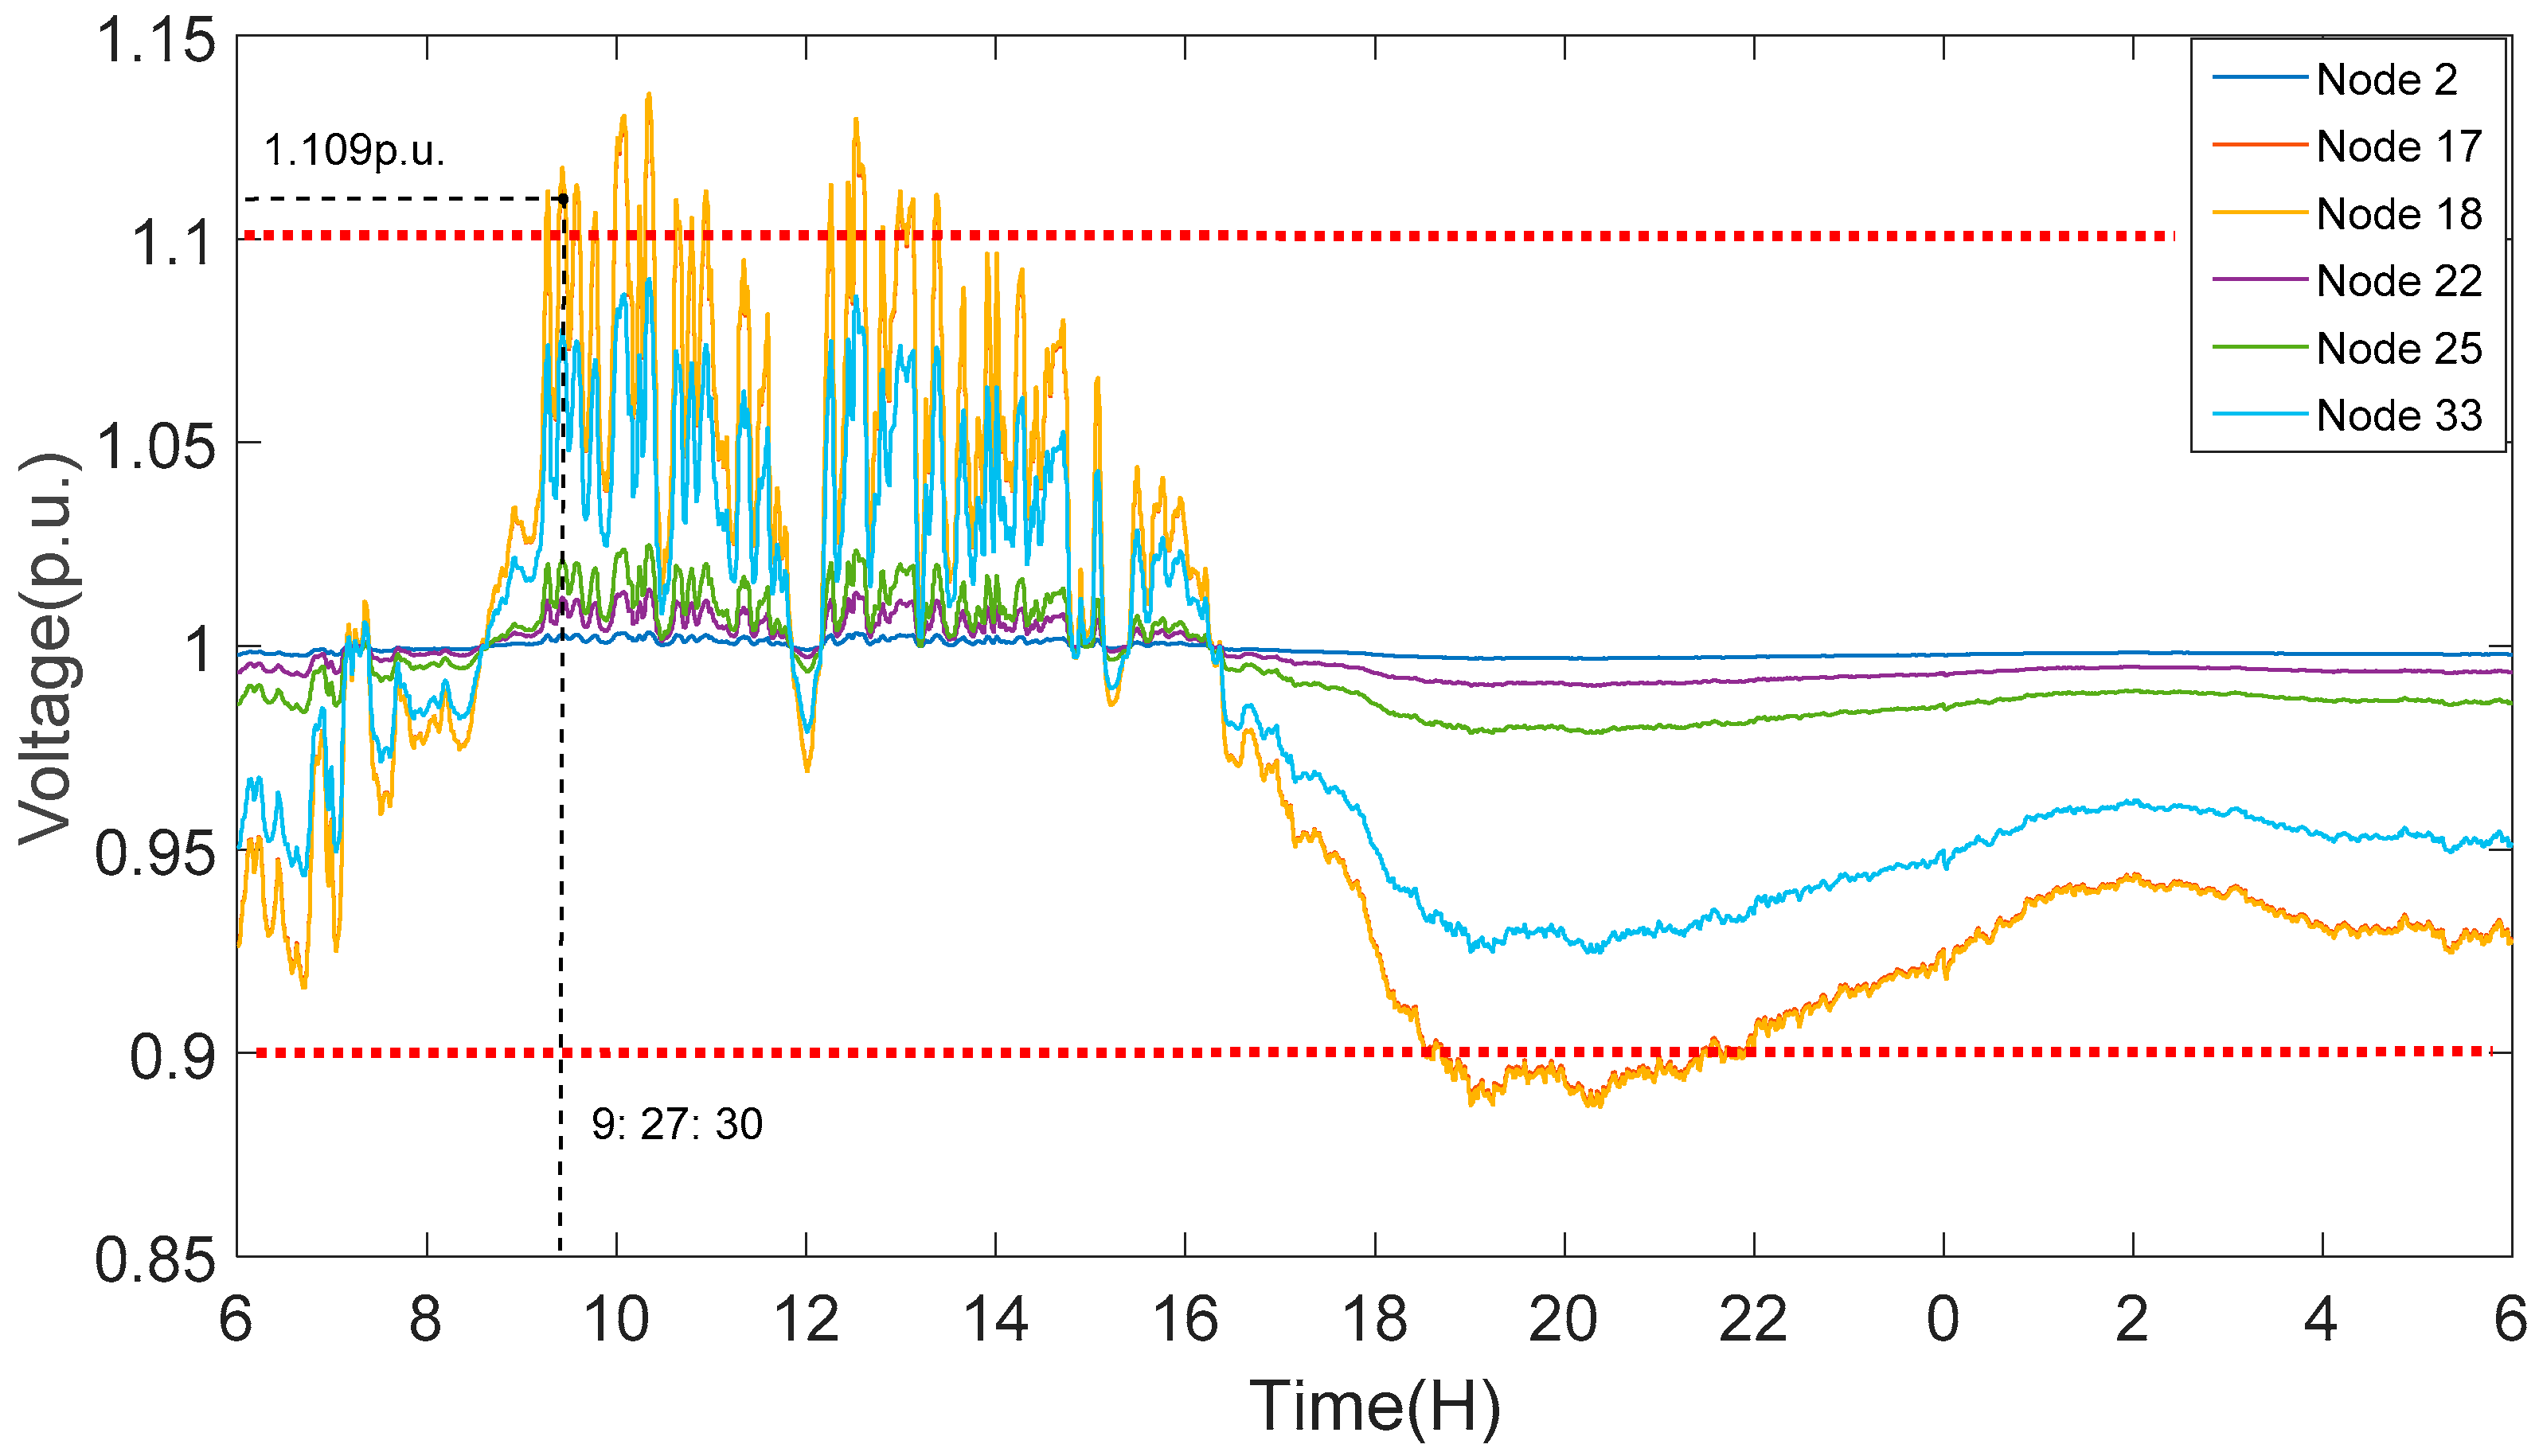
The voltage fluctuation curves before and after voltage regulation are shown in Figure 10 and Figure 11 respectively. Each curve in Figure 10 and Figure 11 each curve represents the voltage status of a node during the 24 h.
According to the voltage sensitivity coefficient, nodes number of 1–4 and 19–25 have small sensitivity coefficient and therefore voltage deviation is small in these nodes. It is can be seen from Figure 11 that during the period of 9:15–11:00 and 12:30–13:10, the grid is in an overvoltage state because of the large output of PV generation and low load consumption. During the time of 18:30–22:00, the grid is in an undervoltage state. The peak and valley of voltage are 1.13573 and 0.88816 p.u., respectively.
The result after voltage regulation is shown in Figure 11. The proposed algorithm regulates the voltage fluctuations within he permission range by coordinated control of BESSs charging and discharging. The maximum voltage deviation shown in Figure 11 is 0.09895 p.u.
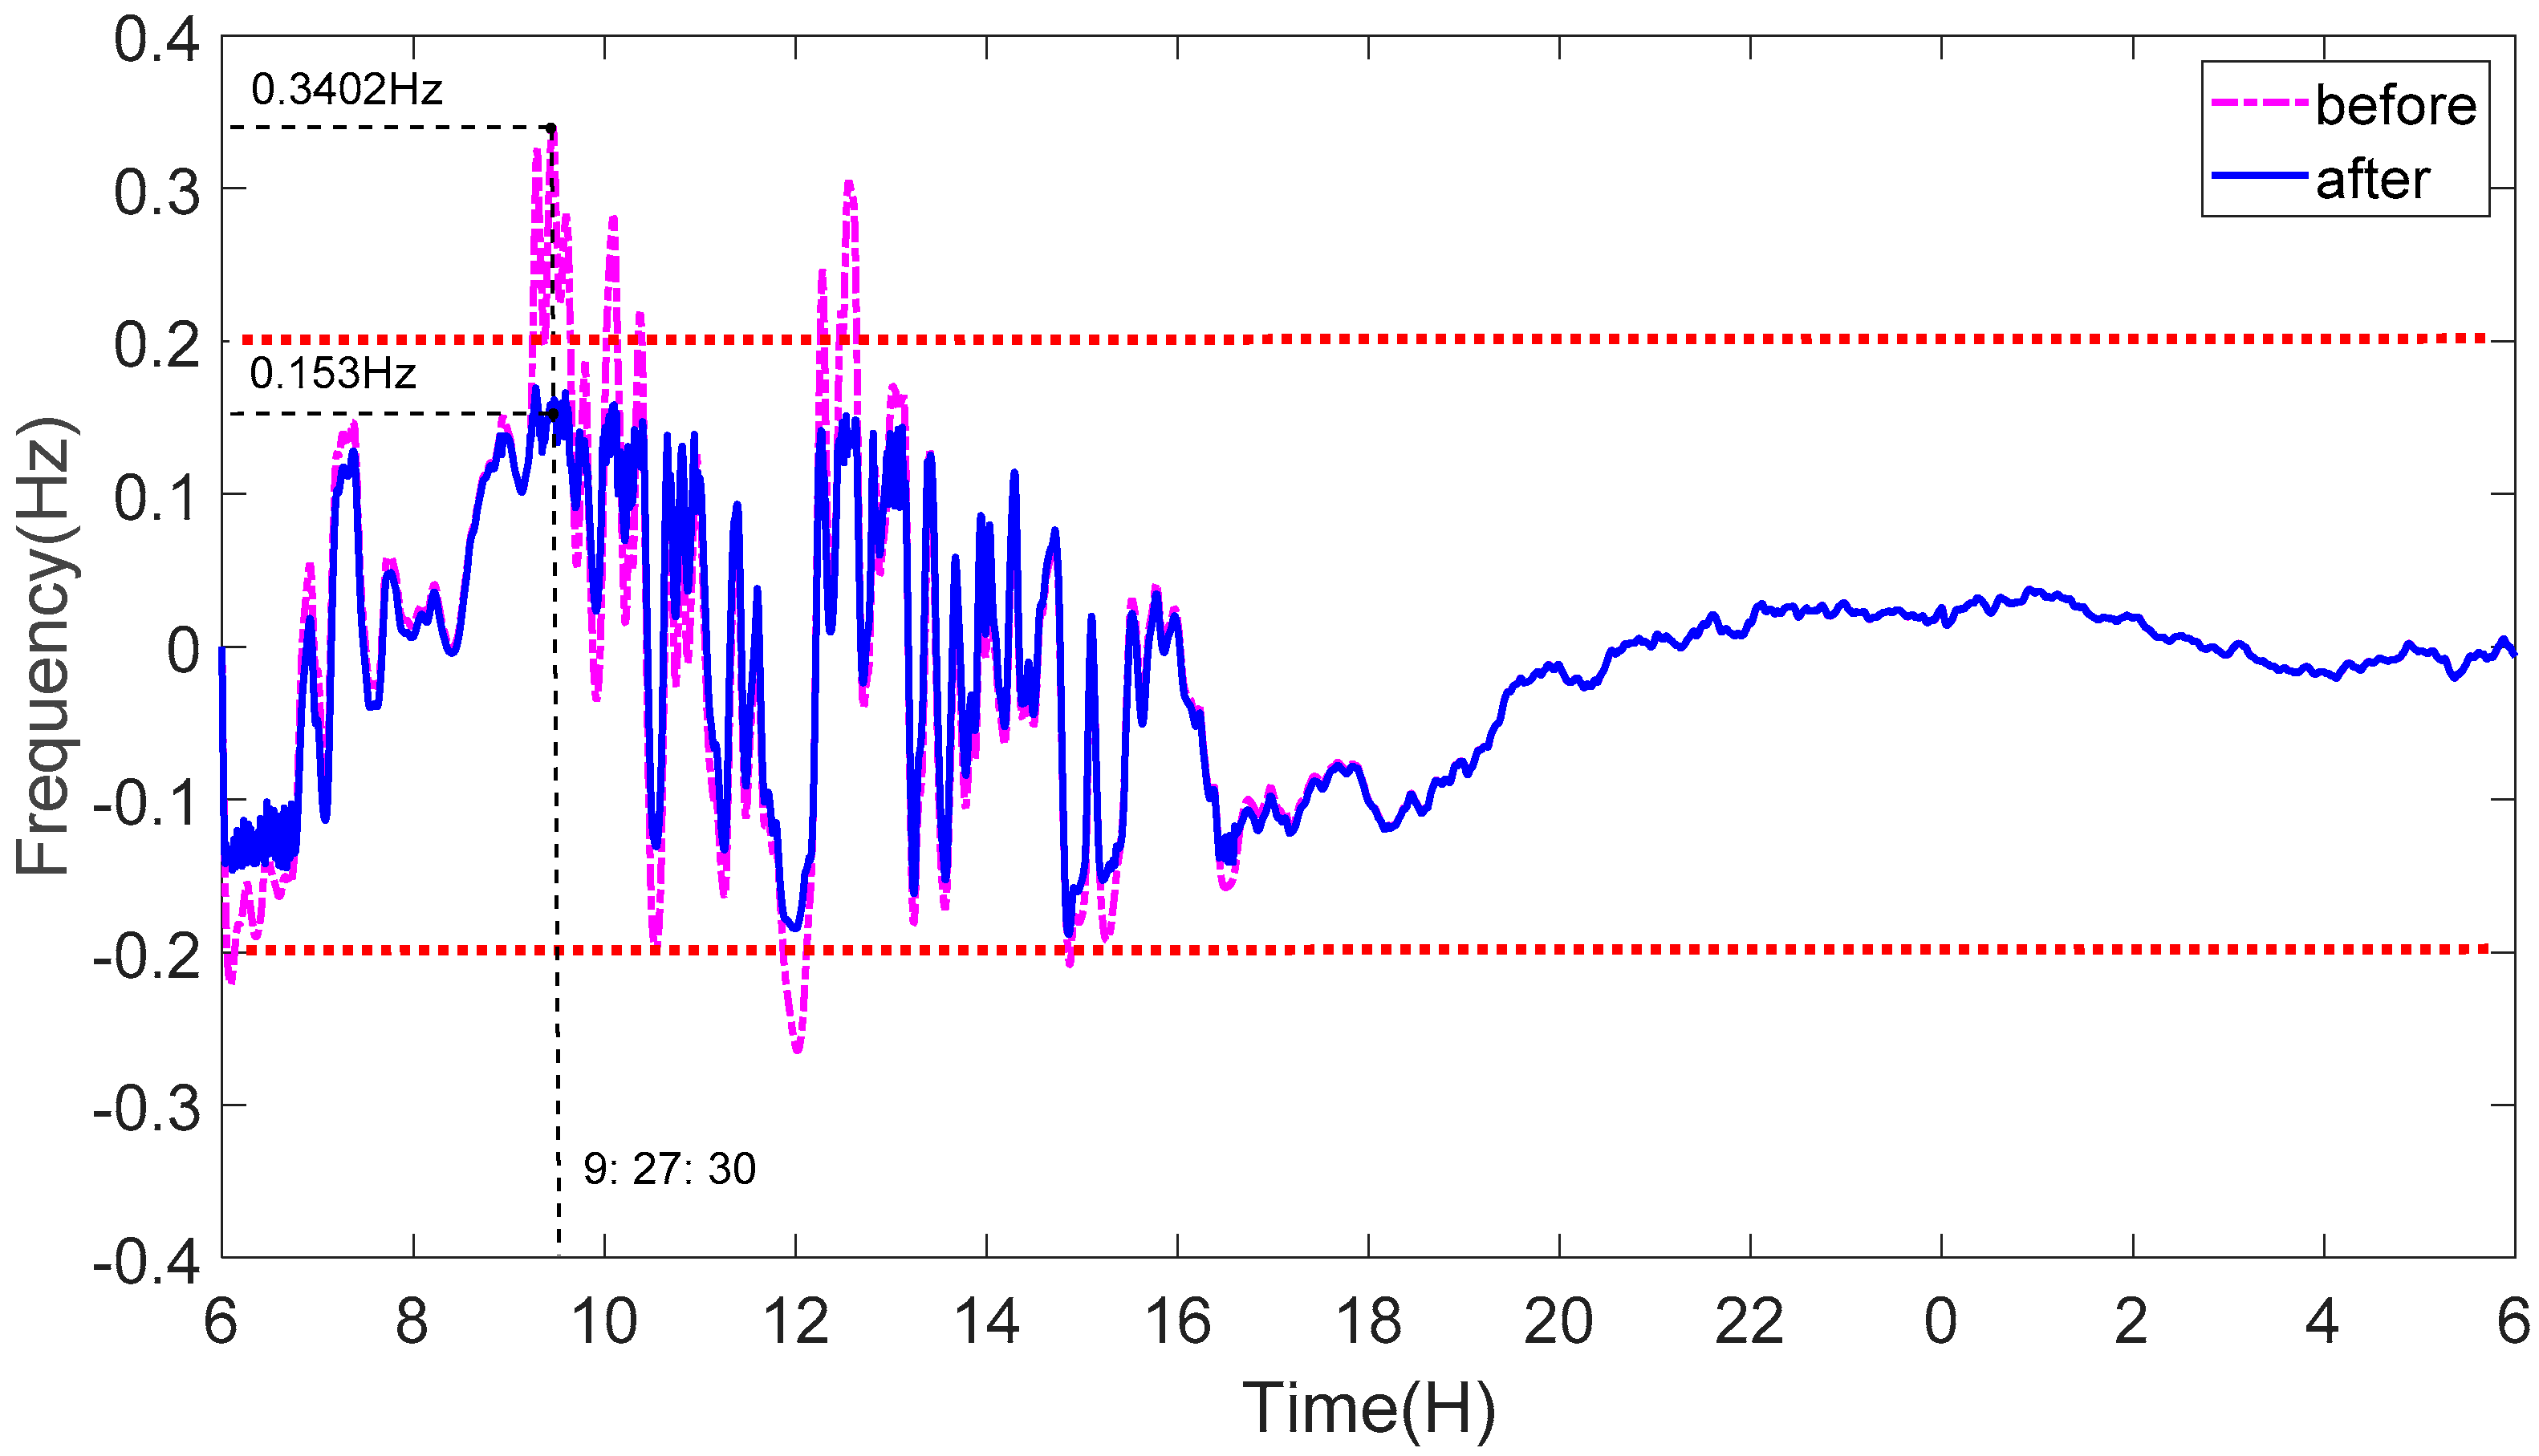
Figure 12 shows the power system frequency deviation curve regulated by the proposed algorithm. Dashed and solid curves indicate the frequency before and after regulation, respectively. During the period of 6:40–7:05 and 11:45–12:15 frequency exceeds the lower limit, 9:35–10:30 and 12:10–12:45 frequency exceeds the upper limit. Actually, the net load (load-PV) that, shown in Figure 9, is in a high load state during 6:40–7:05 and 11:45–12:15, and in a low load state during the period of 9:35–10:30 and 12:10–12:45. In addition, the fluctuation of PV is intense during this period, the frequency fluctuation is consistent with the trend of the daily net load curve. After the regulation, the frequency of the power distribution system is within the normal range.
Because of the different sensitivity coefficients of each node, the variation of the SOC of BESS for all the nodes are different. Nodes numbering 1–4 and 19–25 have small sensitivity coefficient, therefore these nodes are selected as the candidate nodes for frequency regulation. The gaps between voltage regulation and frequency regulation are evenly distributed to the BESSs of the candidate nodes. Therefore, SOC variation of candidate nodes BESSs fluctuate greatly.
In order to show the dynamic analysis of our proposed coordinated control algorithm, we take a time point of 9:27:30, which is shown with black dot in Figure 10, Figure 11 and Figure 12. At this time point, the voltage fluctuation of Node 18 is the largest which reached 1.109 p.u., and the frequency deviation of distribution network reached 0.3402 Hz. Both of the voltage and frequency exceed the permissible range, which are needed to be regulated. According to the calculation of Section 3.2 and Section 3.3, the required power for the voltage and frequency regulation are 1065.68kW and 2902.68kW, respectively. As the power required for frequency regulation is larger than the required for voltage regulation, the total power of 2902.68kW was chose, and the difference part of 1837kW was allocated to the nodes with lower voltage sensitivity coefficient according to Section 3.4. After regulating, the frequency deviation of the distribution network reduced to 0.153Hz, and the voltage of Node 18 reduced to 1.06 p.u., the frequency fluctuation reduced 55.03% and the voltage reduced 15.32%, both of them are within a permissible range. In Lee’s algorithm, the BESSs are operated in a sequential order for the voltage and frequency regulation, and total power of 3968.36kW will be charged.
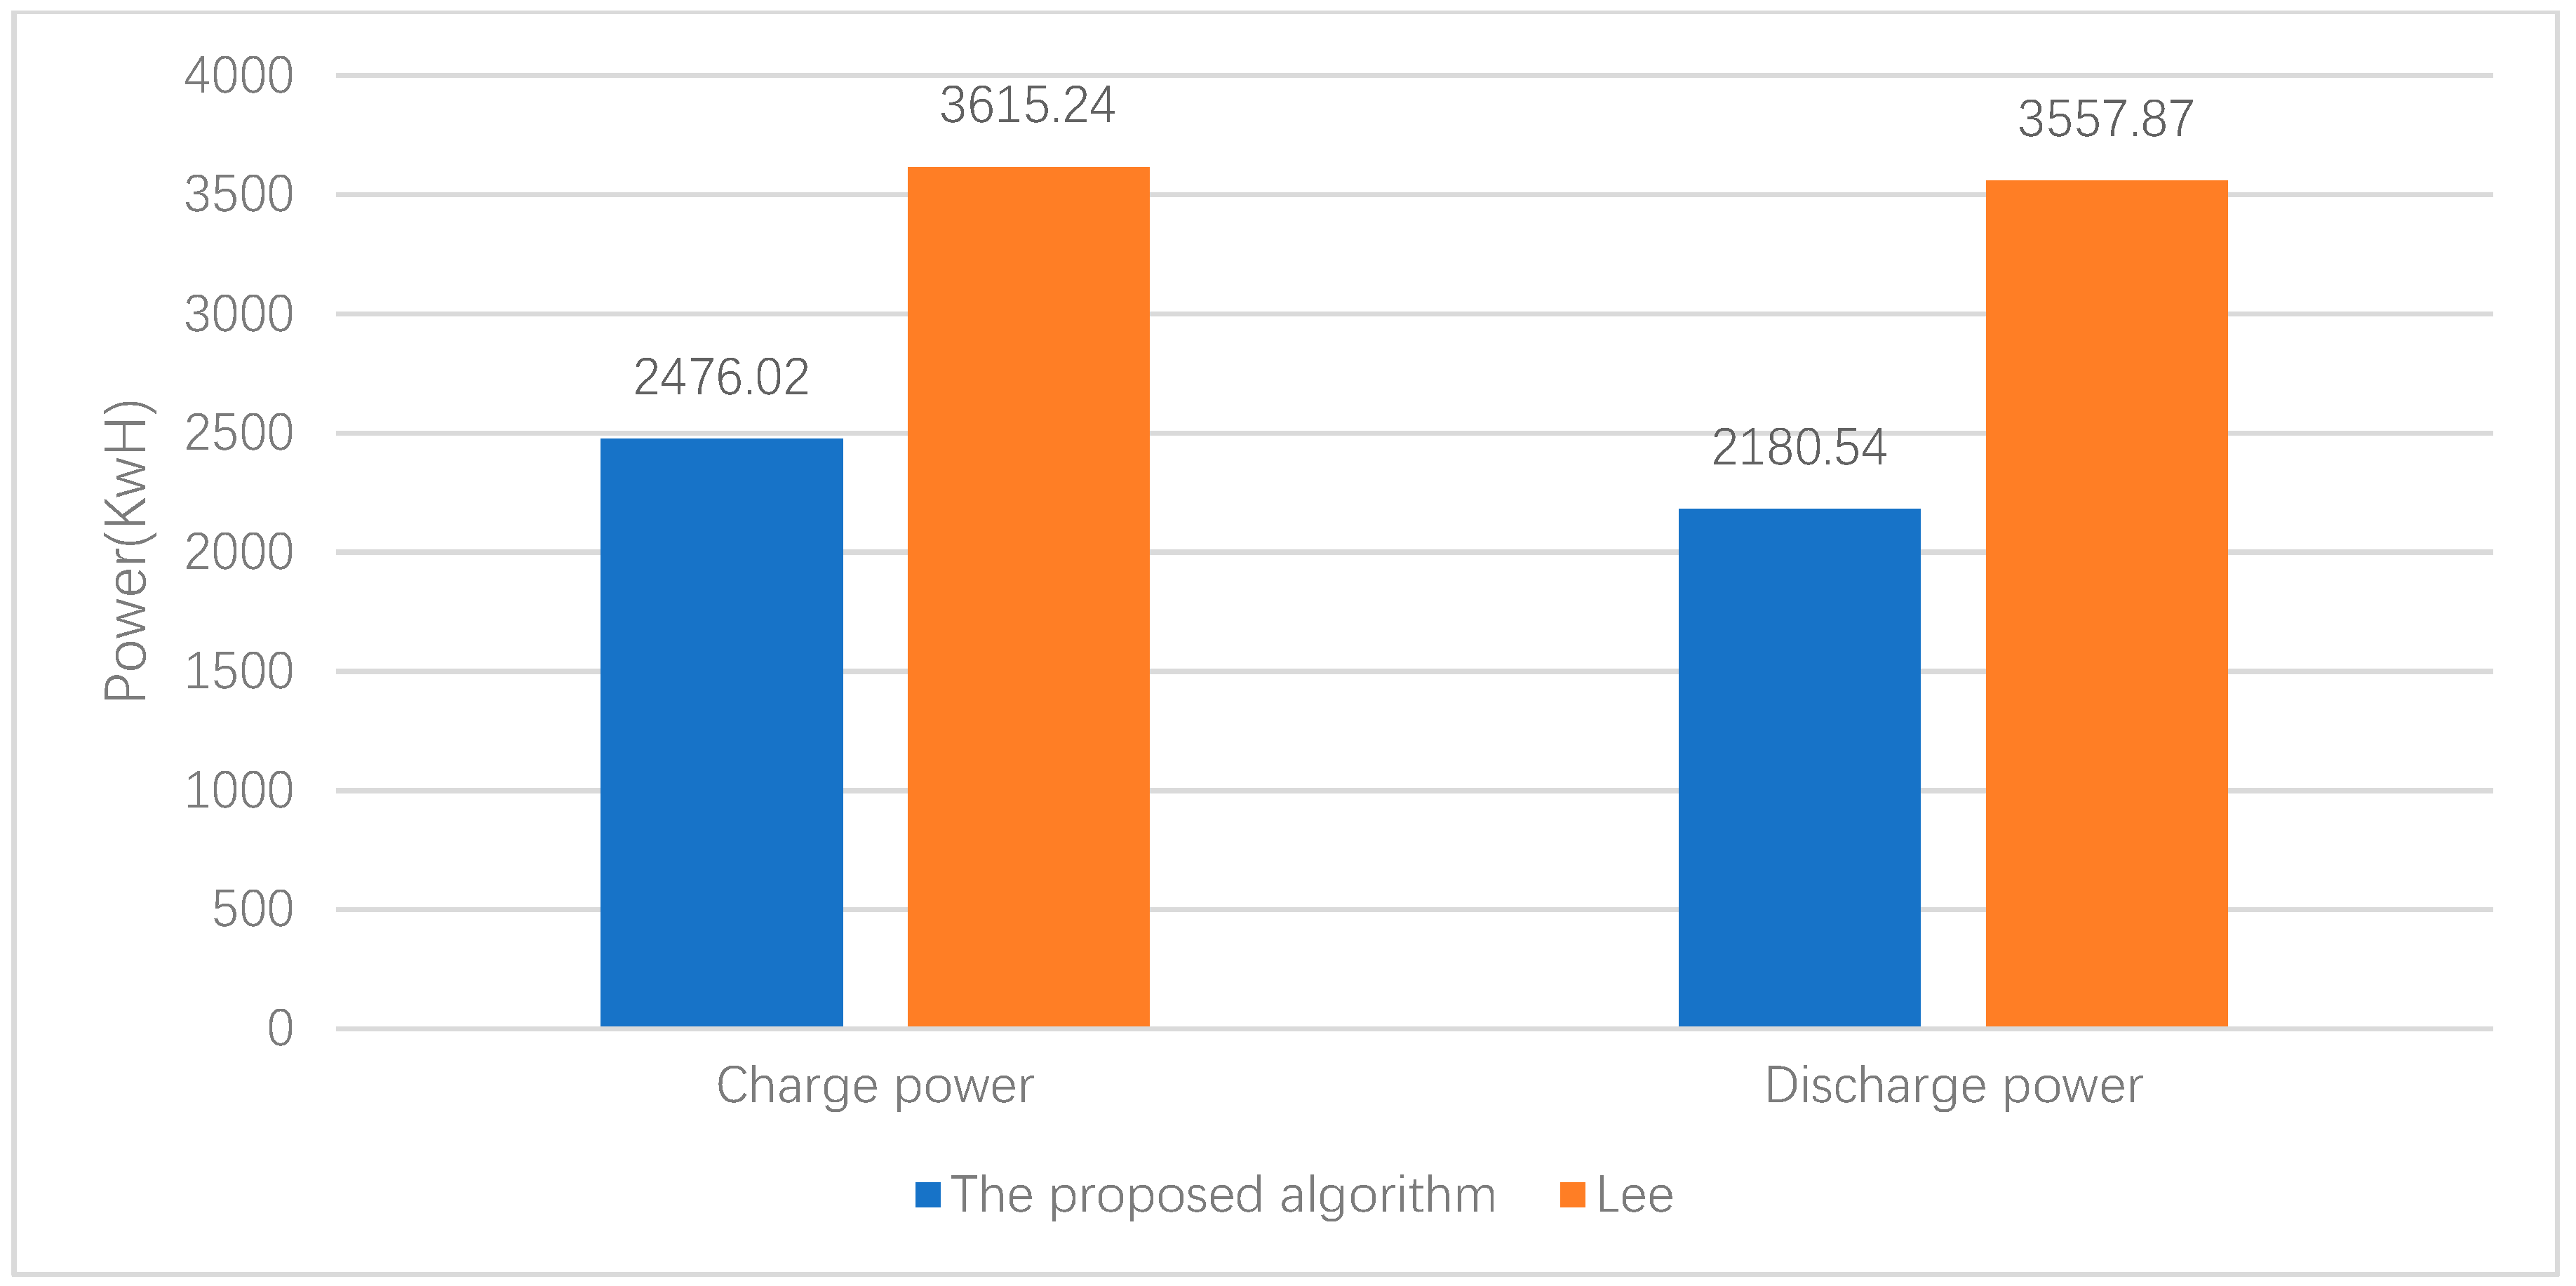
The proposed coordinated control algorithm is compared with Lee algorithm [29]. Figure 13 shows the total number of BESSs charging and discharging cycles, and Figure 14 shows the total BESS charging and discharging power. The number of charging cycles of Lee algorithm is 2312 and the number of discharges cycles is 7130. The number of charging and discharging cycles of proposed algorithm is 1597 and 3470, respectively. The number of charging cycles is reduced by 30.86% and the number of discharging cycles is reduced by 51.33%. As shown in Figure 14, the total charging power of the Lee algorithm is 3615.24 kWh and the discharge power is 3557.87 kWh. The charging power of the proposed algorithm is 2476.02 kWh, which is reduced by 31.51% compared to the LEE algorithm. The discharge power of the proposed algorithm is 3557.87 kWh, which is reduced by 38.71%.
5. Conclusions
In this paper, a novel coordinated control algorithm of distributed BESSs is proposed, which regulates the voltage and frequency deviation of the power distribution system by coordinated control of charging and discharging of multiple BESSs. The proposed algorithm regulates the maximum voltage of the power system from 1.136 p.u. to 1.0995 p.u., and regulates the maximum frequency of the power system from 50.3653 Hz to 50.1598 Hz. In comparison with Lee algorithm, the total number of charging and discharging cycles and total power of BESSs are reduced. The results show that the proposed algorithm improves the life time of BESSs by reducing the total number of charging and discharging cycles. The BESSs can be better utilized for the voltage and frequency deviation regulation in the distribution system.
Author Contributions
Conceptualization, Y.H.; methodology, Y.H.; formal analysis, X.S.; investigation, X.S.; data curation, Y.H.; writing—original draft preparation, Y.H.; writing—review and editing, Q.X. and Y.D.; supervision, Q.X.; project administration, Q.X.; funding acquisition, Q.X.
Funding
This research was funded by Zhejiang Provincial Natural Science Foundation of China under Grant No. LQ18E070002.
Conflicts of Interest
The authors declare that there are no conflicts of interest regarding the publication of this paper.
Appendix A
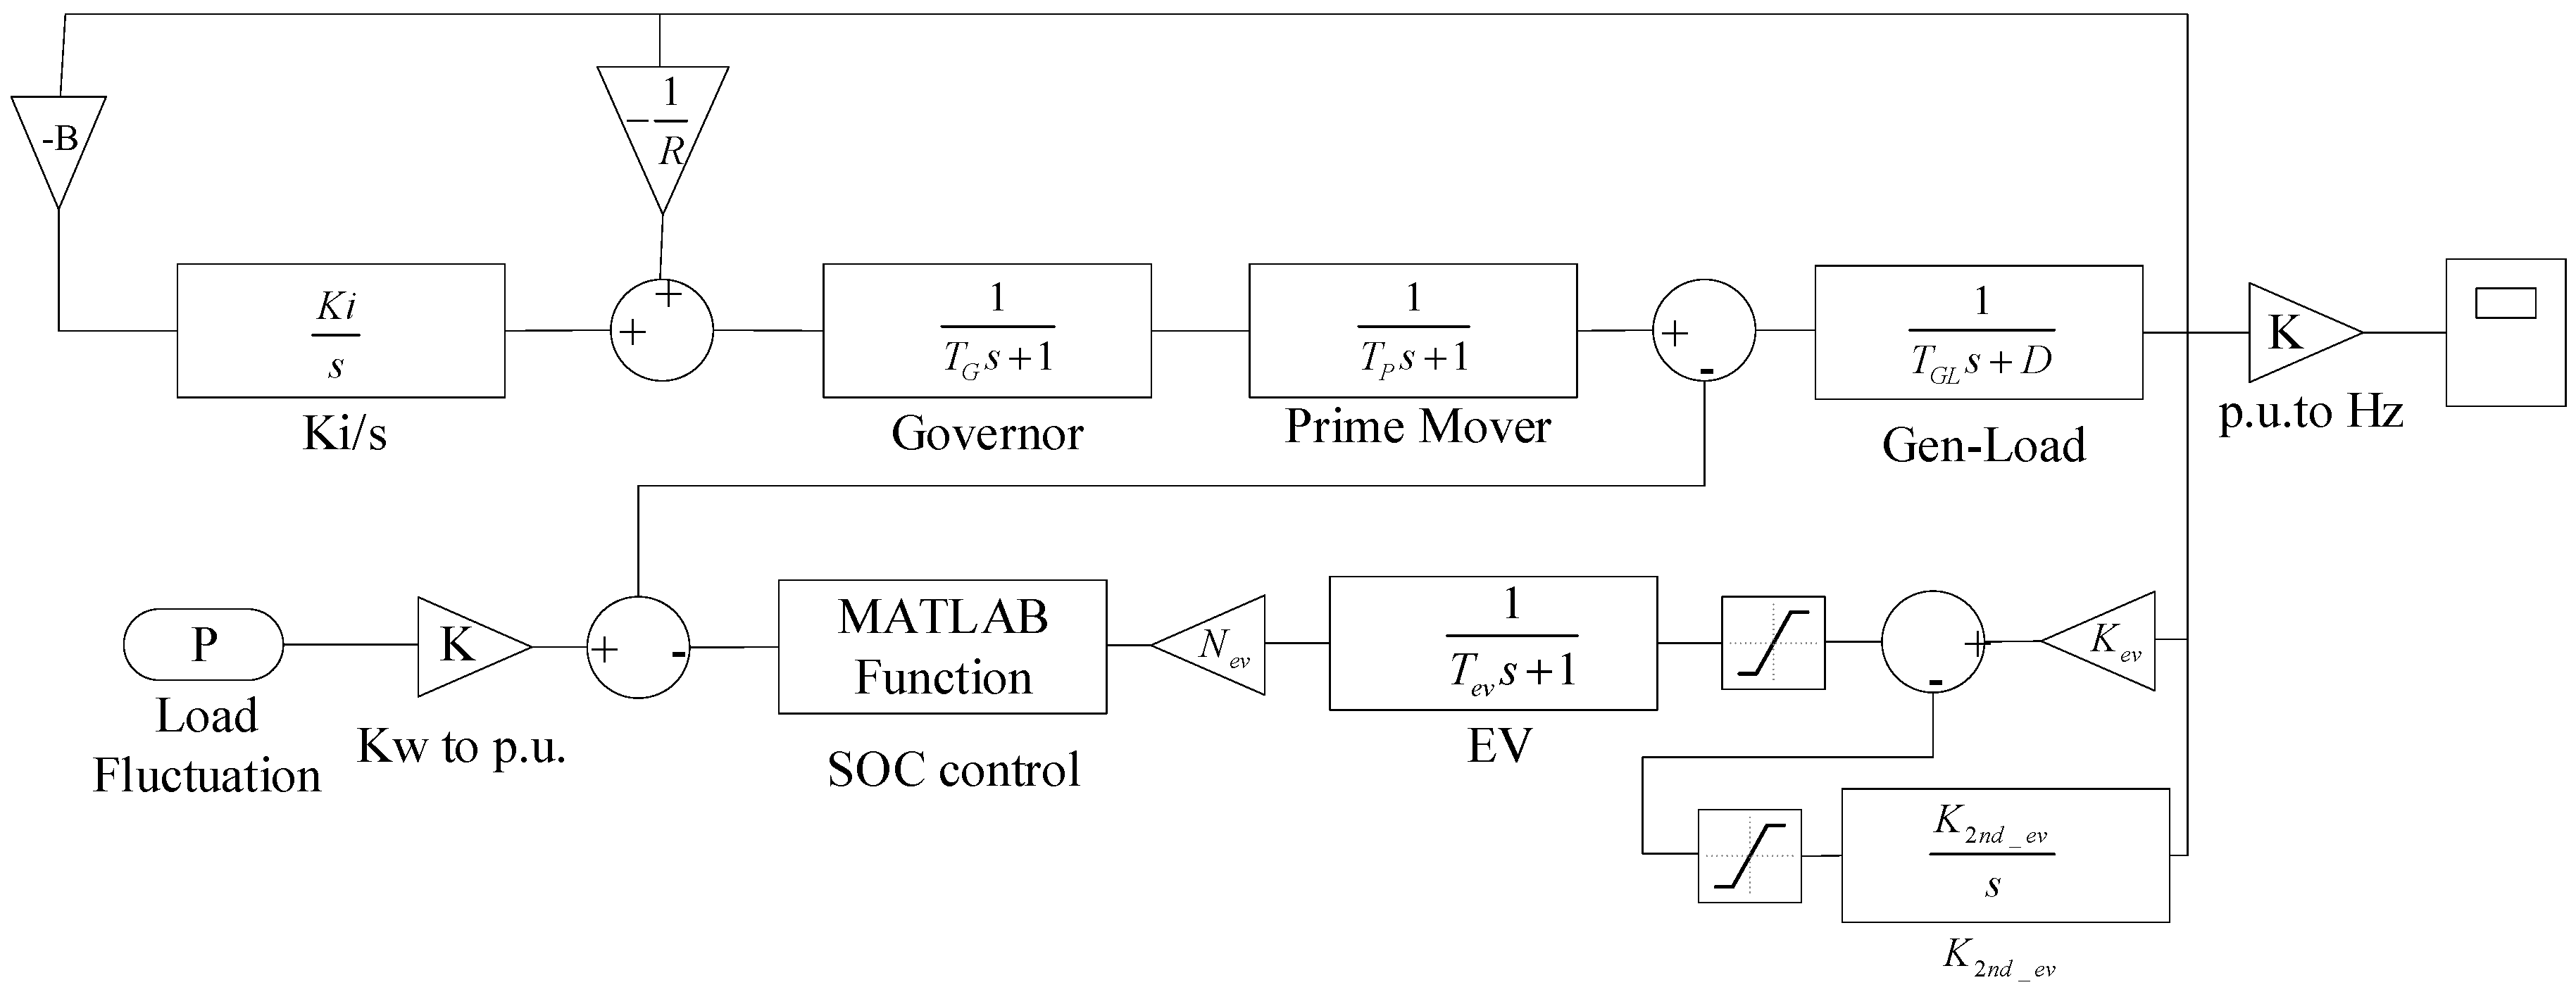
Figure A1 shows the diagram of frequency regulation model through Simulink. We add a model of energy storage equipment to participate in primary and secondary frequency modulation based on a typical single-area power system model. “Governor” and “Prime Mover” are governor and prime mover models respectively. “Gen-Load” is generator inertia and load damping model, modules “-1/R”, “-B” and “Ki/s” constitute the primary and secondary frequency modulation model of the generator set, and “P” is the system load fluctuation.
Figure A1.
Regulation control model of proposed algorithm.
References
- Wada, K.; Yokoyama, A. Load frequency control using distributed batteries on the demand side with communication characteristics. In Proceedings of the 2012 3rd IEEE PES Innovative Smart Grid Technologies Europe (ISGT Europe), Berlin, Germany, 14–17 October 2012; pp. 1–8. [Google Scholar]
- Hepbasli, A. A key review on exergetic analysis and assessment of renewable energy resources for a sustainable future. Renew. Sustain. Energy Rev. 2008, 12, 593–661. [Google Scholar] [CrossRef]
- Palmer, M.D.; Uehara, T.; Shigenobu, R.; Matayoshi, H.; Senjyu, T.; Datta, M. Suppression of power system voltage and frequency fluctuations by decentralized controllable loads. J. Renew. Sustain. Energy 2016, 8, 045905. [Google Scholar] [CrossRef]
- Liu, H.; Yang, Y.; Qi, J.; Li, J.; Wei, H.; Li, P. Frequency droop control with scheduled charging of electric vehicles. IET Gener. Transm. Distrib. 2017, 11, 649–656. [Google Scholar] [CrossRef]
- Hui, H.; Ding, Y.; Zheng, M. Equivalent Modeling of Inverter Air Conditioners for Providing Frequency Regulation Service. IEEE Trans. Ind. Electron. 2018, 66, 1413–1423. [Google Scholar] [CrossRef]
- Palensky, P.; Dietmar, D. Demand side management: Demand response, intelligent energy systems, and smart loads. IEEE Trans. Ind. Informat. 2011, 7, 381–388. [Google Scholar] [CrossRef]
- Long, C.; Ochoa, L.F. Voltage control of PV-rich LV networks: OLTC-fitted transformer and capacitor banks. IEEE Trans. Power Syst. 2016, 31, 4016–4025. [Google Scholar] [CrossRef]
- Ji, H.; Wang, C.; Li, P.; Zhao, J.; Song, G.; Ding, F.; Wu, J. A centralized-based method to determine the local voltage control strategies of distributed generator operation in active distribution networks. Appl. Energy 2018, 228, 2024–2036. [Google Scholar] [CrossRef]
- Liu, C.; Ma, X.; Zhou, M.; Wu, J.; Long, C. Electrical Power and Energy Systems An event-trigger two-stage architecture for voltage control in distribution systems. Int. J. Electr. Power Energy Syst. 2018, 95, 577–584. [Google Scholar] [CrossRef]
- Li, C.; Disfani, V.R.; Pecenak, Z.K.; Mohajeryami, S.; Kleissl, J. Optimal OLTC voltage control scheme to enable high solar penetrations. Electr. Power Syst. Res. 2018, 160, 318–326. [Google Scholar] [CrossRef]
- Yu, L.; Czarkowski, D.; De León, F. Optimal distributed voltage regulation for secondary networks with DGs. IEEE Trans. Smart Grid 2012, 3, 959–967. [Google Scholar] [CrossRef]
- Bedawy, A.; Yorino, N.; Mahmoud, K. Management of voltage regulators in unbalanced distribution networks using voltage/tap sensitivity analysis. In Proceedings of the 2018 International Conference on Innovative Trends in Computer Engineering (ITCE), Aswan, Egypt, 19–21 February 2018; pp. 363–367. [Google Scholar]
- Daratha, N.; Das, B.; Sharma, J. Coordination Between OLTC and SVC for Voltage Regulation in Unbalanced Distribution System Distributed Generation. IEEE Trans. Power Syst. 2014, 29, 289–299. [Google Scholar] [CrossRef]
- Mahmud, N.; Zahedi, A.; Rahman, M.S. An event-triggered distributed coordinated voltage control strategy for large grid-tied PV system with battery energy storage. In Proceedings of the 2017 Australasian Universities Power Engineering Conference (AUPEC), Melbourne, Australia, 19–22 November 2017. [Google Scholar]
- Tina, G.M.; Garozzo, D.; Siano, P. Scheduling of PV inverter reactive power set-point and battery charge/discharge profile for voltage regulation in low voltage networks. Int. J. Electr. Power Energy Syst. 2018, 107, 131–139. [Google Scholar] [CrossRef]
- Nayeripour, M.; Fallahzadeh-Abarghouei, H.; Waffenschmidt, E.; Hasanvand, S. Coordinated online voltage management of distributed generation using network partitioning. Electr. Power Syst. Res. 2016, 141, 202–209. [Google Scholar] [CrossRef]
- Zakariazadeh, A.; Homaee, O.; Jadid, S.; Siano, P. A new approach for real time voltage control using demand response in an automated distribution system. Appl. Energy 2014, 117, 157–166. [Google Scholar] [CrossRef]
- Liu, X.; Aichhorn, A.; Liu, L.; Li, H. Coordinated control of distributed energy storage system with tap changer transformers for voltage rise mitigation under high photovoltaic penetration. IEEE Trans. Smart Grid 2012, 3, 897–906. [Google Scholar] [CrossRef]
- Akhil, A.A.; Huff, G.; Currier, A.B.; Kaun, B.C.; Rastler, D.M.; Chen, S.B.; Cotter, A.L.; Bradshaw, D.T.; Gauntlett, W.D. DOE/EPRI 2013 Electricity Storage Handbook in Collaboration with NRECA; Sandia National Laboratories: Albuquerque, NM, USA, 2013.
- Mercier, P.; Cherkaoui, R.; Oudalov, A. Optimizing a Battery Energy Storage System for Frequency Control Application in an Isolated Power System. IEEE Trans. Power Syst. 2009, 24, 1469–1477. [Google Scholar] [CrossRef]
- Oudalov, A.; Chartouni, D.; Ohler, C. Optimizing a Battery Energy Storage System for Primary Frequency Control. IEEE Trans. Power Syst. 2007, 22, 1259–1266. [Google Scholar] [CrossRef]
- Singh, B.; Hussain, A. Application of Battery Energy Storage System (BESS) in Voltage Control and Damping of Power Oscillations. In Proceedings of the 2010 5th International Conference on Industrial and Information Systems, Mangalore, India, 29 July–1 August 2010; 514–519; pp. 514–519. [Google Scholar]
- Serban, I.; Teodorescu, R.; Marinescu, C. Energy storage systems impact on the short-term frequency stability of distributed autonomous microgrids, an analysis using aggregate models. IET Renew. Power Gener. 2013, 7, 531–539. [Google Scholar] [CrossRef]
- Papic, I. Simulation Model for Discharging a Lead-Acid Battery Energy Storage System for Load Leveling. IEEE Trans. Energy Convers. 2006, 21, 608–615. [Google Scholar] [CrossRef]
- Wang, Q.; Choi, S.S. The Design of Battery Energy Storage System in a Unified Power-Flow Control Scheme. IEEE Trans. Power Deliv. 2008, 23, 1015–1024. [Google Scholar] [CrossRef]
- Wei, Z.; Moon, B.Y.; Joo, Y.H. Smooth Wind Power Fluctuation Based on Battery Energy Storage S ystem for Wind Farm. J. Electr. Eng. Technol. 2014, 9, 2134–2141. [Google Scholar] [CrossRef]
- Li, X.; Hui, D.; Lai, X. Battery Energy Storage Station (BESS)-Based Smoothing Control of Photovoltaic (PV) and Wind Power Generation Fluctuations. IEEE Trans. Sustain. Energy 2013, 4, 464–473. [Google Scholar] [CrossRef]
- Serban, I.; Marinescu, C. Control Strategy of Three-Phase Battery Energy Storage Systems for Frequency Support in Microgrids and with Uninterrupted Supply of Local Loads. IEEE Trans. Power Electron. 2014, 29, 5010–5020. [Google Scholar] [CrossRef]
- Lee, S.-J.; Kim, J.-H.; Kim, C.-H.; Kim, S.-K.; Kim, E.-S.; Kim, D.-U.; Mehmood, K.K.; Khan, S.U. Coordinated Control Algorithm for Distributed Battery Energy Storage Systems for Mitigating Voltage and Frequency Deviations. IEEE Trans. Smart Grid 2016, 7, 1713–1722. [Google Scholar] [CrossRef]
- Rebours, Y.G.; Kirschen, D.S.; Trotignon, M.; Rossignol, S. A Survey of Frequency and Voltage Control Ancillary Services—Part I: Technical Features. IEEE Trans. Power Syst. 2007, 22, 350–357. [Google Scholar] [CrossRef]
- Gordijn, J.; Akkermans, H. Designing and Evaluating E-Business Models. IEEE Intell. Syst. 2001, 16, 11–17. [Google Scholar] [CrossRef]
- Teng, F.; Strbac, G. Business cases for energy storage with multiple service provision. J. Mod. Power Syst. Clean Energy 2016, 4, 615–625. [Google Scholar] [CrossRef]
- Siano, P.; Sarno, D. Assessing the benefits of residential demand response in a real time distribution energy market. Appl. Energy 2016, 161, 533–551. [Google Scholar] [CrossRef]
- Sidhu, A.S.; Pollitt, M.G.; Anaya, K.L. A social cost benefit analysis of grid-scale electrical energy storage projects: A case study. Appl. Energy 2018, 212, 881–894. [Google Scholar] [CrossRef]
- Rebours, Y.G.; Kirschen, D.S.; Trotignon, M.; Rossignol, S. A survey of frequency and voltage control ancillary services—part II: Economic features. IEEE Trans. Power Syst. 2007, 22, 358–366. [Google Scholar] [CrossRef]
- Arcuri, B.; Spataru, C.; Barrett, M. Evaluation of ice thermal energy storage (ITES) for commercial buildings in cities in Brazil. Sustain. Cities Soc. 2017, 29, 178–192. [Google Scholar] [CrossRef]
- Smith, J.G.; Hensley, G.; Ray, L. IEEE Recommended Practice for Monitoring Electric Power Quality. IEEE Std. 1995, 1159–1995. [Google Scholar]
- Demirok, E.; Gonz, P.C.; Frederiksen, K.H.B.; Sera, D.; Rodriguez, P.; Teodorescu, R. Local Reactive Power Control Methods for Overvoltage Prevention of Distributed Solar Inverters in Low-Voltage Grids. IEEE J. Photovoltaics 2011, 1, 174–182. [Google Scholar] [CrossRef]
- Wang, S.; Chen, S.; Ge, L.; Wu, L. Distributed Generation Hosting Capacity Evaluation for Distribution Systems Considering the Robust Optimal Operation of OLTC and SVC. IEEE Trans. Sustain. Energy 2016, 7, 1111–1123. [Google Scholar] [CrossRef]
- Xie, Q.; Hara, R.; Kita, H.; Tanaka, E. Coordinated control of OLTC and multi-CEMSs for overvoltage prevention in power distribution system. IEEJ Trans. Electr. Electron. Eng. 2017, 12, 692–701. [Google Scholar] [CrossRef]
Figure 1.
Battery energy storage systems (BESS) coordination control architecture model.

Figure 2.
Battery energy storage systems (BESS) model.

Figure 3.
State of charge (SOC) controlling block diagram.

Figure 4.
Battery energy storage systems (BESS) voltage regulation block diagram.

Figure 5.
Battery energy storage systems (BESS) frequency regulation block diagram.

Figure 6.
Battery energy storage systems (BESS) coordination control algorithm flow chat.

Figure 7.
IEEE 33 nodes power distribution system.

Figure 8.
State of charge (SOC) curve of a BESS.

Figure 9.
Daily load and photovoltaic power curves.

Figure 10.
Voltage curve before voltage regulation.

Figure 11.
Voltage curve after voltage regulation.

Figure 12.
Frequency deviation curve obtained with proposed coordinated control algorithm.

Figure 13.
Comparison of charge and discharge times.
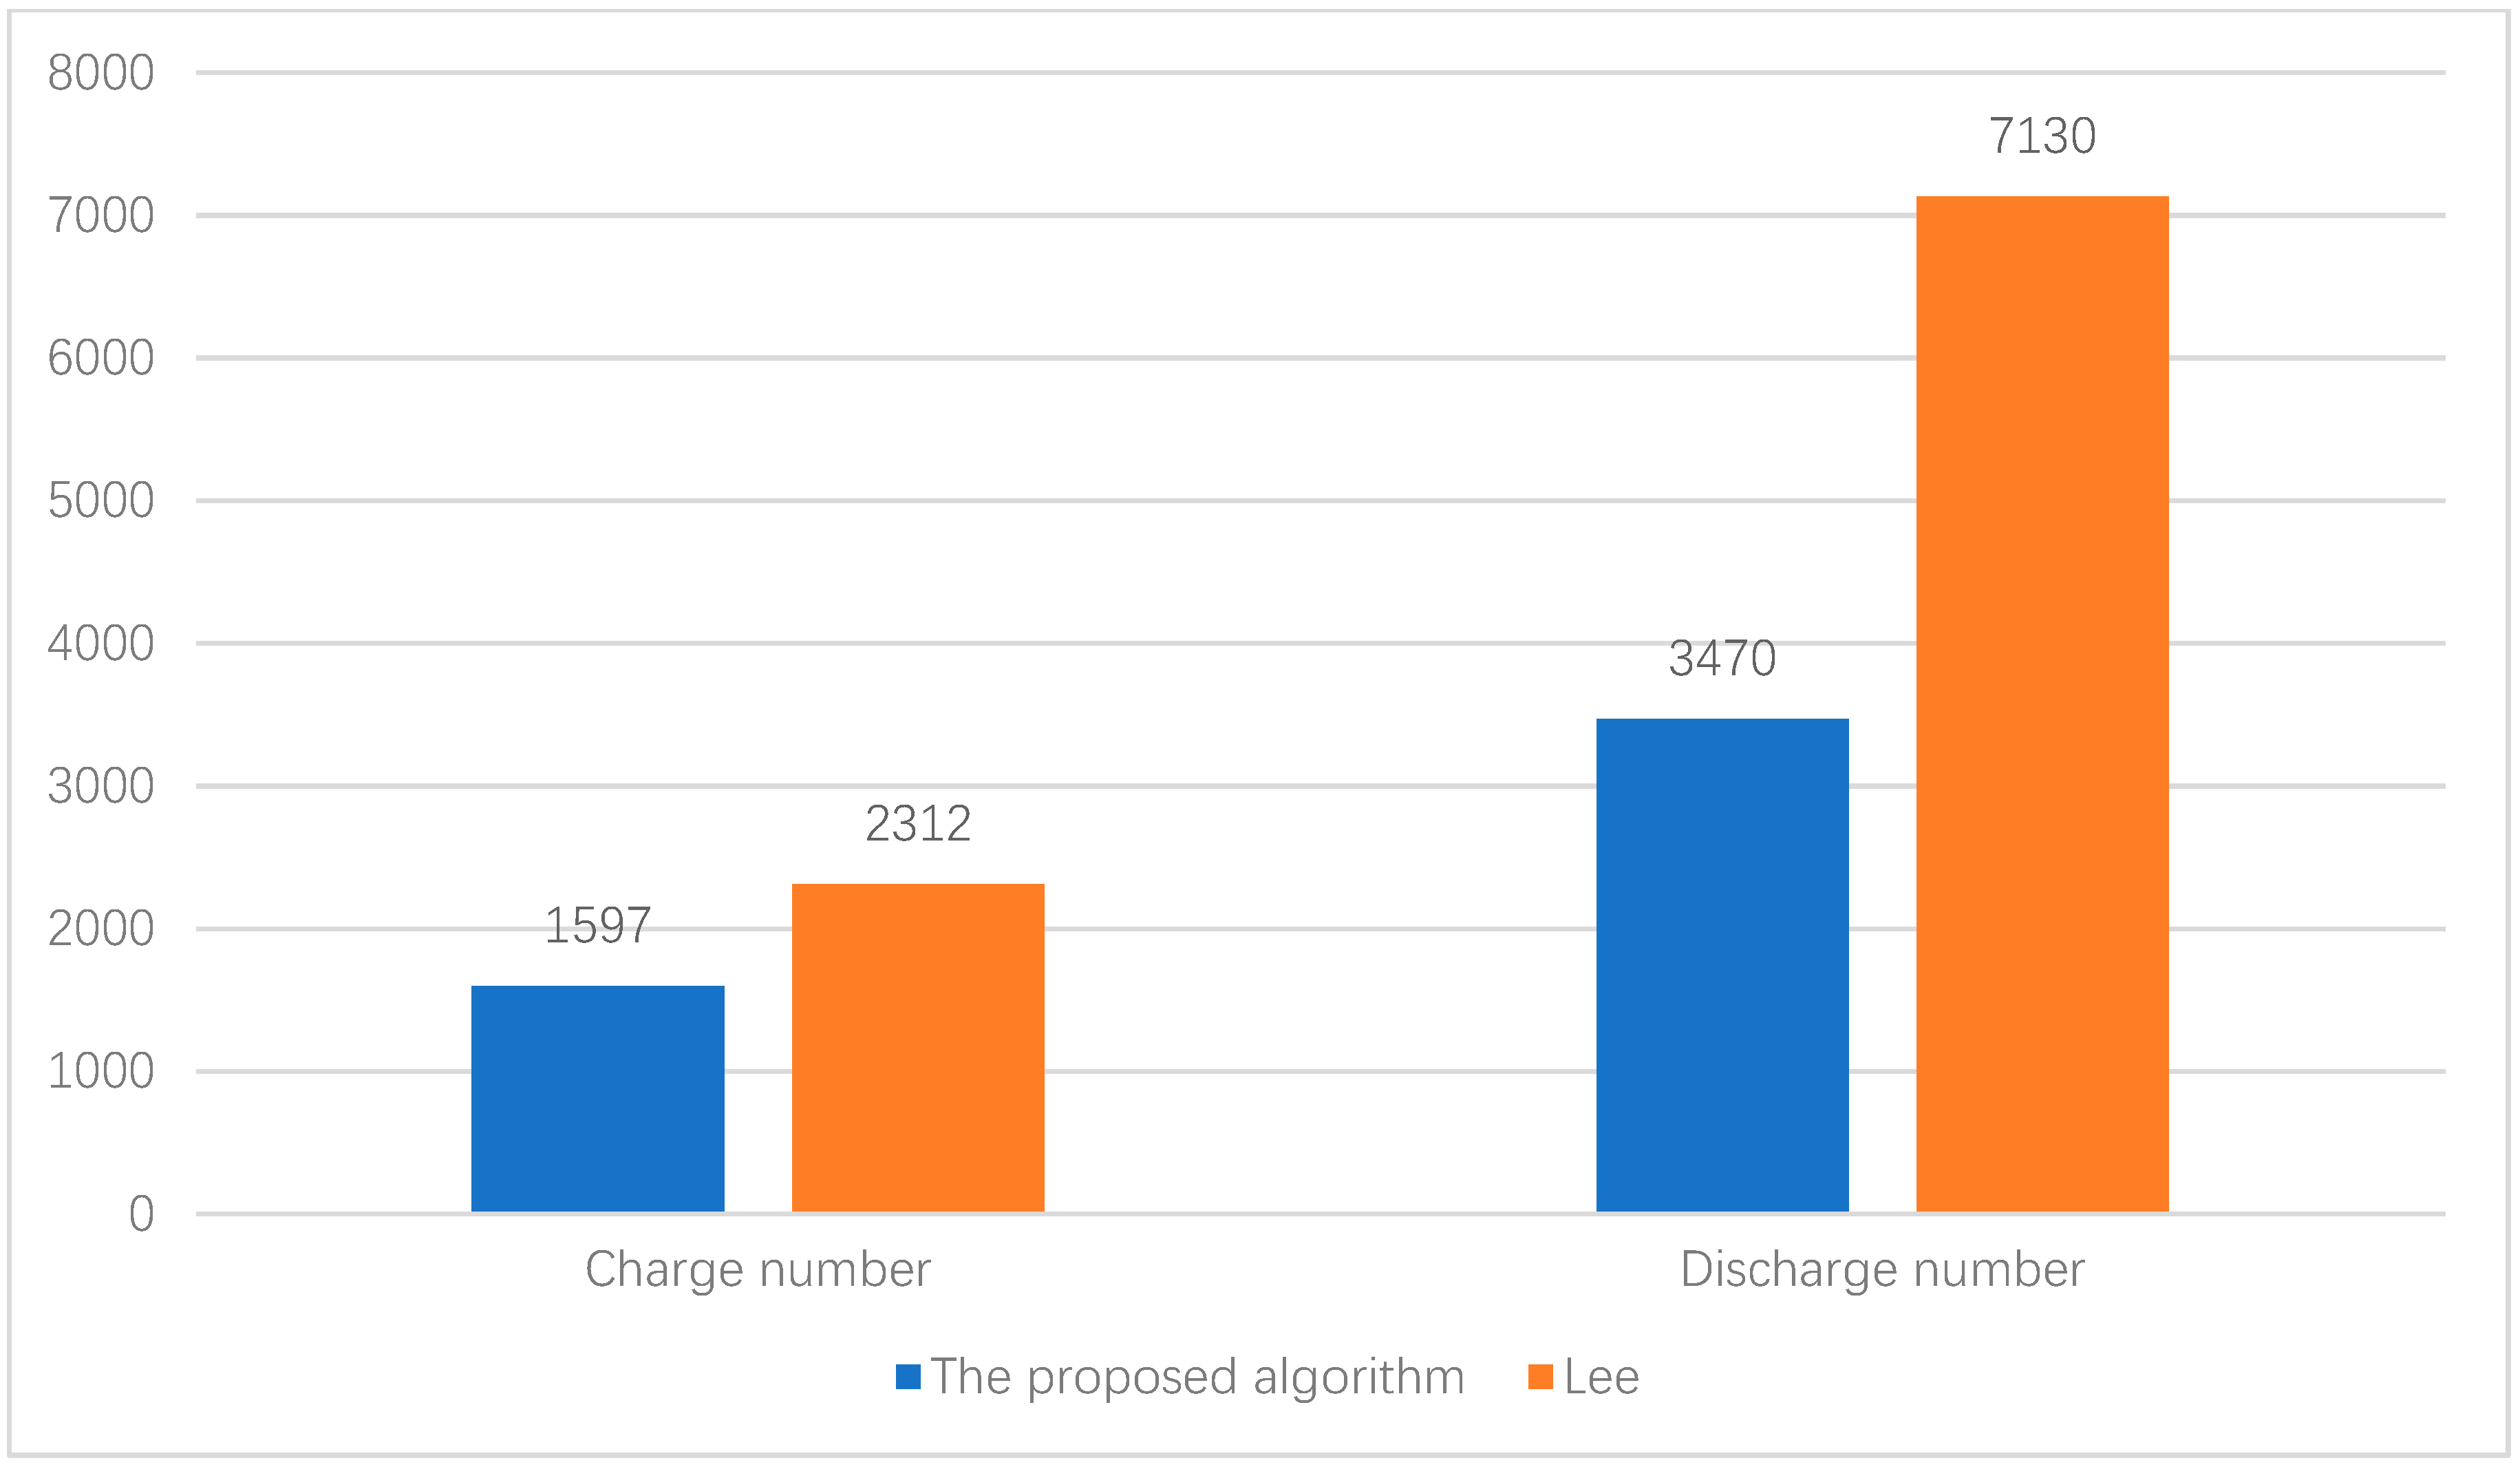
Figure 14.
Total charge and discharge power comparison.

© 2019 by the authors. Licensee MDPI, Basel, Switzerland. This article is an open access article distributed under the terms and conditions of the Creative Commons Attribution (CC BY) license (http://creativecommons.org/licenses/by/4.0/).
Share and Cite
MDPI and ACS Style
Hua, Y.; Shentu, X.; Xie, Q.; Ding, Y. Voltage/Frequency Deviations Control via Distributed Battery Energy Storage System Considering State of Charge. Appl. Sci. 2019, 9, 1148. https://doi.org/10.3390/app9061148
AMA Style
Hua Y, Shentu X, Xie Q, Ding Y. Voltage/Frequency Deviations Control via Distributed Battery Energy Storage System Considering State of Charge. Applied Sciences. 2019; 9(6):1148. https://doi.org/10.3390/app9061148
Chicago/Turabian StyleHua, Yongzhu, Xiangrong Shentu, Qiangqiang Xie, and Yi Ding. 2019. "Voltage/Frequency Deviations Control via Distributed Battery Energy Storage System Considering State of Charge" Applied Sciences 9, no. 6: 1148. https://doi.org/10.3390/app9061148
Note that from the first issue of 2016, this journal uses article numbers instead of page numbers. See further details here.