Resilient Modulus—Physical Parameters Relationship of Improved Red Clay by Dynamic Tri-Axial Test


1
School of Civil Engineering, Hefei University of Technology, Hefei 230009, China
2
State Key Laboratory of Geomechanics and Geotechnical Engineering, Institute of Rock and Soil Mechanics, Chinese Academy of Sciences, Wuhan 430071, China
3
School of Resources and Safety Engineering, Central South University, Changsha 410083, China
4
State Key Laboratory of Explosion Science and Technology (Beijing Institute of Technology), Beijing 100081, China
*
Author to whom correspondence should be addressed.
Appl. Sci. 2019, 9(6), 1155; https://doi.org/10.3390/app9061155
Submission received: 4 January 2019
/
Revised: 27 February 2019
/
Accepted: 7 March 2019
/
Published: 19 March 2019
(This article belongs to the Special Issue Achievements and Prospects of Functional Pavement: Materials and Structures)
Abstract
:As one of the important parameters used in the analysis and design of subgrade, resilient modulus is directly related to the safety, economic and life time of subgrade structure. In this paper, the characteristics of resilient modulus of improved red clay at different additive content were studied through conducting laboratory repeated load tri-axial tests. The influence of stress state, moisture content, compactness, additive types, and content on resilient modulus were analyzed. In addition, the regression analysis of resilient modulus, was carried out referencing three existing prediction models. The results showed that the Andrei model can better fit the resilient modulus of red clay and have a higher determination coefficient. However, the Andrei model and other existing prediction models, reflect only the influence of stress state on resilient modulus, without considering the influence of moisture content, compactness and additive content. Therefore, based on the Andrei model, a comprehensive prediction model, which can reflect the influence of compactness, moisture content, additive content, and stress state on resilient modulus was introduced. Good agreement between the regression results and the measured ones demonstrated the integrative ability of the introduced model.
1. Introduction
With the development of the national economy, high speed and heavy loads are inevitably the developing trend of the traffic line. In this context, static design methods will not be able to meet the increasing requirements of subgrade and pavement materials for strength and deformation. Therefore, more attention should be paid to dynamic and creep characteristics [1,2,3,4,5,6,7,8]. Soils and rocks are natural subgrade and pavement materials in the flood plain. When these are stressed, they go through stages of deformation such as elastic deformation, ductile deformation and fracture [9,10,11,12,13,14,15,16,17,18,19,20]. As a special soil, red clay is widespread in China and mainly located in the humid and rainy southern region. At present, land use is becoming more and more serious. It is the development direction and inevitable trend to make full use of the local red clay to fill the subgrade. However, the stability of the clay subgrade is particularly prominent because of the adverse factors, such as rainy weather and heavy load [21,22,23,24]. In addition, red clay should not be directly used as subgrade filling, due to the high natural moisture content and poor stability. It is necessary to include additives to improve the mechanical properties of red clay, so as to meet the filling requirements. At present, there have been some research on the mechanical properties of the improved red clay with additives, but the stability of the red clay subgrade, under dynamic loading is seldom involved [25,26,27,28,29].
The concept of dynamic resilient modulus of subgrade soil was introduced by Seed et al. [30], who studied the relationship between the resilient (elastic and reversible) characteristics of subgrade soil and the fatigue damage of asphalt pavement. In fact, the tensile stress and cracks, caused by the accumulation of permanent strains are the major cause of the damage of the subgrade and pavement materials [31,32,33,34,35]. Therefore, flexible pavement and resilient modulus values can replace compaction degree(CD) and California bearing ratio (CBR) values to reflect the stress-strain relationship of pavement structures under repeated vehicle load. A resilient modulus is one of the main parameters characterizing the mechanical properties of subgrade soils and can well-reflect the stability of subgrade soil [32]. However, it is difficult to apply and popularize a resilient modulus in practical engineering because of the test operation’s complexity and high cost of tests. Therefore, it is necessary to establish models for the prediction of resilient modulus. Moreover, the prediction models can provide a reliable basis for the selection of material parameters in the structure design [36,37,38,39,40,41]. For a long time, many scholars at home and abroad have deeply explored the main factors affecting the resilient modulus of subgrade soil and established many prediction models, based on different factors, such as stress state and basic physical properties of soil [42,43,44,45,46,47]. According to the different stress variables, prediction models can be divided into three categories: Single factor model related to mass stress, a composite model related to shear stress and mass stress, and a composite model related to shear stress and confining pressure [48,49,50,51,52,53,54,55,56,57,58,59,60]. However, most of existing prediction models only consider the influence of stress state on the resilient modulus [42], and rarely consider the influence of compactness, moisture content, and additive content. They are generally linear fitting [35,36,37,38], or combine a single physical parameter to predict the resilient modulus [43,44].
In the design of subgrade structure, the resilient modulus is different, according to the subgrade grade. In this paper, the red clay in Anhui, China was chosen to be improved by two types of additives. Through laboratory repeated load tri-axial tests, the influence of stress state, moisture content, compactness, additive type, and content on resilient modulus were analyzed. According to the research experience [61,62,63,64,65,66], based on existing prediction models, which fail to incorporate the influence of moisture content, compactness and additive content, a comprehensive prediction model which can reflect the influence of compactness, moisture content, additive content and stress state on resilient modulus was introduced. To conclude the performance of the introduced model, the predicted and the measured resilient modulus were paralleled. The parallel found the introduced model capable of capturing the characteristics of the measured resilient modulus [54]. Bycomparison and verification, it was found that the proposed model predicts the modulus of resilience of the improved clay with additives of various contents, indicating that it has some potential in engineering applications.
2. Material Properties and Testing Method
2.1. Materials
The basic properties of the red clay used in the test are shown in Table 1. In order to analyze the influence of stress state, moisture content, compactness, additive type and content on the resilient modulus of red clay, samples prepared at different moisture content (OMC minus 3%, OMC, OMC plus 3%), different compactness of P (91%, 93%, 95%), different additive types (ordinary Portland cement, lime) and content (3%, 6%, 9%) were tested.
The chemical and mineral compositions of the red clay, obtained from X-ray diffraction measurements, are summarized in Table 2, and Table 3, respectively. It is indicated that the mineral compositions include mainly kaolinite (i.e., Al2Si2O5(OH)4), goethite (i.e., FeO(OH)), and diaspore (i.e., SiO2). The amount of kaolinite is 60.87%. Therefore, kaolinite dominates the mineral compositions of the red clay.
Proctor compaction tests were carried out to determine maximum dry densities and optimum moisture contents of the improved red clay samples which are presented in Table 4. Based on the compaction test results, the samples were prepared at the targeted compactness and moisture content.
The samples were prepared according to China highway geotechnical test code (JTGE40-2007). The samples were prepared as follows: Drying, grinding, mixing with additive, curing, and preparation. Three parallel samples were prepared for each group with different admixtures. The samples were placed in a standard curing room with 25 ± 2 °C for 7 days. For each sample, the difference between the actual and the targeted moisture contents is less than 1%, and that difference is less than 2% for compactness.
2.2. Testing Method
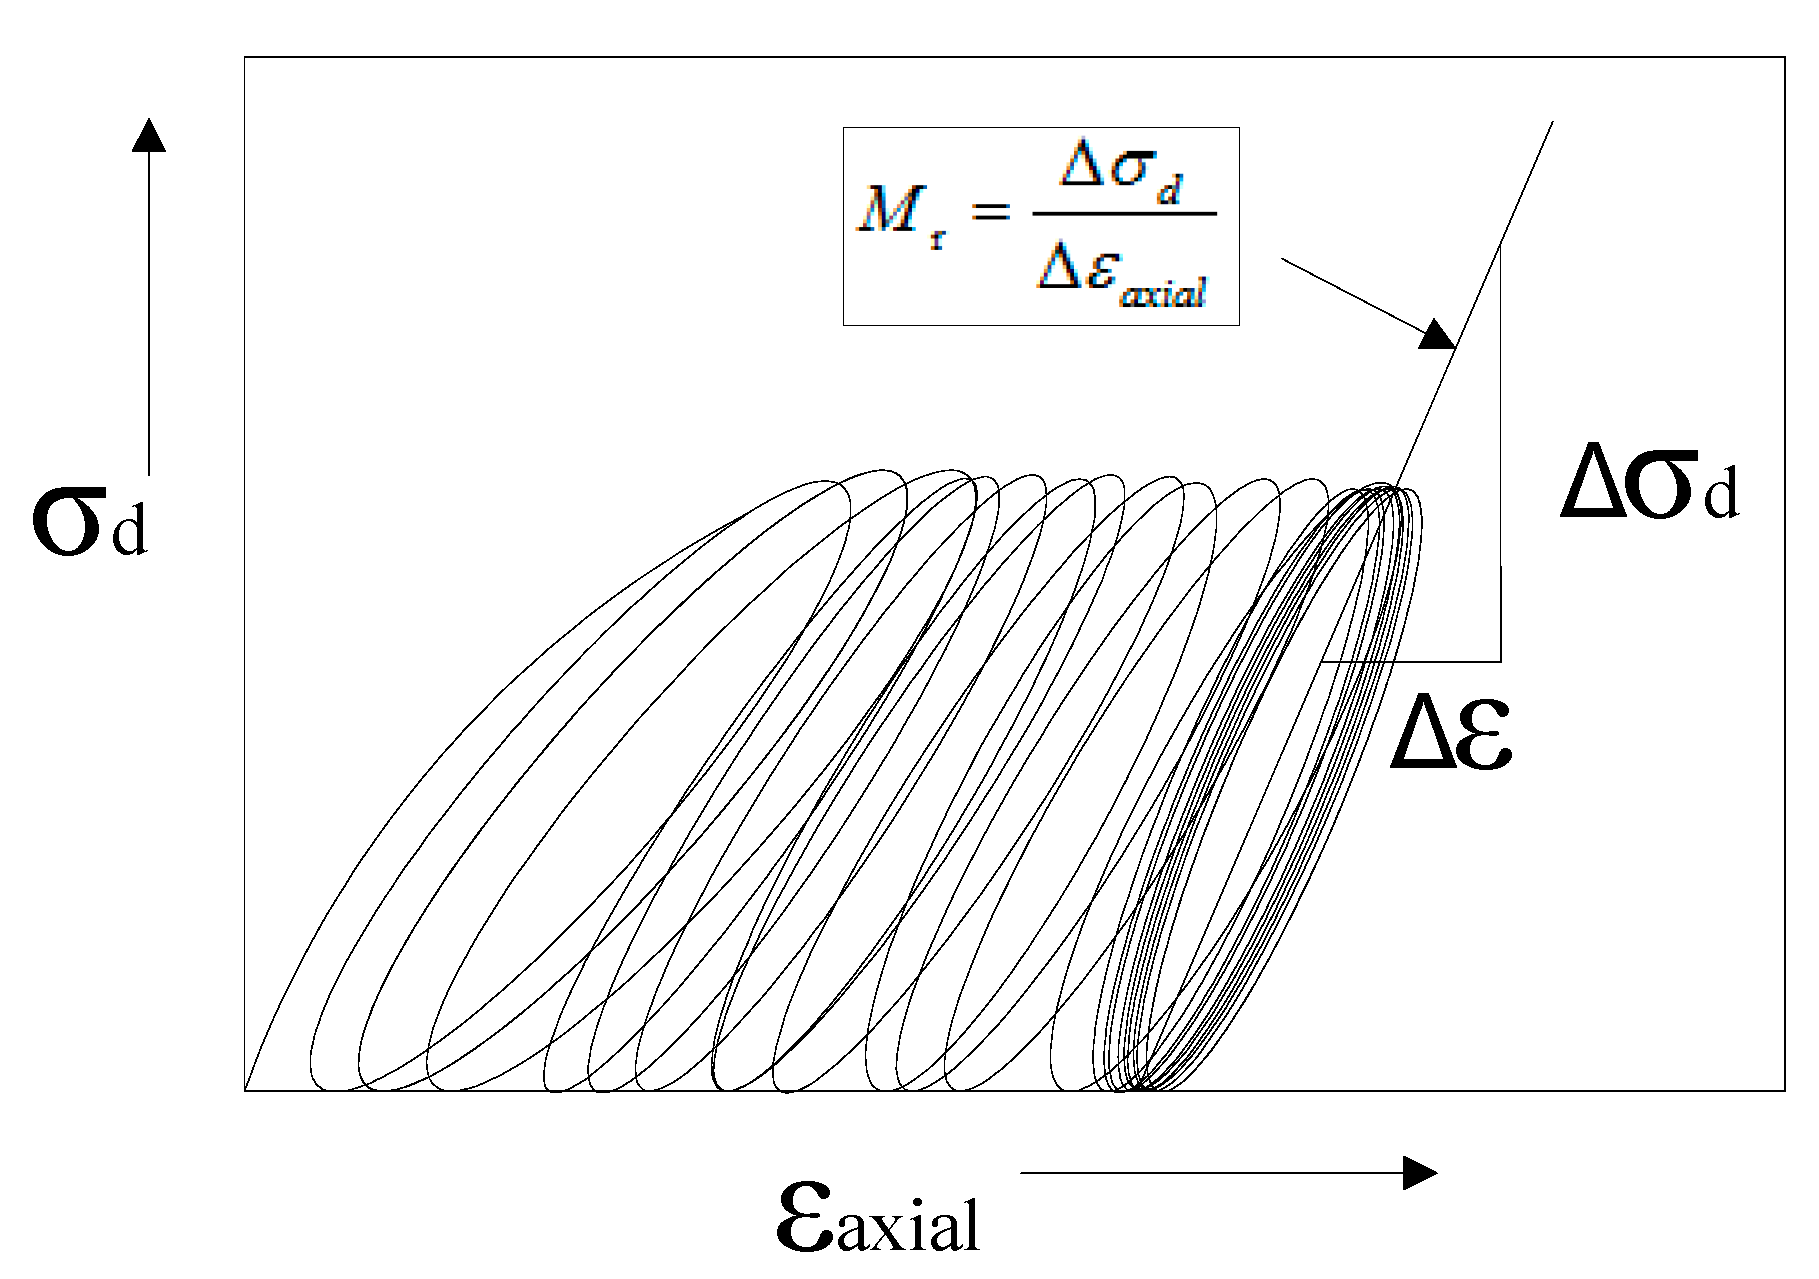
In the test, the resilient modulus values were measured by the dynamic servo system UTM400. The loading waveform is half-sine waveform and the load frequency is 1 Hz. The holding time and interval time are 0.1 s, and 0.9 s, respectively. The repeated load and resilient strain were measured by load sensor and displacement sensor respectively in the dynamic tri-axial chamber. The adopted stress loading sequence of subgrade soil was obtained from the international research results [67,68,69,70]. It is necessary to preload the samples before the test to simulate the history of subgrade stress during construction, eliminate the influence of load difference factors, such as initial loading and repeated loading and reduce the variability of test results. In addition, preloading can eliminate the possible bad contact between the bottom of the samples and the pressure plate to improve the accuracy of the test [70]. A dynamic resilient modulus is defined as the ratio of repeated axial deviatoric stress to the recoverable axial strain as Figure 1. The cyclic number of loading is 100, and the average resilient deformation during the last 5 cycles, for each magnitude of repeated loading, was recorded. The dynamic resilient modulus of samples was calculated according to Equation (1).
where = deviatoric stress (), and = major and minor principal stresses, and = recoverable axial strain.
3. Analysis of Results
3.1. Influence of Stress State on Resilient Modulus
Figure 2 shows the variation of resilient modulus with deviatoric stress and bulk stress of the improved red clay. It can be seen from Figure 2 that for the improved red clay, when the confining pressure is constant, the resilient modulus decreases with an increase in deviatoric stress; when the deviatoric stress is constant, the resilient modulus increases with an increase in confining pressure. At the same time, in the repeated load triaxial test, confining pressure, = bulk stress, octahedral shear stress is . Therefore, the effects of confining pressure and deviatoric stress on the resilient modulus need to be discussed. The results of the two-factor variance analysis of resilient modulus of the improved red clay, with 3% cementor 3% lime, are presented in Table 5. It can be seen from Table 5 that the effects of confining pressure and deviatoric stress on the resilient modulus are remarkable.
3.2. Prediction Models of Resilient Modulus
The concept of a resilient modulus has been used to represent the non-linear stress-strain characteristics of subgrade soils. From the above analysis, it can be concluded that the resilient modulus of improved red clay has a strong dependence on the stress state. Several prediction models have been developed in the past to express the relationship between resilient modulus and stress state. The prediction models of non-linear resilient modulus mainly include the single factor model related to bulk stress or deviatoric stress [36], the composite model related to deviatoric stress, and mass stress [38], the composite model related to shear stress and confining pressure [40], and the composite model related to confining pressure and deviatoric stress [41]. In this paper, three prediction models frequently cited were chosen to analyze the influence of deviatoric stress and confining pressure on the resilient modulus of the improved red clay.
3.2.1. Uzan-Witczak Model
Uzan-witczak [38] introduced deviatoric stress and bulk stress to characterize the influence of stress state on the resilient modulus, and established the nonlinear constitutive model, as shown in Equation (2).
is the bulk stress that is given as
where is the major principal stress; is the intermediate principal stress, and is the minor principal stress or confining pressure (= for test in triaxial test)
However, this prediction model has some limitations: when equals 0, the result of Equation (2) tends to infinity. When and equal 0, the result is .
3.2.2. Andrei Model
In the practical problem, the intermediate and the minor principal stresses are not equal. In order to consider the influence of both of them on the resilient modulus, Andrei model [40] introduced the octahedral shear stress to replace the deviatoric stress in the May and Witczak model [71]. This operation provides a better explanation of the stress state of the materials, and further generalize the nonlinear constitutive model, as shown in Equation (3).
is the mass stress that is given as
is given as
where is the major principal stress; is the intermediate principal stress and is the minor principal stress or confining pressure.
In this prediction model, the influence of bulk stress and octahedral shear stress on the resilient modulus was fully taken into account. Compared with Equation (2), the Andrei model is essentially consistent with the Uzan-Witczak model. The difference between them is that the term in the Andrei model is followed by an additional constant of 1, eliminating the existing problems of the Uzan-Witczak model.
3.2.3. Ni Model
Based on testing results, Ni et al. [41] found that the resilient modulus was very sensitive to confining pressure, because of this, they introduced confining pressure and deviatoric stress to the prediction model to eliminate the existing problems included in the above Uzan-Witczak model. The following prediction model was given (Equation (4)):
where is the minor principal stress or confining pressure, is the deviatoric stress, atmospheric pressure, and and are regression coefficients.
Due to the difference in the physical properties of red clay in different regions, the selected prediction models were different from each other. In this paper, the above-mentioned prediction models of the resilient modulus were selected for red clay in Anhui province.
3.3. Regression Analysis Results
The fitting performance of a regression model is frequently evaluated by the determination coefficient, R2, defined as the ratio of regression sum of squares (SSR) to total sum of square (SST), that is = SSR/SST.
In Equations (5) and (6), is actual value, is predicted value, is sample mean, is regression sum of squares, is total sum of square.
Regression analysis of the test data was conducted for various conditions, and the results are shown in Table 6. From the regression results, a high coefficient of determination between the three prediction models, and the test results, is observed. For the Uzan-Witczak model, NI model and Andrei model, the coefficient of determination was greater than 0.80, 0.934, and 0.937, respectively. By comparing the coefficients of determination for the three prediction models, it can be concluded that the regression results, generated by the Andrei model and the NI model, are better than the regression results generated by the Uzan-Witczak model. In particular, the Andrei model can fit the test data better than the NI model does.
In the above three prediction models of the resilient modulus, k1 is used to characterize the stiffness of the subgrade soil and is proportional to the resilient modulus. The value of k1 increases with an increase in effective stress, additive content and compactness, and decreases with an increase in moisture content. k2 reflects the influence of confining pressure (bulk stress) on resilient modulus and is positively associated with confining pressure. The value of k2 as a whole decreaseswith an increase in moisture content, and increases with an increase in additive content and compactness. The value of k3 is negative, indicating that a negative correlation between the resilient modulus and the deviatoric stress (octahedral shear stress). k3 shows that the dynamic resilient modulus of subgrade soils decreases with an increase in shear stress, and its value is not obviously related to the moisture content and the compactness.
Table 7 and Figure 3 show that predicted resilient modulus versus measured resilient modulus for the improved red clay prepared at 93% compactness and 6% additive (cement and lime). It can be seen that the maximum errors, between the measured and the predicted resilient modulus, by using the Andrei model, NI model and Uzan-Witczak model are, respectively, 4.533%, 3.934%, and 6.133%. In addition, the average error and variance of Andrei, NI and Uzan-Witczak models are 1.70% ± 1.14%, 2.11% ± 1.07%, and 2.32% ± 1.75%, respectively. It can be concluded that the fitting performance of Andrei model is better than that of NI model and Uzan-Witczak model.
4. The Dependence of Resilient Modulus on Material Properties
4.1. The Influence of Moisture Content and Compactness on Resilient Modulus
The improved red clay samples, prepared at 93% compactness and 6% cement (C6%), and prepared at 93% compactness and 6% lime (L6%), were selected to study the influence of different moisture content on the dynamic resilient modulus of the improved red clay. As can be seen from Figure 4, the resilient modulus of the improved red clay is greatly affected by moisture content, and its value decreases with an increase in moisture content. For the improved red clay with 6% cement, when the confining pressure is 15 kPa and the deviatoric stress is 30 kPa, the resilient modulus for the optimum moisture content (OMC) of 21.5% (OMC minus 3%), 24.3% (OMC), 27.1% (OMC plus 3%) is 171.2 MPa, 158.0 MPa, 147.7 MPa, respectively. Compared with the moisture content of 21.5% (OMC minus 3%), the resilient modulus for moisture content of 24.3%, and 27.1% (OMC plus 3%) decreases by 7.71%, and 14.1%, respectively. In addition, when the moisture content is invariable, the resilient modulus of improved red clay decreases with an increase in deviatoric stress, and increases with an increase in mass stress.
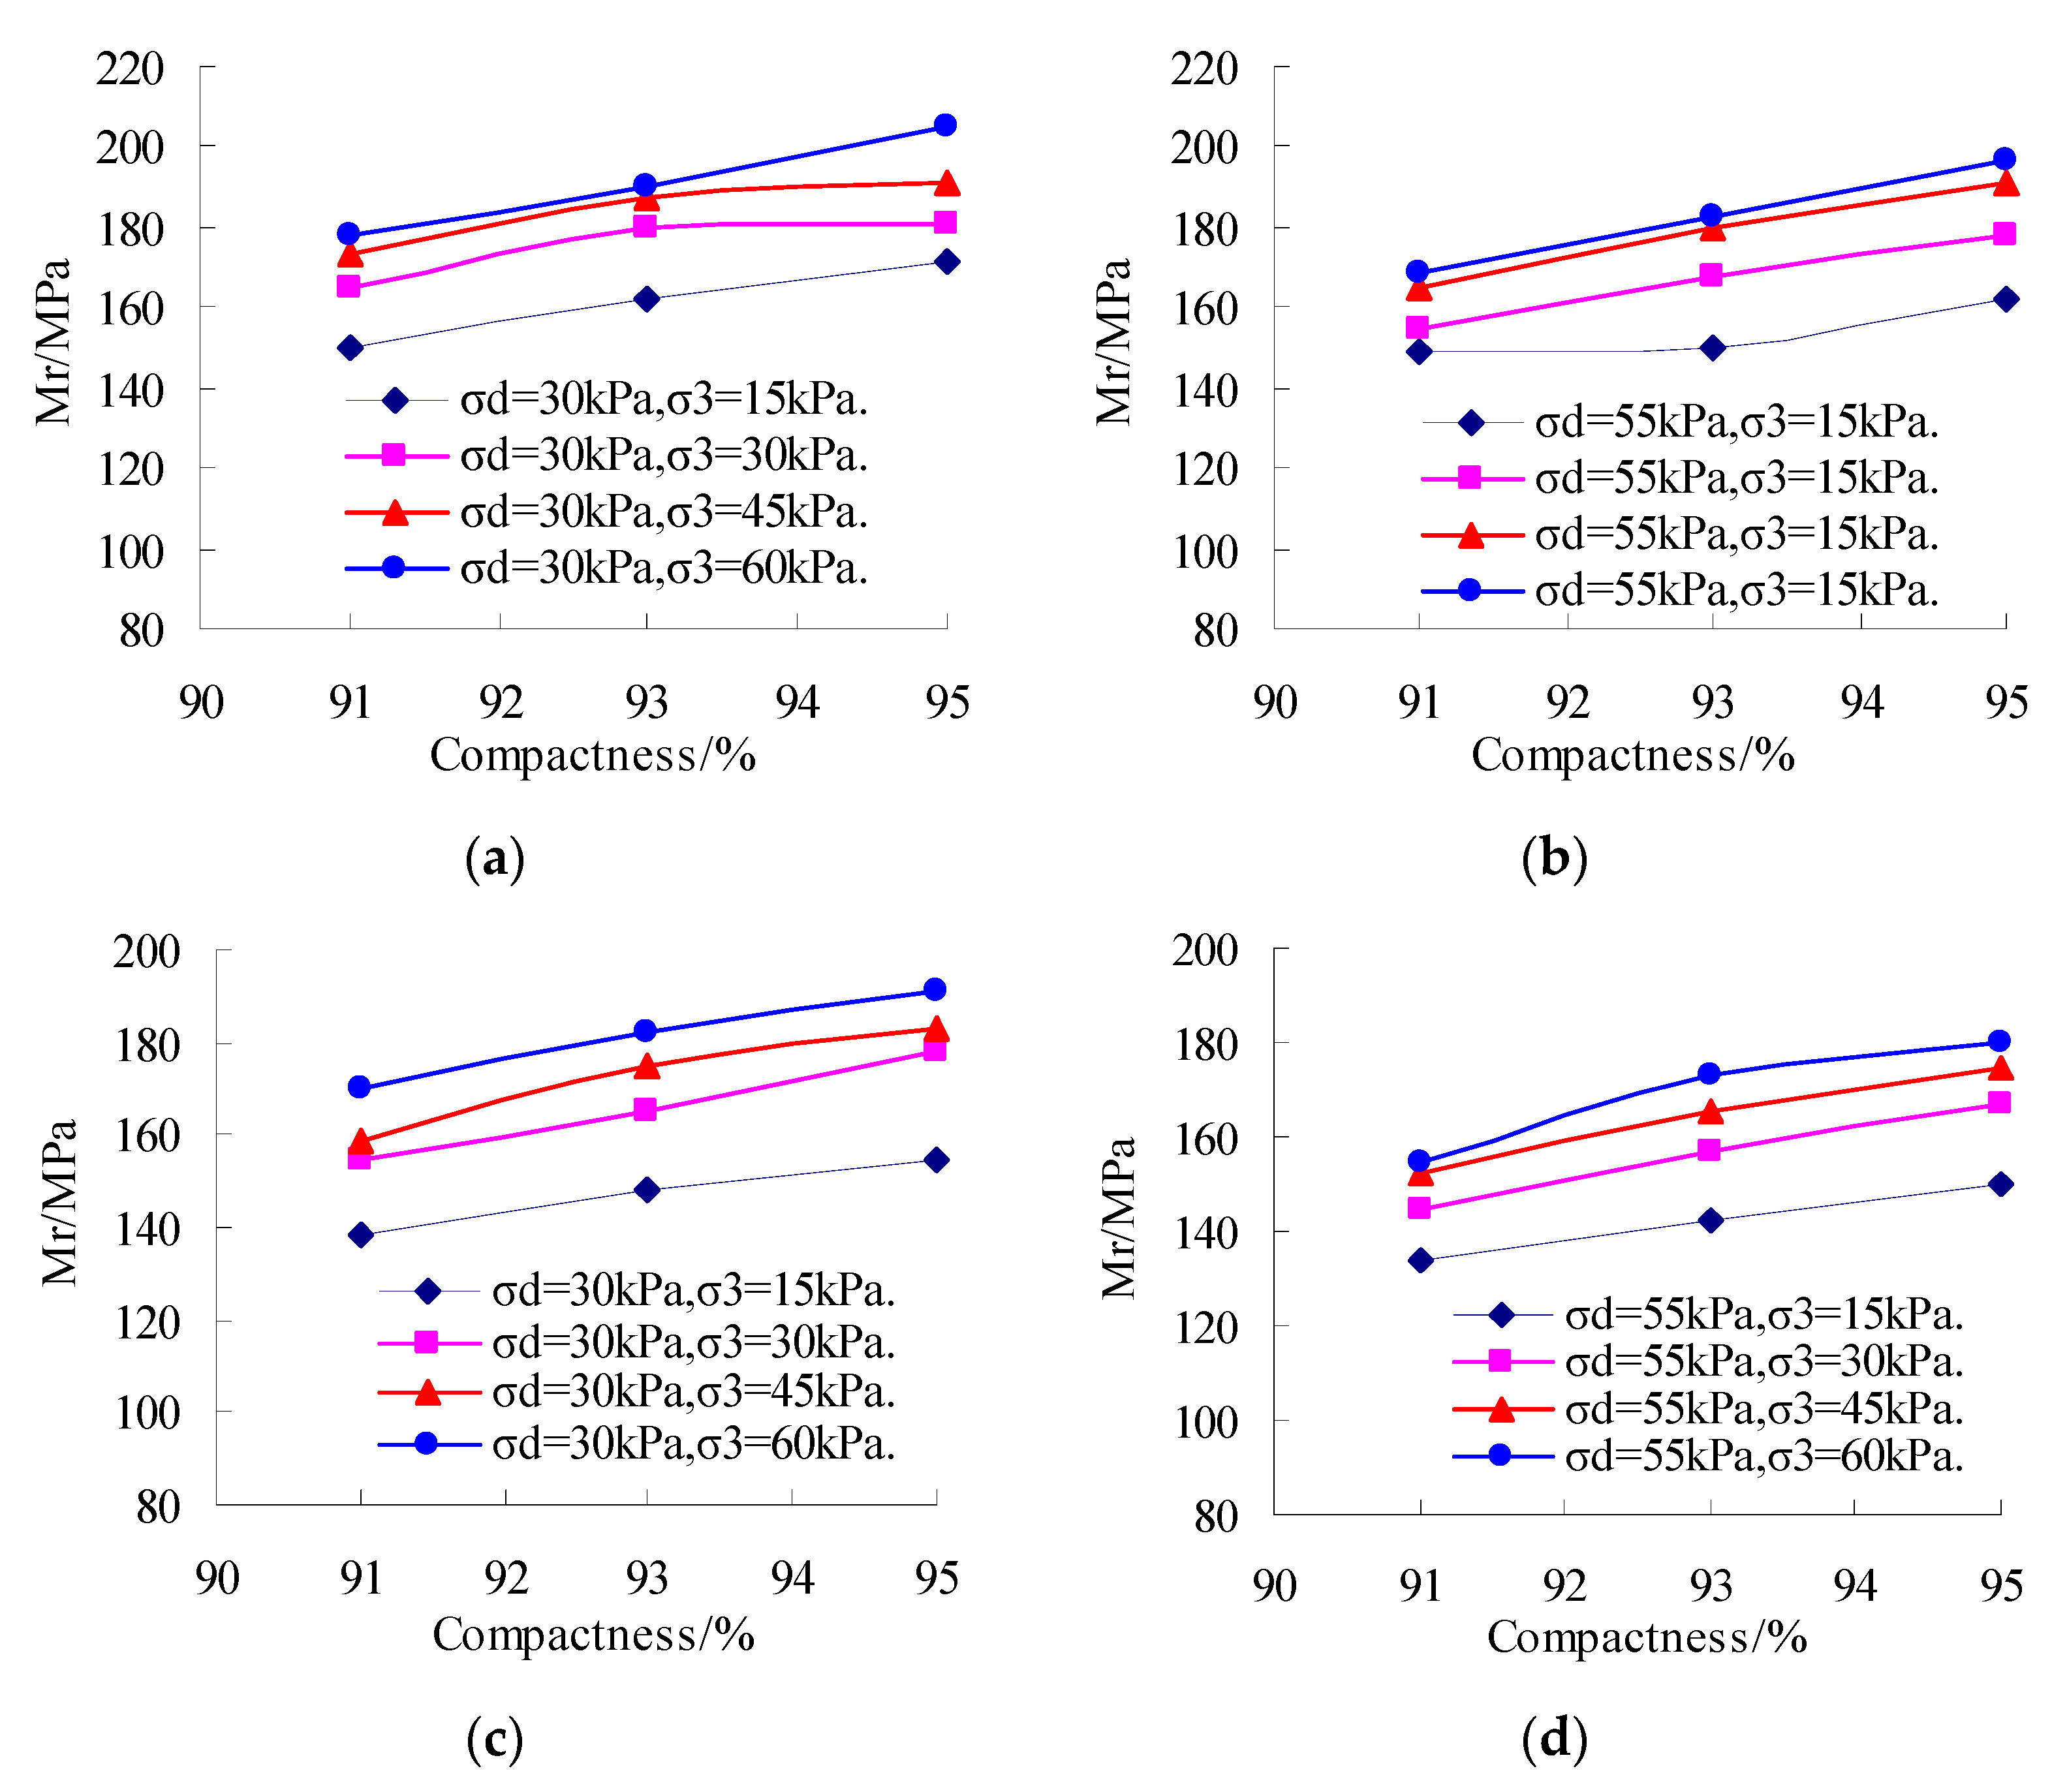
The improved red clay samples, prepared at optimum moisture content and 6% cement, and prepared at OMC and 6% lime (L6%), were selected to study the influence of different compactness on the dynamic resilient modulus. As can be seen from Figure 5, when the moisture content is invariable, the resilient modulus of the improved red clay increases with an increase in compactness. For the improved red clay with 6% cement, when the confining pressure is 60 kPa and the deviatoric stress is 30 kPa, the resilient modulus for the red clay samples, when prepared at a compactness of 91%, 93%, and 95% is 177.89 MPa, 190.5 MPa, and 204.67 kPa, respectively. Compared with 91% compactness, the resilient modulus for compactness of 93%, and 95% increases by 7.08%, and 15.05%, respectively. In addition, when the compactness is invariable, the resilient modulus of the improved red clay decreases with an increase in deviatoric stress and increases with an increase in bulk stress.
4.2. The Influence of Additive Content on Resilient Modulus
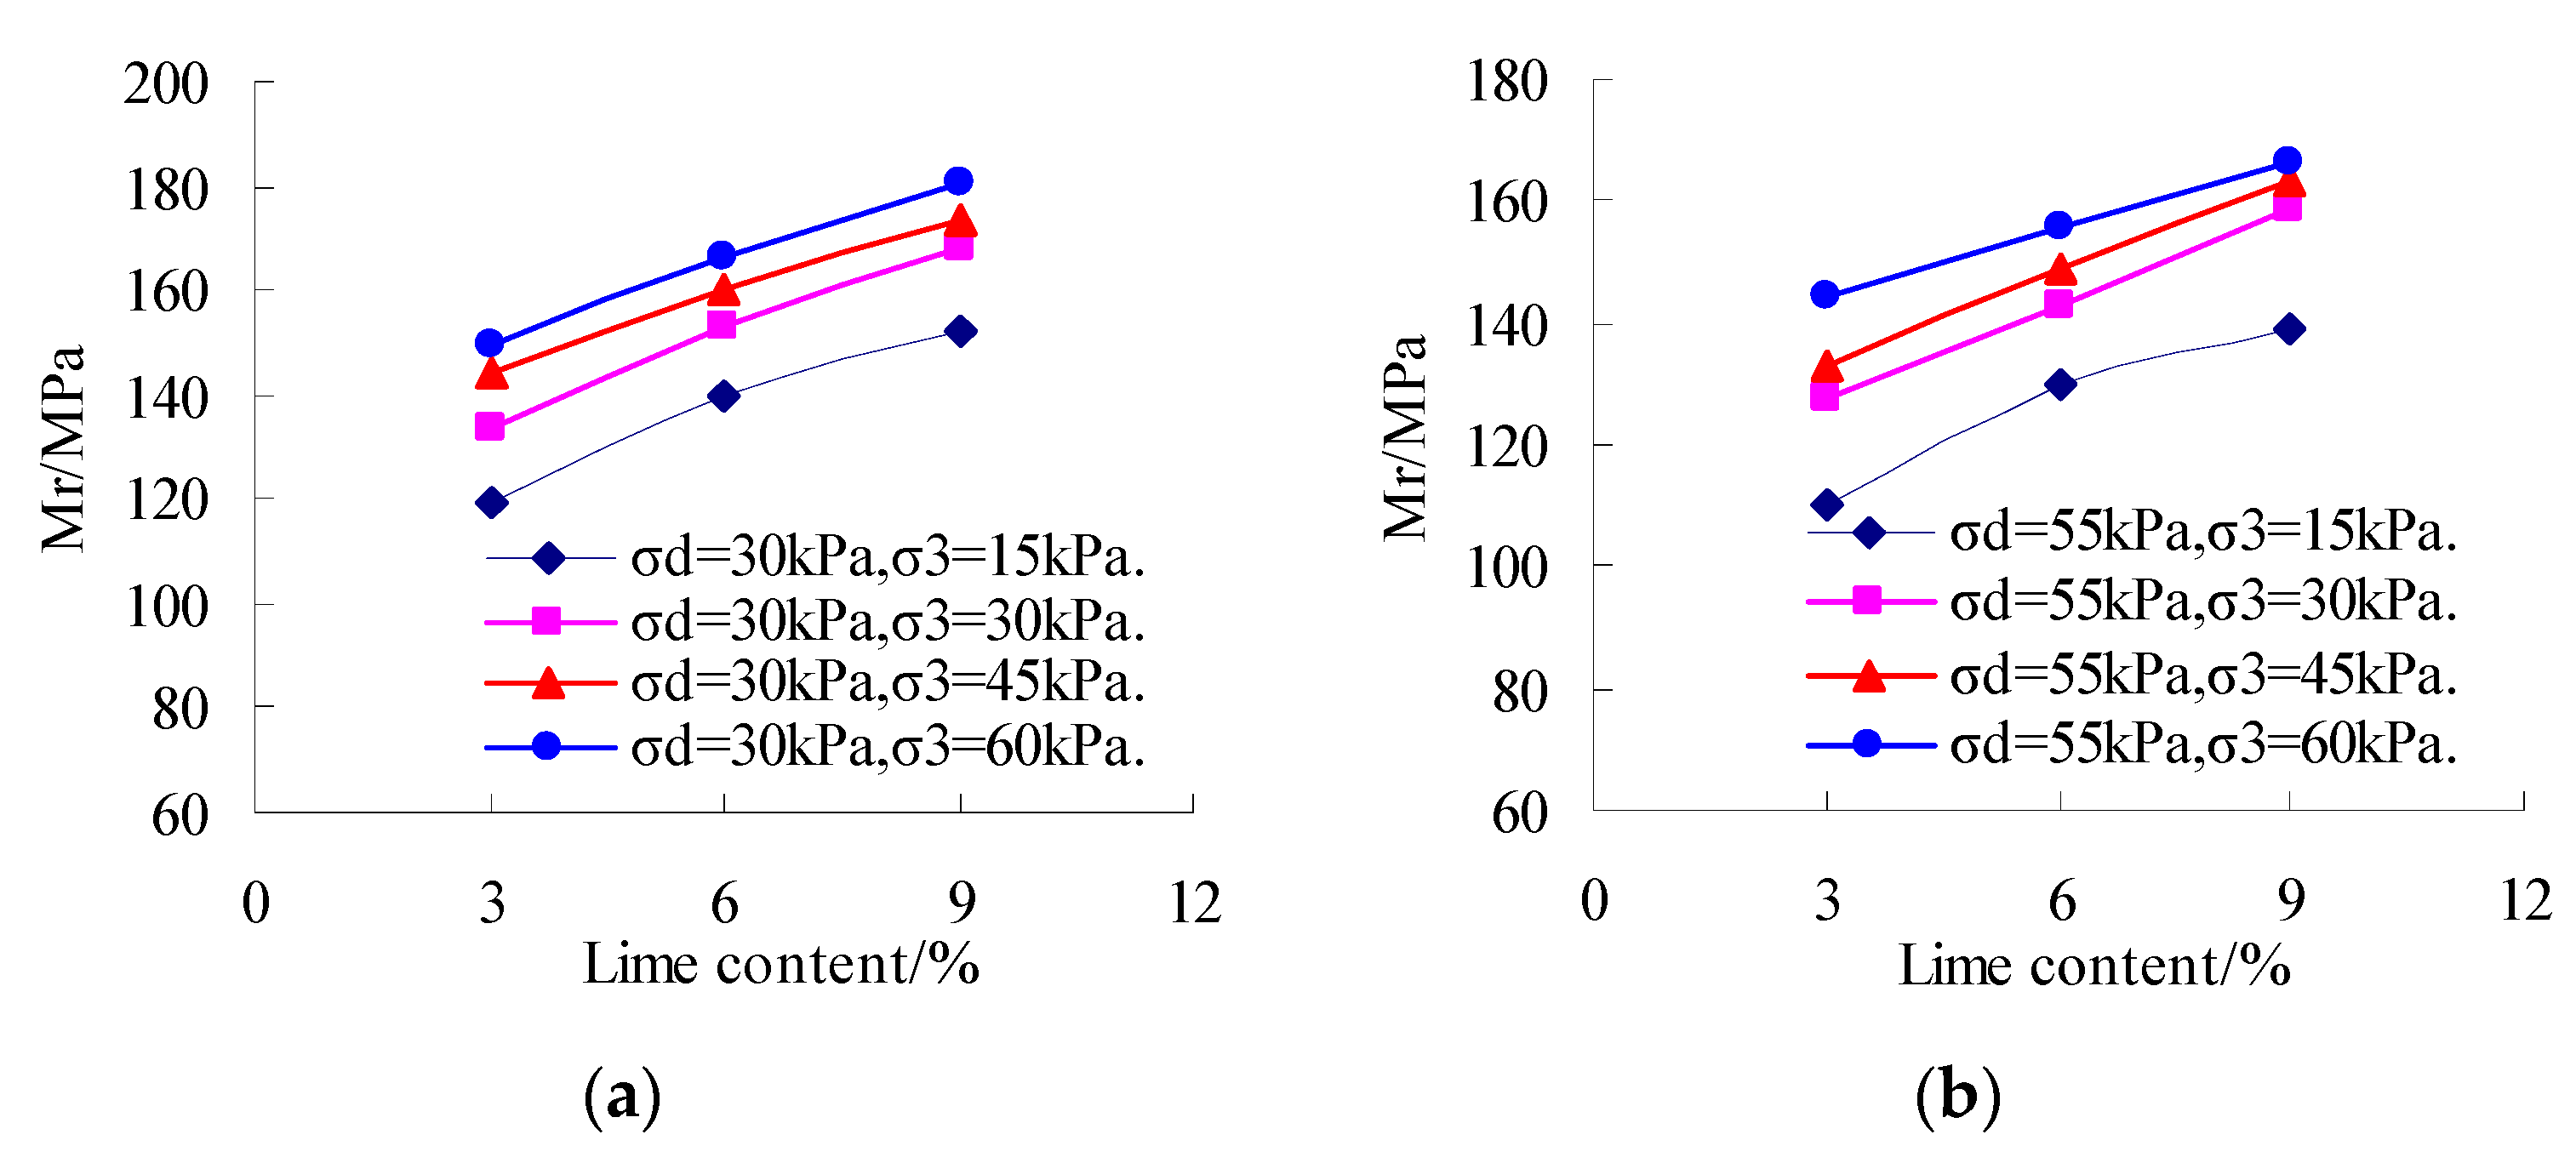
The improved red clay prepared at optimum moisture content and 93% compactness were selected to study the influence of different additives on the dynamic resilient modulus of the improved red clay. As can be seen from Figure 6 and Figure 7, both cement and lime (3~9%) can significantly improve the dynamic resilient modulus of the red clay. In Figure 6, when the confining pressure is 60 kPa and the deviatoric stress is 30 kPa, the resilient modulus of red clay samples, prepared at a lime content of 3%, 6%, and 9% is 149.9 MPa, 166 MPa, and 180.6 MPa, respectively. Compared with 3% lime, the resilient modulus for lime content of 6%, 9% increases by 10.75%, and 20.4%, respectively. In Figure 7, when the confining pressure is 60 kPa and the deviatoric stress is 30 kPa, the resilient modulus of red clay with cement content of 3%, 6%, and 9% is 170.4 MPa, 190.5 MPa, and 202 MPa, respectively. Compared with 3% cement, the resilient modulus for cement content of 6%, and 9% increases by 11.8%, and 18.54%, respectively. By comparing Figure 6a with Figure 7a, it can be concluded that when the confining pressure is 60 kPa and the deviatoric stress is 30 kPa, an increase of 12% in the dynamic resilient modulus was observed for 3% cement, compared with that of 3% lime. By comparing other data, it can be also seen that, when the contents of cement and lime are the same, cement can significantly improve the resilient modulus of red clay.
4.3. New Comprehensive Prediction Model
From the analysis of the existing prediction models, it can be concluded that the Andrei model can better predict the resilient modulus of the red clay chosen for this test. However, the Andrei model and other existing prediction models reflect only the influence of the stress state on resilient modulus, but the influence of moisture content, compactness, and additive content were not considered. Lu et al. proposed a new methodolgy to convert the band shaped drain into an annular instead of a circle to keep the sectional area or perimeter of the band shaped drain unchanged before and after the convertion [72]. From Figure 4 through 7, it can be seen that the resilient modulus is correlated negatively with moisture content, meaning that the higher the moisture content, the smaller the resilient modulus. Additionally, the resilient modulus is correlated positively with the compactness and the additive content, which means that the greater the compactness and the additive content, the larger the resilient modulus. It can be concluded that the influence of compactness, moisture content, and additive content on the resilient modulus is remarkable.
In this paper, considering the above factors affecting the resilient modulus, the relationship between moisture content (), compactness (), additive content (), octahedral shear stress (), bulk stress (), atmospheric pressure () and resilient modulus () are established, which is expressed as a Equation (7).
As the resilient modulus is correlated positively with the compactness and the additive content, and negatively with the moisture content, based on dimensional analysis [73], Equation (7) can be transformed into Equation (8).
On this basis, combined with the above existing prediction models, to eliminate the influence of dimension, the compactness and the additive content were normalized by the moisture content, respectively. The following prediction model was given (Equation (9)). In Equation (9), to eliminate the problem that the predicted value of resilient modulus is 0, and add 1, respectively.
Regression analysis of the testing results on the red clay samples improved with cement and/or lime was carried out by using Equation (9). Presented in Table 8 are the parameters that the proposed prediction model requires, the determination coefficient of improved red clay samples prepared at different moisture content, and the compactness and additive content. For prediction models, the greater the determination coefficient, , the better the regression effect, indicating a higher rationality and reliability of the prediction model. The determination coefficient of the proposed comprehensive prediction model for the additive of cement and lime is 0.84, and 0.86, respectively.
The comparison between the predicted and the measured values are presented in Figure 8 and Figure 9. As shown in Figure 8 and Figure 9, the maximum error between the predicted and the testing results for different cement and lime contents is 8.67%, and 8.70%, respectively. In addition, the average error and variance of the new comprehensive prediction model for different cement and lime contents are, respectively, 3.18% ± 4.03%, and 3.06% ± 3.94%. The new comprehensive prediction model, which reflects the influence of compactness, moisture content, additive content, and stress state on resilient modulus has good regression performance.
5. Conclusions
Due to the great difference in the physical properties of red clay in different regions, it is necessary to point out that the above predicted results are only applicable to the prediction of resilient modulus and improvement of red clay in Anhui province.
1. The testing results showed that the dynamic resilient modulus of red clay can be obviously increased by adding cement or lime (3~9%). In addition, the dynamic resilient modulus increases with an increase in compactness and additive content, and decreases with an increase in moisture content. Testing results also showed that, when the contents of cement and lime in red clay samples were the same, the dynamic resilient modulus of red clay improved with cement was slightly higher compared to that improved with lime.
2. Through a variance analysis of stress state, it can be concluded that the influence of deviatoric stress, and bulk stress on dynamic resilient modulus are significant, but the influence of deviatoric stress are more obvious. The dynamic resilient modulus of red clay increases with an increase in confining pressure. In addition, it decreases with an increase in deviatoric stress when the confining pressure is invariable, and increases with an increase in bulk stress when the deviatoric stress is invariable.
3. Three existing prediction models were used to predict the resilient modulus of the improved red clay. A comparison of the predicted results, using these prediction models, indicated that the fitting performance of the Andrei model was the best. The resilient modulus is not only affected by the stress state, but also by the compactness, moisture content, and additive content. Therefore, based on the Andrei models, a new comprehensive prediction model was proposed to reflect the influence of compactness, moisture content, additive content and stress state on resilient modulus. By comparing the regression values with the measured values, it can be concluded that the new comprehensive prediction model has a good regression performance. The good performance applies to various additive contents, demonstrating a good potential of engineering application for the proposed prediction model.
Author Contributions
H.Y. and Y.W. conceived and designed the experiments; W.L. performed the experiments; H.L. and Y.L. analyzed the data; W.L. wrote the paper.
Acknowledgments
This research was funded by the National Natural Science Foundation of China (51874112;51774107), the Open Research Fund of State Key Laboratory of Geo-mechanics and Geotechnical Engineering, Institute of Rock and Soil Mechanics, Chinese Academy of Sciences (Z013010), the Opening Project of State Key Laboratory of Explosion Science and Technology, Beijing Institute of Technology (No. KFJJ19-02M). All financial support is gratefully acknowledged.
Conflicts of Interest
The authors declare no conflict of interest.
References
- Li, Z.Y.; Dong, C.; Zou, J.R.; Zou, W.L. Research on experiment and prediction model of dynamic resilient modulus of laterite soil in Southern Hunan. Rock Soil Mech. 2015, 36, 1840–1846. [Google Scholar]
- Wang, Y.X.; Lin, H.; Zhao, Y.L.; Li, X.; Guo, P.P.; Liu, Y. Analysis of fracturing characteristics of unconfined rock plate under edge on impact loading. Eur. J. Environ. Civ. Eng. 2019. [Google Scholar] [CrossRef]
- Wu, F.; Chen, J.; Zou, Q.L. A nonlinear creep damage model for salt rock. Int. J. Damage Mech. 2018, 1–14. [Google Scholar] [CrossRef]
- Zhao, Y.L.; Zhang, L.Y.; Wang, W.J.; Wan, W.; Ma, W.H. Separation of elastoviscoplastic strains of rock and a nonlinear creep model. Int. J. Geomech. 2018, 04017129. [Google Scholar] [CrossRef]
- Zhao, Y.L.; Zhang, L.Y.; Wang, W.J.; Wan, W.; Li, S.Q.; Ma, W.H.; Wang, Y.X. Creep behavior of intact and cracked limestone under multi-level loading and unloading cycles. Rock Mech. Rock Eng. 2017, 50, 1409–1424. [Google Scholar] [CrossRef]
- Qiu, X.; Yang, Q.; Wang, B.R.; Luo, X.H. Prediction Model of Dynamic Resilient Modulus of Cohesive Subgrade Soil Based on Triaxial Test System. Key Eng. Mater. 2013, 579–580, 873–876. [Google Scholar] [CrossRef]
- Lin, H.; Wang, H.; Fan, X.; Cao, P.; Zhou, K. Particle size distribution effects on deformation properties of graded aggregate base under cyclic loading. Eur. J. Environ. Civ. Eng. 2018. [Google Scholar] [CrossRef]
- Zheng, H.; Li, T.; Shen, J.; Xu, C.; Sun, H.; Lü, Q. The effects of blast damage zone thickness on rock slope stability. Eng. Geol. 2018, 246, 19–27. [Google Scholar] [CrossRef]
- Zhang, C.Y.; Pu, C.Z.; Cao, R.H.; Jiang, T.T.; Huang, G. The stability and roof-support optimization of roadways passing through unfavorable geological bodies using advanced detection and monitoring methods, among others, in the Sanmenxia Bauxite Mine in China’s Henan Province. Bull. Eng. Geol. Environ. 2019. [Google Scholar] [CrossRef]
- Zhao, Y.L.; Zhang, L.Y.; Wang, W.J.; Tang, J.Z.; Lin, H.; Wan, W. Transient pulse test and morphological analysis of single rock fractures. Int. J. Rock Mech. Min. Sci. 2017, 91, 139–154. [Google Scholar] [CrossRef]
- Cao, R.H.; Cao, P.; Lin, H.; Ma, G.; Chen, Y. Failure characteristics of intermittent fissures under a compressive-shear test: Experimental and numerical analyses. Theor. Appl. Fract. Mech. 2018, 96, 740–757. [Google Scholar] [CrossRef]
- Chen, Y.; Lin, H. Consistency analysis of Hoek-Brown and equivalent Mohr-coulomb parameters in calculating slope safety factor. Bull. Eng. Geol. Environ. 2018. [Google Scholar] [CrossRef]
- Zhao, Y.L.; Tang, J.Z.; Chen, Y.; Zhang, L.Y.; Wang, W.J.; Liao, J.P. Hydromechanical coupling tests for mechanical and permeability characteristics of fractured limestone in complete stress–strain process. Environ. Earth Sci. 2017, 76, 1–18. [Google Scholar] [CrossRef]
- Zhao, Y.L.; Luo, S.L.; Wang, Y.X.; Wang, W.J.; Zhang, L.Y.; Wan, W. Numerical Analysis of Karst Water Inrush and a Criterion for Establishing the Width of Water-resistant Rock Pillars. Mine Water Environ. 2017, 36, 508–519. [Google Scholar] [CrossRef]
- Zhao, Y.L.; Zhang, L.Y.; Wang, W.J.; Pu, C.Z.; Wan, W.; Tang, J.Z. Cracking and Stress–Strain Behavior of Rock-Like Material Containing Two Flaws Under Uniaxial Compression. Rock Mech. Rock Eng. 2016, 49, 2665–2687. [Google Scholar] [CrossRef]
- Zhao, Y.L.; Wang, Y.X.; Wang, W.J.; Wan, W.; Tang, J.Z. Modeling of non-linear rheological behavior of hard rock using triaxial rheological experiment. Int. J. Rock Mech. Min. Sci. 2017, 93, 66–75. [Google Scholar] [CrossRef]
- Fan, X.; Lin, H.; Lai, H.P.; Cao, R.H.; Liu, J. Numerical analysis of the compressive and shear failure behavior of rock containing multi-intermittent joints. C. R. Méc. 2019, 347, 33–48. [Google Scholar] [CrossRef]
- Wang, Y.X.; Guo, P.P.; Li, X.; Lin, H.; Liu, Y.; Yuan, H.P. Behavior of Fiber-Reinforced and Lime-Stabilized Clayey Soil in Triaxial Tests. Appl. Sci. 2019, 9, 900. [Google Scholar] [CrossRef]
- Fan, X.; Li, K.H.; Lai, H.P.; Xie, Y.L.; Cao, R.H. Internal stress distribution and cracking around flaws and openings of rock block under uniaxial compression: A particle mechanics approach. Comput. Geotech. 2018, 102, 28–38. [Google Scholar] [CrossRef]
- Zhou, J.; Li, X.; Mitri, H.S. Evaluation method of rockburst: State-of-the-art literature review. Tunn. Undergr. Space Technol. 2018, 81, 632–659. [Google Scholar] [CrossRef]
- Wang, Y.X.; Guo, P.P.; Ren, W.X.; Yuan, B.X.; Yuan, H.P.; Zhao, Y.L.; Shan, S.B.; Cao, P. Laboratory Investigation on Strength Characteristics of Expansive Soil Treated with Jute Fiber Reinforcement. Int. J. Geomech. 2017, 17, 04017101. [Google Scholar] [CrossRef]
- Wang, Y.X.; Guo, P.P.; Dai, F.; Li, X.; Zhao, Y.L.; Liu, Y. Behavior and modeling of fiber-reinforced clay under triaxial compression by combining the superposition method with the energy-based homogenization technique. Int. J. Geomech. 2018, 18, 04018172. [Google Scholar] [CrossRef]
- Liu, B.C.; Li, C.J.; Pan, Z.Y.; Zhang, B.H. Laboratory test for mechanical properties of Guilin red clay mixed with cement. J. Eng. Geol. 2012, 20, 633–638. [Google Scholar]
- Wang, D.; Wang, H.; Jiang, Y. Water immersion-induced strength performance of solidified soils with reactive MgO—A green and low carbon binder. J. Test. Eval. (ASTM) 2019, 47. [Google Scholar] [CrossRef]
- Lin, H.; Xiong, W.; Cao, P. Stability of soil nailed slope using strength reduction method. Eur. J. Environ. Civ. Eng. 2013, 17, 872–885. [Google Scholar] [CrossRef]
- Tan, Y.Z.; Zheng, A.; Wu, P.; Fu, W. Effect of aggregate soil size on California bearing ratio values of laterite soil. Rock Soil Mech. 2013, 34, 1242–1246. [Google Scholar]
- Wang, D.; Du, Y.; Xiao, J. Shear properties of stabilized loess using novel reactive magnesia-bearing binders. J. Mater. Civ. Eng. (ASCE) 2019. [Google Scholar] [CrossRef]
- Meng, J.; Cao, P.; Huang, J.; Lin, H.; Chen, Y.; Cao, R. Second-order cone pro- gramming formulation of discontinuous deformation analysis. Int. J. Numer. Methods Eng. 2019, 1–15. [Google Scholar] [CrossRef]
- Wang, H.; Nie, W.; Cheng, W.M.; Liu, Q.; Jin, H. Effects of air volume ratio parameters on air curtain dust suppression in a rock tunnel’s fully-mechanized working face. Adv. Powder Technol. 2018, 29, 230–244. [Google Scholar] [CrossRef]
- Seed, H.B.; Chan, C.K.; Lee, C.E. Resilience characteristics of subgrade soils and their relation to fatigue failures in asphalt pavements. In Proceedings of the International Conference on Structural Design of Asphalt Pavement, Ann Arbor, MI, USA, 20–24 August 1962; pp. 611–636. [Google Scholar]
- Ba, M.; Fall, M.; Samb, F.; Sarr, D.; Ndiaye, M. Resilient Modulus of Unbound Aggregate Base Courses from Senegal (West Africa). Open J. Civ. Eng. 2011, 1, 1–6. [Google Scholar] [CrossRef]
- AASHTO. Guide for Design of Pavement Structures; American Association of State Highway and Transportation Officials: Washington, DC, USA, 2002. [Google Scholar]
- Shen, J.; Wan, L.; Zuo, J. Non-linear shear strength model for Coal Rocks. Rock Mech. Rock Eng. 2019. [Google Scholar] [CrossRef]
- Huang, F.; Shen, J.; Cai, M.; Xu, C. An empirical UCS model for anisotropic blocky rock masses. Rock Mech. Rock Eng. 2019. [Google Scholar] [CrossRef]
- Shen, J.; Jimenez, R. Predicting the shear strength parameters of sandstone using genetic programming. B Eng. Geol. Environ. 2018, 77, 1647–1662. [Google Scholar] [CrossRef]
- Seed, H.B.; Mitry, F.G.; Monismith, C.L.; Chan, C.K. Prediction of Flexible Pavement Deflections from Laboratory Repeated Load Tests; National Academy of Sciences National Academy of Engineering: Washington, DC, USA, 1967. [Google Scholar]
- Uzan, J. Characterization of Granular Materials; Transportation Research Record 1022; National Research Council: Washington, DC, USA, 1985; pp. 52–59. [Google Scholar]
- Witczak, M.; Uzan, J. The Universal Airport Design System, Report I of IV. Granular Material Characterization; University of Maryland: College Park, MD, USA, 1988. [Google Scholar]
- Uzan, J. Characterization of Clayey Subgrade Materials for Mechanistic Design of Flexible Pavements; Transportation Research Record 1629; Transportation Research Board: Washington, DC, USA, 1998; pp. 188–196. [Google Scholar]
- Andrei, D. Development of a Harmonized Test Protocol for the Resilient Modulus of Unbound Materials Used in Pavement Design. Master’s Thesis, University of Maryland, College Park, MD, USA, 1999. [Google Scholar]
- Ni, B.; Hopkins, T.C.; Sun, L.; Beckham, T.L. Modeling the resilient modulus of soils. In Proceedings of the 6th International Conference on the Bearing Capacity of Roads, Railways and Airfields, Lisbon, Portugal, 24–26 June 2002; pp. 1131–1142.
- Ozel, M.R.; Mohajerani, A. Resilient Modulus of a Stabilised Fine-grained Subgrade Soil. Aust. Geomech. J. 2011, 36, 75–86. [Google Scholar]
- Li, Z.Y.; Zou, J.R.; Dong, C. Study on Prediction Model of Dynamic Resilient Modulus of Cohesive Subgrade Soils Considering Moisture Variation. Appl. Mech. Mater. 2014, 488–489, 411–416. [Google Scholar] [CrossRef]
- Bao, T.N.; Mohajerani, A. Resilient Modulus of Fine-grained Soil and a Simple Testing and Calculation Method for Determining an Average Resilient Modulus Value for Pavement Design. Transp. Geotech. 2016, 7, 59–70. [Google Scholar]
- Wang, H.; Lin, H.; Cao, P. Correlation of UCS Rating with Schmidt Hammer Surface Hardness for Rock Mass Classification. Rock Mech. Rock Eng. 2017, 50, 195–203. [Google Scholar] [CrossRef]
- Liu, Q.; Nie, W.; Yun, H.; Peng, H.T.; Liu, C.Q.; Wei, C.H. Research on tunnel ventilation systems: Dust diffusion and pollution behavior by air curtains based on CFD technology and field measurement. Build. Environ. 2019, 147, 444–460. [Google Scholar] [CrossRef]
- Hua, Y.; Nie, W.; Cai, P.; Liu, Y.H.; Peng, H.T.; Liu, Q. Pattern characterization concerning spatial and temporal evolution of dust pollution associated with two typical ventilation methods at fully mechanized excavation faces in rock tunnels. Powder Technol. 2018, 334, 117–131. [Google Scholar] [CrossRef]
- Wang, Y.X.; Guo, P.P.; Lin, H.; Li, X.; Zhao, Y.L.; Yuan, B.X.; Liu, Y.; Cao, P. Numerical Analysis of Fiber-Reinforced Soils based on the Equivalent Additional Stress Concept. Int. J. Geomech. 2019, in press. [Google Scholar]
- Chen, R.; Ge, Y.H.; Chen, Z.K.; Liu, J.; Zhao, Y.R.; Li, Z.H. Analytical Solution for One-dimensional Contaminant Diffusion through Unsaturated Soils Beneath. Geomembrane. J. Hydrol. 2019, 568, 260–274. [Google Scholar] [CrossRef]
- Chen, R.; Huang, J.W.; Chen, Z.K.; Xu, Y.; Liu, J.; Ge, Y.H. Effect of Root Density of Wheat and Okra on Hydraulic Properties of an Unsaturated Compacted Loam. Eur. J. Soil Sci. 2019. [Google Scholar] [CrossRef]
- Lu, M.M.; Jing, H.W.; Zhou, A.N.; Xie, K.H. Analytical models for consolidation of combined composite ground improved by impervious columns and vertical drains. Int. J. Numer. Anal. Methods Geomech. 2018, 42, 871–888. [Google Scholar] [CrossRef]
- Lu, M.M.; Sloan, S.W.; Indraratna, B.; Jing, H.W.; Xie, K.H. A new analytical model for consolidation with multiple vertical drains. Int. J. Numer. Anal. Methods Geomech. 2016, 40, 1623–1640. [Google Scholar] [CrossRef]
- Yang, S.B.; Nie, W.; Lv, S.S.; Liu, Z.Q.; Peng, H.T.; Ma, X.; Cai, P.; Xu, C.W. Effects of spraying pressure and installation angle of nozzles on atomization characteristics of external spraying system at a fully-mechanized mining face. Powder Technol. 2019, 343, 754–764. [Google Scholar] [CrossRef]
- Lu, M.M.; Jing, H.W.; Zhou, Y.; Xie, K.H. General analytical model for consolidation of stone columns-reinforced ground and combined composite ground. Int. J. Geomechan. (ASCE) 2017, 17, 04016131. [Google Scholar] [CrossRef]
- Cai, P.; Nie, W.; Chen, D.W.; Yang, S.B.; Liu, Z.Q. Effect of air flowrate on pollutant dispersion pattern of coal dust particles at fully mechanized mining face based on numerical simulation. Fuel 2019, 239, 623–635. [Google Scholar] [CrossRef]
- Bao, Q.; Nie, W.; Liu, C.Q.; Liu, Y.H.; Zhang, H.H.; Wang, H.K.; Jin, H. Preparation and Characterization of a Binary-Graft-Based, Water-Absorbing Dust Suppressant for Coal Transportation. J. Appl. Polym. Sci. 2019, 135. [Google Scholar] [CrossRef]
- Jin, H.; Nie, W.; Zhang, H.H.; Liu, Y.H.; Bao, Q.; Wang, H.K. The Preparation and Characterization of a Novel Environmentally-Friendly Coal Dust Suppressant. J. Appl. Polym. Sci. 2019. [Google Scholar] [CrossRef]
- Wang, Y.X.; Shan, S.B.; Zhang, C.S.; Guo, P.P. Seismic response of tunnel lining structure in a thick expansive soil stratum. Tunn. Undergr. Space Technol. 2019, 88, 250–259. [Google Scholar] [CrossRef]
- Yuan, B.X.; Sun, M.; Wang, Y.X.; Zhai, L.H.; Luo, Q.Z. A full 3D displacement measuring system for 3D displacement field of soil around a laterally loaded pile in transparent soil. Int. J. Geomech. 2019. [Google Scholar] [CrossRef]
- Yuan, B.X.; Xu, K.; Wang, Y.X.; Chen, R.; Luo, Q.Z. Investigation of deflection of a laterally loaded pile and soil deformation using the PIV technique. Int. J. Geomech. 2017, 17, 04016138. [Google Scholar] [CrossRef]
- Wang, D.; Wang, H.; Di, S. Mechanical properties and microstructure of magnesia-fly ash pastes. Road Mater. Pavement Des. 2019. [Google Scholar] [CrossRef]
- Wang, D.; Zentar, R.; Abriak, N.E. Durability and swelling of solidified/stabilized dredged marine soils with class F fly ash, cement and lime. J. Mater. Civ. Eng. (ASCE) 2018, 30, 04018013. [Google Scholar] [CrossRef]
- Wang, D.; Zentar, R.; Abriak, N.E.; Di, S.J. Long-term mechanical performance of marine sediments solidified with cement, lime and fly ash. Mar. Georesour. Geotechnol. 2018, 36, 123–130. [Google Scholar] [CrossRef]
- Wang, M.; Shi, X.; Zhou, J.; Qiu, X. Multi-planar detection optimization algorithm for the interval charging structure of large-diameter long hole blasting design based on rock fragmentation aspects. Eng. Optim. 2018, 50, 2177–2191. [Google Scholar] [CrossRef]
- Peng, H.; Nie, W.; Cai, P.; Liu, Q.; Liu, Z.Q. Development of a novel wind-assisted centralized spraying dedusting device for dust suppression in a fully mechanized mining face. Environ. Sci. Pollut. Res. 2018, 1–16. [Google Scholar] [CrossRef]
- Cao, R.; Cao, P.; Lin, H.; Fan, X.; Zhang, C.; Liu, T. Crack Initiation, Propagation, and Failure Characteristics of Jointed Rock or Rock-Like Specimens: A Review. Adv. Civ. Eng. 2019, 2019, 6975751. [Google Scholar] [CrossRef]
- Liu, Z.Q.; Nie, W.; Peng, H.T.; Yang, S.B.; Chen, D.W.; Liu, Q. The effects of the spraying pressure and nozzle orifice diameter on the atomizing rules and dust suppression performances of an external spraying system in a fully-mechanized excavation face. Powder Technol. 2019, in press. [Google Scholar]
- Lekarp, F.; Isacsson, U.; Dawson, A. Resilient Response of Unbound Aggregates. J. Transp. Eng. 2000, 126, 66–75. [Google Scholar] [CrossRef]
- Hopkins, T.C.; Beckham, T.L.; Sun, C. Resilient Modulus of Compacted Crushed Stone Aggregate Bases; Research Report KTC-05-27/SPR-229-01-1F; Kentucky Transportation Center, College of Engineering, University of Kentucky: Lexington, KY, USA, 2001; p. 89. [Google Scholar]
- Ba, M.; Fall, M.; Sall, O.A.; Samb, F. Effect of Compaction Moisture Content on the Resilient Modulus of Unbound Aggregates from Senegal (west Africa). Geomaterials 2012, 2, 19–23. [Google Scholar] [CrossRef]
- May, R.W.; Witczak, M.W. Effective Granular Modulus to Model Pavement Response; Transportation Research Record 810; Transportation Research Board: Washington, DC, USA, 1981; pp. 1–9. [Google Scholar]
- Lu, M.M.; Li, D.X.; Jing, H.W.; Deng, Y.B. Analytical solution for consolidation of band-shaped drain based on an equivalent annular drain. Int. J. Geomech. 2019. [Google Scholar] [CrossRef]
- Butterfield, R. Dimensional analysis for geotechnical engineers. Geotechnique 1999, 49, 357–366. [Google Scholar] [CrossRef]
Figure 1.
Definition of dynamic resilient modulus (Hopkins et al., 2001 [51]).
Figure 1.
Definition of dynamic resilient modulus (Hopkins et al., 2001 [51]).

Figure 2.
Variation of resilient modulus with deviatoric stress and bulk stress. (a) Lime 3% OMC ; (b) Lime 3% OMC ; (c) Cement 3% OMC ; (d) Cement 3% OMC .
Figure 2.
Variation of resilient modulus with deviatoric stress and bulk stress. (a) Lime 3% OMC ; (b) Lime 3% OMC ; (c) Cement 3% OMC ; (d) Cement 3% OMC .


Figure 3.
Predicted resilient modulus versus measured resilient modulus by three prediction models (Andrei model, NI model and Uzan-Witczak model). (a) 93% compactness and 6% cement; (b) 93% compactness and 6% lime.
Figure 3.
Predicted resilient modulus versus measured resilient modulus by three prediction models (Andrei model, NI model and Uzan-Witczak model). (a) 93% compactness and 6% cement; (b) 93% compactness and 6% lime.

Figure 4.
relation curve at different stress states. (a) ; (b) ; (c) ; (d) .

Figure 5.
curve at different stress states. (a) ; (b) ; (c) ; (d) .

Figure 6.
Relationship between resilient modulus (Mr) and lime content for various stress states. (a) ; (b) .
Figure 6.
Relationship between resilient modulus (Mr) and lime content for various stress states. (a) ; (b) .

Figure 7.
Relationship between resilient modulus (Mr) and cement content for various stress states. (a) ; (b) .
Figure 7.
Relationship between resilient modulus (Mr) and cement content for various stress states. (a) ; (b) .

Figure 8.
Predicted resilient modulus versus measured resilient modulus at different optimum moisture content, compactness and cement by four prediction models (comprehensive model, Andrei model, NI model &Uzan-Witczak model). (a) 93% compactness and 6% cement; (b) optimum moisture content (OMC)and 6% cement; (c) 93% compactness and OMC.

Figure 9.
Predicted resilient modulus versus measured resilient modulus at different optimum moisture content, compactness and lime by four prediction models (Comprehensive model, Andrei model, NI model and Uzan-Witczak model). (a) 93% compactness and 6% lime; (b) OMC and 6% lime; (c) 93% compactness and OMC.


Table 1.
Basic properties of red clay.
| Samples | Grain Density | Natural Dry Density | Maximum Dry Density | Optimum Moisture Content | Liquid Limit | Plastic Limit | <0.075mm Grain Size |
|---|---|---|---|---|---|---|---|
| /(g/cm) | /(g/cm) | /(g/cm) | /% | /% | /% | Soil particle content/% | |
| Red clay | 2.72 | 1.28 | 1.73 | 27.8 | 52.6 | 30.7 | 90 |
Table 2.
Chemical compositions of red clay.
| Constituents | SiO2 | Al2O3 | Fe2O3 | K2O | MgO | CaO | Na2O | LOI |
|---|---|---|---|---|---|---|---|---|
| Content(%) | 40.27 | 32.65 | 18.52 | 2.51 | 0.91 | 0.72 | 0.24 | 4.18 |
Table 3.
Mineral composition of red clay.
| Mineral | Mineral Compositions/(%) | ||||
|---|---|---|---|---|---|
| Al2Si2O5(OH)4 | Al(OH)3 | FeO(OH) | SiO2 | Deviation | |
| Content(%) | 60.87 | 11.72 | 13.13 | 11.96 | −2.32 |
Table 4.
Proctor compaction test results on samples with different additive contents.
| Cement Content/% | Optimum Moisture Content/% | Maximum Dry Density/(g/cm3) | Lime Content/% | Optimum Moisture Content/% | Maximum Dry Density/(g/cm3) |
|---|---|---|---|---|---|
| 3 | 25.6 | 1.75 | 3 | 26.2 | 1.74 |
| 6 | 24.3 | 1.76 | 6 | 25.1 | 1.75 |
| 9 | 23.2 | 1.78 | 9 | 24.2 | 1.76 |
Table 5.
Two-factor variance analysis of resilient modulus.
| (a) Improved red clay with 3% cement | ||||||
| Source of Variation | Variance Sum | Degree of Freedom | Mean Square Error | F Value | Critical Value a = 0.05 | Significance |
| Deviatoric stress | 2397.41 | 3 | 799.136 | 134.39 | 3.86 | Significant |
| Confining pressure | 1832.63 | 3 | 610.877 | 102.73 | 3.86 | Significant |
| Error | 53.52 | 9 | 5.946 | |||
| Sum | 4283.56 | 15 | ||||
| (b) Improved red clay with 3% lime | ||||||
| Source of Variation | Variance Sum | Degree of Freedom | Mean Square Error | F Value | Critical Value a = 0.05 | Significance |
| Deviatoric stress | 1853.83 | 3 | 617.942 | 178.36 | 3.86 | Significant |
| Confining pressure | 1870.63 | 3 | 623.544 | 179.98 | 3.86 | Significant |
| Error | 31.18 | 9 | 3.465 | |||
| Sum | 3755.64 | 15 | ||||
Table 6.
Parameters required in different prediction models of resilient modulus.
| Additive Content | Compactness/% | Moisture Content/% | Uzan-Witczak Model | NI Model | Andrei Model | |||||||||
|---|---|---|---|---|---|---|---|---|---|---|---|---|---|---|
| k1 | k2 | k3 | R2 | k1 | k2 | k3 | R2 | k1 | k2 | k3 | R2 | |||
| C6% | 93 | OMC minus 3% | 139.6 | 0.2047 | −0.2176 | 0.9260 | 1791.6 | 0.5045 | −0.3637 | 0.9556 | 2033.8 | 0.1974 | −0.9476 | 0.9618 |
| OMC | 148.88 | 0.1953 | −0.2225 | 0.9146 | 1733 | 0.5054 | −0.4431 | 0.9421 | 1960.5 | 0.1999 | −1.0855 | 0.9569 | ||
| OMC plus 3% | 152.38 | 0.1083 | −0.1391 | 0.9191 | 1585 | 0.2844 | −0.2882 | 0.9669 | 1697.6 | 0.1116 | −0.6782 | 0.9739 | ||
| L6% | OMC minus 3% | 123.97 | 0.2168 | −0.2198 | 0.9375 | 1578.1 | 0.5632 | −0.4147 | 0.9718 | 1816.1 | 0.2214 | −1.0717 | 0.9812 | |
| OMC | 149.13 | 0.1901 | −0.2585 | 0.934 | 1513 | 0.5253 | −0.5224 | 0.9782 | 1716.3 | 0.2016 | −1.2226 | 0.9721 | ||
| OMC minus 3% | 129.48 | 0.1445 | −0.1667 | 0.9182 | 1439.2 | 0.3776 | −0.3333 | 0.9662 | 1579.2 | 0.1489 | −0.8169 | 0.9788 | ||
| C6% | 91 | OMC | 155.61 | 0.1811 | −0.2402 | 0.8621 | 1667.8 | 0.4873 | −0.5172 | 0.9342 | 1874.8 | 0.189 | −1.1987 | 0.9434 |
| 93 | 148.88 | 0.1953 | −0.2225 | 0.9146 | 1733 | 0.5054 | −0.4431 | 0.9421 | 1960.5 | 0.1999 | −1.0855 | 0.9569 | ||
| 95 | 165.93 | 0.198 | −0.2418 | 0.8084 | 1851.3 | 0.5399 | −0.5119 | 0.9005 | 2112.9 | 0.2086 | −1.2227 | 0.909 | ||
| L6% | 91 | 115.10 | 0.2107 | −0.2136 | 0.9266 | 1446.8 | 0.557 | −0.3953 | 0.962 | 1664 | 0.2123 | −1.0225 | 0.9374 | |
| 93 | 149.13 | 0.1901 | −0.2585 | 0.934 | 1513 | 0.5253 | −0.5224 | 0.9782 | 1716.3 | 0.2016 | −1.2226 | 0.9721 | ||
| 95 | 144.19 | 0.2147 | −0.244 | 0.8937 | 1708 | 0.5644 | −0.4923 | 0.945 | 1961.7 | 0.2216 | −1.2071 | 0.96 | ||
| C3% | 93 | OMC | 94.43 | 0.2335 | −0.1859 | 0.9596 | 1405 | 0.5954 | −0.2959 | 0.9664 | 1637.3 | 0.236 | −0.8898 | 0.9753 |
| C6% | 148.88 | 0.1953 | −0.2225 | 0.9146 | 1733 | 0.5054 | −0.4431 | 0.9421 | 1960.5 | 0.1999 | −1.0855 | 0.9569 | ||
| C9% | 107.73 | 0.2577 | −0.2073 | 0.9224 | 1655.5 | 0.6738 | −0.3373 | 0.9656 | 1969.8 | 0.2615 | −1.0027 | 0.9514 | ||
| L3% | 86.24 | 0.2671 | −0.2462 | 0.9399 | 1241.3 | 0.6923 | −0.4427 | 0.9681 | 1477.3 | 0.2719 | −1.1974 | 0.974 | ||
| L6% | 149.13 | 0.1901 | −0.2585 | 0.934 | 1513 | 0.5253 | −0.5224 | 0.9782 | 1716.3 | 0.2016 | −1.2226 | 0.9721 | ||
| L9% | 155.61 | 0.1885 | −0.2449 | 0.9156 | 1658.2 | 0.4997 | −0.5133 | 0.9545 | 1868.9 | 0.1928 | −1.1943 | 0.9543 | ||
Table 7.
Test data and forecast data of different prediction models.
| Mass Stress θ/kPa | Octahedral Shear Stress/kPa | Measured Data/Mpa | Resilient Modulus | |||||
|---|---|---|---|---|---|---|---|---|
| Andrei Model | NI Model | Uzan-Witczak Model | ||||||
| Predicted Value/Mpa | Error/% | Predicted Value/Mpa | Error/% | Predicted Value/Mpa | Error/% | |||
| 75 | 14.14 | 160 | 160.3371 | 0.2102 | 165.572 | 3.3653 | 162.302 | 1.4184 |
| 100 | 25.93 | 150 | 152.6465 | 1.7338 | 153.1579 | 2.0618 | 150.0214 | 0.0143 |
| 120 | 35.36 | 144 | 146.379 | 1.6252 | 145.1393 | 0.785 | 145.0932 | 0.7534 |
| 150 | 49.5 | 132 | 137.405 | 3.9336 | 135.3122 | 2.4479 | 140.6242 | 6.1328 |
| 120 | 14.14 | 180 | 176.1317 | 2.1962 | 176.1559 | 2.1822 | 177.9052 | 1.1775 |
| 145 | 25.93 | 167.4 | 164.4161 | 1.8148 | 162.9482 | 2.732 | 161.3126 | 3.7736 |
| 165 | 35.36 | 158 | 156.0003 | 1.2819 | 154.4171 | 2.3203 | 154.4036 | 2.3292 |
| 195 | 49.5 | 145.9 | 144.8037 | 0.7571 | 143.9618 | 1.3463 | 148.0175 | 1.4306 |
| 165 | 14.14 | 187 | 187.7086 | 0.3775 | 186.1511 | 0.456 | 189.3211 | 1.226 |
| 190 | 25.93 | 180 | 173.5441 | 3.7201 | 172.194 | 4.5333 | 170.0567 | 5.847 |
| 210 | 35.36 | 165.3 | 163.705 | 0.9743 | 163.1788 | 1.2999 | 161.8498 | 2.1317 |
| 240 | 49.5 | 153.5 | 150.9406 | 1.6956 | 152.1303 | 0.9003 | 154.1433 | 0.4173 |
| 210 | 14.14 | 190.5 | 196.9794 | 3.2894 | 195.6467 | 2.6306 | 198.4513 | 4.0067 |
| 235 | 25.93 | 182.7 | 181.077 | 0.8963 | 180.9776 | 0.9517 | 177.2649 | 3.0661 |
| 255 | 35.36 | 166 | 170.1836 | 2.4583 | 171.5026 | 3.2084 | 168.1048 | 1.2521 |
| 285 | 49.5 | 155.9 | 156.2159 | 0.2022 | 159.8905 | 2.4958 | 159.4045 | 2.1985 |
Table 8.
Comprehensive prediction model regression equation for two additives.
| Additive | Comprehensive Prediction Model Regression Equation | R2 |
|---|---|---|
| Cement | 0.84 | |
| Lime | 0.86 |
© 2019 by the authors. Licensee MDPI, Basel, Switzerland. This article is an open access article distributed under the terms and conditions of the Creative Commons Attribution (CC BY) license (http://creativecommons.org/licenses/by/4.0/).
Share and Cite
MDPI and ACS Style
Yuan, H.; Li, W.; Wang, Y.; Lin, H.; Liu, Y. Resilient Modulus—Physical Parameters Relationship of Improved Red Clay by Dynamic Tri-Axial Test. Appl. Sci. 2019, 9, 1155. https://doi.org/10.3390/app9061155
AMA Style
Yuan H, Li W, Wang Y, Lin H, Liu Y. Resilient Modulus—Physical Parameters Relationship of Improved Red Clay by Dynamic Tri-Axial Test. Applied Sciences. 2019; 9(6):1155. https://doi.org/10.3390/app9061155
Chicago/Turabian StyleYuan, Haiping, Weiqiang Li, Yixian Wang, Hang Lin, and Yan Liu. 2019. "Resilient Modulus—Physical Parameters Relationship of Improved Red Clay by Dynamic Tri-Axial Test" Applied Sciences 9, no. 6: 1155. https://doi.org/10.3390/app9061155
Note that from the first issue of 2016, this journal uses article numbers instead of page numbers. See further details here.