Carbonation of Natural Wollastonite at Non-Ambient Conditions Relevant for CCS—the Possible Use as Cementitious Material in Wellbores

 , ,
, ,
Abstract
:1. Introduction
2. Materials and Methods
2.1. Materials
2.2. Analytical Methods
2.3. Experimental Setup
3. Results
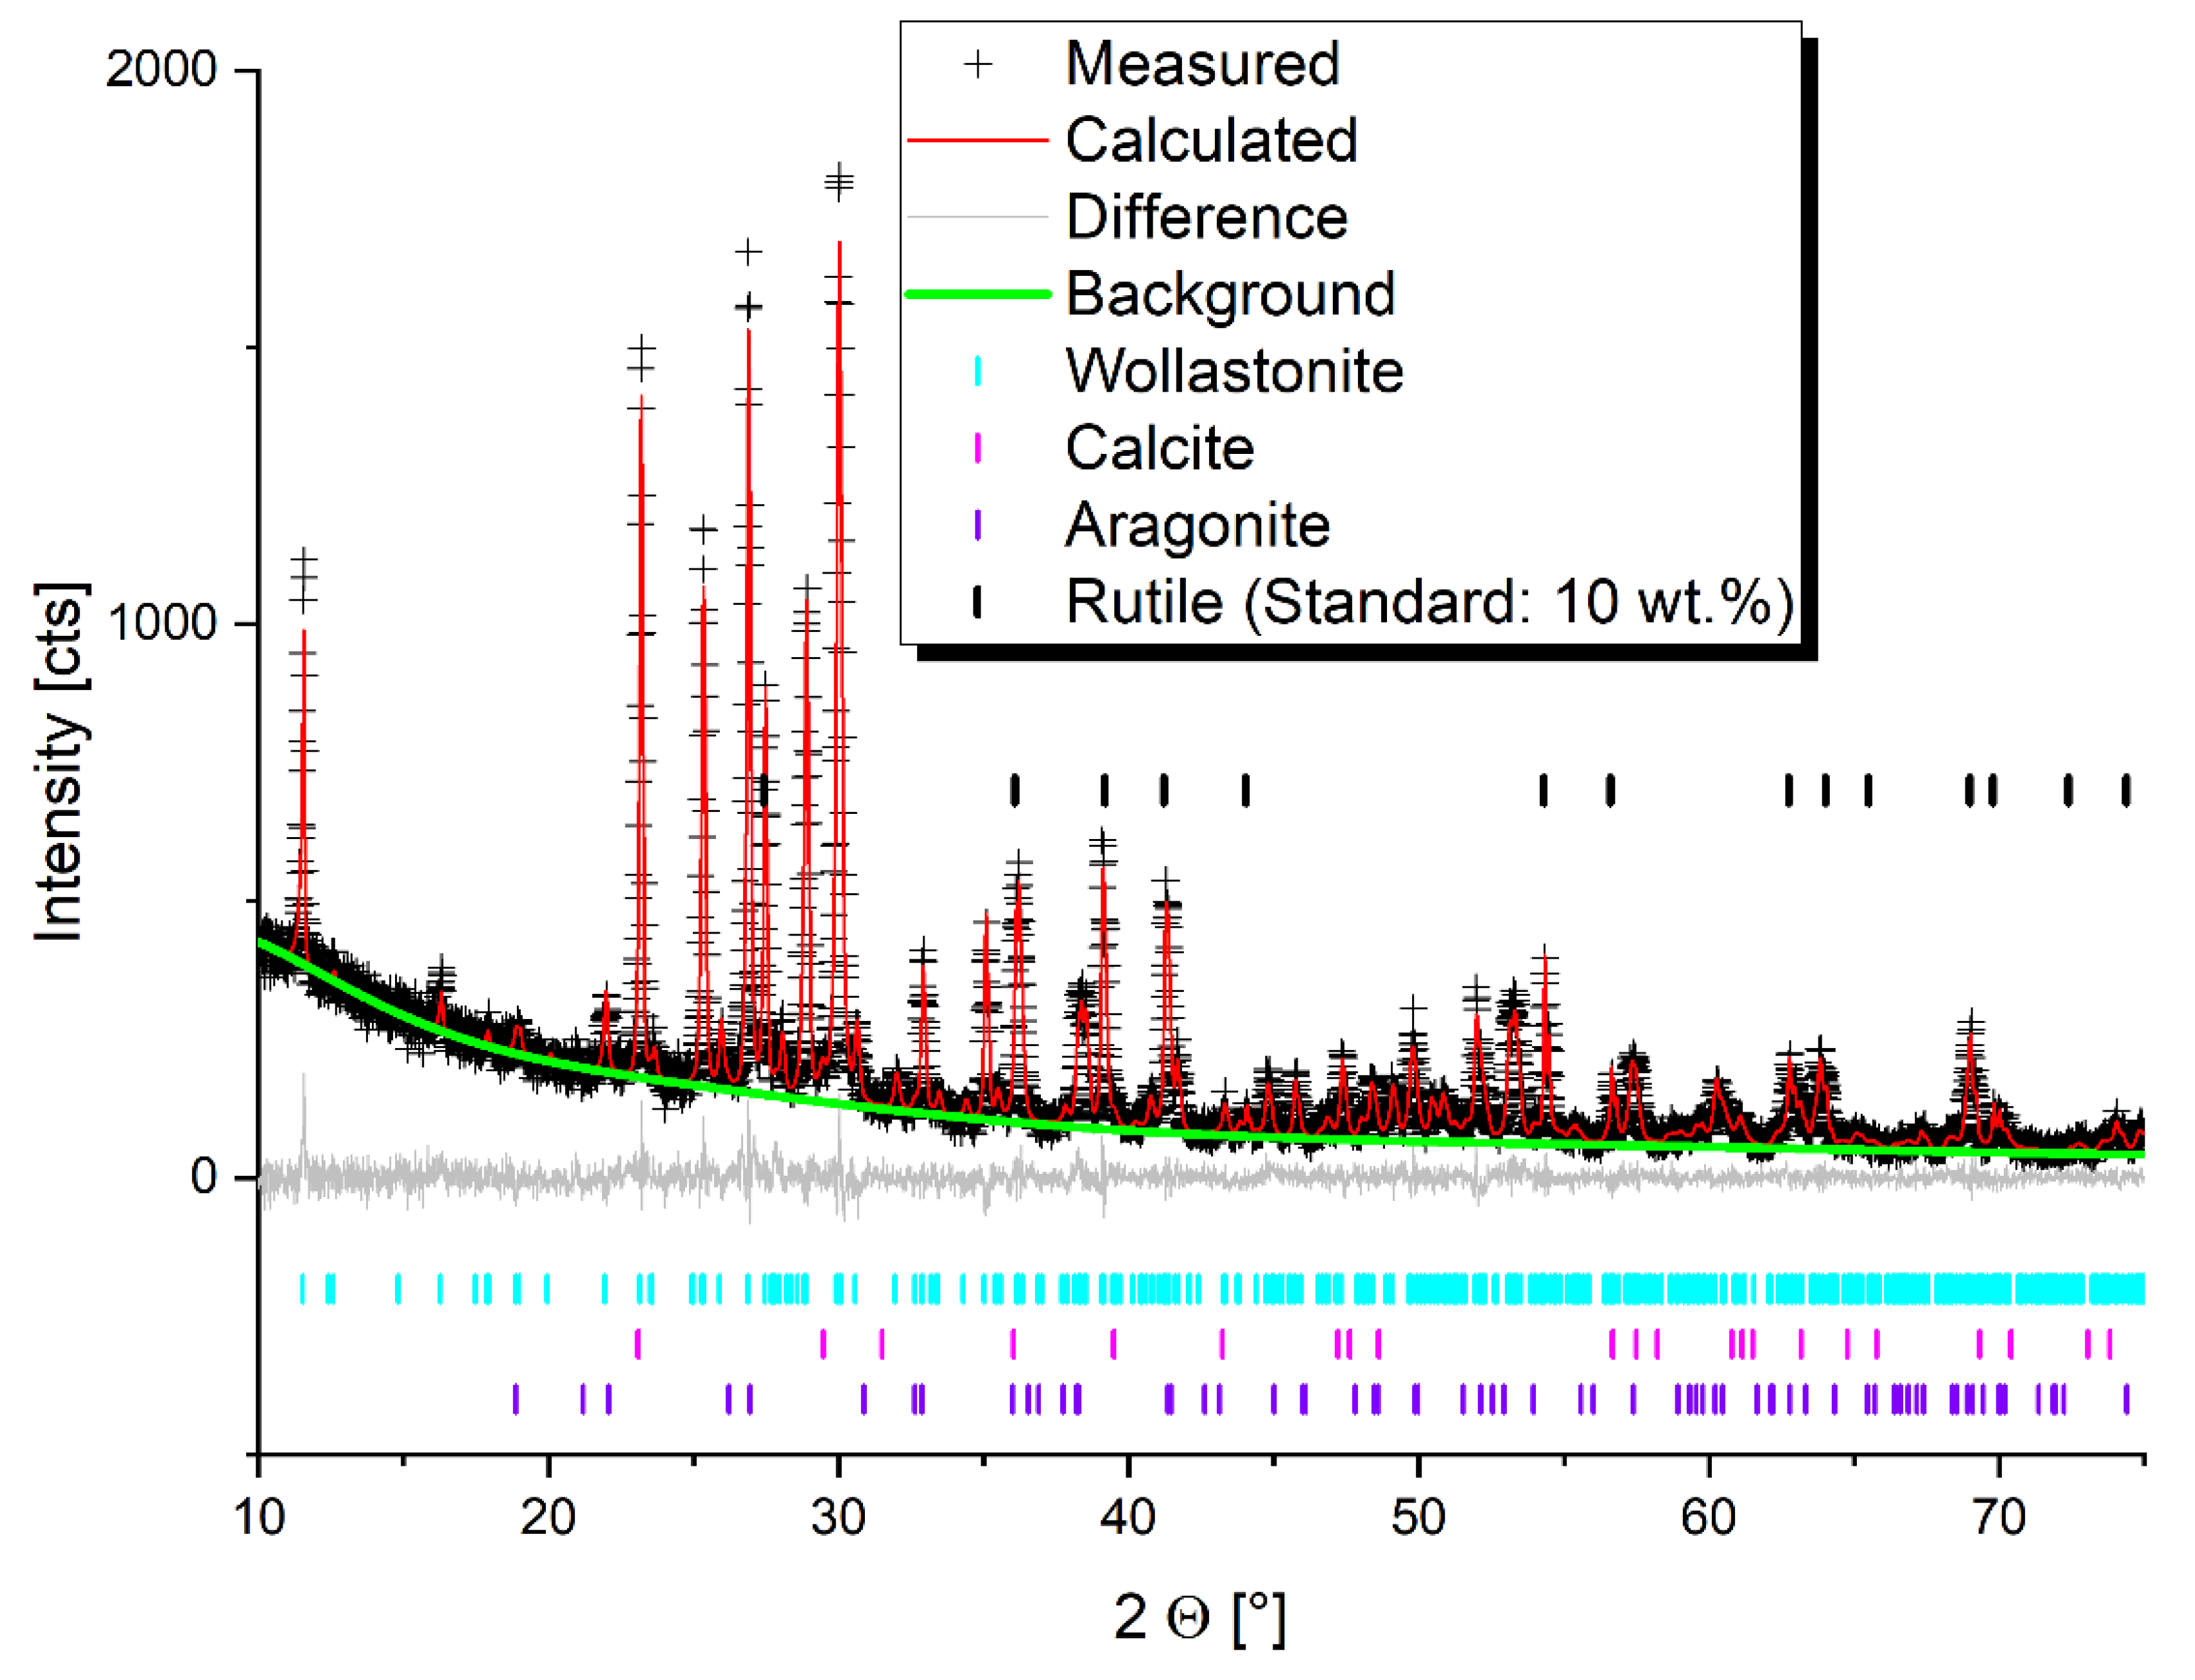
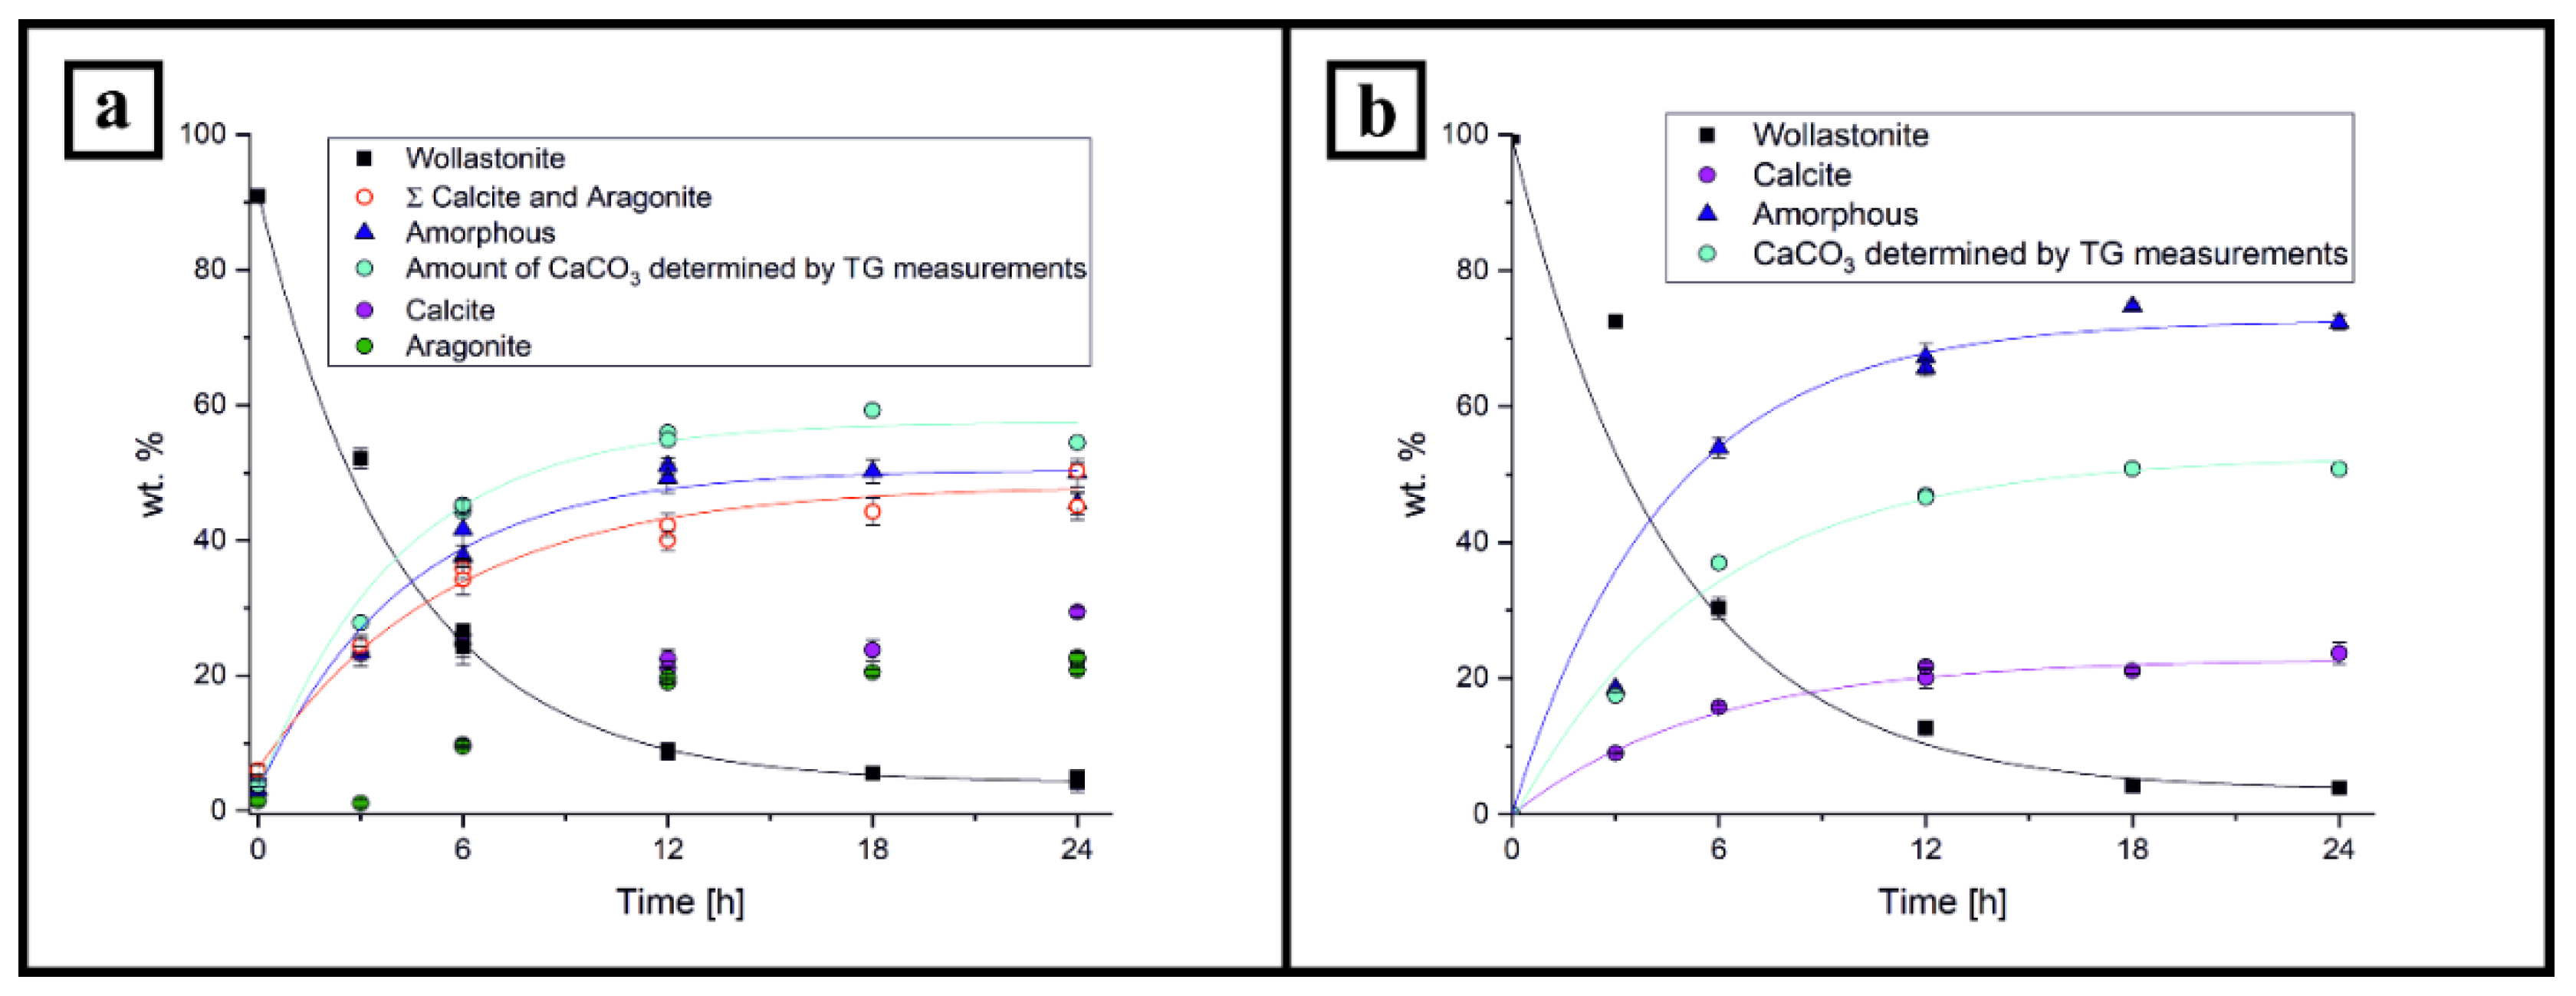
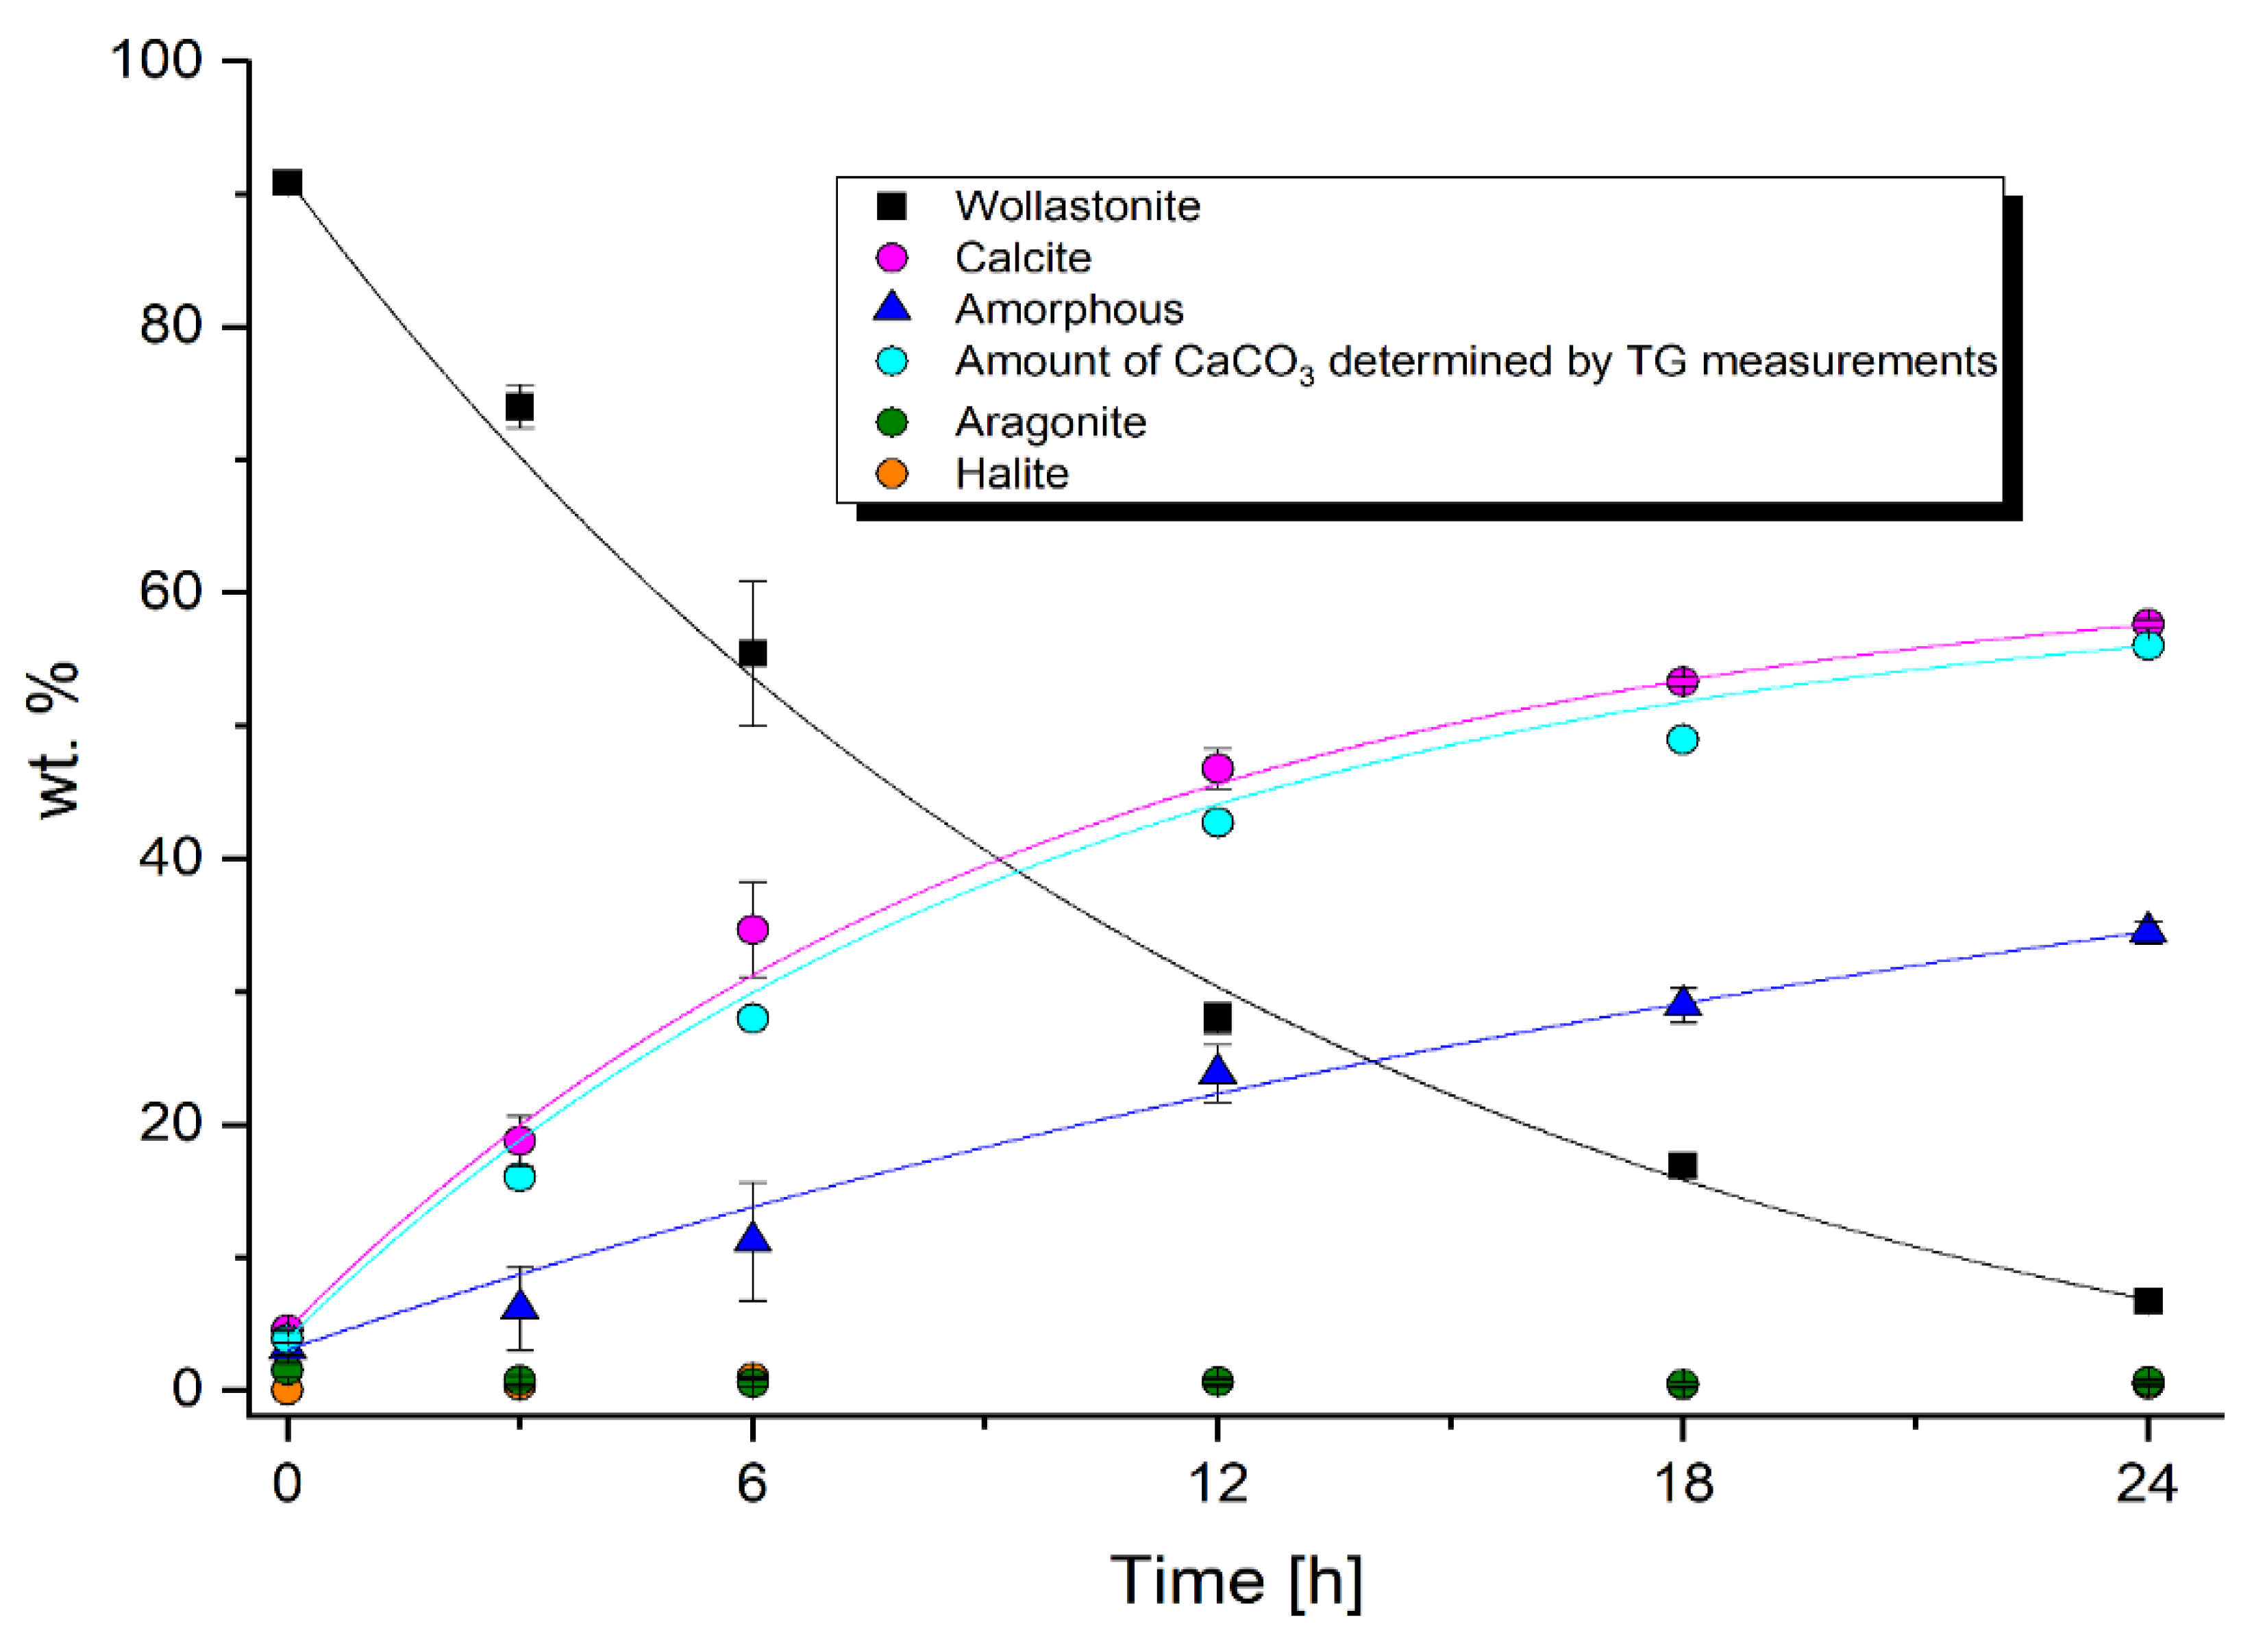
3.1. PXRD Analysis
3.2. DSC-TG/MS Measurements
4. Discussion
5. Conclusions
Supplementary Materials
Author Contributions
Funding
Acknowledgments
Conflicts of Interest
References
- IPCC. The Intergovernmental Panel on Climate Change. Special Report. Available online: https://www.ipcc.ch/sr15/ (accessed on 22 January 2019).
- NOAA. Earth System Research Laboratory. Trends in Atmospheric Carbon Dioxide. Available online: https://www.esrl.noaa.gov/gmd/ccgg/trends/ (accessed on 3 December 2018).
- Benson, S.M.; Orr, F.M., Jr. Carbon Dioxide Capture and Storage. MRS Bull. 2008, 33, 303–305. [Google Scholar] [CrossRef] [Green Version]
- Locher, F. Zement—Grundlagen der Herstellung und Verwendung, 1st ed.; Verlag Bau + Technik GmbH: Düsseldorf, Germany, 2000; p. 522. ISBN 978-3-7640-0400-2. [Google Scholar]
- Taylor, H.F.W. Cement Chemistry, 2nd ed.; Thomas Telford Publishing, Thomas Telford Services Ltd.: London, UK, 1997; p. 459. ISBN 0-7277-2592-0. [Google Scholar]
- Svensson, K.; Neumann, A.; Menezes, F.F.; Lempp, C.; Pöllmann, H. The Conversion of Wollastonite to CaCO3 Considering Its Use for CCS Application as Cementitious Material. Appl. Sci. 2018, 8, 304. [Google Scholar] [CrossRef]
- Svensson, K.; Neumann, A.; Menezes, F.; Lempp, C.; Pöllmann, H. Wollastonite a CS-Cement—Curing by Carbonation—Use as Well Cement. In Proceedings of the 40th ICMA Conference on Cement Microscopy, Deerfield, FL, USA, 13–17 May 2018. [Google Scholar]
- Svensson, K.; Neumann, A.; Menezes, F.; Lempp, C.; Pöllmann, H. Quantitative evaluation of the carbonation of Wollastonite. In Proceedings of the 20th Ibausil Conference, Weimar, Germany, 12–14 September 2018. [Google Scholar]
- Pöllmann, H. Mineralogical strategies to reduce CO2 in the fabrication of alternative cements. In Proceedings of the IBAUSIL Conference Replication, Weimar, Germany, 16–18 September 2015; Volume 1, pp. 111–129. [Google Scholar]
- Rice, J.; Ferry, J. Buffering, Infiltration, and the Control of Intensive Variables during Metamorphism. Rev. Mineral. 1982, 10, 263–326. [Google Scholar]
- CLUSTER. Joint Research Project CLUSTER. Available online: www.bgr.bund.de/CLUSTER/ (accessed on 3 September 2018).
- Svensson, K.; Neumann, A.; Pöllmann, H.; Menezes, F.; Lempp, C. Curing by carbonatisation of Wollastonite. GDCh-Conf. Bauchem. 2017, 52, 80–83. [Google Scholar]
- Gartner, E.; Hirao, H. A review of alternative approaches to the reduction of CO2 emissions associated with the manufacture of the binder phase in concrete. Cem. Concr. Res. 2015, 78, 126–142. [Google Scholar] [CrossRef]
- Vilani, C.; Spragg, R.; Tokpatayeva, R.; Olek, J.; Weiss, W. Characterizing the Pore Structure of Carbonated Natural Wollastonite. In Proceedings of the 4th International Conference on the Durability of Concrete Structures, Purdue University, West Lafayette, IN, USA, 24–26 July 2014. [Google Scholar]
- Sahu, S.; DeCristofaro, N. Solidia CementTM–Part One of a Two-Part Series Exploring the Chemical Properties and Performance Results of Sustainable Solidia CementTM and Solidia ConcreteTM; Solidia Technologies: Piscataway, NJ, USA, 2013; pp. 1–12. [Google Scholar]
- Abbasi, E.; Hassanzadeh, A.; Abbasian, J. Regenerable MgO-based surbent for high temperature CO2 removal from syngas: 2. Two-zone variable diffusivity shrinking core model with expanding product layer. Fuel 2013, 105, 128–134. [Google Scholar] [CrossRef]
- Longo, R.C.; Cho, K.; Brüner, P.; Welle, A.; Gerdes, A.; Thissen, P. Carbonation of Wollastonite(001) Competing Hydration: Microscopic Insights from Ion Spectroscopy and Density Dunctional Theory. Am. Chem. Soc. App. Mater. Interfaces 2015, 7, 4706–4712. [Google Scholar] [CrossRef] [PubMed]
- Bube, C.; Metz, V.; Bohnert, E.; Garbev, K.; Schild, D.; Kienzler, B. Long-Term cement corrosion in chloride-rich solutions relevant to radioactive waste disposal in rock salt–Leaching experiments and thermodynamic simulations. Phys. Chem. Earth 2013, 64, 87–94. [Google Scholar] [CrossRef]
- Jain, J.; Deo, O.; Sahu, S.; DeCristofaro, N. Solidia CementTM–Part Two of a Series Exploring the Chemical Properties and Performance Results of Sustainable Solidia CementTM and Solidia ConcreteTM; Solidia Technologies: Piscataway, NJ, USA, 2014; pp. 1–17. [Google Scholar]
- Jain, J.; Atakan, V.; DeChristofaro, N.; Jeong, H.; Olek, J. Performance of Calcium Silicate-Based Carbonated Concretes vs. Hydrated Concretes under Freeze-Thaw Environments; Solidia Technologies: Piscataway, NJ, USA, 2015; pp. 1–8. [Google Scholar]
- Ashraf, W.; Olek, J. Carbonation of hydraulic and non-hydraulic calcium silicates: Potential of utilizing low-lime calcium silicates in cement-based materials. J. Mater. Sci. 2016, 51, 6173–6191. [Google Scholar] [CrossRef]
- Ashraf, W.; Olek, J.; Atakan, V. Carbonation Reaction Kinetics, CO2 Sequestration Capacity, and Microstructure of Hydraulic and Non-Hydraulic Cementitious Binders. In Proceedings of the Fourth International Conference on Sustainable Constructuion Materials and Technologies, Las Vegas, NE, USA, 7–11 August 2016. [Google Scholar]
- Huijgen, W.J.J.; Witkamp, G.-J.; Comans, R.N.J. Mechanisms of aqueous Wollastonite carbonation as a possible CO2 sequestration process. Chem. Eng. Sci. 2006, 61, 4242–4251. [Google Scholar] [CrossRef]
- Rietveld, H.M. A profile refinement method for nuclear and magnetic structures. J. Appl. Crystallogr. 1969, 2, 65–71. [Google Scholar] [CrossRef] [Green Version]
- ICDD. Database Name (Database); Kabekkodu, S., Ed.; International Centre for Diffraction Data: Newtown Square, PA, USA, 2018. [Google Scholar]
- Degen, T.; Sadki, M.; Bron, E.; König, U.; Nénert, G. The Highscore suite. Powder Diffr. 2014, 29, 13–18. [Google Scholar] [CrossRef]
- Döbelin, N.; Kleeberg, R. Profex: A graphical user interface for the Rietveld refinement program BGMN. J. Appl. Crystallogr. 2015, 48, 1573–1580. [Google Scholar] [CrossRef] [PubMed]
- Bergmann, J.; Friedel, P.; Kleeberg, R. BGMN–A new fundamental parameters based Rietveld program for laboratory X-ray sources, it’s use in qualitative analysis and structure investigations. CPD Newsl. 1998, 20, 5–8. [Google Scholar]
- Kitano, Y. The Behavior of Various Inorganic Ions in the Separation of Calcium Carbonate from a Bicarbonate Solution. Bull. Chem. Soc. Jpn. 1962, 35, 1973–1980. [Google Scholar] [CrossRef] [Green Version]
- Kitano, Y.; Okumura, M.; Idogaki, M. Incorporation of sodium, chloride and sulfate with calcium carbonate. Geochem. J. 1975, 9, 75–84. [Google Scholar] [CrossRef]


| Phases | Content [wt.%] |
|---|---|
| Wollastonite | 90.7 ± 0.8 |
| Calcite | 1.9 ± 0.2 |
| Aragonite | 1.0 ± 0.5 |
| Amorphous | 6.4 ± 0.5 |
| Temperature [K] | Carbonation Medium | Gas Composition | Pressure [MPa] | Reaction Time [h] |
|---|---|---|---|---|
| 333 | water | CO2 | 2 | 24 |
| 333 | brine | CO2 | 2 | 24 |
| 333 | brine | CO2 + SO2 + NO2 | 2 | 0, 3, 6, 12, 18, 24 |
| Reaction Time [h] | Gas Composition | Weight Loss [%] | CO2 Content [wt.%] | Calculated Content of CaCO3 [wt.%] |
|---|---|---|---|---|
| 0 | --- | 2.1 | 1.7 | 3.9 |
| 3 | CO2 + SO2 + NO2 | 7.6 | 7.0 | 16.1 |
| 6 | CO2 + SO2 + NO2 | 13.4 | 12.2 | 28.0 |
| 12 | CO2 + SO2 + NO2 | 20.2 | 18.6 | 42.7 |
| 18 | CO2 + SO2 + NO2 | 22.4 | 21.4 | 49.0 |
| 24 | CO2 + SO2 + NO2 | 25.9 | 24.4 | 56.0 |
| 24 | CO2 | 25.7 | 24.3 | 55.8 |
© 2019 by the authors. Licensee MDPI, Basel, Switzerland. This article is an open access article distributed under the terms and conditions of the Creative Commons Attribution (CC BY) license (http://creativecommons.org/licenses/by/4.0/).
Share and Cite
Svensson, K.; Neumann, A.; Feitosa Menezes, F.; Lempp, C.; Pöllmann, H. Carbonation of Natural Wollastonite at Non-Ambient Conditions Relevant for CCS—the Possible Use as Cementitious Material in Wellbores. Appl. Sci. 2019, 9, 1259. https://doi.org/10.3390/app9061259
Svensson K, Neumann A, Feitosa Menezes F, Lempp C, Pöllmann H. Carbonation of Natural Wollastonite at Non-Ambient Conditions Relevant for CCS—the Possible Use as Cementitious Material in Wellbores. Applied Sciences. 2019; 9(6):1259. https://doi.org/10.3390/app9061259
Chicago/Turabian StyleSvensson, Kristoff, Andreas Neumann, Flora Feitosa Menezes, Christof Lempp, and Herbert Pöllmann. 2019. "Carbonation of Natural Wollastonite at Non-Ambient Conditions Relevant for CCS—the Possible Use as Cementitious Material in Wellbores" Applied Sciences 9, no. 6: 1259. https://doi.org/10.3390/app9061259