Prediction of Viscosity Values of Nanofluids at Different pH Values by Alternating Decision Tree and Multilayer Perceptron Methods

Vocation High School of Ilic Dursun Yildirim of Ilic Dursun Yildirim, Erzincan Binali Yildirim University, Ilic, Erzincan 24700, Turkey
*
Author to whom correspondence should be addressed.
Appl. Sci. 2019, 9(7), 1288; https://doi.org/10.3390/app9071288
Submission received: 13 February 2019
/
Revised: 16 March 2019
/
Accepted: 20 March 2019
/
Published: 27 March 2019
(This article belongs to the Special Issue Nanofluids and Their Applications 2019)
Abstract
:Due to the poor thermal properties of conventional thermal fluids such as water, oil and ethylene glycol, small solid particles are added to these fluids to enhance heat transfer. Since the viscosity change determines the rheological behavior of a liquid, it is very important to examine the parameters affecting the viscosity. Since the experimental viscosity measurement is expensive and time-consuming, it is more practical to estimate this parameter. In this study, CuO (copper oxide) nanoparticles were produced and then Scanning Electron Microscope (SEM) images analyses of the produced particles were made. Nanofluids were obtained by using pure water, ethanol and ethylene glycol materials together with the produced nanoparticles and the viscosity values were calculated by experimental setups at different density and temperatures. For the viscosity values of nanofluids, predictive models were created by using different computational intelligence methods. Mean square error (MSE), root mean square error (RMSE) and mean absolute percentage error (MAPE) error analyses were used to determine the accuracy of the predictive models. The multilayer perceptron method, which has the least error value in computational methods, was chosen as the best predicting method. The multilayer perceptron method, with an average accuracy of 51%, performed better than the alternating decision tree method. As a result, the viscosity increased with the increase in the pH of the nanofluids produced by adding CuO nanoparticles and decreased with the increase in the temperature of the nanofluids. The importance of this study is to create a predictive model using computational intelligence methods for viscosity values calculated with different pH values.
1. Introduction
Viscosity is one of the most important flow properties of fluids. The pumping power, the pumping power at the laminar flow and the convection heat transfer are directly related to the viscosity of the fluid. For these reasons, theoretical and experimental studies on the viscosity properties of nanoacids are carried out. In experimental studies, the relationship of viscosity with other parameters is investigated and these properties are parameters such as nanoparticle volumetric concentration, temperature, nanoparticle diameter, nanoparticle shape, nanoparticle aggregation, and pH value in nanofluids [1].
In many studies in the literature, it has been shown that some parameters such as temperature, particle size and shape, particle size distribution, surface tension, surfactant, and particle volume ratio significantly affect the viscosity values of nano-fluids [2,3,4]. In order to estimate the viscosity, Einstein [5] first developed a model in 1906 and then many models were developed (e.g., Krieger and Dougherty, Mooney, Batchelor, Nielsen, Brinkman, etc.). It is seen that some of the models developed by these researchers are suitable and some of them are unsuitable [6]. This situation varies depending on the geometric and chemical properties of the studied particles, the method of preparing the nanofluids and the temperature. Dybowska-Sarapuk et al. [7] used graphene nanoplatelet in their study with an average thickness of 8 mm and an average diameter of 10 nm. In order to examine the ink viscosity changes in inkjet printing, they used graphene nanoparticles. They studied the shear rate of ink in an inkjet printer nozzle. They reduced viscosity in inks using graphene and obtained higher quality printing. Tavman and Turgut [8] examined the changes in viscosity of SiO2–H2O, TiO2 –H2O, and Al2O3–H2O nanofluids at different volumetric ratios and temperatures. They observed an increase in viscosity with increasing volumetric ratio. TiO2–H2O nanofluids have similar results with water, which decreases viscosity with increasing temperature. In the test results for SiO2–H2O nanofluids, the Einstein model calculated that the viscosity was significantly higher than the Krieger–Dougherty model and Nielsen model. In addition, the viscosity of the TiO2–H2O nanofluids was higher than in the Einstein model. In addition to the theoretical models, the researchers determined that the viscosity of the nanofluids is directly related to the particle size, shape, temperature, dispersant and pH. Nguyen et al. [9] studied the effect of particle size on viscosity in aluminum-water nanofluids. In their study, they obtained the same results for particles with 36 and 47 nm in a 4% volumetric ratio. They stated that the viscosity of the large-sized particulate fluid is higher than the small-sized particulate fluid with the increase of the volumetric ratio. Weerapun and Somchai [10] found a 4–15% increase in viscosity for TiO2–water nanofluids with a volumetric ratio of 0.2–2.0% in the 15–53 °C temperature range. Jia-Fei et al. [11] reported that the viscosity of silicon dioxide nanofluids for nanoparticles of less than 20 nm was dependent on pH. They observed a viscosity fluctuation between pH values of 5 and 7 and a decrease in viscosity for pH < 5. They think that this fluctuation is due to the size of the flocculation and the electrical double layer of particles. They stated that the higher the volumetric ratio, the greater the viscosity of the particulate fluid is higher than the small-sized particulate fluid. Miastkowska et al. [12] studied nanoemulsions suitable for selected odor compounds without ethanol, polyols and ionic surfactants. Optimized nano-perfumed formulations prepared by different methods have produced a fragrance composition concentration in the range of 6–15%. They examined the change in the viscosity of the formulations with pH and indicated that the low viscosity values had a pH appropriate for the skin.
There are many valuable studies in the literature for the estimation of nanofluid viscosity. Hemmati-Sarapardeh et al. Calculated the viscosities of different nanoparticles prepared with a total of 11 nanoparticles in the range of 4 to 190 nm nanoparticle sizes in the range of 0% to 10% nanoparticle volumes in the temperature range of −35 to 80 °C. Multilayer Perceptron (MLP), Support Vector Machine (SVM) and Genetic Algorithm have calculated prediction models using computational intelligence methods. They used nanofluid temperature, nanoparticle size, nanoparticle percentage, and nanofluids density for the input data used in computational intelligence models. They used the nanofluid viscosity for the output data. They use the root mean square error (RMSE) error analysis to determine the accuracy of the methods. In the computational intelligence methods used for viscosity estimation, the MLP method yielded a more accurate result than the other methods with an RMSE error rate of 0.1 [13]. Afrand et al. estimated the viscosity of multi-walled carbon nanotubes/water nanofluid with an optimal neural network using experimental data in their study. ANN used solid volume fraction and temperature values in the predictive model as input variables, and their viscosity values as output variables. ANN also used 268 data values to generate a predictive model for viscosity. They used MAPE and MSE error analysis for the accuracy of the model. They obtained a successful model according to the results of 0.28 MSE and 0.910 MAPE error analyses [14]. Meybodi et al. Performed nanofluidic viscosity modeling with a total of 801 data values consisting of % volume nanoparticle values used for nanofluid temperature, nanoparticle size and Al2O3, TiO2, SiO2 and CuO nanofluids. For modeling, Least Squares Support Vector Machines (LSSVM) have used computational intelligence. For the accuracy of the model, absolute absolute error (AARE) and RMSE error analysis were applied. The LSSVM method estimated the nanofluidic viscosity values with an analysis value of 3.7084 RMSE and a value of 2.1435 AARE for the error analyses [15]. Karimi et al., used an accurate and effective artificial neural network (ANN) based on the genetic algorithm (GA) predicted 8 different nanofluids viscosity. Genetic algorithm (GA) has been used to optimize neural network parameters. The results showed that the GANN model was in good agreement with the experimental data with a 2.48% mean square error (MSE) error analysis result. The results also indicated that the GANN model performed better than traditional neural networks in predicting the viscosity of nanofluids with a percentage of 39% accuracy [16]. Ansari et al., In their study, have developed a predictive model for the relative viscosity of various nanofluids using feedback-propagation MLP neural networks. The model used a total of 1620 experimental data values to train, test and verify the proposed network. As the input variables of the developed network, they chose the nanofluid temperature, shear rate values, nanoparticle size, particle structure (nanoparticle density) and particle concentration. As a result, they showed that the network they proposed was capable of accurately predicting viscosity with a general average square error (MSE) of 0.00901 [17]. Esfe et al., in their studies, formed the niofluid samples TiO2/SAE 50 nano-lubricant by a two-stage method using a mixer and ultrasonic device. To estimate the viscosity values of the nanofluids they obtained, they applied three artificial intelligence methods including the Genetic Algorithm-Radial Basic Function Neural Network (GA-RBF), Smallest Square Support Vector Machine (LS-SVM) and Gene Expression Programming (GEP). They used the RMSE error analysis to investigate the accuracy of the proposed models. They demonstrated the accuracy of the proposed models with an average value of 0.58 RMSE [18].
In this study, the CuO nanoparticles were produced at different pH levels. Nanofluids were obtained by using CuO Nanoparticles with pure water, Ethanol and Ethylene Glycol materials. The viscosities of the obtained nanofluids in different Reynolds numbers were measured. The predicted models were obtained by using multilayer perceptron (MLP), alternating decision tree (ADTree) algorithms for computational intelligence methods. Mean square error (MSE), root mean square error (RMSE) and mean absolute percentage error (MAPE) error analyses were used to determine the accuracy of predictive models.
2. Materials and Methods
In our study, CuO (Carlo Erba Reagents, Val de Reuil, France) nanoparticles were produced and nanofluids were obtained by adding certain amounts of pure water, ethylene glycol (Merck Millipore, Burlington, MA, USA) and ethanol (Merck Millipore, Burlington, MA, USA) into the mixture. The viscosity and average speed of the produced nanofluids were calculated. For the calculated viscosity values, predictive models were obtained by using the computational intelligence method ADTree and MLP.
2.1. CuO Nanofluids Production
In CuO particle production, 3.633 g (0.02 mol) of Copper Acetate was dissolved in 100 mL ethanol for 30 min in an ultrasonic bath. Then, 8 g (0.2 mol) of NaOH (Carlo Erba Reagents, Val de Reuil, France) and 200 mL of pure water were added to the resulting mixture and dissolved in an ultrasonic bath for 30 min. Then, the resulting mixtures were combined and stirred in the fish mixer for 1 h. In order to obtain the mixture at different pH ratios, ammonia was added to the mixture with a 10 mL beaker. The mixture was allowed to precipitate for 20 h after preparation. After the waiting process, filter paper was placed in the funnels and the material was subjected to the drying process at 50 °C. Finally, the material obtained was heat-treated at 450 °C for 1 h. SEM image analyses were performed to determine whether the material produced was a nanoparticle and whether nanoparticle production was successful.
After the production of CuO nanoparticles, the materials used for the production of nanofluids are 57.1% Pure Water, 28.6% Ethylene Glycol and 14.3% Ethanol. 0.1%, 0.2%, and 0.3% CuO nanoparticles were added to the solution of pure water, ethylene glycol and ethanol and then stirred for 45 min in an ultrasonic mixer. The nanofluids formed as a result of the mixture is ready for use in the experimental setup. After determining the density of the produced nanofluids, pH values were determined using a pH measuring device. Experiments were performed for 5 different Reynolds values between 846 and 2292 for the produced nanofluids.
Scanning Electron Microscope Analysis
Basically, the scanning electron microscope (SEM), Tungsten, Lantana hexane boron cathode or the field emission (FEG) from the day of the use of the electrons emerging from the surface to be examined (as a result of the interaction) is based on the interaction. In general, this electron energy in SEM can range from 200–300 eV to 100 keV. For this purpose, the electron beam, which is collected by the concentrator electromagnetic lens (condenser lens), focuses on the lens and perform scanning on the sample surface with electromagnetic deflector coils. The formation of images in a scanning electron microscope is basically based on the principle of collecting and examining the signals resulting from the physical interactions with the surface of the electron beam (elastic, non-elastic collisions and others). In the SEM device, the electrons in the electron bundle are the secondary electrons that emerge as a result of the non-elastic collision with the atoms in the material (i.e., transferring their energies to the electrons in the atoms on the sample surface). These electrons emerge from a depth of about 10 nm of the sample surface, and their typical energies are at most 50 eV. Secondary electrons are collected by means of the photomultiplier tube and associated with the scan signal location, for example, to obtain a surface image [19].
The nanoparticle images at different pH values taken with the SEM display device (JSM-7001F, Tokyo, Japan) are shown in Figure 1 respectively.
The nanoparticles, defined as dusts, whose dimensions are less than or equal to 100 nm, form the basis of nanoscale materials and, thus, nanotechnology [20]. According to SEM analysis images in Figure 1, the morphological structure and dimensions of the CuO nanoparticles produced at various pH were found to be successful in the production of nanoparticles.
2.2. Viscosity Measurement, the Average Speed (Vavr) and Reynolds Calculations of Nanofluids
The viscosity and density of nanofluids obtained by adding 0.1%, 0.2% and 0.3% CuO nanomaterials were calculated with an SV-10 viscometer at different pH values and different temperature values. The viscometer is used for liquids that cannot be identified with a single viscosity value. Therefore, more parameters should be set and measured than for a viscometer. The viscometer determines the viscosity of the nanofluids and allows the viscosity values to be examined in the face of temperature variations.
In order to create a more precise model of computational intelligence methods used in the viscosity estimation, the number of data values must be increased. In order to increase the number of data, the Reynolds number and average speed values, which are the most important parameters in determining the flow type, were selected. The average velocity and Reynolds numbers were calculated with the help of the experimental setup in Figure 2. In the experimental setup, the temperature of the in-pipe nanofluids obtained by the heat band and the temperature values where the viscosity measurements are made are the same.
As shown in Figure 2, the flow rate of nanofluids is adjusted by means of a flow rate control valve. Temperature measurements were taken from 4 different points on the surface of the pipe with the help of the thermocouples of the nanofluids passing through the copper pipe through laminar flow. The inlet and outlet temperatures of the nanofluids to the copper tube were measured by means of a fluid thermometer. The volumetric flow rate of the nanofluids was determined by means of the flow meter.
In heating and cooling applications, the average speed may vary slightly due to density and temperature changes. In practice, however, we evaluate fluid properties by taking fluid properties at an average temperature and treat them as fixed. The suitability of working with fixed features often compensates for a slight deviation from accuracy. The Reynolds number for the internal flow in the circular pipe is defined as follows [21].
In Equation (1), μ is viscosity (kg/m·sn), υ is kinematic viscosity (m2/sn), D is pipe diameter (m), ρ is density (kg/m3) and Vavr is mean flow velocity (m/s).
We have already calculated the density and viscosity values. After calculating the average speed of the nanofluids with device 7 in Figure 3, the Reynolds number is calculated with the help of Equation (1).
A diagrammatic representation of the measurements taken in the experimental setup is given in Figure 3.
2.3. Computational Intelligence Methods
Computational intelligence methods use various datasets to make predictions or classifications. In this study, Alternating Decision Tree and Multilayer Perceptron computational intelligence methods were used to estimate the experimentally calculated viscosity values. The input parameters in the computational intelligence methods used to estimate the viscosity were selected as the Reynolds number (Re), power value (pH), percentage of nanoparticles used for the production of nanofluids (%Nanoparticles), temperature of the nanofluids in the experimental setup (Temperature), nanofluids density (Density), and average speed of the nanofluids in the experimental setup (Average Speed). The viscosity of nanofluids (Viscosity) was used as the output parameter.
2.3.1. Alternating Decision Tree
Decision trees are potentially strong predictors and provide a clear concept description for a dataset. Decision tree learners are popular because they are fast and they produce models that perform well with a variety of features [22,23]. The root node, which is the first node of the tree, starts to ask questions for the estimation of the data and the structure of the tree, and this process continues until nodes or leaves without branches are found [24].
The Alternative Decision Tree (ADTree) consists of decision nodes and prediction nodes. The decision states an action result. Prediction nodes contain a single number. Alternative decision trees always have prediction nodes as both the root and leaves. The classification or prediction for a dataset is made by following the paths of each forecast node and all decision nodes [25].
The learning algorithm must be 1 <= i <= n and n is provided through the sample (x⃗i; yi). x⃗i indicates an attribute value indicating the vector and yi indicates the target value. When an external vector x is entered, this model is used to estimate the value corresponding to the y value. The purpose of this model is to minimize the error between the estimated value and the actual value. The method uses the basic algorithm of incremental regression by using an advanced stepwise additive model at the stage of learning additive model trees [26].
If a model consisting of k base model is created;
the error squared on a progressive state;
is minimized through n training samples.
The alternating decision tree method, which is used for estimating the viscosity values of nanofluids, was applied by using the MATLAB 2018b software (MathWorks). The ADTree M5P algorithm was used in the MATLAB software.
Figure 4 shows the tree structure used by the alternating decision tree algorithm to estimate viscosity values. In Figure 4, the viscosity values were estimated according to the rules in the branches of trees depending on the values of the average speed, Reynolds, pH, and density in the alternating decision tree.
In Figure 5, the average speed parameter forms the root part of the tree. Reynolds pH and Density form the inner root. LM1-5 forms the leaves. The ADTree algorithm continues to apply rules until the data is separated by the decisions in the branches and reaches the LM values. The ADTree algorithm sets the rules and roots randomly.
2.3.2. Multilayer Perceptron
The concept of artificial intelligence entered the lives of scientists as a result of long-term studies in the computer model of the human brain. A new domain name, which they call artificial neural networks, was followed by following these steps. An artificial neural network technique, reliable results and the active use of nonlinear problems in the solution of the problem has led to their widespread use over time.
Feed-forward neural networks (ANN) are often used as classifiers for model classification approaches involving a multi-layer perceptron (MLP). In general, the software application of MLP neural networks is used in the algorithm development phase, where parallel and low latency approaches are not required. However, in real-world applications, high-speed processing and low latencies are needed to carry out ANN in real-time constraints [27].
MLP is an ANN made up of multiple neuronal layers in a feed-through architecture. A multi-layer sensor consists of three or more layers with one input, one output, and one or more hidden layers. Considering that the MLP is a fully connected network, each neuron in each layer is the link to the next layer with a certain weight function. MLP uses a supervised learning technique called backpropagation. The weight function is defined in the training phase of the neural network [28].
The prediction of viscosity values with MLP was done using the MATLAB 2018b software. A total of 420 data values were used in the MLP model. A total of 294 data values were used for training and 126 data values were used for the test. The MLP network structure used for the estimation of h is shown in Table 1.
The structure of the MLP was given in Figure 5. The MLP structure shown in Figure 5 consists of 6 input parameters, 1 output parameter and 2 hidden layers.
The formula and parameters of the mean square error (MSE), root mean square error (RMSE) and mean absolute percentage error (MAPE) error analysis used to determine the accuracy rates of computational intelligence methods are shown in Table 2.
3. Results
In this study, the viscosity values of CuO nanofluids at various pH and temperatures for the nano-liquids obtained using the nanomaterials produced are inversely proportional to the temperature values between 20 and 60 °C. Figure 6 shows an inverse relationship between temperature and viscosity.
According to Figure 6, the viscosity value increased when the pH value increased, but the viscosity value decreased when the temperature increased.
Figure 7 shows the average velocity-viscosity values at a Reynolds number of 2300 and at a temperature of 20 °C. Figure 7 is the viscosity-average velocity graph of the nanofluids obtained by adding CuO at different percentages. According to this graph generated, at different pH values, the viscosity value increased as the pH ratio increased. At the same time, the higher the CuO ratio, the higher the viscosity value. The increase in the viscosity value due to the increase in the average velocity value can be explained by the increase in the amount of CuO.
Creating Predictive Models for Viscosity Values with ADTree and MLP
The error rates for ADTree and MLP predicted models created for viscosity values of CuO nanofluids were shown in Table 3.
In the literature, different studies have been performed to create a predictive model of various nanofluidic viscosities by using computational intelligence methods. These studies are shown in Table 4.
Table 4 shows the nanoacetic type, the number of data values, the predictive method, the type of error analysis and the results of the error analysis. In our study, the results of the RMSE error analysis of the methods used to estimate the viscosity of the nanofluids have less error than the results of the RMSE error analysis of the studies in Table 4.
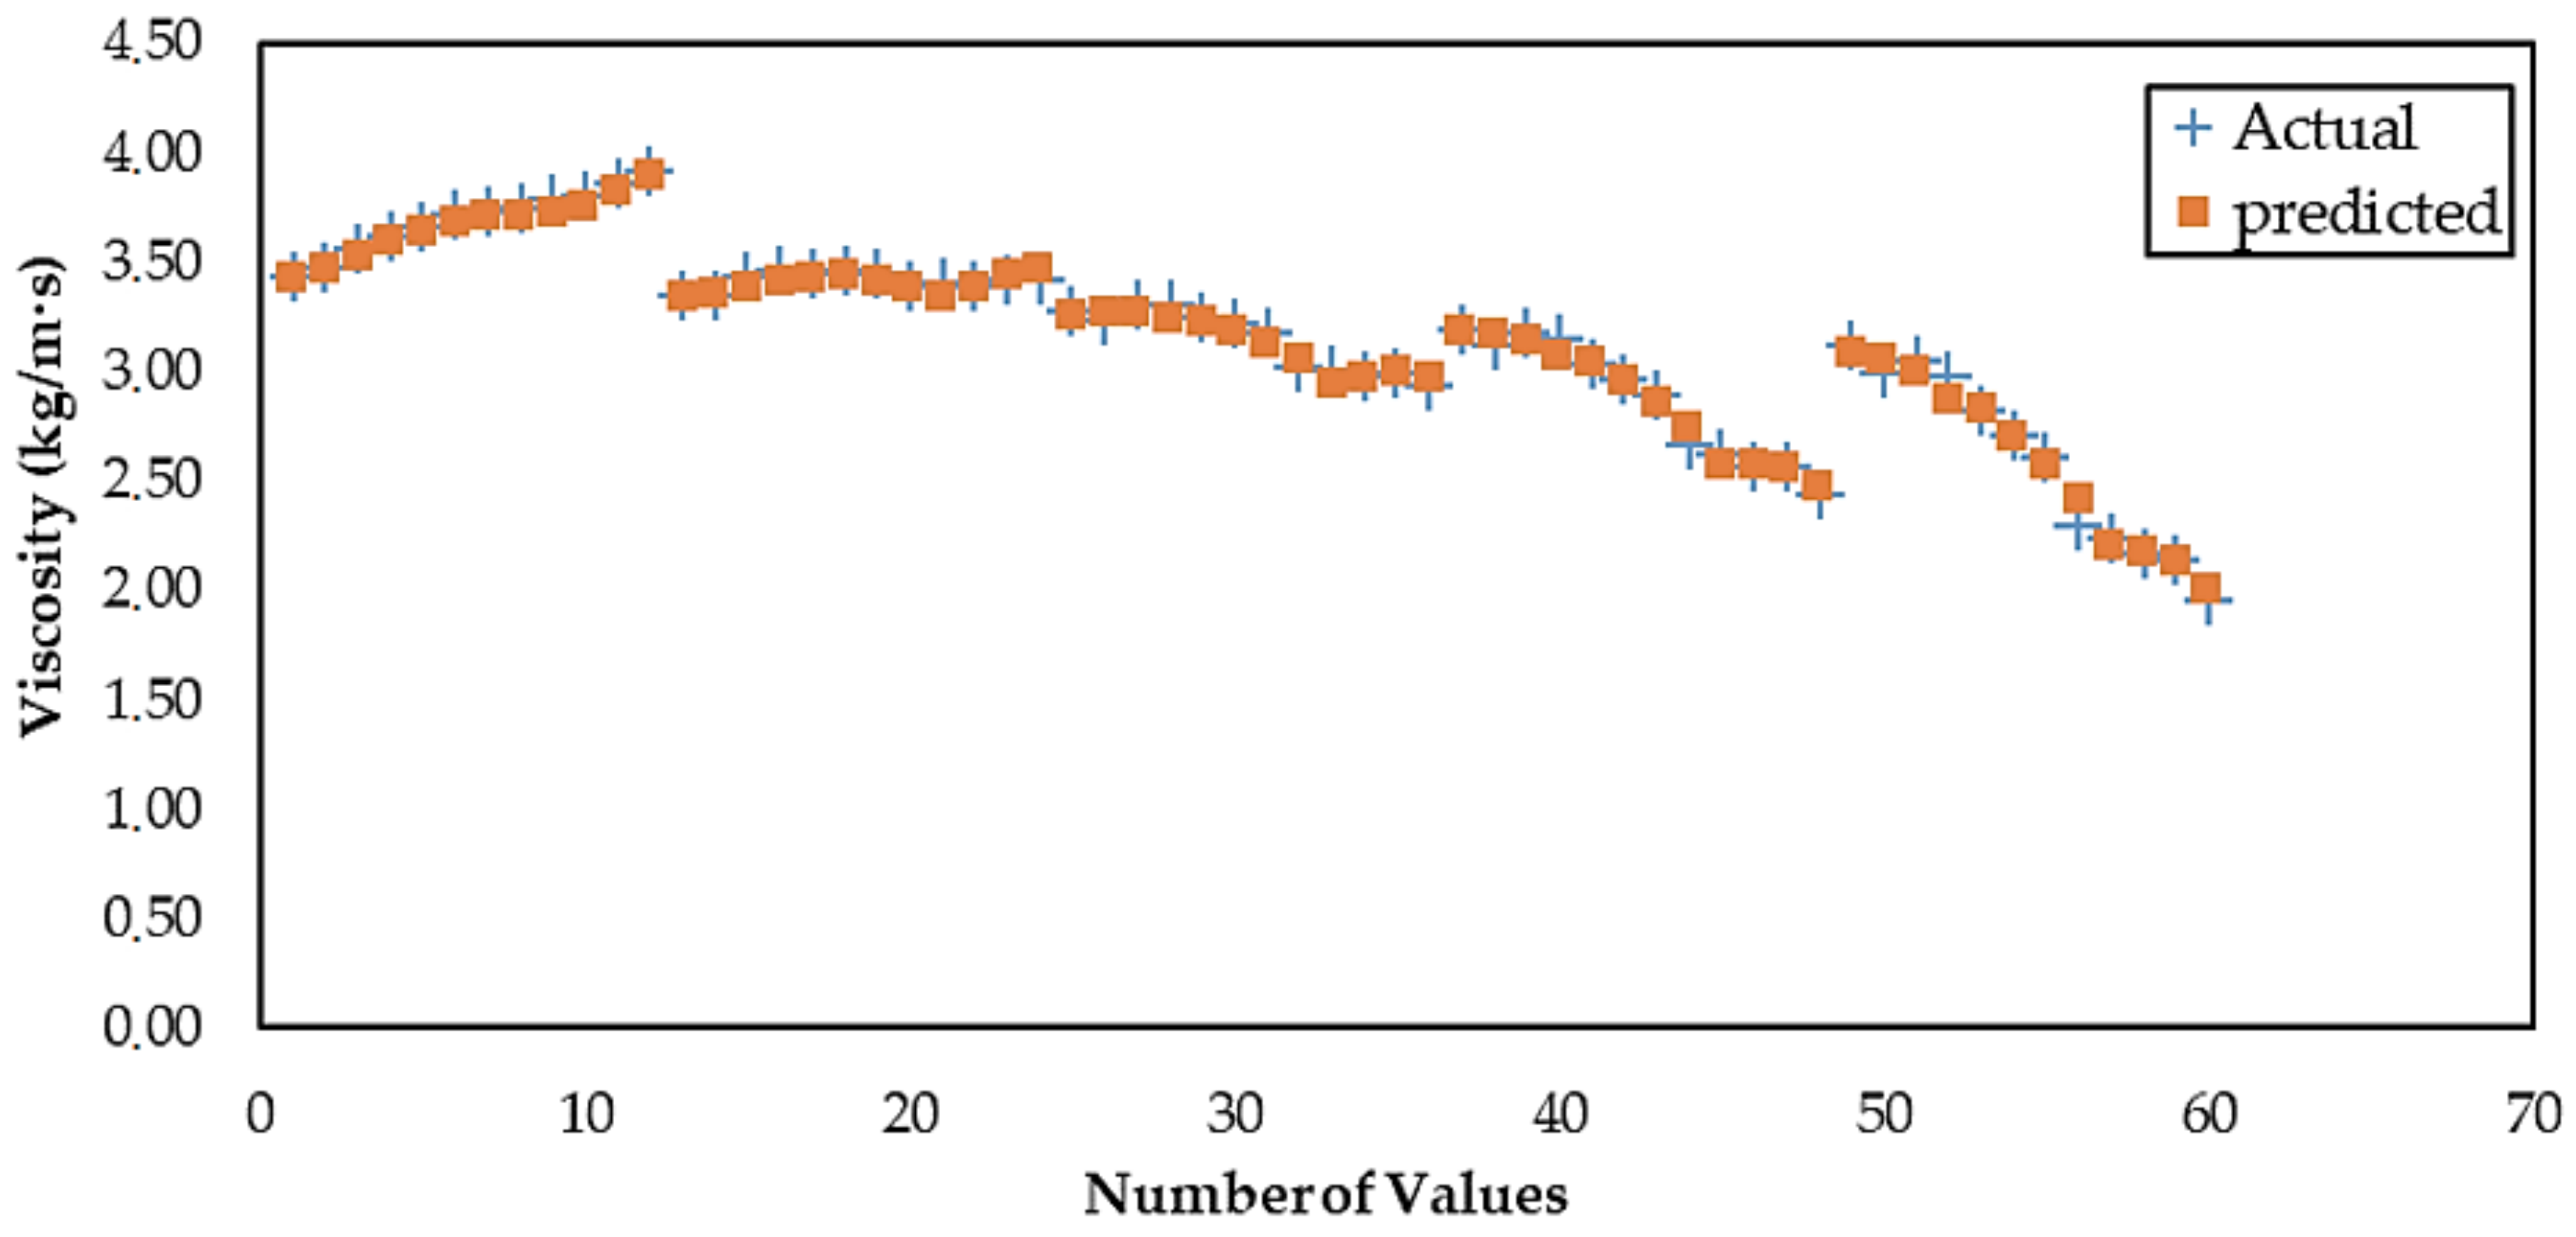
Figure 8 and Figure 9 show the viscosity values estimated by computational intelligence methods and the viscosity values calculated from the experimental study.
Figure 8 and Figure 9 show the experimental and predictive data. The data given in the form of plus are predictive and the data given in square form are experimental. The predictive viscosity values are the values obtained using the input parameters specified in Section 2.3 with MLP and DT, which is a machine learning algorithm. The fact that the experimental data and the predictive data are close to each other indicate a more accurate estimation.
In Figure 8 and Figure 9, the predictive values obtained by both computational intelligence methods in the figures are similar to the actual values. In the actual and predictive viscosity values shown in Figure 8 and Figure 9, the predictive values made with MLP are closer to the actual values. This can be explained by the results of the error analysis in Table 2. The results of the error analysis in the MLP method are lower than the error analysis results in ADTree method. According to the values in Table 2, the MLP method has a more accurate estimate of 50% than the ADTree method.
4. Conclusions
Our work, the SEM images analyses of the particles produced after the production of CuO nanoparticles, has been shown to be successful in the production of nanoparticles. The viscosity values of the nanofluids were examined with temperature and pH values in the experimental setup. It was observed that the viscosity values decreased with increasing temperature values and increased with increasing pH values.
In the computational intelligence methods used to estimate the viscosity values, the estimated values are similar to actual values. In the predictive methods, it was concluded that multilayer perceptron was a successful model for the predictive modeling of viscosity values according to the results of the error analysis (Table 3). As shown in Figure 9, the actual and predictive viscosity values are very close to each other. By using different nanofluids or by increasing the measurement ranges, more data can be obtained and different computational intelligence methods with fewer errors can be used.
Author Contributions
The paper was written by A.B.D. under the guidance of M.D. The formal analysis and pre-literature research were carried out by M.D. and A.B.D. The experiment was performed by A.B.D. The computational intelligence methods were carried out by M.D.
Conflicts of Interest
The authors declare no conflicts of interest.
References
- Elcioglu, E.B.; Yazicioglu, A.G.; Kakac, S. A Comparative Evaluation on Nanofluid Viscosity. J. Therm. Sci. Technol. 2014, 34, 137–151. [Google Scholar]
- Xie, H.; Li, L.; Sun, Y.; Wang, Y.; Gao, S.; Tian, Y.; Ma, X.; Guo, C.; Bo, F.; Zhang, L. An Available Strategy for Nasal Brain Transport of Nanocomposite Based on PAMAM Dendrimers via In Situ Gel. Nanomaterials 2019, 9, 147. [Google Scholar] [CrossRef] [PubMed]
- Vigani, B.; Rossi, S.; Milanesi, G.; Bonferoni, M.C.; Sandri, G.; Bruni, G.; Ferrari, F. Electrospun Alginate Fibers: Mixing of Two Different Poly (ethylene oxide) Grades to Improve Fiber Functional Properties. Nanomaterials 2018, 8, 971. [Google Scholar] [CrossRef]
- Mishra, P.C.; Mukherjee, S.; Nayak, S.K.; Panda, A. A brief review on viscosity of nanofluids. Int. Nano Lett. 2014, 4, 109–120. [Google Scholar] [CrossRef] [Green Version]
- Einstein, A. Eineneuebestimmung der molekuldimensionen. Ann. Phys. 1906, 324, 289–306. [Google Scholar] [CrossRef]
- Phuoc, T.X.; Massoudi, M. Experimental observations of the effects of shear rates and particle concentration on the viscosity of Fe2O3–deionized water nanofluids. Int. J. Therm. Sci. 2009, 48, 1294–1301. [Google Scholar] [CrossRef]
- Dybowska-Sarapuk, L.; Kielbasinski, K.; Arazna, A.; Futera, K.; Skalski, A.; Janczak, D.; Sloma, M.; Jakubowska, M. Efficient Inkjet Printing of Graphene-Based Elements: Influence of Dispersing Agent on Ink Viscosity. Nanomaterials 2018, 8, 602. [Google Scholar] [CrossRef] [PubMed]
- Tavman, I.; Turgut, A. An ınvestigation on thermal conductivity and viscosity of water based nanofluids. Microfluid. Based Microsyst. NATO Sci. Peace Secur. Ser. A Chem. Biol. 2010, 23, 139–162. [Google Scholar]
- Nguyen, C.T.; Desgranges, F.; Gilles, R.; Nicolas, G.; Thierry, M.; Boucher, S. Temperature and particle-size dependent viscosity data for water-based nanofluids–hysteresis phenomenon. Int. J. Heat Fluid Flow 2007, 28, 1492–1506. [Google Scholar] [CrossRef]
- Weerapun, D.; Somchai, W. Measurement of temperature dependent thermal conductivity and viscosity of TiO2 water nanofluids. Exp. Therm. Fluid Sci. 2009, 33, 706–714. [Google Scholar]
- Zhao, J.-F.; Luo, Z.-Y.; Ni, M.-J.; Cen, K.-F. Dependence of nanofluid viscosity on particle size and pH value. Chin. Phys. Lett. 2009, 26, 066202. [Google Scholar]
- Miastkowska, M.; Lasoń, E.; Sikora, E.; Wolińska-Kennard, K. Preparation and Characterization of Water-Based Nano-Perfumes. Nanomaterials 2018, 8, 981. [Google Scholar] [CrossRef]
- Hemmati-Sarapardeh, A.; Varamesh, A.; Husein, M.M.; Karan, K. On the evaluation of the viscosity of nanofluid systems: Modeling and data assessment. Renew. Sustain. Energy Rev. 2018, 81, 313–329. [Google Scholar] [CrossRef]
- Afrand, M.; Nadooshan, A.A.; Hassani, M.; Yarmand, H.; Dahari, M. Predicting the viscosity of multi-walled carbon nanotubes/water nanofluid by developing an optimal artificial neural network based on experimental data. Int. Commun. Heat Mass Transf. 2016, 77, 49–53. [Google Scholar] [CrossRef]
- Meybodi, M.K.; Naseri, S.; Shokrollahi, A.; Daryasafar, A. Prediction of viscosity of water-based Al2O3, TiO2, SiO2, and CuO nanofluids using a reliable approach. Chemom. Intell. Lab. Syst. 2015, 149, 60–69. [Google Scholar] [CrossRef]
- Karimi, H.; Yousefi, F.; Rahimi, M.R. Correlation of viscosity in nanofluids using genetic algorithm-neural network (GA-NN). Heat Mass Transf. 2011, 47, 1417–1425. [Google Scholar] [CrossRef]
- Ansari, H.R.; Zarei, M.J.; Sabbaghi, S.; Keshavarz, P. A new comprehensive model for relative viscosity of various nanofluids using feed-forward back-propagation MLP neural networks. Int. Commun. Heat Mass Transf. 2018, 91, 158–164. [Google Scholar] [CrossRef]
- Esfe, M.H.; Tatar, A.; Ahangar, M.R.H.; Rostamian, H. A comparison of performance of several artificial intelligence methods for predicting the dynamic viscosity of TiO2/SAE 50 nano-lubricant. Phys. E Low Dimens. Syst. Nanostruct. 2018, 96, 85–93. [Google Scholar] [CrossRef]
- Gil, E.; Cortés, J.; Iturriza, I.; Ordás, N. XPS and SEM analysis of the surface of gas atomized powder precursor of ODS ferritic steels obtained through the STARS route. Appl. Surf. Sci. 2018, 427, 182–191. [Google Scholar] [CrossRef]
- Miller, J.C.; Serrato, R.; Represas-Cardenas, J.M.; Kundahl, G. The Handbook of Nanotechnology; John Wiley & Sons, Inc.: Hoboken, NJ, USA, 2004. [Google Scholar]
- Çengel Yunus, A. Practical Approach to Heat and Mass Transfer, 3rd ed.; McGraw Hill: New York, NY, USA, 2010; pp. 467–468. [Google Scholar]
- Sikandar, A.; Anwar, W.; Bajwa, U.I.; Wang, X.; Sikandar, M.; Yao, L.; Jiang, Z.L.; Chunkai, Z. Decision Tree Based Approaches for Detecting Protein Complex in Protein Protein Interaction Network (PPI) via Link and Sequence Analysis. IEEE Access 2018, 6, 22108–22120. [Google Scholar] [CrossRef]
- Shirzadi, A.; Soliamani, K.; Habibnejhad, M.; Kavian, A.; Chapi, K.; Shahabi, H.; Chen, W.; Khosravi, K.; Thai Pham, B.; Pradhan, B.; et al. Novel GIS Based Machine Learning Algorithms for Shallow Landslide Susceptibility Mapping. Sensors 2018, 18, 3777. [Google Scholar] [CrossRef] [PubMed]
- Pal, M.; Mather, P.M. An assessment of the effectiveness of decision tree methods for land cover classification. Remote Sens. Environ. 2003, 86, 554–565. [Google Scholar] [CrossRef]
- Freund, Y.; Mason, L. The Alternating Decision Tree Learning Algorithm; ICML Academic Press: San Francisco, CA, USA, 1999; Volume 99, pp. 124–133. [Google Scholar]
- Frank, E.; Mayo, M.; ve Kramer, S. Alternating model trees. In Proceedings of the 30th Annual ACM Symposium on Applied Computing, Salamanca, Spain, 13–17 April 2015; pp. 871–878. [Google Scholar]
- Zhai, X.; Ali, A.A.S.; Amira, A.; Bensaali, F. MLP neural network based gas classification system on Zynq SoC. IEEE Access 2016, 4, 8138–8146. [Google Scholar] [CrossRef]
- Rehman, I.U.; Nasralla, M.M.; Philip, N.Y. Multilayer Perceptron Neural Network-Based QoS-Aware, Content-Aware and Device-Aware QoE Prediction Model: A Proposed Prediction Model for Medical Ultrasound Streaming Over Small Cell Networks. Electronics 2019, 8, 194. [Google Scholar] [CrossRef]
- Das, M.; Akpinar, E.K. Investigation of Pear Drying Performance by Different Methods and Regression of Convective Heat Transfer Coefficient with Support Vector Machine. Appl. Sci. 2018, 8, 215. [Google Scholar] [CrossRef]
Figure 1.
The scanning electron microscope (SEM) image of CuO, (a) CuO pH 7 nanoparticle; (b) CuO pH 10 nanoparticle; (c) CuO pH 12 nanoparticle; (d) CuO pH 14 nanoparticle.
Figure 1.
The scanning electron microscope (SEM) image of CuO, (a) CuO pH 7 nanoparticle; (b) CuO pH 10 nanoparticle; (c) CuO pH 12 nanoparticle; (d) CuO pH 14 nanoparticle.

Figure 2.
The experimental setup (1) Pump; (2) T Connection reducer elbow pipe; (3) Heat Band; (4) Copper pipe; (5) Plastic pipe; (6) Flow Measurement Electronic device sensor; (7) Flow Measurement Electronic device; (8) Fluid reservoir; (9) Flow Adjustment Valve; (10) Fluid Thermometer; (11) Thermocouple.
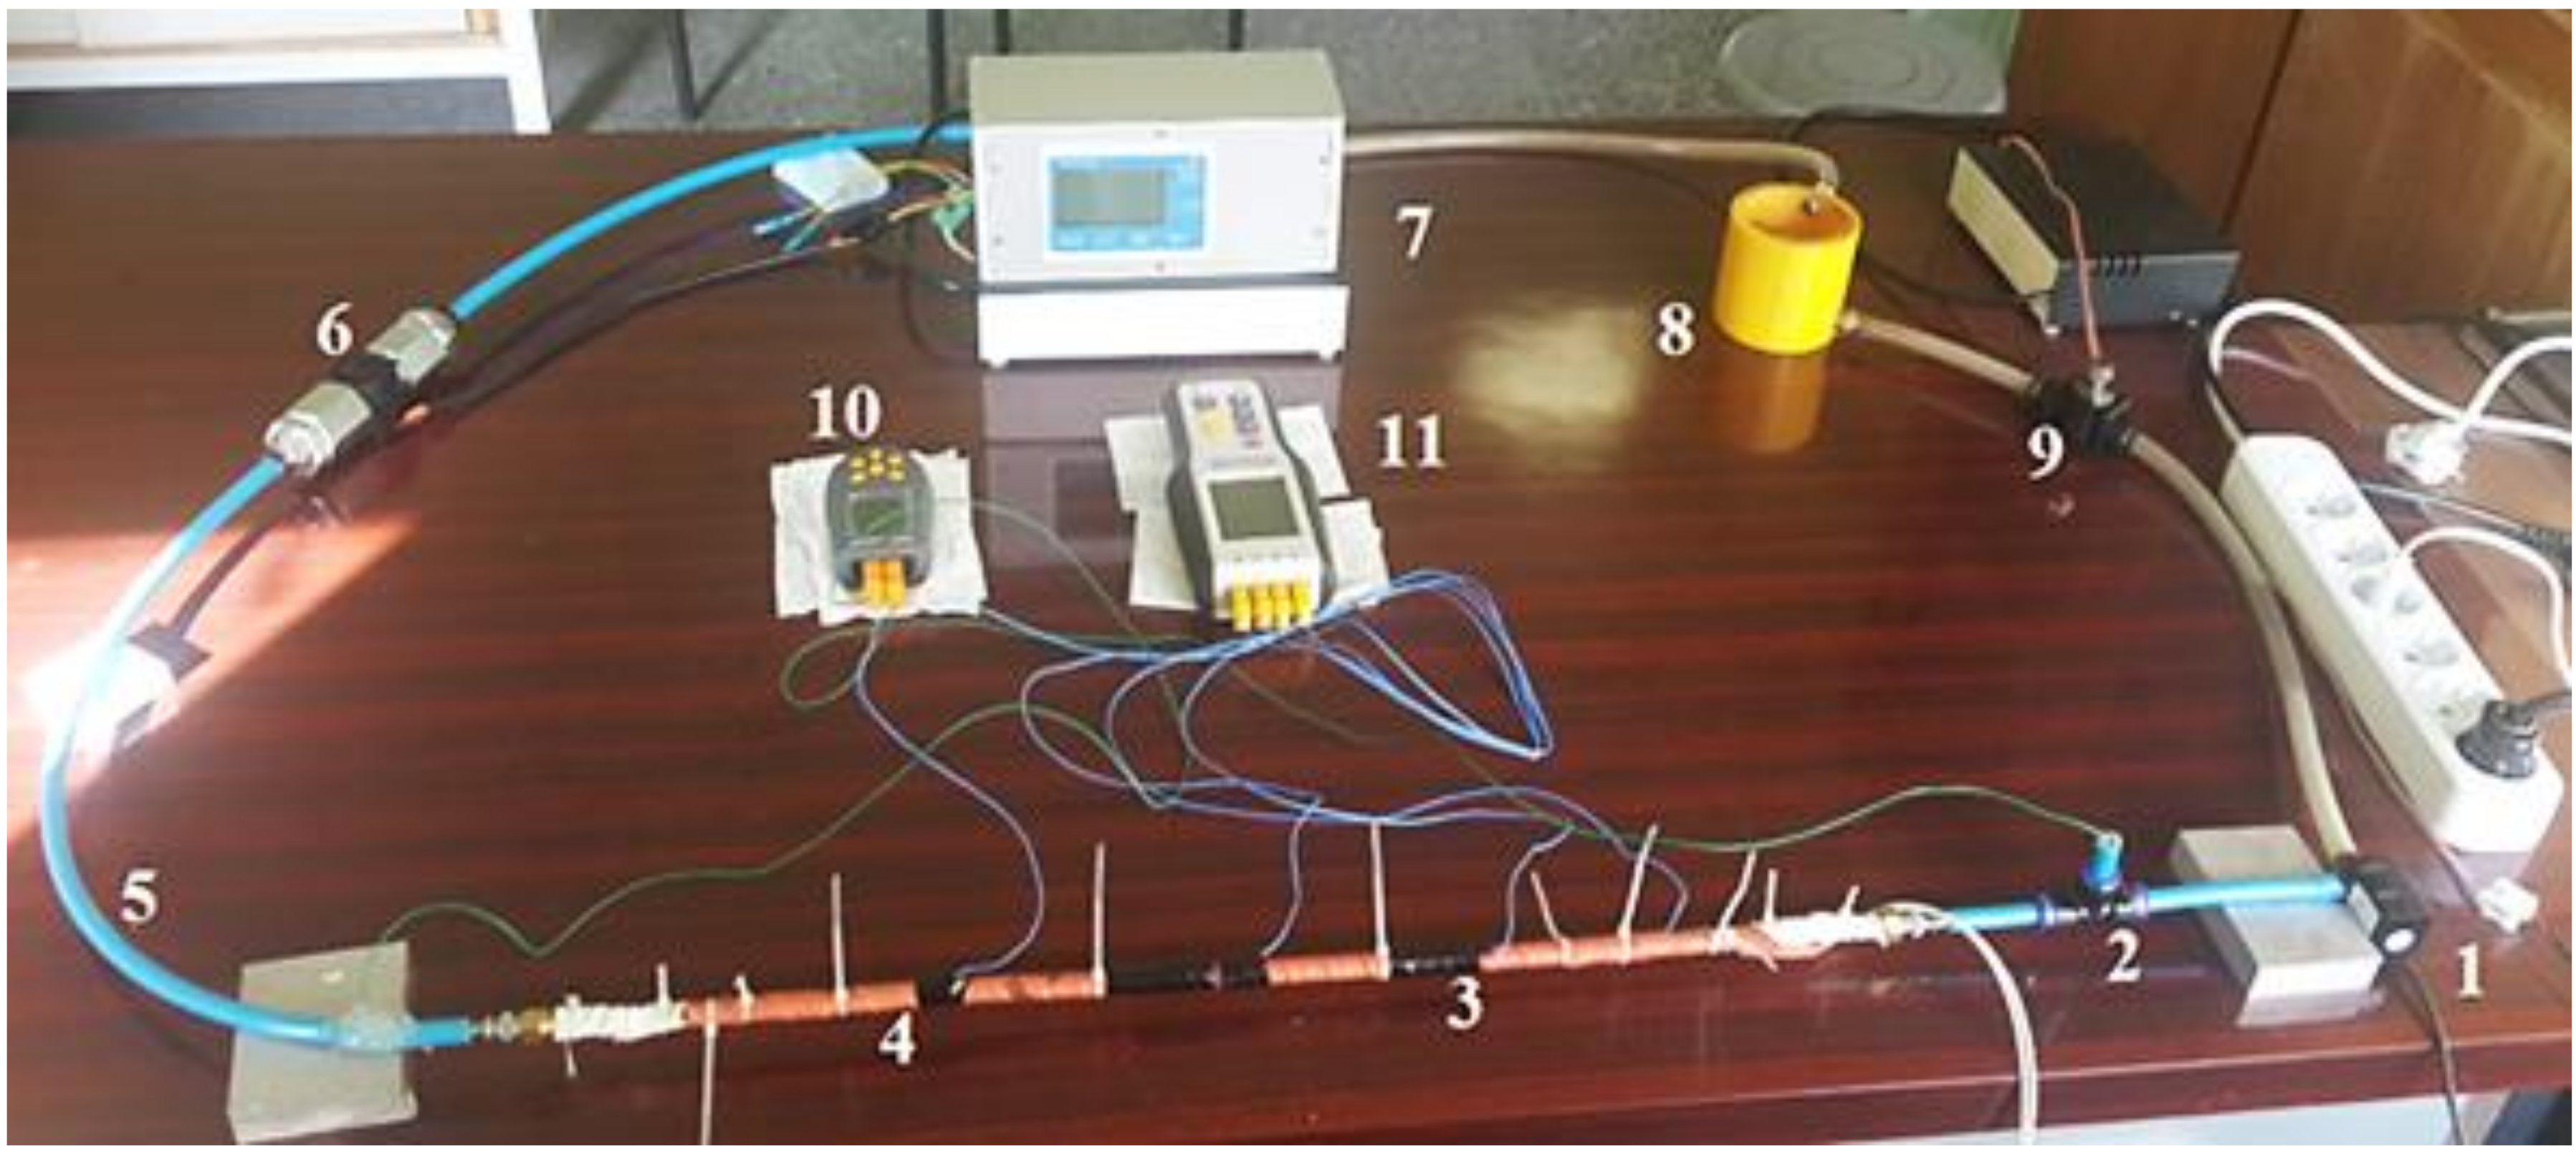
Figure 3.
The diagram of measurements made in the experimental setup.

Figure 4.
The tree structure.

Figure 5.
The network structure of multilayer perceptron (MLP).

Figure 6.
The experimental measurement of the viscosity of the CuO solution as a function of T with various pH values and weight % values.
Figure 6.
The experimental measurement of the viscosity of the CuO solution as a function of T with various pH values and weight % values.
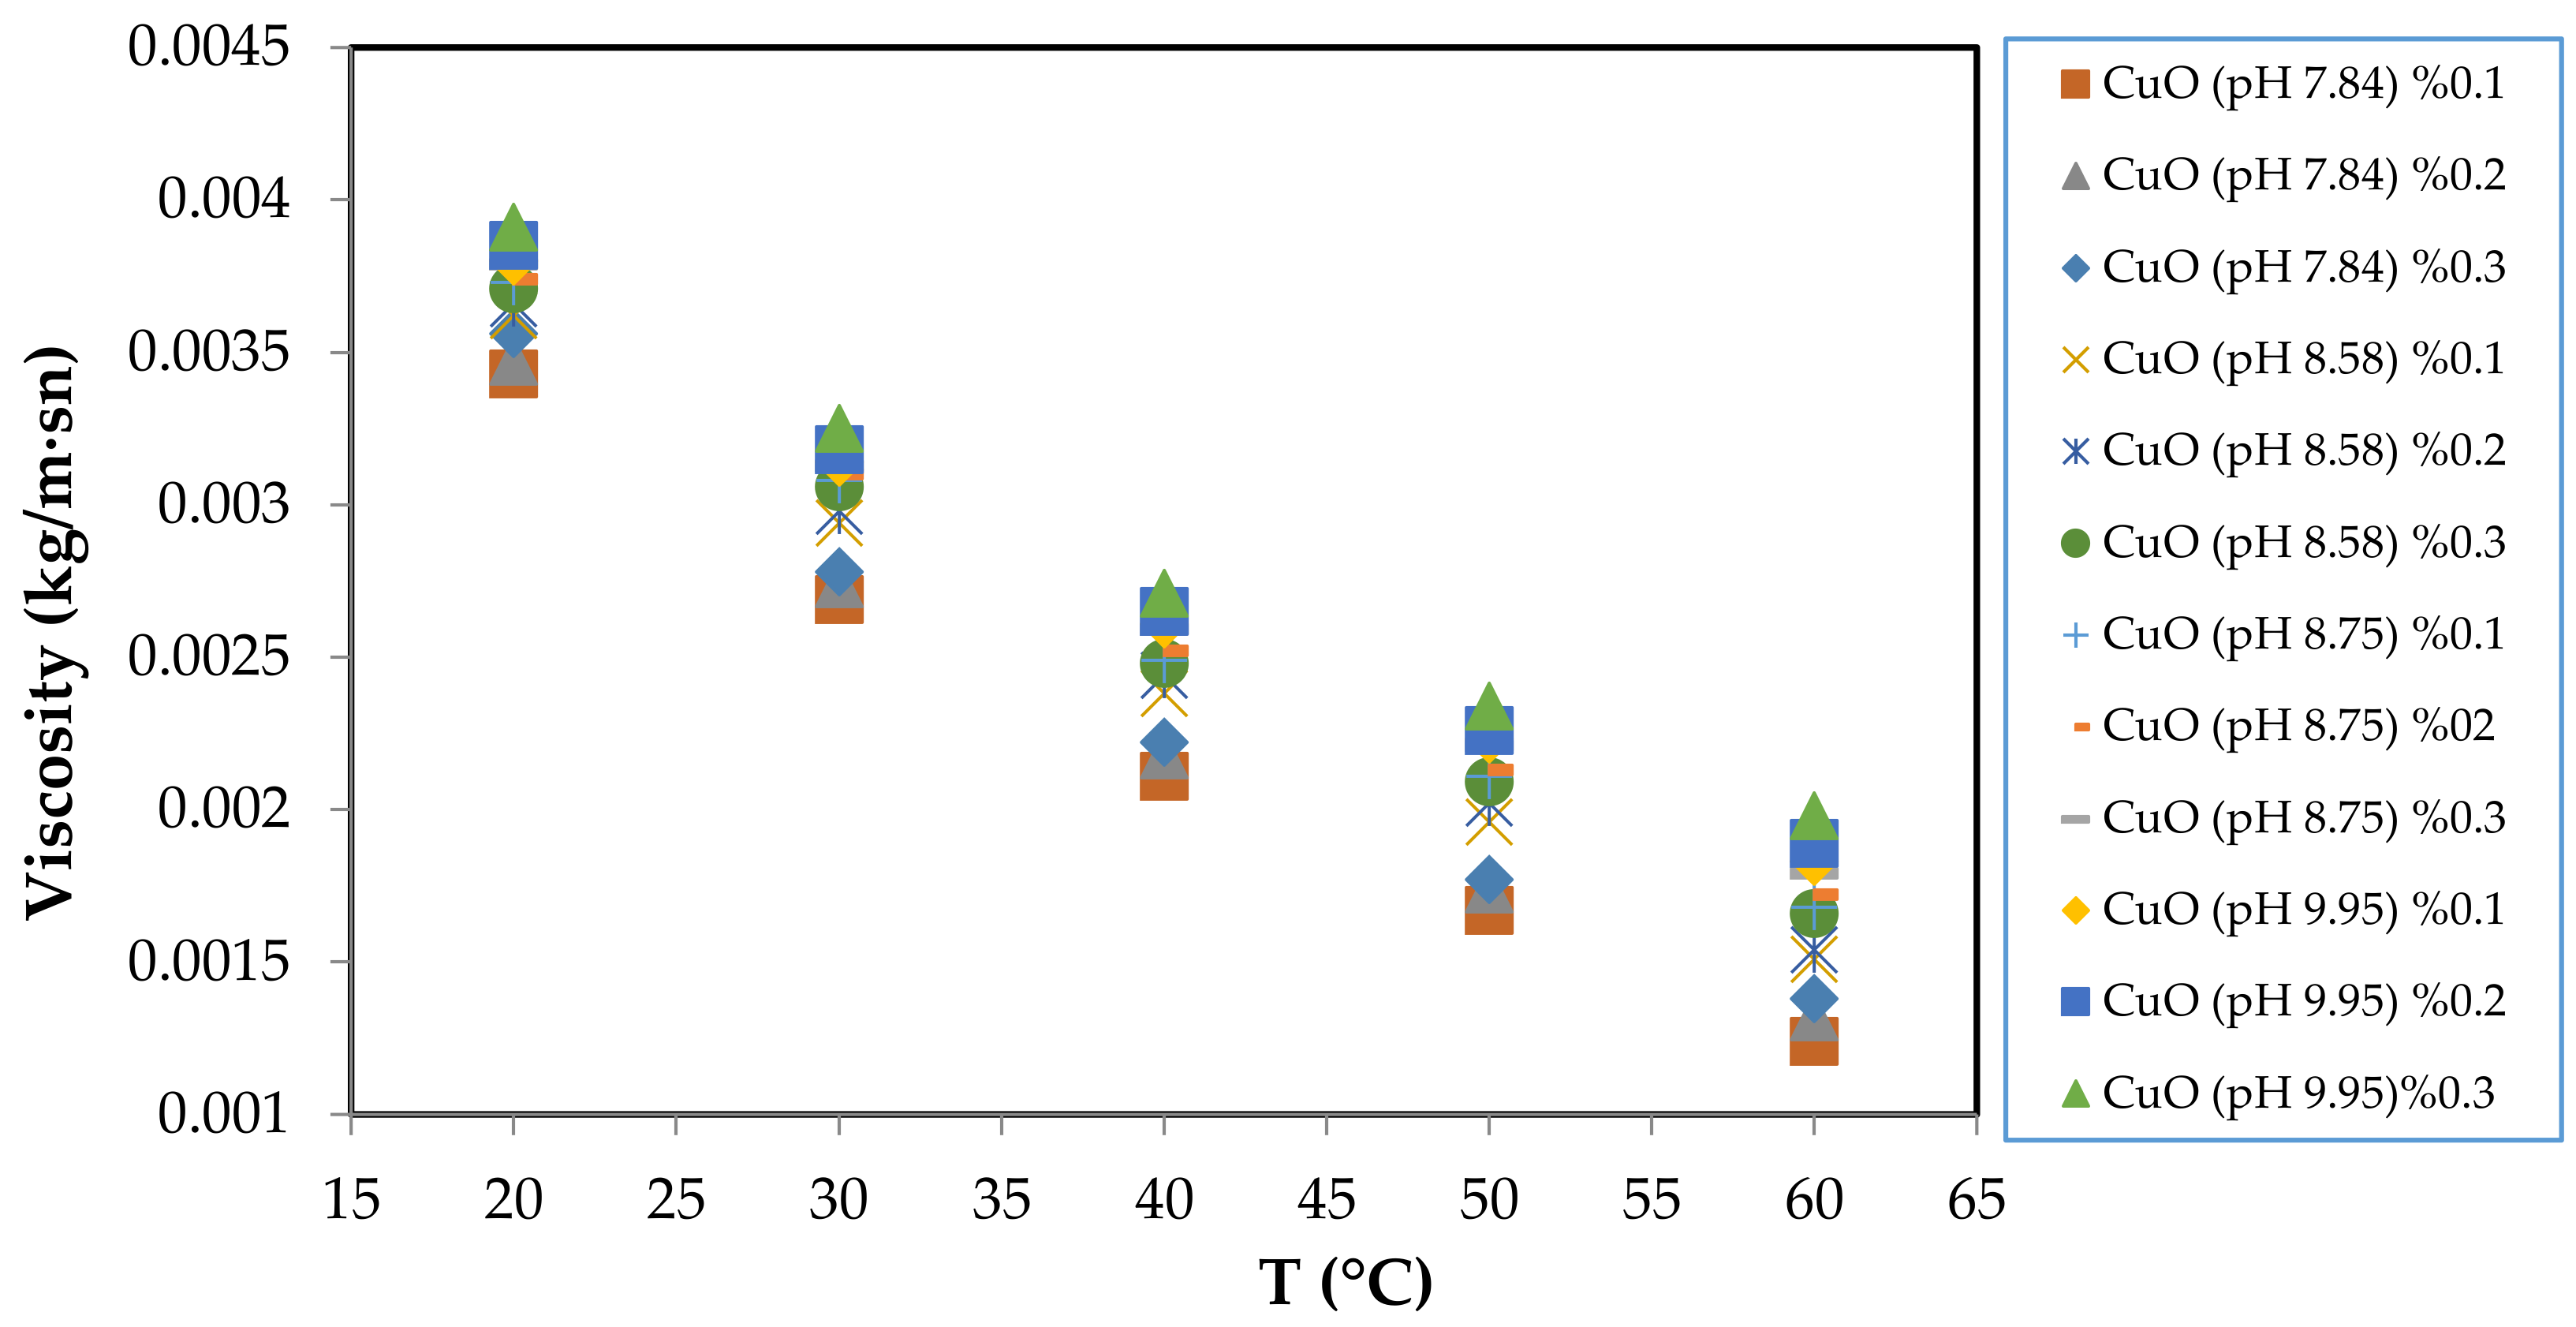
Figure 7.
The average velocity-viscosity change of nanofluids obtained at different pH and CuO ratios.
Figure 7.
The average velocity-viscosity change of nanofluids obtained at different pH and CuO ratios.

Figure 8.
The actual viscosity values obtained with the experimental values and predicted viscosity values obtained using ADTree.
Figure 8.
The actual viscosity values obtained with the experimental values and predicted viscosity values obtained using ADTree.

Figure 9.
The actual viscosity values obtained with the experimental values and predicted viscosity values obtained using MLP.
Figure 9.
The actual viscosity values obtained with the experimental values and predicted viscosity values obtained using MLP.

Table 1.
The network Structure of multilayer perceptron (MLP).
| Number of Layers | 3 |
| Number of Neurons in Layers | 6-6-1 |
| Weight Ratings | Random |
| Activation Function | Logsig |
| Transfer Function | Tangent Sigmoid Transfer |
| Learning Function | Backpropagation |
Table 2.
The accuracy criteria and formulas [29].
Table 2.
The accuracy criteria and formulas [29].
| Accuracy Criteria | Formulas | Parameters |
|---|---|---|
| MSE | P: Predicted Value A: Actual Value n: Total Estimated Value | |
| RMSE | P: Predicted Value A: Actual Value n: Total Estimated Value | |
| MAPE | d: Predicted Value z: Actual Value P: Total Estimated Value |
Table 3.
The error rates.
| Kernel Models | MSE | RMSE | MAPE |
|---|---|---|---|
| Alternating Decision Tree | 0.056 | 0.1436 | 0.0384 |
| Multilayer Perceptron | 0.023 | 0.0745 | 0.0204 |
Table 4.
The predictive models of nanofluids viscosity in the literature.
| Nanofluids | Number of Values | Method | Error Analysis | Error Analysis Result | Reference |
|---|---|---|---|---|---|
| Al2O3, TiO2, SiO2 and CuO-water nanofluids | 3144 | MLP | RMSE | 0.1 | Hemmati-Sarapardeh et al. [13] |
| Multi-walled Carbon Nanotubes MWCNTs/water Nanofluids | 268 | ANN | MSE | 0.28 | Afrand et al. [14] |
| Al2O3, CuO, TiO2 and SiO2 Nanofluids | 801 | LS-SVM | RMSE | 37.084 | Meybodi et al. [15] |
| Al2O3–H2O, CuO–H2O, TiO2–H2O, TiO2–EG, SiO2–H2O, SiO2–EtOH | 381 | GA-ANN | MSE | 2.48 | Karimi et al. [16] |
| Different Nanofluids | 1620 | MLP | MSE | 0.09 | Ansari et al. [17] |
| TiO2/SAE 50 Nano-lubricant | 251 | LS-SWM | RMSE | 0.58 | Esfe et al. [18] |
© 2019 by the authors. Licensee MDPI, Basel, Switzerland. This article is an open access article distributed under the terms and conditions of the Creative Commons Attribution (CC BY) license (http://creativecommons.org/licenses/by/4.0/).
Share and Cite
MDPI and ACS Style
Demirpolat, A.B.; Das, M. Prediction of Viscosity Values of Nanofluids at Different pH Values by Alternating Decision Tree and Multilayer Perceptron Methods. Appl. Sci. 2019, 9, 1288. https://doi.org/10.3390/app9071288
AMA Style
Demirpolat AB, Das M. Prediction of Viscosity Values of Nanofluids at Different pH Values by Alternating Decision Tree and Multilayer Perceptron Methods. Applied Sciences. 2019; 9(7):1288. https://doi.org/10.3390/app9071288
Chicago/Turabian StyleDemirpolat, Ahmet Beyzade, and Mehmet Das. 2019. "Prediction of Viscosity Values of Nanofluids at Different pH Values by Alternating Decision Tree and Multilayer Perceptron Methods" Applied Sciences 9, no. 7: 1288. https://doi.org/10.3390/app9071288
Note that from the first issue of 2016, this journal uses article numbers instead of page numbers. See further details here.