Three-Dimensional Physical and Numerical Modelling of Fracturing and Deformation Behaviour of Mining-Induced Rock Slopes

1
School of Engineering and Technology, China University of Geosciences, Beijing 100083, China
2
Department of Civil and Environmental Engineering, Hong Kong University of Science and Technology, Hong Kong SAR 999077, China
*
Author to whom correspondence should be addressed.
Appl. Sci. 2019, 9(7), 1360; https://doi.org/10.3390/app9071360
Submission received: 27 February 2019
/
Revised: 22 March 2019
/
Accepted: 28 March 2019
/
Published: 31 March 2019
(This article belongs to the Special Issue Fatigue and Fracture of Non-metallic Materials and Structures)
Abstract
:Fracturing behaviour of jointed rock mass subjected to mining can significantly affect the stability of the rock structures and rock slopes. Ore mining within an open-pit final slope would lead to large-scale strata and surface movement of the rock slope. Rock mass structure, or more specifically, the strength, spacing and distribution of rock joints, are the controlling factors that govern the failure and deformation mechanisms of the final slope. Two-dimensional (2-D) physical modelling tests have been conducted in the literature, but in general, most of them have simplified the geological conditions and neglected some key features of rock mass structure in the field. In this study, new three-dimensional (3-D) physical modelling methods are introduced, with realistic modelling of mechanical behaviour of rock mass as well as identified properties of predominant rock joint sets. A case study of Yanqianshan iron mine is considered and the corresponding 1:200 model rock slope was created for studying the rock joint effects on the strata movement and the subsidence mechanism of the slope. The physical model test results are subsequently verified with 3-D discrete element numerical modelling. Due to the presence of the predominant joints, the observed well-shaped strata subsidence in Yanqianshan iron mine was successfully reproduced in the 3-D physical model. The failure mechanism of rock slopes differs from the trumpet-shaped subsidence observed in unconsolidated soil. Due to the formation of an arching mechanism within the rock mass, the strata deformation transferred gradually from the roof of the goaf to the slope surface.
1. Introduction
The stability of rocks is an important subject in rock and slope engineering [1]. Strata and surface movements induced by mining activities in an open-pit final rock slope could trigger slope failure and surface subsidence, creating safety risks to the mining workers. It is thus important to study mining-induced strata and surface movement for better improving the understanding of the stress transfer mechanism in the rock slopes, so as to apply appropriate engineering mitigation measures to prevent and reduce disasters associated with the mining-induced slope failures. In the literature, the methods of investigation can be broadly categorised as theoretical analysis, numerical simulation and physical modelling. Most of the existing theoretical analysis idealises the strata as a beam or slab, which is then analysed by various mechanical analysis methods. A commonly-used mechanical model is, namely, the compressive arch theory. For example, He and Zhang applied the discontinuous deformation analysis to investigate the formation of pressure arch [2]. Wang, Jing et al. used the compressive arch theory to predict collapse of deep-buried tunnel [3]. On the other hand, Chen et al. used the cantilever hypothesis to analysis the mechanism of strata movement and surface deformation in an iron mine [4]. Tu et al. conducted a research on the failure of a gate road system based on the cantilever hypothesis [5]. Li et al. determined the static stress within fault-pillars using the Voussoir beam theory [6]. Ju and Xu found and defined three kinds of structural model affected by the key strata’s position in super great mining height long wall face [7]. Although the mechanism of mining-induced strata movements can be reasonably captured by using the existing theoretical methods, idealising the strata to be a simple solid beam or slab would lead to an inaccurate estimation of rock mass deformation, especially under complicated geological settings, where a simple beam or slab geometry would be insufficient. With the development of the numerical simulation method, it has been widely used to study underground mining-induced strata and surface movement [8,9,10,11,12,13,14]. By numerical simulation, the stress, strain, and displacement of strata could be conveniently analysed, but on account of the constitutive relation and mechanical parameters of rock mass are difficult to be defined accurately.
Physical modelling, on the other hand, has a major advantage over the theoretical method, as a carefully designed physical model can reproduce the deformation and failure mechanisms of the strata induced by mining under a more realistic geological conditions [15,16]. Two-dimensional (2-D) physical models with simplified geological condition have been constructed [17], but there are only a few attempts to model the strata behaviour three-dimensionally, especially when the strata in the prototype has complex joint systems. Existing 2-D or three-dimensional (3-D) model tests considered only the major structural planes, such as the fault plane and bedding plane. Any widely-distributed joints within the rock mass are normally ignored or highly simplified [18,19,20,21,22]. Indeed, the presence of rock joints and their complex distribution typically control the mechanisms of rock mass deformation and strata movement caused by mining. When the rock mass is free from joints or relatively intact, the failure mode of the strata caused by mining is usually collapse or topographic avalanche [23]. On the contrary, deep subsidence pit (up to 100 m) was formed when rock mass is composed of complex joint systems, and a series of ground fractures were also observed at the upper part of eastern final slope (see Figure 1 for an example found at the open-pit slope of Yanqianshan iron mine). Thus, a physical model that could properly and realistically capture the rock joint distribution and orientation is necessary to more correctly study the effects of rock joints on strata and surface movement.
Physical modelling is an important research method but has difficulties and limitations when used in quantitative research. This method can directly reflect the actual process of strata movement expected in the field. The 2-D physical model is normally constructed using simplified geological conditions, without considering the important influence of wide spread joints in the actual rock mass. The absence of rock joints in a physical model would lead to large differences between the experimental results and field observations, which is one of the current challenges in physical modelling tests. This paper aims to conduct 3-D physical modelling tests which can consider the effects of multiple rock joint orientations on strata and surface movements induced by mining processes. The eastern final slope in Yanqianshan iron mine, Liaoning, China was chosen as a case study. The rock joint spacing used in the physical model tests was carefully designed via a series of discrete element analyses. The numerical outcome determined a representative rock joint spacing, which was then adopted for detailed testing and investigation. The observed deformation and failure mechanism of the model slope was subsequently analysed by comparing it with the discrete element calculations.
2. Geological Settings
The Yanqianshan iron mine is located in Anshan City, Liaoning Province, China. The basic rock structure of the mining area is a steep monoclinic structure trending toward 270°~300°, with a dip angle of 70°~88° in the northeast or southeast direction. In the area of the eastern final slope, the iron ore body is located in the middle of the area, strikes nearly east¬east, and dips in the northeast direction at approximately 70°. The ore body of the eastern final slope has a length of 300 m~550 m and an average thickness of 80 m. The eastern final slope is located at the east of the XIV prospecting line three sets of mutually intersecting dominant joints are found in the rock mass. One of the joint sets is a strata layer and the other two that crosscut each other intersect this layer. To facilitate the model construction in this study, the eastern final slope was divided into two parts along the iron vein axis. The red shaded area shown in Figure 2 was selected as the prototype for model simulation. Laboratory element testing including the uni-axial compression tests, splitting tests and direct shear tests have been conducted on the field samples to obtain the mechanical parameters. The typical rock types and the associated mechanical parameters of the rock mass found in the Yanqianshan iron mine are listed in Table 1.
3. Physical Model Tests
3.1. Model Contaniner
In this study, a large-scale 3-D container was created. The container was 4.3 m long, 2.3 m wide and 3.6 m tall (Figure 3). Face A of the container is open for researcher’s access, while face B is closed. Faces C and D are made of high-strength plexiglass, through which the in-plane deformation of a model slope can be imaged by 3-D laser scanner and photogrammeter. Face C of the model container is a vertical section along the centre of the veins (refer to Figure 1), and the strata and surface movement in this section can be observed. To track the deformation, observation points can be marked on the plexiglass. Then, a high-resolution camera can be used to obtain the location of each of these points during the simulation of mining process. Hence, a displacement field of this section can be calculated for interpretation.
The model slopes used for testing were created according to the geological and geometric characteristics of the eastern final slope at the Yanqianshan iron mine. The study area was scaled down according to a geometric similarity ratio of 200:1, with due consideration of the space constraints in the laboratory. The model has a length of 2.3 m, a width of 1.2 m and a height of 2.0 m (Figure 3), the side view of the completed model is shown in Figure 4.
3.2. Modelling of Rock Mass
In this study, the geometric and material similarities of the tested slope were obtained based on based on the similarity theory [24], and the similarity relationships are summarized in Table 2. In order to correctly simulate the mechanical properties of the rock mass found in the mine area, a mixture of cement, quartz sand, barite, iron powder, gypsum, and water was used to produce cubic blocks of model rock mass. The final mass proportion of the model material used was determined through mass proportion test [25,26]. The mass proportion and the mechanical parameters of the material are given in Table 3 and Table 4. The length of each cubic rock block was selected to be 7.5 cm, based on the choice of rock joint spacing adopted in the physical model. More discussion on the choice of block size is given later when discussing the joint spacing.
3.3. Modelling of Rock Joints
In reality, a rock mass has a complex rock joint system. However, it is often impractical to consider and model all the joint systems in a reduced-scaled physical model. In this study, only the joints that have frequent occurrences and that would potentially affect the structure, strength and deformation of rock mass were considered when constructing a physical model. Before construction, the predominant joints in a prototype rock mass were classified into several sets based on the frequency of their occurrences. Each set of joint surfaces was simulated using parallel planes, whereas the block geometry for the model construction was determined according to the mutual intersection of the actual predominant joints. For the case of the Yanqianshan iron mine, the rock joints were simplified into three predominant sets, of which any two sets would be orthogonal to each other (Figure 5). Hence, three idealised sets of predominant joints were created in the model at 90°∠10°, 0°∠90° and 270°∠80°. Each block was cubic. The contact surface between blocks was the joint surface, while the side length of each cubic block was the joint spacing.
According to the similarity relationships and geometric similarity ratio shown in Table 2, the joint spacing of the prototype was divided by the geometric ratio to get the appropriate joint spacing required in the test. For the case of the Yanqianshan iron mine, the average joint spacing in the prototype is about 30–40 cm. Using the scaling factor of 200, the model joint spacing would be only 1.5–2 mm. When using cubic blocks with a length of 1.5–2 mm to construct a model with a total length of 2 m, approximately 580 million cubic blocks are required. The very small joint spacing and the huge number of blocks required at the 200th scale created practical difficulties for the construction. To maintain the practicality of model construction while not compromising the deformation and failure characteristics of the mine in the prototype scale, discrete element modelling (DEM) analyses were conducted to determine a representative joint spacing used for physical model testing. More details of the numerical modelling are given in the next section.
On the other hand, joint strength needs to be properly scaled because it is an important parameter that directly controls the deformation characteristics and failure modes of a rock mass. In this study, the equivalent discontinuous modelling method of jointed rock mass proposed by Xu and Bayisa was adopted to determine the model joint strength [27], and the relationship between joint spacing and joint mechanical parameters was built by them. In this study, the interfaces between the blocks represented rock joints in prototype. Thus, the friction between the blocks was simulated to follow the prototype joint strength. In this physical modelling work, an adhesive with a strength comparable to rock joint strength was used to fill the block interfaces. The adhesive was a mixture of barite, quartz sand, gypsum, and white latex. The strength of the adhesive was determined by the mass proportion of the various components. By changing the mass proportion of these components (see Table 5), adhesives with different strength were obtained. In this study, the adhesive strength was obtained by uniaxial compression tests, splitting tests and direct shear tests. The test results are summarized in Table 6.
3.4. Modelling of Mining Processes
The instability of the model slope was introduced by modelling sequences of mining processes. Based on the site information, the ore body was approximately located at 0.75 m away from the top surface of the slope, and it had a length of 1 m, a width of 0.4 m and a thickness of about 0.2 m (Figure 2 and Figure 6). The ore body was composed of four individual sandbags. The simulation of mining process was divided into four steps by sequentially removing the sand from each bag following the order shown in Figure 6. This is a new modelling approach that is more advantageous over the existing methods, where blocks or PVC pipes were often used to replace an ore body and the mining process was simulated by an extraction of these blocks or pipes at one time [28,29,30,31,32]. The whole process of deformation and failure mode of the strata could be identified and investigated by the new method.
4. Discrete Element Modelling
Numerical modelling of the behaviour of the rock slope was carried out using discrete element method (DEM), for two purposes, the first one was to perform analysis to influence of joint spacing on rock slope failure induced by mining, and to determine a representative joint spacing for informing the model design of the reduced-scale rock slope models. The second purpose was to back-analyse the physical model tests to improve the understanding of the rock mass deformation and failure characteristics upon mining. In this paper, the DEM software, Three-dimensional Distinct Element Code (3DEC) [33], was adopted in all numerical simulations. 3DEC can simulate the mechanical behaviour of a discountinuum material, such as a jointed rock mass. The material is represented as a collection of three-dimensional blocks. The discontinuities which bound the blocks are treated as boundary conditions, large displacements are permitted along the boundary [34]. 3DEC simulated mining by the “null” blocks. Using numerical modelling method to study the rock slope behaviour overcame the difficulties encountered in the physical tests, whereby once large deformation of rock mass occurs, any sensor installed within the slope mass would be displaced or even destroyed. Through numerical back-analysis, it is possible to determine the stress and strain induced in each individual block and hence to investigate the stress transfer mechanisms upon mining-induced unloading, providing new insights into the deformation and failure mechanisms of the rock slope.
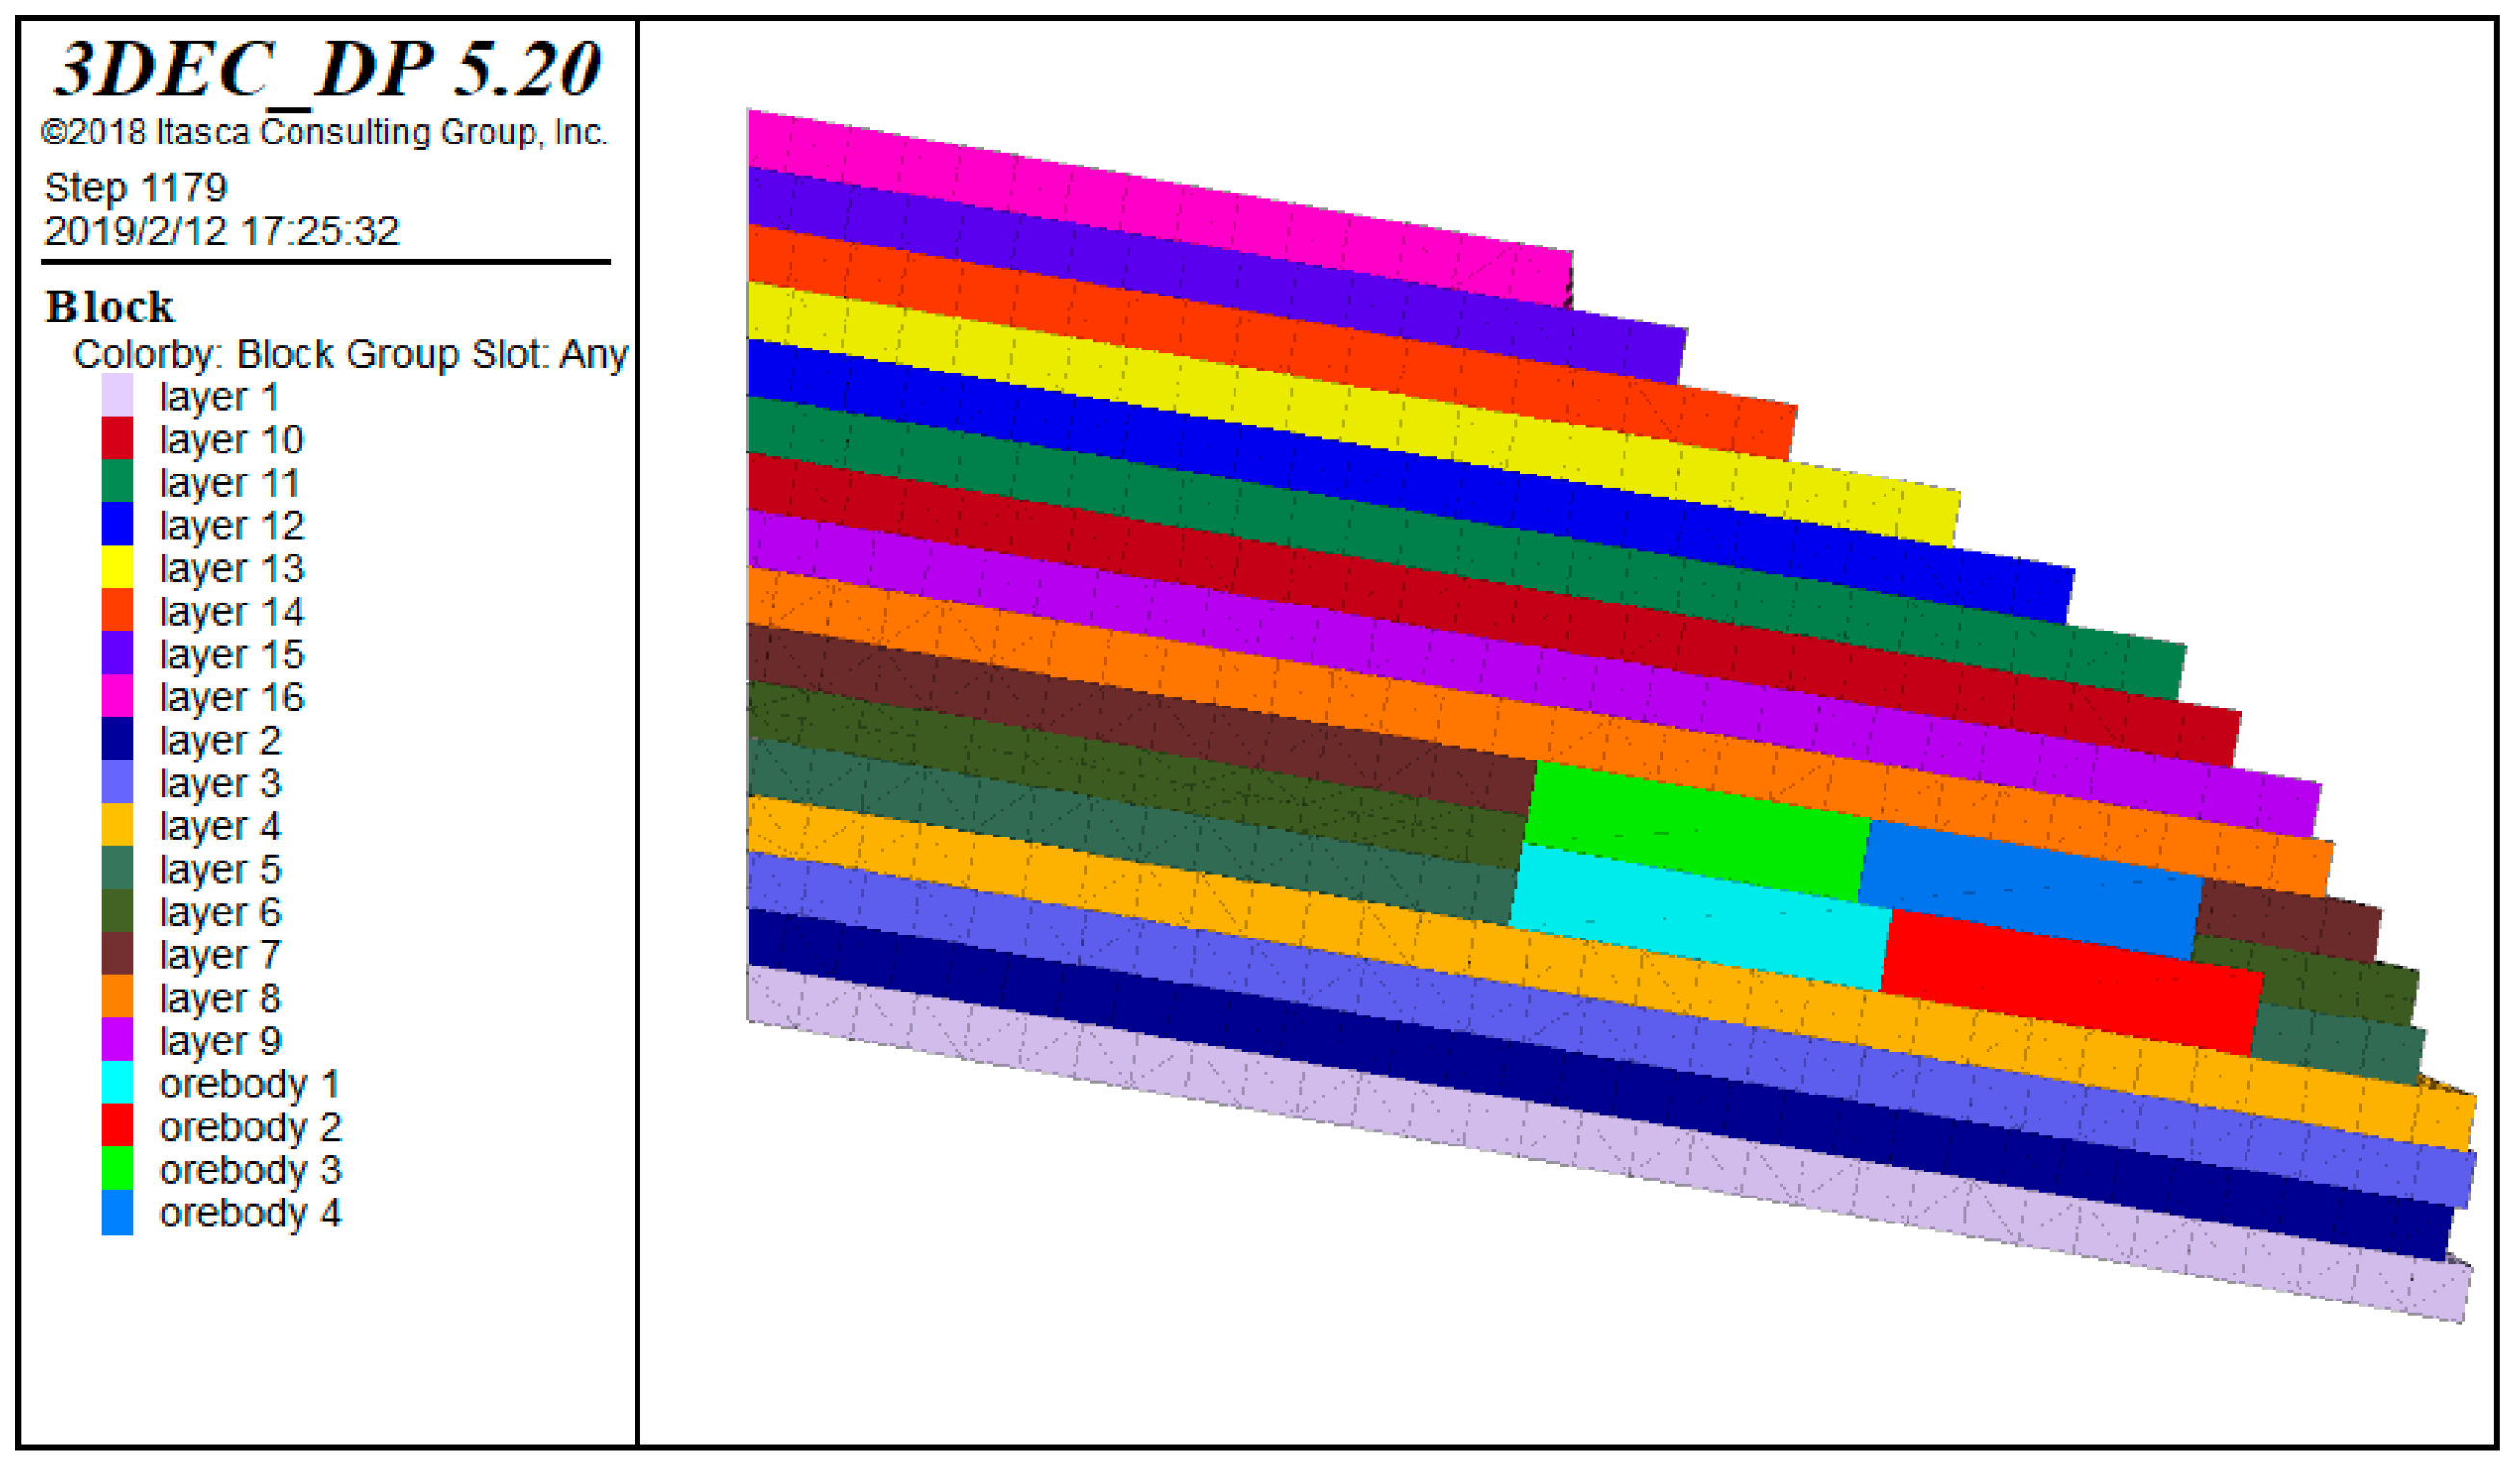
With regard to the first objective, analysis to the influence of joint spacing on rock slope failure induced by mining was conducted to determine a critical joint spacing (), which would be practical for modelling in the model container, while not compromising the deformation and failure characteristics of the mine in prototype scale. Eleven rock slope models that have the same geometry to the physical models were created in the software (Figure 7). The dimension of the numerical model is also with a length of 2.3 m, width of 1.5 m and height of 2.0 m, the numerical model is composed of 8747 elements and 10373 nodes. In all the analyses, the constitutive model used is Mohr-Coulomb failure criterion model. The rigid stress-strain constitutive criterion is applied to the materials. A range of joint spacing between 5 cm and 10 cm (0.5 cm interval) was examined to investigate its effects on discrete element modelling (DEM) analyses were conducted to determine a representative joint spacing used for physical model tests. In this analysis, different numerical slope models having different joint spacings were constructed in the DEM software, 3DEC, for predicting the slope corresponding strata and surface movements when having different values of joint spacing. The input parameters of rock mass and rock joints are summarised in Table 4 and Table 6, respectively. The horizontal direction (X) of the eastern and western boundaries, as well as the horizontal direction (Y) of the southern and northern boundaries of the model slopes were all fixed boundaries. On the other hand, the bottom boundary was also set fixed in the vertical direction (Z). No mechanical constraints were applied to the surface of the model (i.e., free to deform). In each analysis, the slope was subjected to the identical mining methods and procedures as in the physical model tests. Four blocks having the same size of the sandbag were set void sequentially (following Figure 6), to simulate the process of sand removal and hence unloading.
The outcomes of the numerical analyses about influence of joint spacing on strata movement are given in Figure 8. It can be seen that the deformation of the rock slopes that have a joint spacing between 8 to 10 cm was almost identical, whereas while the joint spacing changes from 7.5 cm to 5 cm the slope deformation is very distinctive, which indicates that the influence of joint spacing on the slope behaviour should not be neglected. Hence, the critical joint spacing was found to be 7.5 cm, and this critical value was adopted in the physical model tests.
5. Physical Test Results
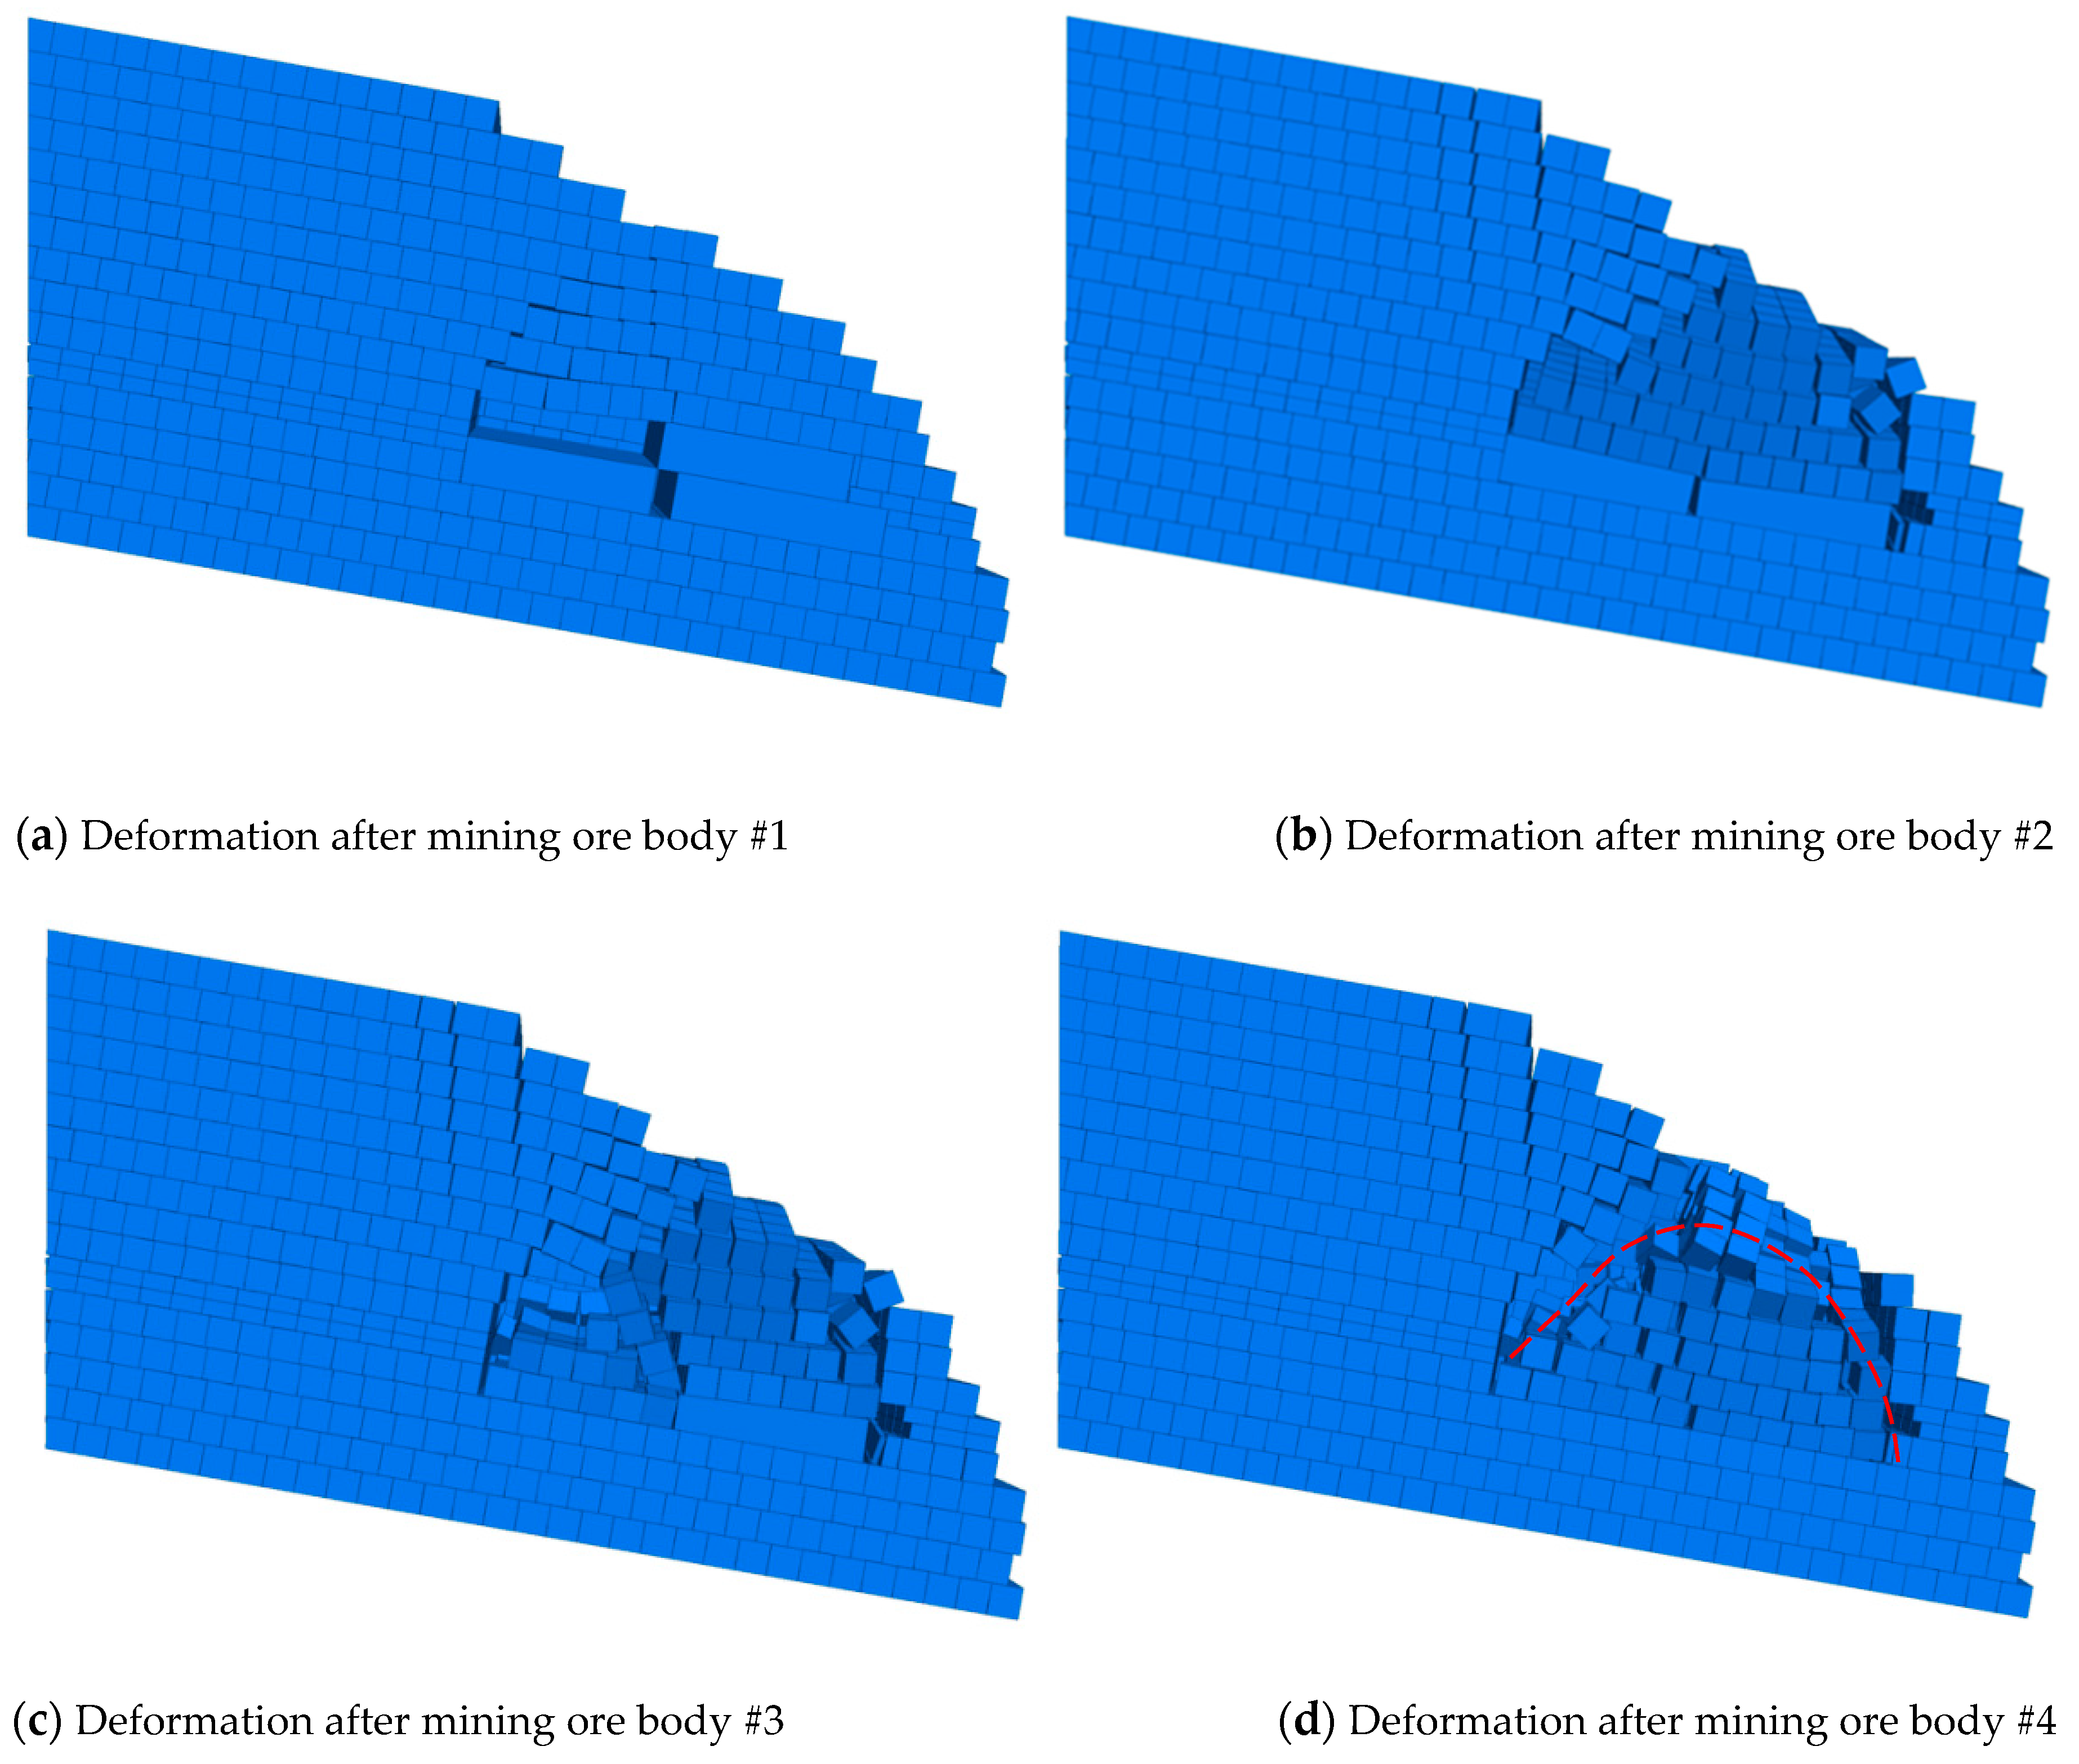
The observed deformation and displacement vector after each stage of mining simulation are shown in Figure 9, Figure 10, Figure 11 and Figure 12. After mining the ore body #1 (see Figure 9), the blocks that were right above the mining area collapsed and fell off, as expected, due to the loss of support. Then, the strata overlying this layer of blocks underwent a substantial downward movement, which caused separation of the overlaying strata along the flat joints. There was no change in the shape of slope surface possibly due to the formation of arching mechanism within blocks (Figure 9a), Figure 9b also shows that the strata deformation has not transferred to the slope surface. After mining the ore body #2 (Figure 10), the strata deformed further towards the open area created by the previous step of mining process. The strata right above this area of mining collapsed almost vertically, introducing significant subsidence pit on the slope surface. This mining process did not introduce any surface subsidence near the crest of the model slope, but the strata deformation transferred to the slope surface (Figure 10b). After mining the ore body #3 (Figure 11), the strata right above the mined area was extensively fractured and more blocks right above collapsed. An arch was formed to support the blocks away from the mined area (Figure 11a). Although there was little or no surface subsidence near the crest of the slope, two rock joints were expanded laterally in size, forming two prominent vertical cracks in this slope section. A toppling avalanche was found near the toe of the slope. The surrounding blocks displaced toward the mined area, and local sliding occurred along the slope surface right above the ore body #3. Finally, after mining the ore body #4 (Figure 12), the strata above the mined area collapsed further, though interestingly, the arch formed in the previous stage of mining remained intact and was apparently unaffected by this last stage of mining (Figure 12a). Substantial amount of rock mass was fallen into the mined area, resulting in large slope surface subsidence at middle of the slope. Blocks near the subsidence pit experienced intensive disturbance and started to slip along the flat joint surface. At the end of the mining processes, a subsidence pit was formed right above the mining area (Figure 13) due to the significant vertical downward movement of strata. Due to the existence of predominant joints, the observed failure mode differs from the trumpet-shaped subsidence experienced in slopes made of unconsolidated soil [30].
6. Discussion
6.1. Comparative Analysis of Physical Modelling Result and Numerical Simulation Result
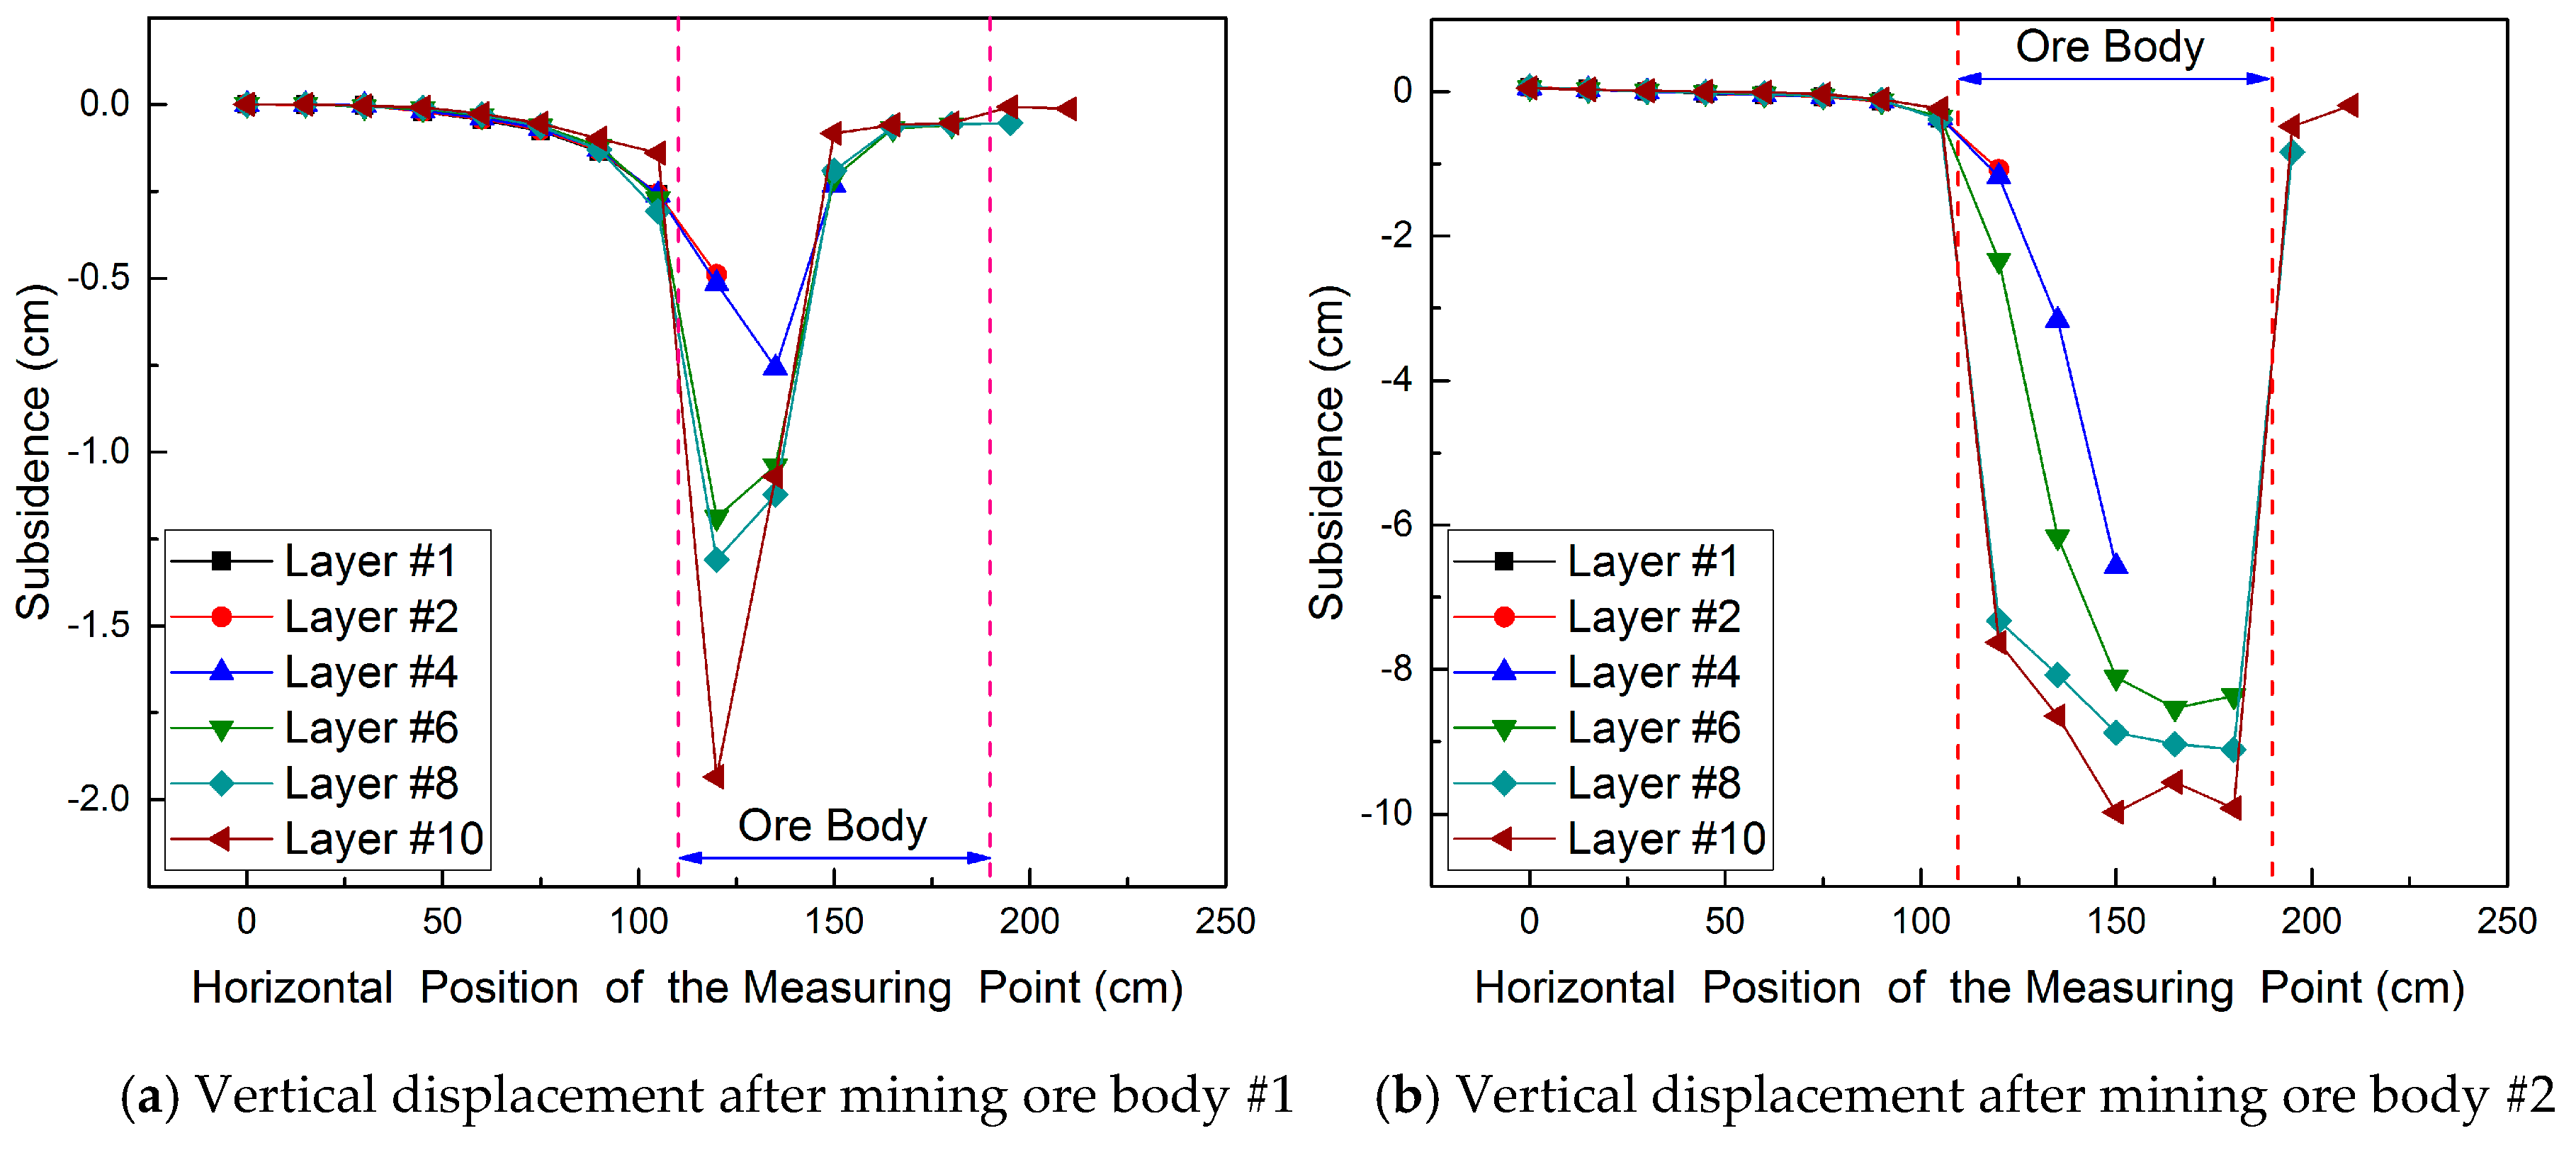
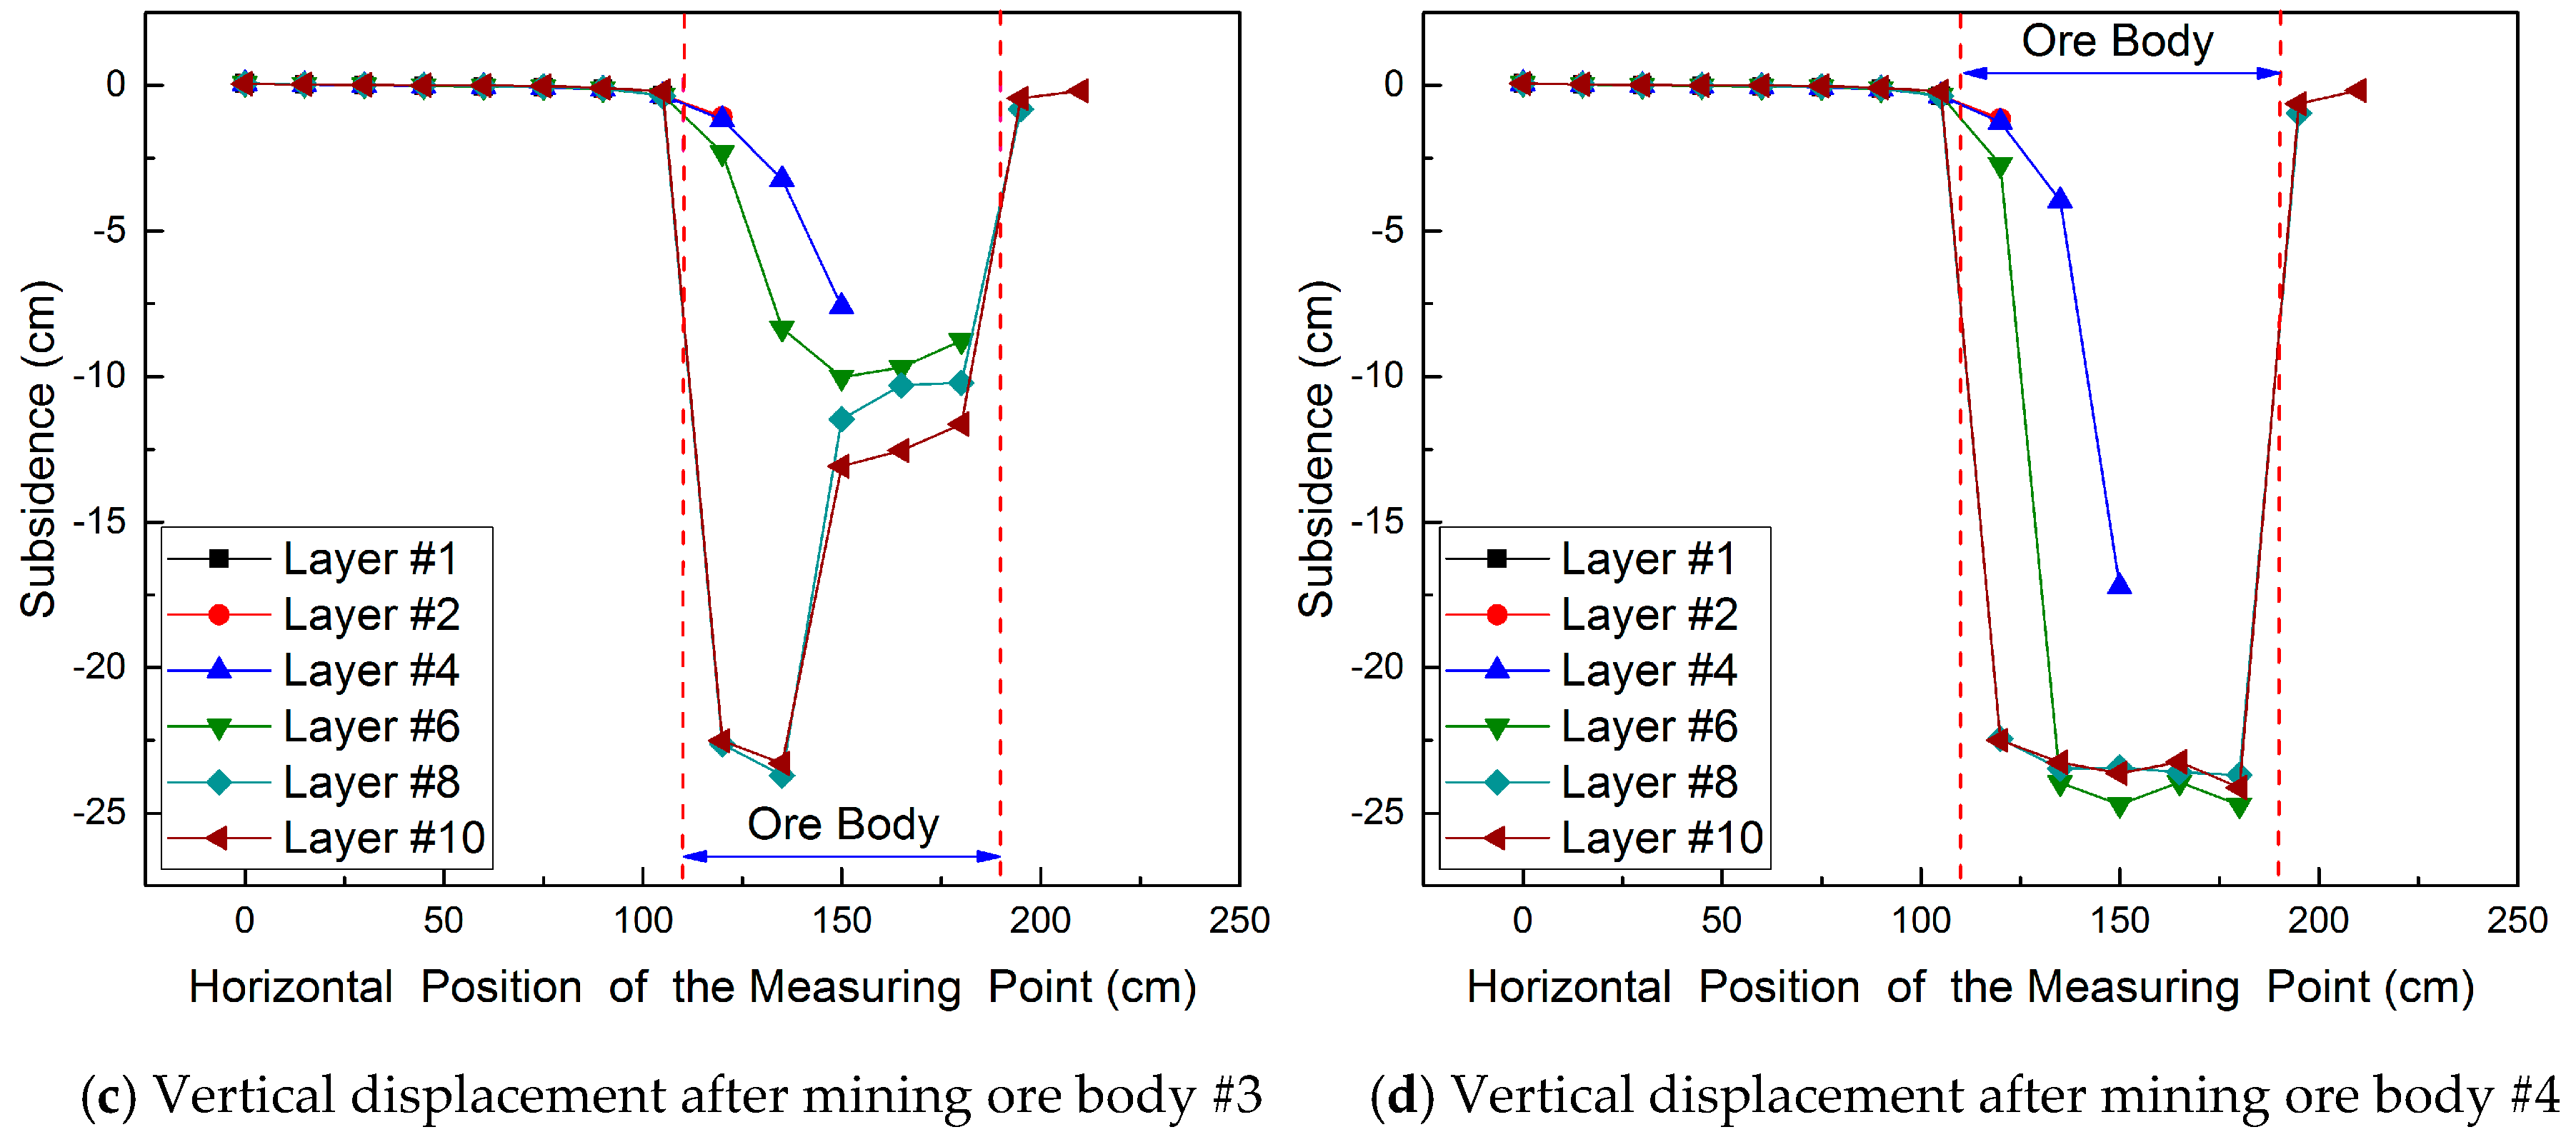
Figure 14 illustrates the process of mining induced strata movement obtained by numerical simulation, which is basically consistent with the physical modelling test result. The main deformation phenomenon reappeared in numerical simulation, though the internal displacement of the rock mass is not obtained by physical modelling, the displacement obtained by numerical simulation is consistent with the displacement vector graph in the physical modelling test and can support the phenomenon of strata movement obtained by physical modelling. Displacement monitoring points are set in ten strata from the first strata directly above the mined area to the slope surface (layer 7, 8, 10, 12, 14 and 16 illustrated in Figure 7), and the horizontal spacing of these monitoring points is 15 cm. Figure 15 shows the vertical displacement of the strata directly above the mined-out area, and the displacement value is built up with the mining. The maximum displacement will always appear in the strata that are directly above the mined area, which indicates that mining-induced unloading triggered the strata movement. All the displacement curves of the four mining steps tell us that a significant increase in displacement began to appear near the boundary between the mined area and surrounding rock, which indicates that due to the existence of steep joints, the rock mass deformation transferred mainly upward to the slope surface. The final well-shaped displacement curve also indicates a well-shaped rock mass subsidence.
In this study, the mining-induced strata movements in the Yanqianshan iron mine can be summarised as follows.
I. The main deformation modes were: (a) the strata separated from the flat joint surface due to the losing of support and the overburden pressure provided by the strata, (b) the arch was formed by the collapsed rock mass, and (c) the subsidence pit was formed by downward strata movement along the steep joint surface and ground cracks formed by extension of steep joints.
II. Transfer of the strata movements. The strata movement transferred gradually from the roof of the mining area to the ground surface. The mining depth or the depth of overlying strata were of significant influence on the depth of subsidence pit formed. Both the displacement vector in Figure 12b and the subsidence curve in Figure 15d showed that the mining-induced deformation in the rock mass that has a realistic joint system (Figure 5) was well-shaped, and the boundary of the subsidence pit was controlled by the steep joints.
III. Surface deformation. Ground surface cracks formed by the extension of steep joints experienced near the slope shoulder, the subsidence pit at slope surface resulted in tensile force in horizontal direction, the steep joint extended under the tensile force and the cracks formed in a certain depth from the slope surface to the internal.
The results from the numerical simulation and physical modelling were consistent with each other. However, several issues need to be highlighted. First, the strata movement process at the macro level was simulated in the numerical modelling, while the strata movement at the micro level was considered in the physical modelling. Therefore, the phenomenon investigated and obtained by the two methods are not completely consistent, especially in Figure 10a and Figure 14c. Second, the simulation of the mining process between two modelling methods was also different. The mining process in the physical modelling was achieved by removing the sand from the sandbag, yet little sand was left in the sandbag. No such issue occurs in the numerical simulation. In addition, the physical modelling can reflect the rock joint influence on the mining induced strata movement in detail and reproduce the whole process of slope failure microscopically. Although there are several differences between the numerical and physical modelling, the two methods that are complementary to each other should be interpreted holistically.
6.2. Analysis of the Typical Strata Movement Characteristics
The strata movement and deformation observed in the physical model tests and the numerical simulation demonstrate that the presence of dominant joints has a significant influence on the strata movement and slope failure. The vertical cracks that appeared near the slope shoulder are mainly along the steep joints. The angle between the vertical boundary of the mining area and the cracks were small. Thus, the whole deformation zone observed in the physical model was well-shaped and could be a referenced to support the strata and surface movement observed in the field. Additionally, it is interesting to reveal that the arch formed during mining was an asymmetrical pressure arch. Although this arch can remain stable over a short period of time right after mining, the arch finally collapsed due to further mining and other impacts, including traffic loading, mining disturbance, rainfall and so on. The subsequent mining and activities may explain the field observations, where mining under eastern final slope in the Yanqianshan iron mine was completed in May 2014. No large-scale deformation was observed until March 2015; at that time, a subsidence pit appeared and the road access was destroyed. This phenomenon could be another reference for the prediction and supporting design of the mining-induced strata and surface movement.
7. Conclusions
In this study, a 1:200 slope model was created according to the field observation made from the Yanqianshan iron mine. Various 3-D physical model tests were performed to investigate the effects of predominant joints on the failure and deformation of rock slope when subjected to sequential excavation due to mining. The main benefits of the new 3-D modelling method are threefold: (i) it overcame the limitations of most existing 2-D physical models, where simplified geological conditions were often considered without a detailed consideration and modelling of rock joint distribution (3-D modelling, however, can realistically capture the mechanical properties of rock mass and the properties of rock joint including strengths and distribution in 3D space); (ii) the use of a 3-D model can (a) reproduce the whole process of strata deformation and movement under realistic geological conditions, and (b) record and measure the slope deformation characteristics during a test, which is important for the post-test analysis of strata movement mechanism; and (iii) with the aid of 3-D discrete element modelling, an equivalent joint spacing could be determined and was then used in the physical tests, usefully by passing the practical difficulties of rock blocks in an experiment.
By using the new 3-D physical model test and the complementary numerical modelling, the strata movement process was recorded and the mechanism of well-shaped subsidence in jointed rock mass was obtained. The new modeling method has provided a new effective means to study mining-induced strata and surface movement in jointed rock masses. Nevertheless, the observed deformation mechanism of the physical model was qualitatively consistent with what was observed in the field. Further study is necessary to improve the physical model to more quantitatively capture the field observation such as the displacement and failure scope.
Author Contributions
Conceptualization, G.Y.; Physical modelling, G.Y., N.X. and K.G.; Numerical simulation, N.X., A.K.L. and K.Z.; Funding acquisition, N.X. and G.Y.; Data analysis, G.Y., A.K.L., K.Z. and K.G.; Writing—original draft, G.Y.; Writing—review and editing, G.Y., A.K.L., N.X., K.Z. and K.G.
Funding
This research was funded by the National Natural Science Foundation of China, grant No. 41772326.
Conflicts of Interest
The authors declare no conflicts of interest.
References
- Fu, H.; Wang, S.; Pei, X.; Chen, W. Indices to Determine the Reliability of Rocks under Fatigue Load Based on Strain Energy Method. Appl. Sci. 2019, 9, 360. [Google Scholar] [CrossRef]
- He, L.; Zhang, Q.B. Numerical investigation of arcing mechanism to underground mining in jointed rock mass. Tunn. Undergr. Space Technol. 2005, 50, 54–67. [Google Scholar] [CrossRef]
- Wang, Y.; Jing, H.; Zhang, Q.; Luo, N.; Yin, X. Prediction of Collapse Scope of Deep-Buried Tunnels Using Pressure Arch Theory. Math. Probl. Eng. 2016, 3–4, 1–10. [Google Scholar] [CrossRef]
- Cheng, G.; Chen, C.; Ma, T.; Liu, H.; Tang, C. A Case Study on the Strata Movement Mechanism and Surface Deformation Regulation in Underground Iron Mine. Rock Mech. Rock Eng. 2016, 50, 1011–1032. [Google Scholar] [CrossRef]
- Bai, Q.; Tu, S.; Wang, F.; Zhang, C. Field and numerical investigations of gate road system failure induced by hard roofs in a longwall top coal caving face. Int. J. Coal Geol. 2017, 173, 176–199. [Google Scholar] [CrossRef]
- Li, Z.; Dou, L.; Cai, W.; Wang, G.; Ding, Y.; Kong, Y. Mechanical Analysis of Static Stress with in Fault-Pillars Based on a Voussoir Beam Structure. Rock Mech. Rock. Eng. 2015, 49, 1097–1105. [Google Scholar] [CrossRef]
- Ju, J.; Xu, J. Structural characteristics of key strata and strata behaviour of a fully mechanized longwall face with 7.0 m height chocks. Int. J. Rock Mech. Min. 2013, 58, 46–54. [Google Scholar] [CrossRef]
- Unver, B.; Yasitli, N. Modelling of strata movement with a special reference to caving mechanism in thick seam coal mining. Int. J. Coal Geol. 2016, 66, 227–252. [Google Scholar] [CrossRef]
- Guo, H.; Yuan, L.; Shen, B.; Qu, Q.; Xue, J. Mining-induced strata stress changes, fractures and gas flow dynamics in multi-seam longwall mining. Int. J. Rock Mech. Min. 2012, 54, 129–139. [Google Scholar] [CrossRef]
- Ye, Q.; Wang, W.; Wang, G.; Jia, Z. Numerical simulation on tendency mining fracture evolution characteristics of overlying strata and coal seams above working face with large inclination angle and mining depth. Arab. J. Geosci. 2017, 10, 82. [Google Scholar] [CrossRef]
- Wang, X.; Kulatilake, P.H.S.W.; Song, W. Stability investigations around a mine tunnel through three-dimensional discontinuum and continuum stress analyses. Tunn. Undergr. Space Technol. 2012, 32, 98–112. [Google Scholar] [CrossRef]
- Gao, F.; Stead, D. Discrete element modelling of cutter roof failure in coal mine roadways. Int. J. Coal Geol. 2013, 116–117, 158–171. [Google Scholar] [CrossRef]
- Xu, N.; Zhang, J.; Tian, H.; Mei, G.; Ge, Q. Discrete element modelling of strata and surface movement induced by mining under open-pit final slope. Int. J. Rock Mech. Min. 2016, 88, 61–76. [Google Scholar] [CrossRef]
- Vyazmensky, A.; Stead, D.; Elmo, D.; Moss, A. Numerical Analysis of Block Caving-Induced Instability in Large Open Pit Slopes: A Finite Element/Discrete Element Approach. Rock Mech. Rock Eng. 2009, 43, 21–39. [Google Scholar] [CrossRef]
- Guo, S.; Qi, S.; Yang, G.; Zhang, S.; Saroglou, C. An Analytical Solution for Block Toppling Failure of Rock Slopes during an Earthquake. Appl. Sci. 2017, 7, 1008. [Google Scholar] [CrossRef]
- Zhan, Z.; Qi, S. Numerical Study on Dynamic Response of a Horizontal Layered-Structure Rock Slope under a Normally Incident Sv Wave. Appl. Sci. 2017, 7, 716. [Google Scholar] [CrossRef]
- Ghabraie, B.; Ren, G.; Smith, J.V. Characterising the multi-seam subsidence due to varying mining configuration, insights from physical modelling. Int. J. Rock Mech. Min. 2017, 93, 269–279. [Google Scholar] [CrossRef]
- Ren, W.; Guo, C.; Peng, Z.; Wang, Y. Model experimental research on deformation and subsidence characteristics of ground and wall rock due to mining under thick overlying terrane. Int. J. Rock Mech. Min. 2010, 47, 614–624. [Google Scholar] [CrossRef]
- Zhu, W.; Li, Y.; Li, S.; Wang, S.; Zhang, Q. Quasi-three-dimensional physical model tests on a cavern complex under high in situ stresses. Int. J. Rock Mech. Min. 2011, 48, 199–209. [Google Scholar]
- Li, S.C.; Wang, Q.; Wang, H.T.; Jiang, D.C.; Wang, B.; Zhang, Y.; Li, G.; Ruan, Q. Model test study on surrounding rock deformation and failure mechanisms of deep roadways with thick top coal. Tunn. Undergr. Space Technol. 2015, 47, 52–63. [Google Scholar] [CrossRef]
- Fang, Y.; Xu, C.; Cui, G.; Kenneally, B. Scale model test of highway tunnel construction underlying mined-out thin coal seam. Tunn. Undergr. Space Technol. 2016, 56, 105–116. [Google Scholar] [CrossRef]
- Ju, M.; Li, X.; Yao, Q.; Liu, S.; Liang, S.; Wang, X. Effect of sand grain size on simulated mining-induced overburden failure in physical model tests. Eng. Geol. 2017, 226, 93–106. [Google Scholar] [CrossRef]
- Xia, K.; Chen, C.; Deng, Y.; Xiao, G.; Zheng, Y.; Liu, X.; Fu, H.; Song, X.; Chen, L. In situ monitoring and analysis of the mining-induced deep ground movement in a metal mine. Int. J. Rock Mech. Min. 2018, 109, 32–51. [Google Scholar] [CrossRef]
- Luo, X.; Ge, X. Theory and Application of Model Test on Landslide; China Waterpower Press: Beijing, China, 2008. [Google Scholar]
- Wang, H.; Li, S. Development of a new geomechanical similar material. Chin. J. Rock Mech. Eng. 2006, 25, 1842–1847. [Google Scholar]
- Wang, H.; Li, S.; Zheng, X. Research progress of geomechanical model test with new technology and its engineering application. Chin. J. Rock Mech. Eng. 2009, 28, 2765–2771. [Google Scholar]
- Regassaa, B.; Xu, N.; Mei, G. An Equivalent Discontinuous Modelling Method of Jointed Rock Masses for DEM Simulation of Mining-induced Rock Movements. Int. J. Rock Mech. Min. 2018, 108, 1–14. [Google Scholar] [CrossRef]
- Huayang, D.; Xugang, L.; Jiyan, L.; Yixin, L.; Yameng, Z.; Weinan, D.; Yinfei, C. Model study of deformation induced by fully mechanized caving below a thick loess layer. Int. J. Rock Mech. Min. 2010, 47, 1027–1033. [Google Scholar] [CrossRef]
- Ghabraie, B.; Ren, G.; Smith, J.; Holden, L. Application of 3D laser scanner, optical transducers and digital image processing techniques in physical modelling of mining-related strata movement. Int. J. Rock Mech. Min. 2015, 80, 219–230. [Google Scholar] [CrossRef]
- Xu, Y.; Wu, K.; Li, L.; Zhou, D.; Hu, Z. Ground cracks development and characteristics of strata movement under fast mining: A case study at Bulianta coal mine, China. Bull. Eng. Geol. Environ. 2017, 1–16. [Google Scholar] [CrossRef]
- Sun, G. Rockmass Structural Mechanism; Science Press: Beijing, China, 1988. [Google Scholar]
- Guo, Q.; Guo, G.; Lv, X.; Zhang, W.; Lin, Y.; Qin, S. Strata movement and surface subsidence prediction model of dense solid backfilling mining. Environ. Earth Sci. 2016, 75. [Google Scholar] [CrossRef]
- Itasca Consulting Group. 3DEC District Element Code in 3 Dimensional, Version 5.0. (a) User’s Guide and (b) Theory and Background; Itasca Consulting Group: Minneapolis, MN, USA, 2013. [Google Scholar]
- Brideau, M.A.; Stead, D. Controls on Block Toppling Using a Three-Dimensional Distinct Element Approach. Rock Mech. Rock Eng. 2010, 43. [Google Scholar] [CrossRef]
Figure 1.
Subsidence pit observed at eastern final slope in Yanqianshan iron mine.
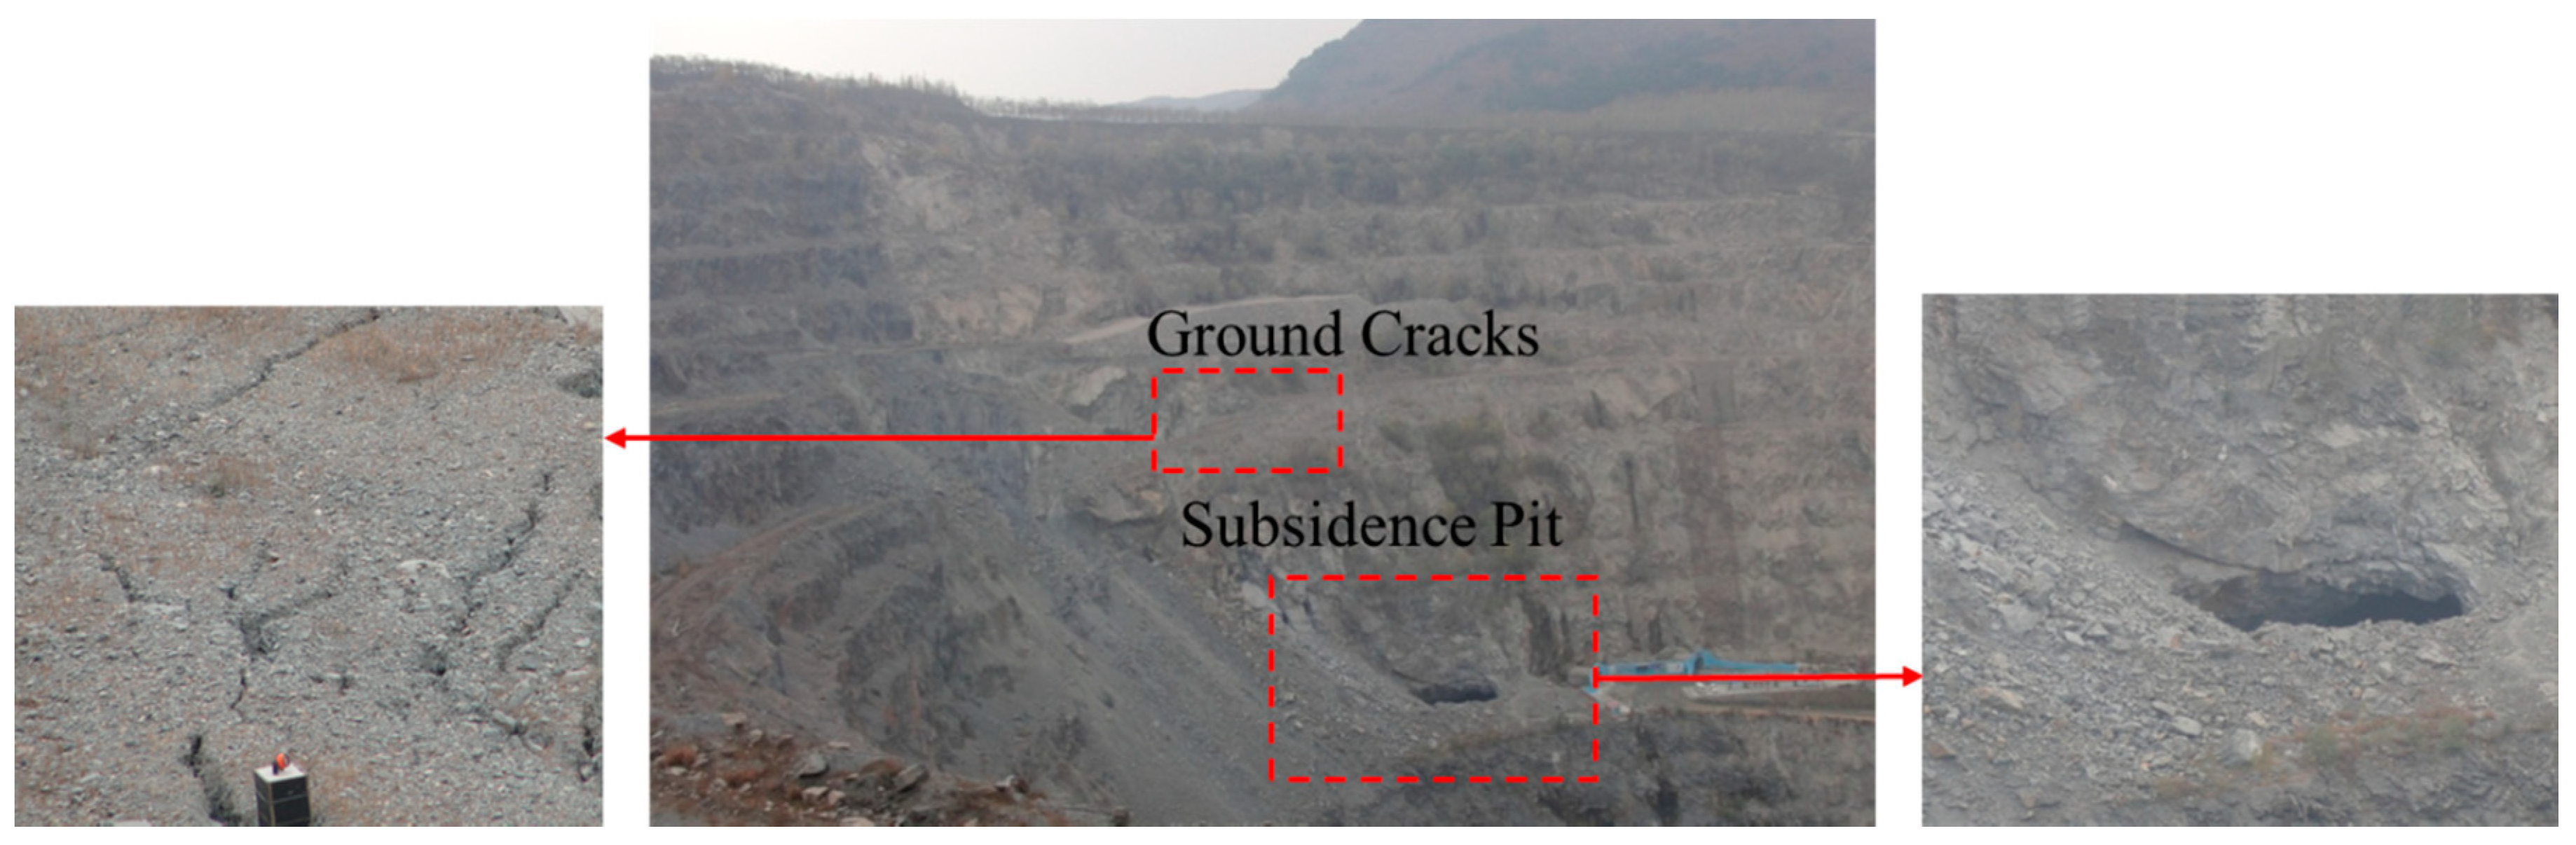
Figure 2.
Overview of the study area. Shaded region represents the eastern final slope investigated in this study (Xu et al. 2016).
Figure 2.
Overview of the study area. Shaded region represents the eastern final slope investigated in this study (Xu et al. 2016).
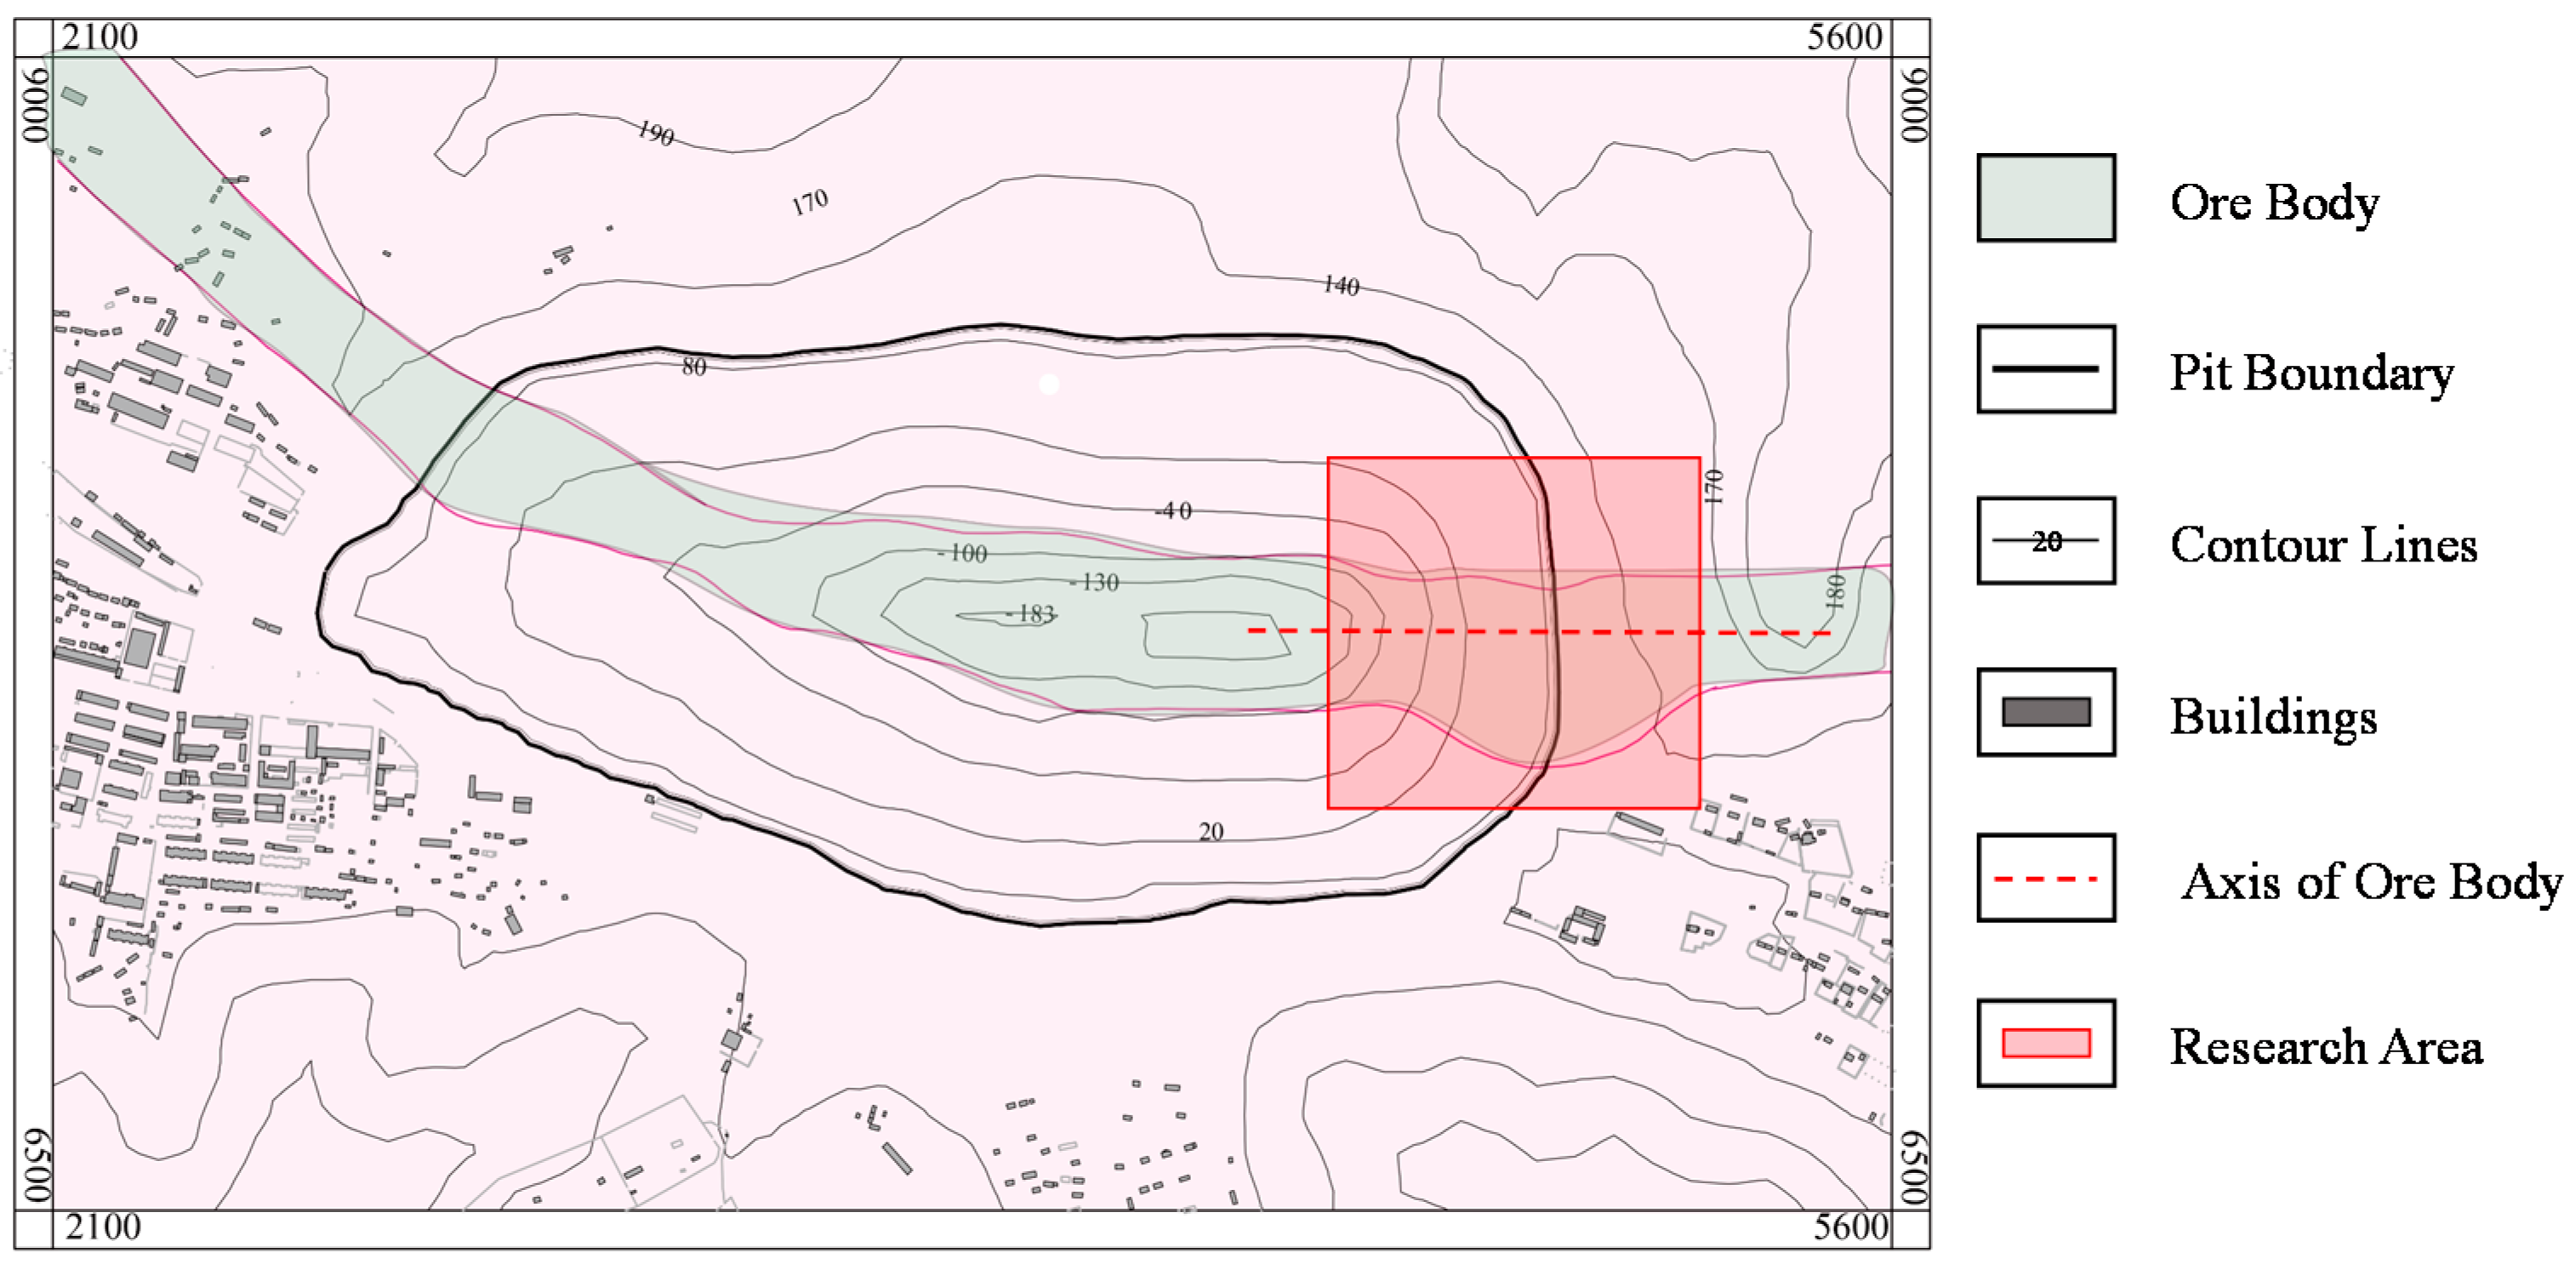
Figure 3.
The model box and monitoring program.
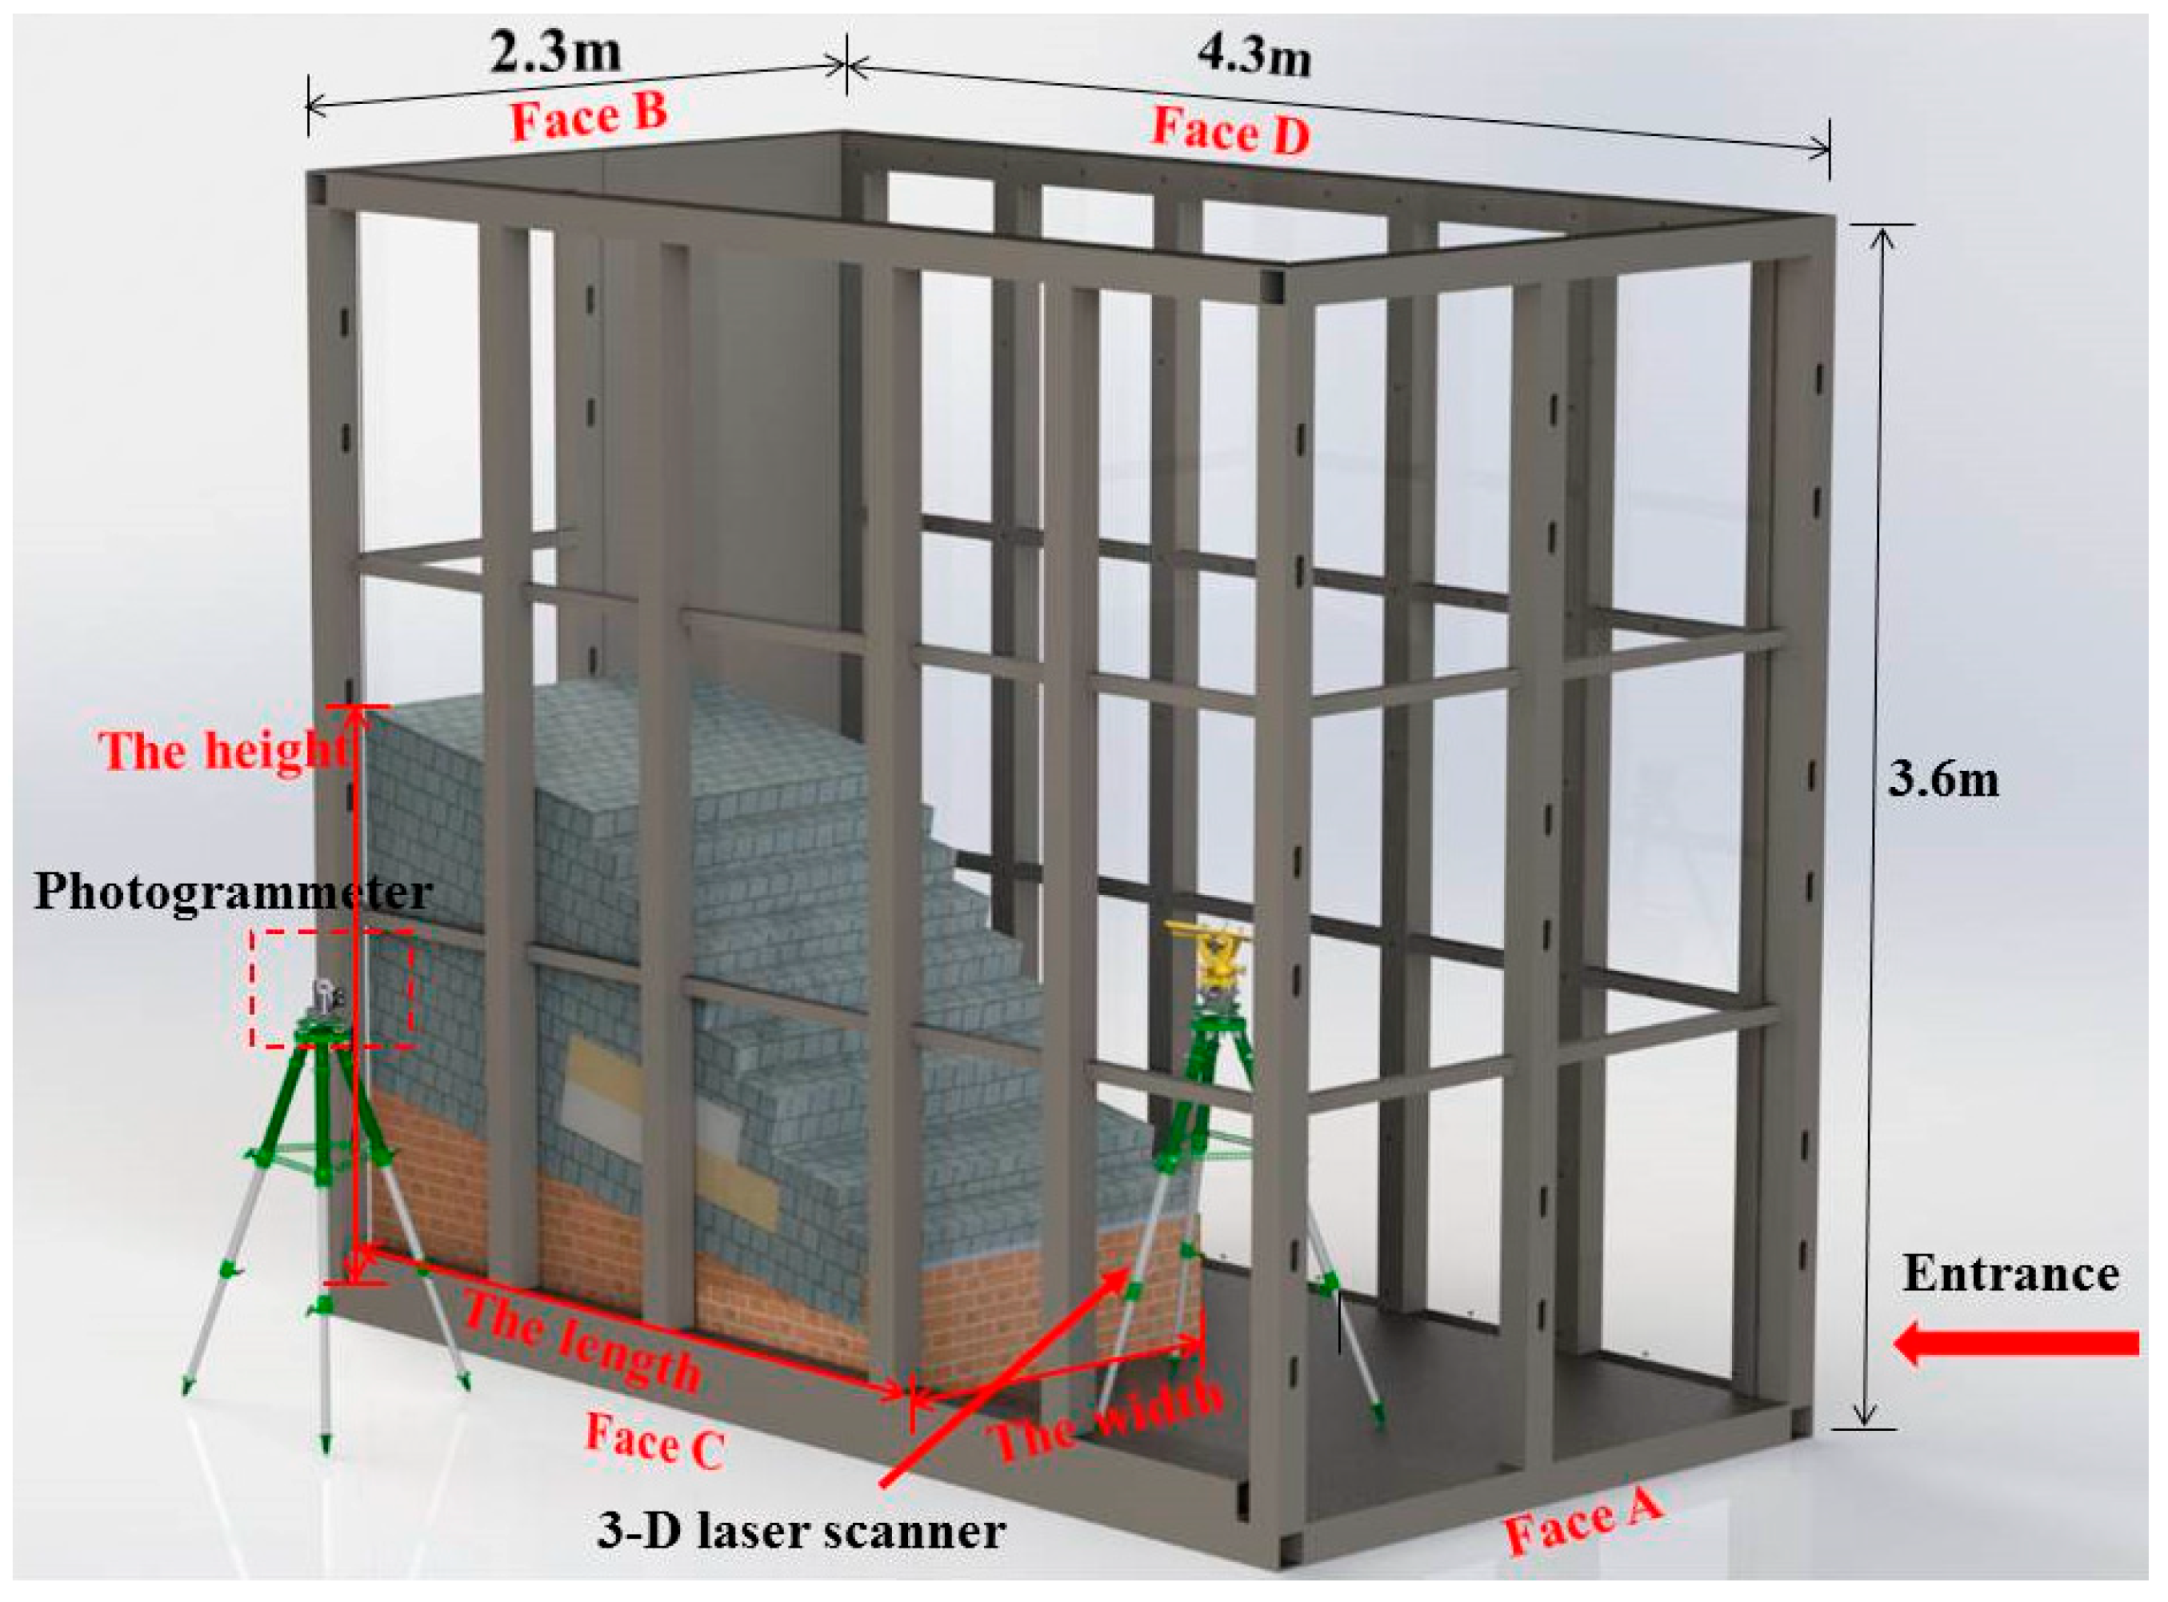
Figure 4.
The side view and the completed model.
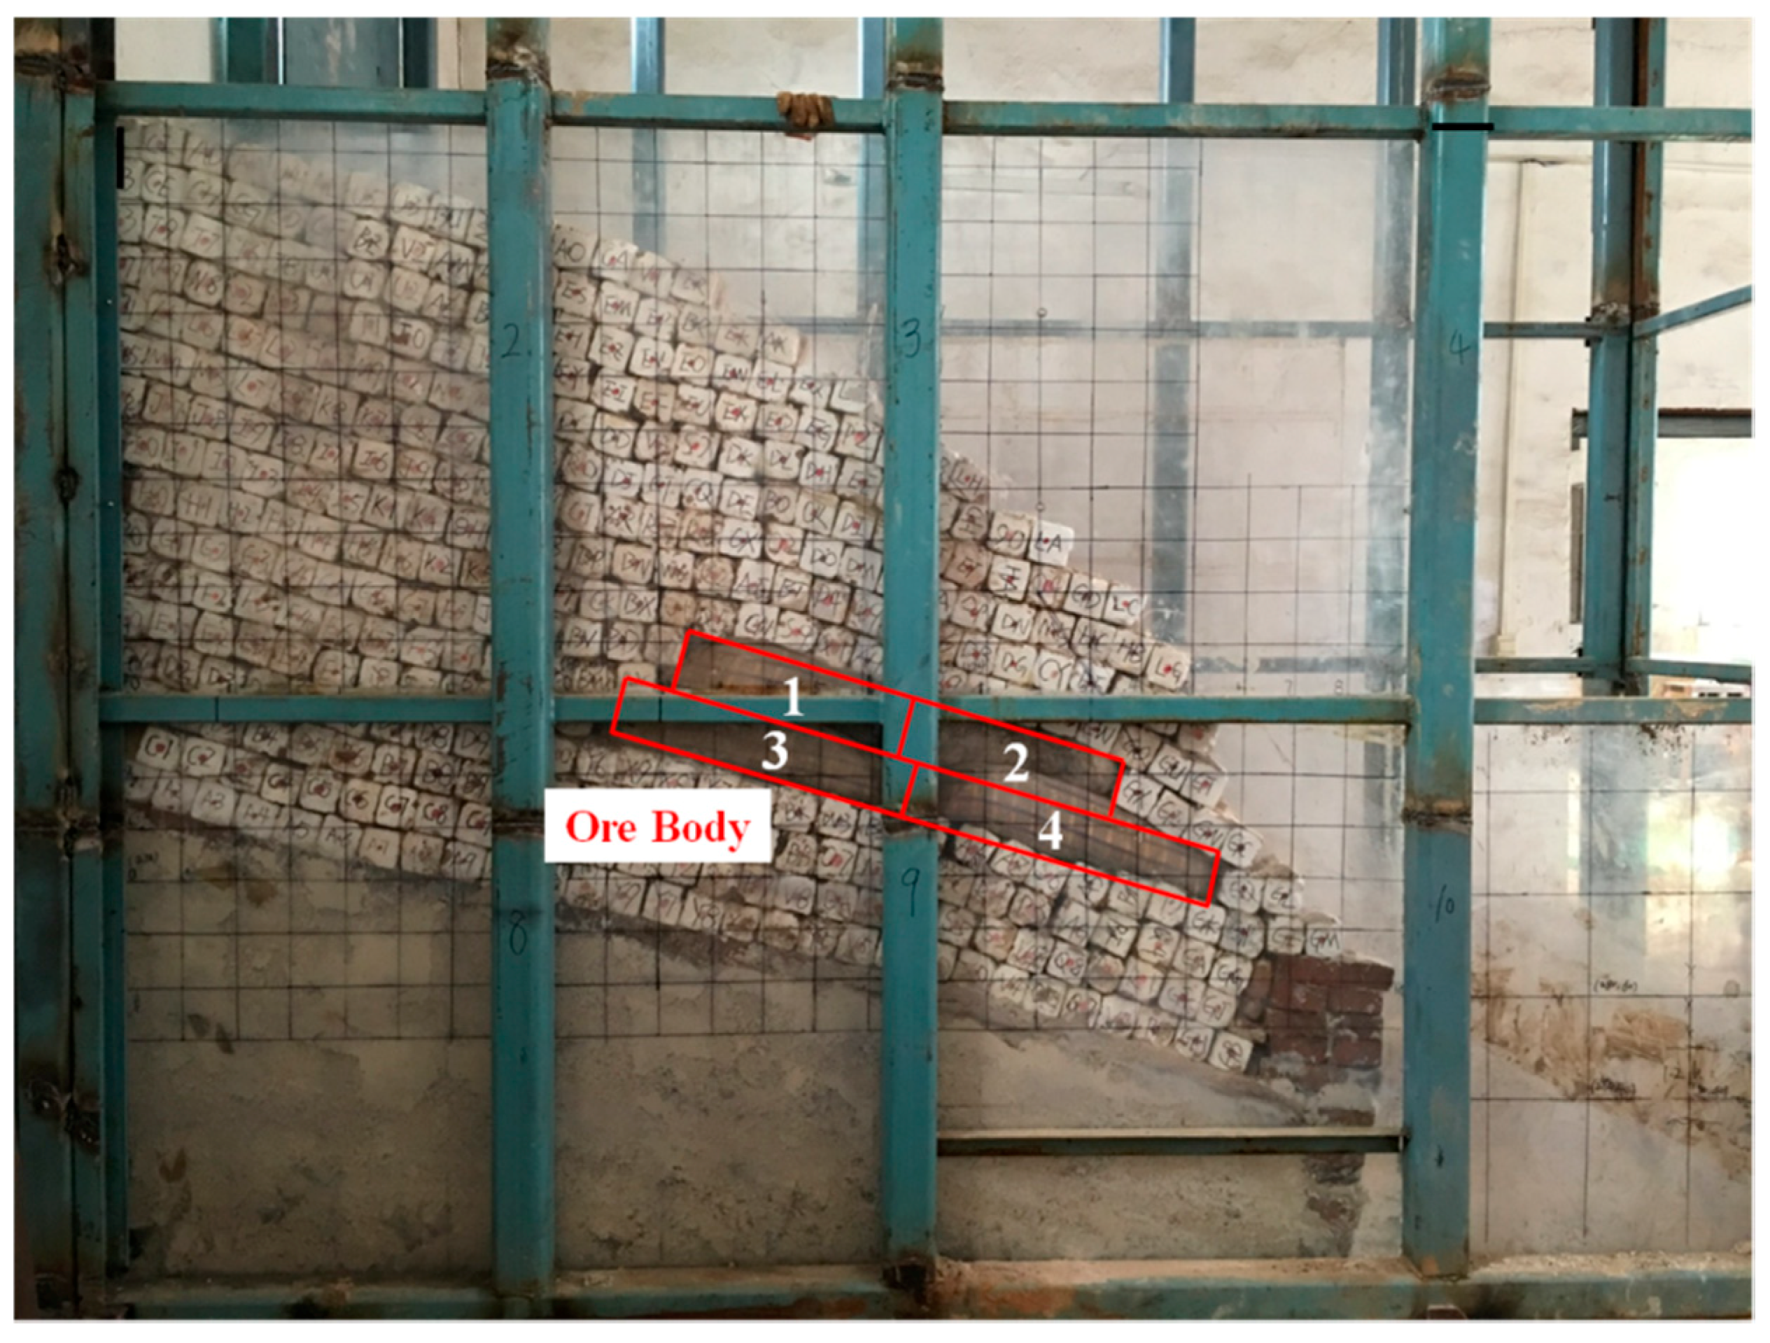
Figure 5.
Three predominant sets of rock joints idealised from the Yanqianshan iron mine for physical model testing.
Figure 5.
Three predominant sets of rock joints idealised from the Yanqianshan iron mine for physical model testing.
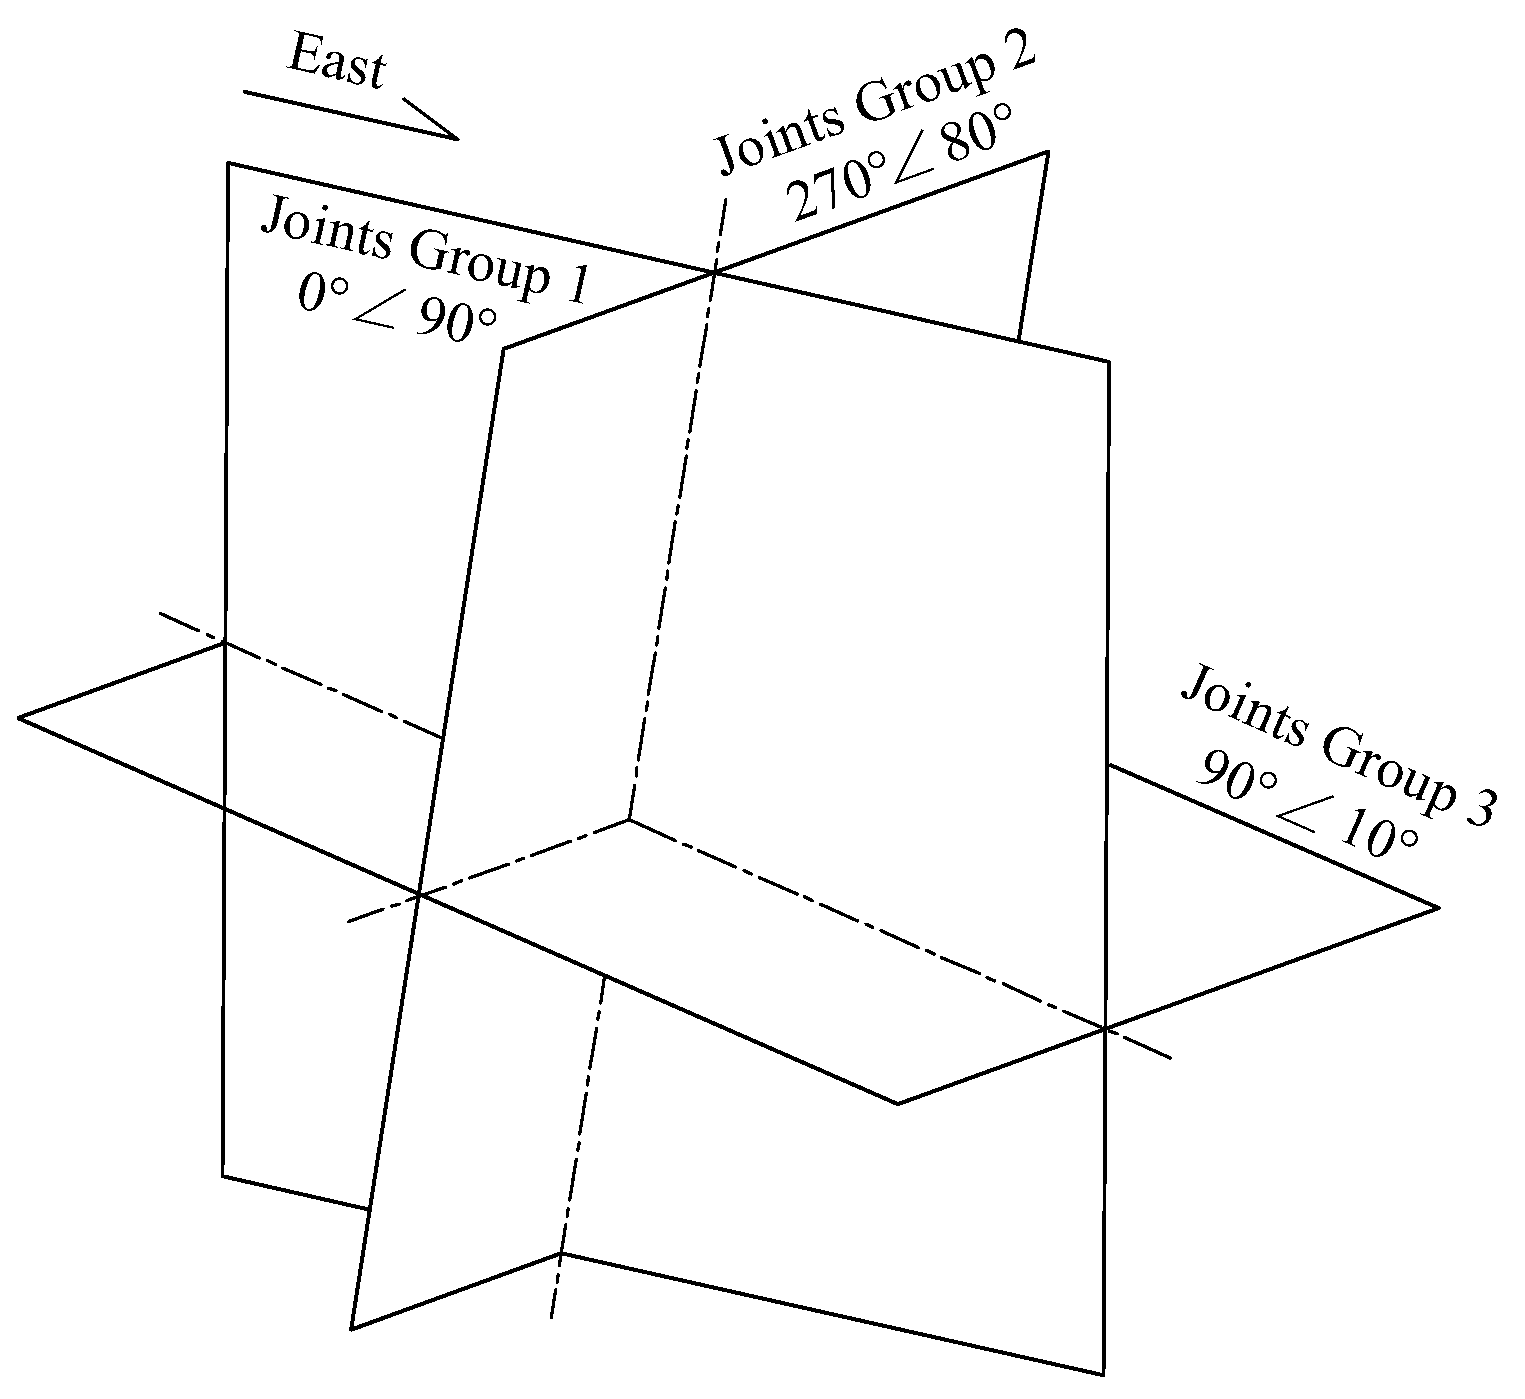
Figure 6.
Illustration of the mining process.
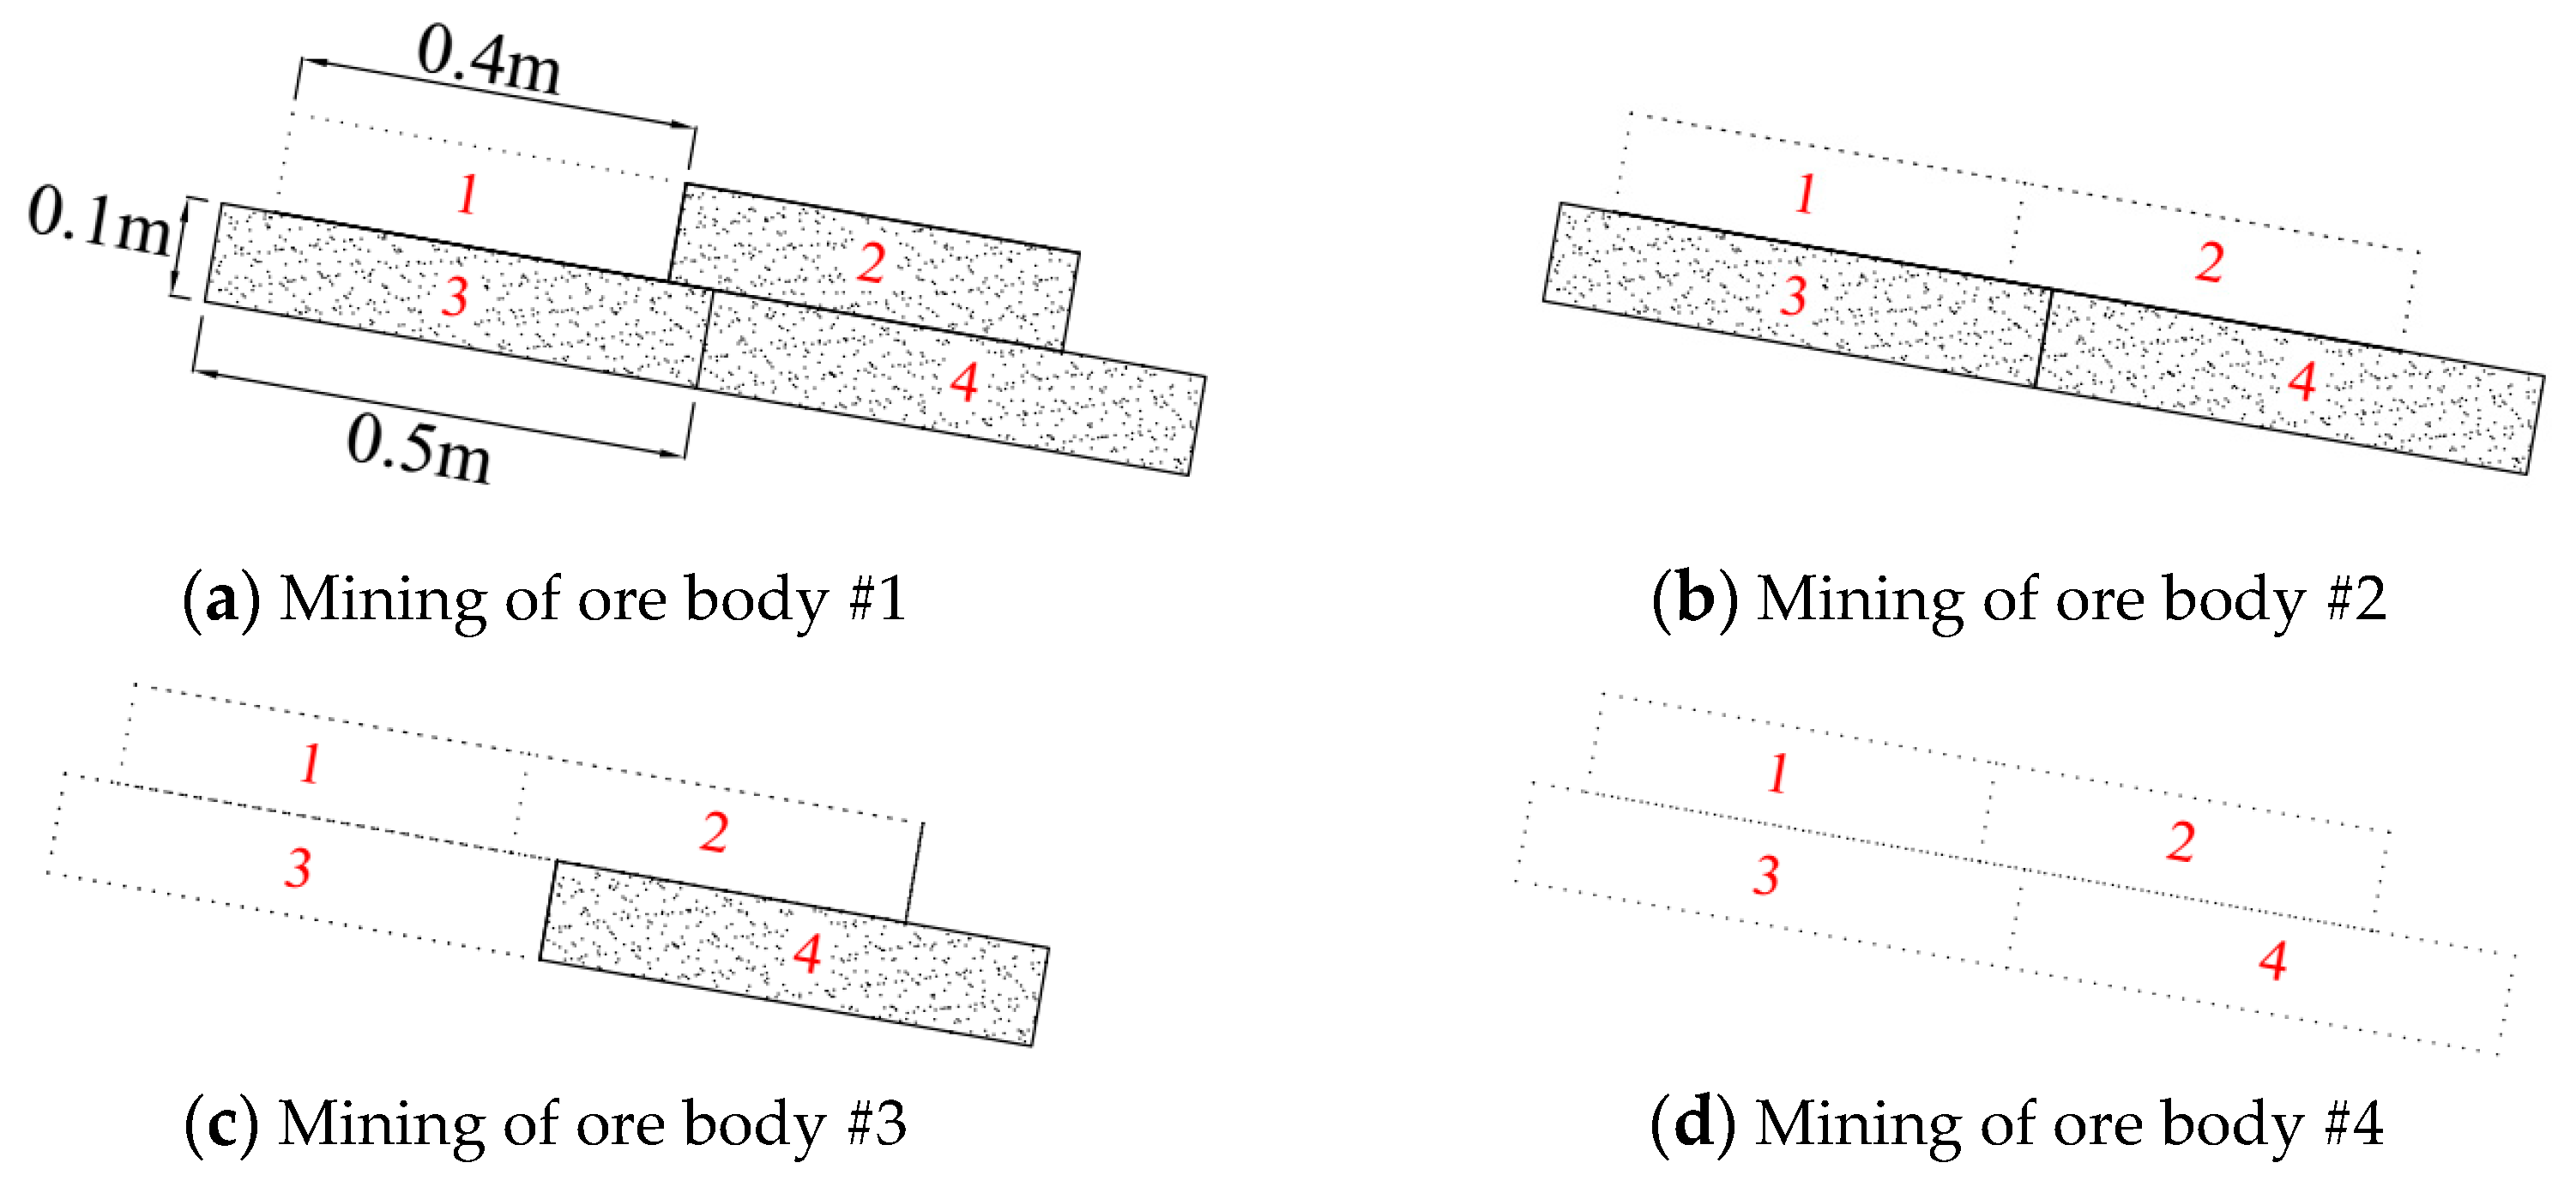
Figure 7.
Elevation view of the 3-D numerical model.

Figure 8.
Results of numerical analysis at different joint spacing; (a) model setup; (b) 10 cm; (c) 9 cm; (d) 8 cm; (e) 7.5 cm; (f) 7 cm; (g) 6 cm; and (h) 5 cm.
Figure 8.
Results of numerical analysis at different joint spacing; (a) model setup; (b) 10 cm; (c) 9 cm; (d) 8 cm; (e) 7.5 cm; (f) 7 cm; (g) 6 cm; and (h) 5 cm.
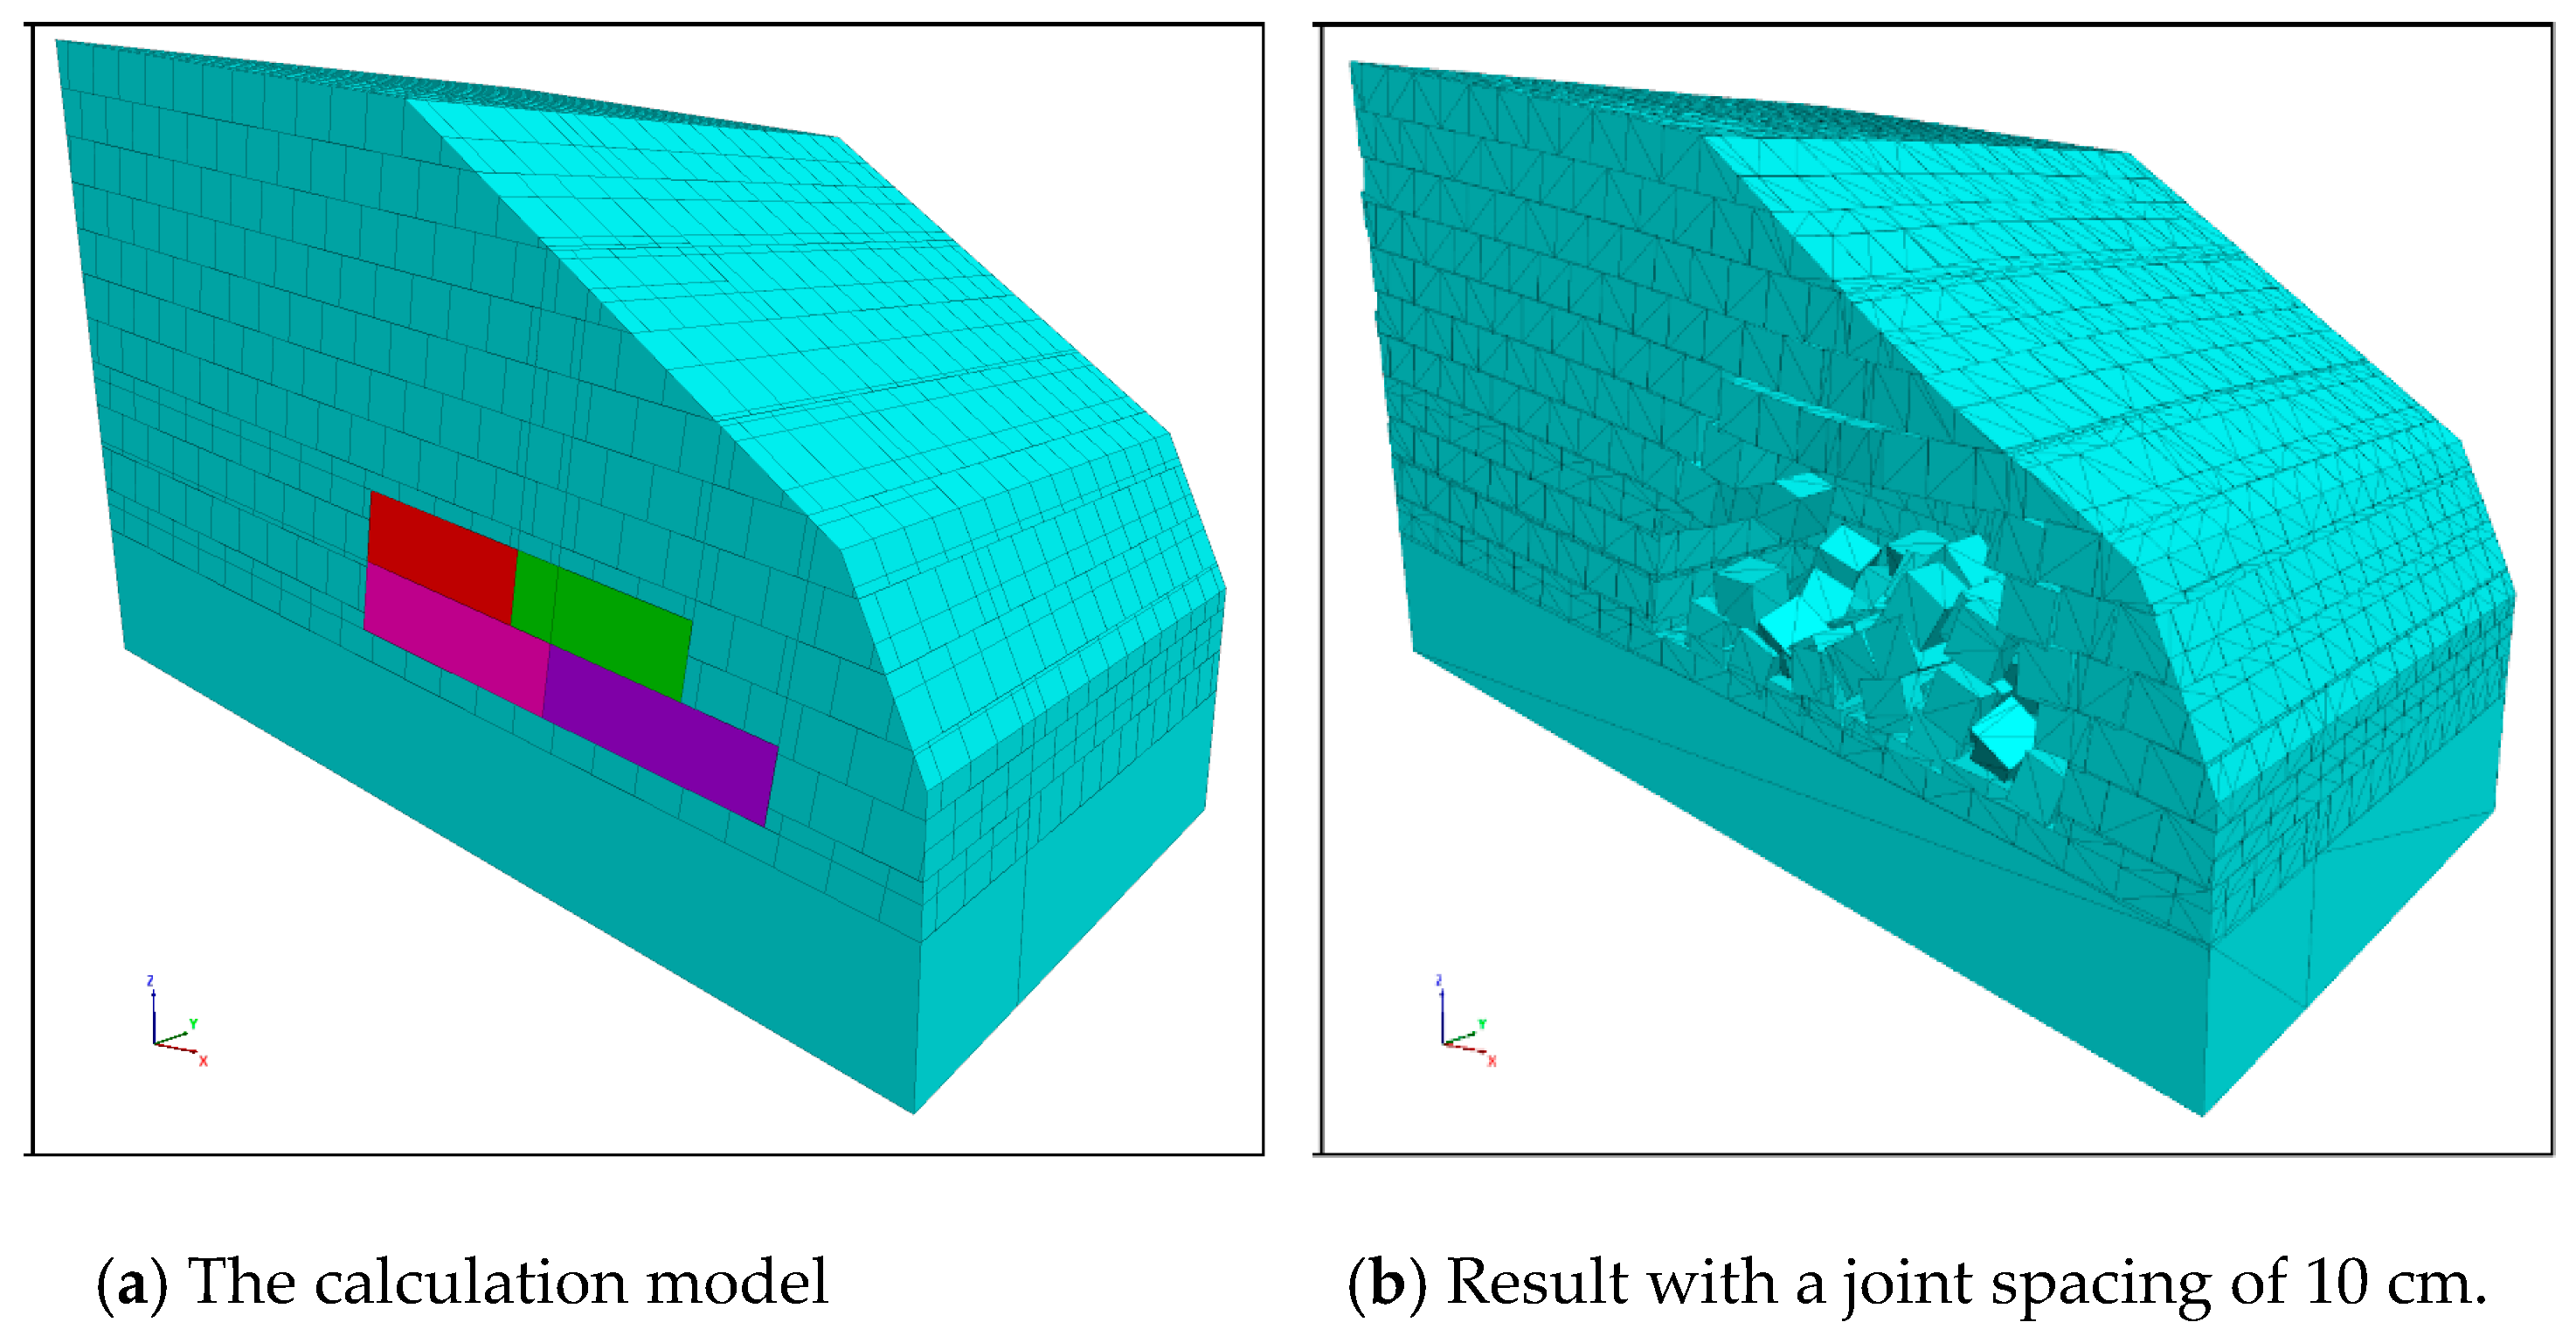

Figure 9.
Slope deformation and displacement vector after mining ore body #1.

Figure 10.
Slope deformation and displacement vector after mining ore body #2.

Figure 11.
Slope deformation and displacement vector after mining ore body #3.
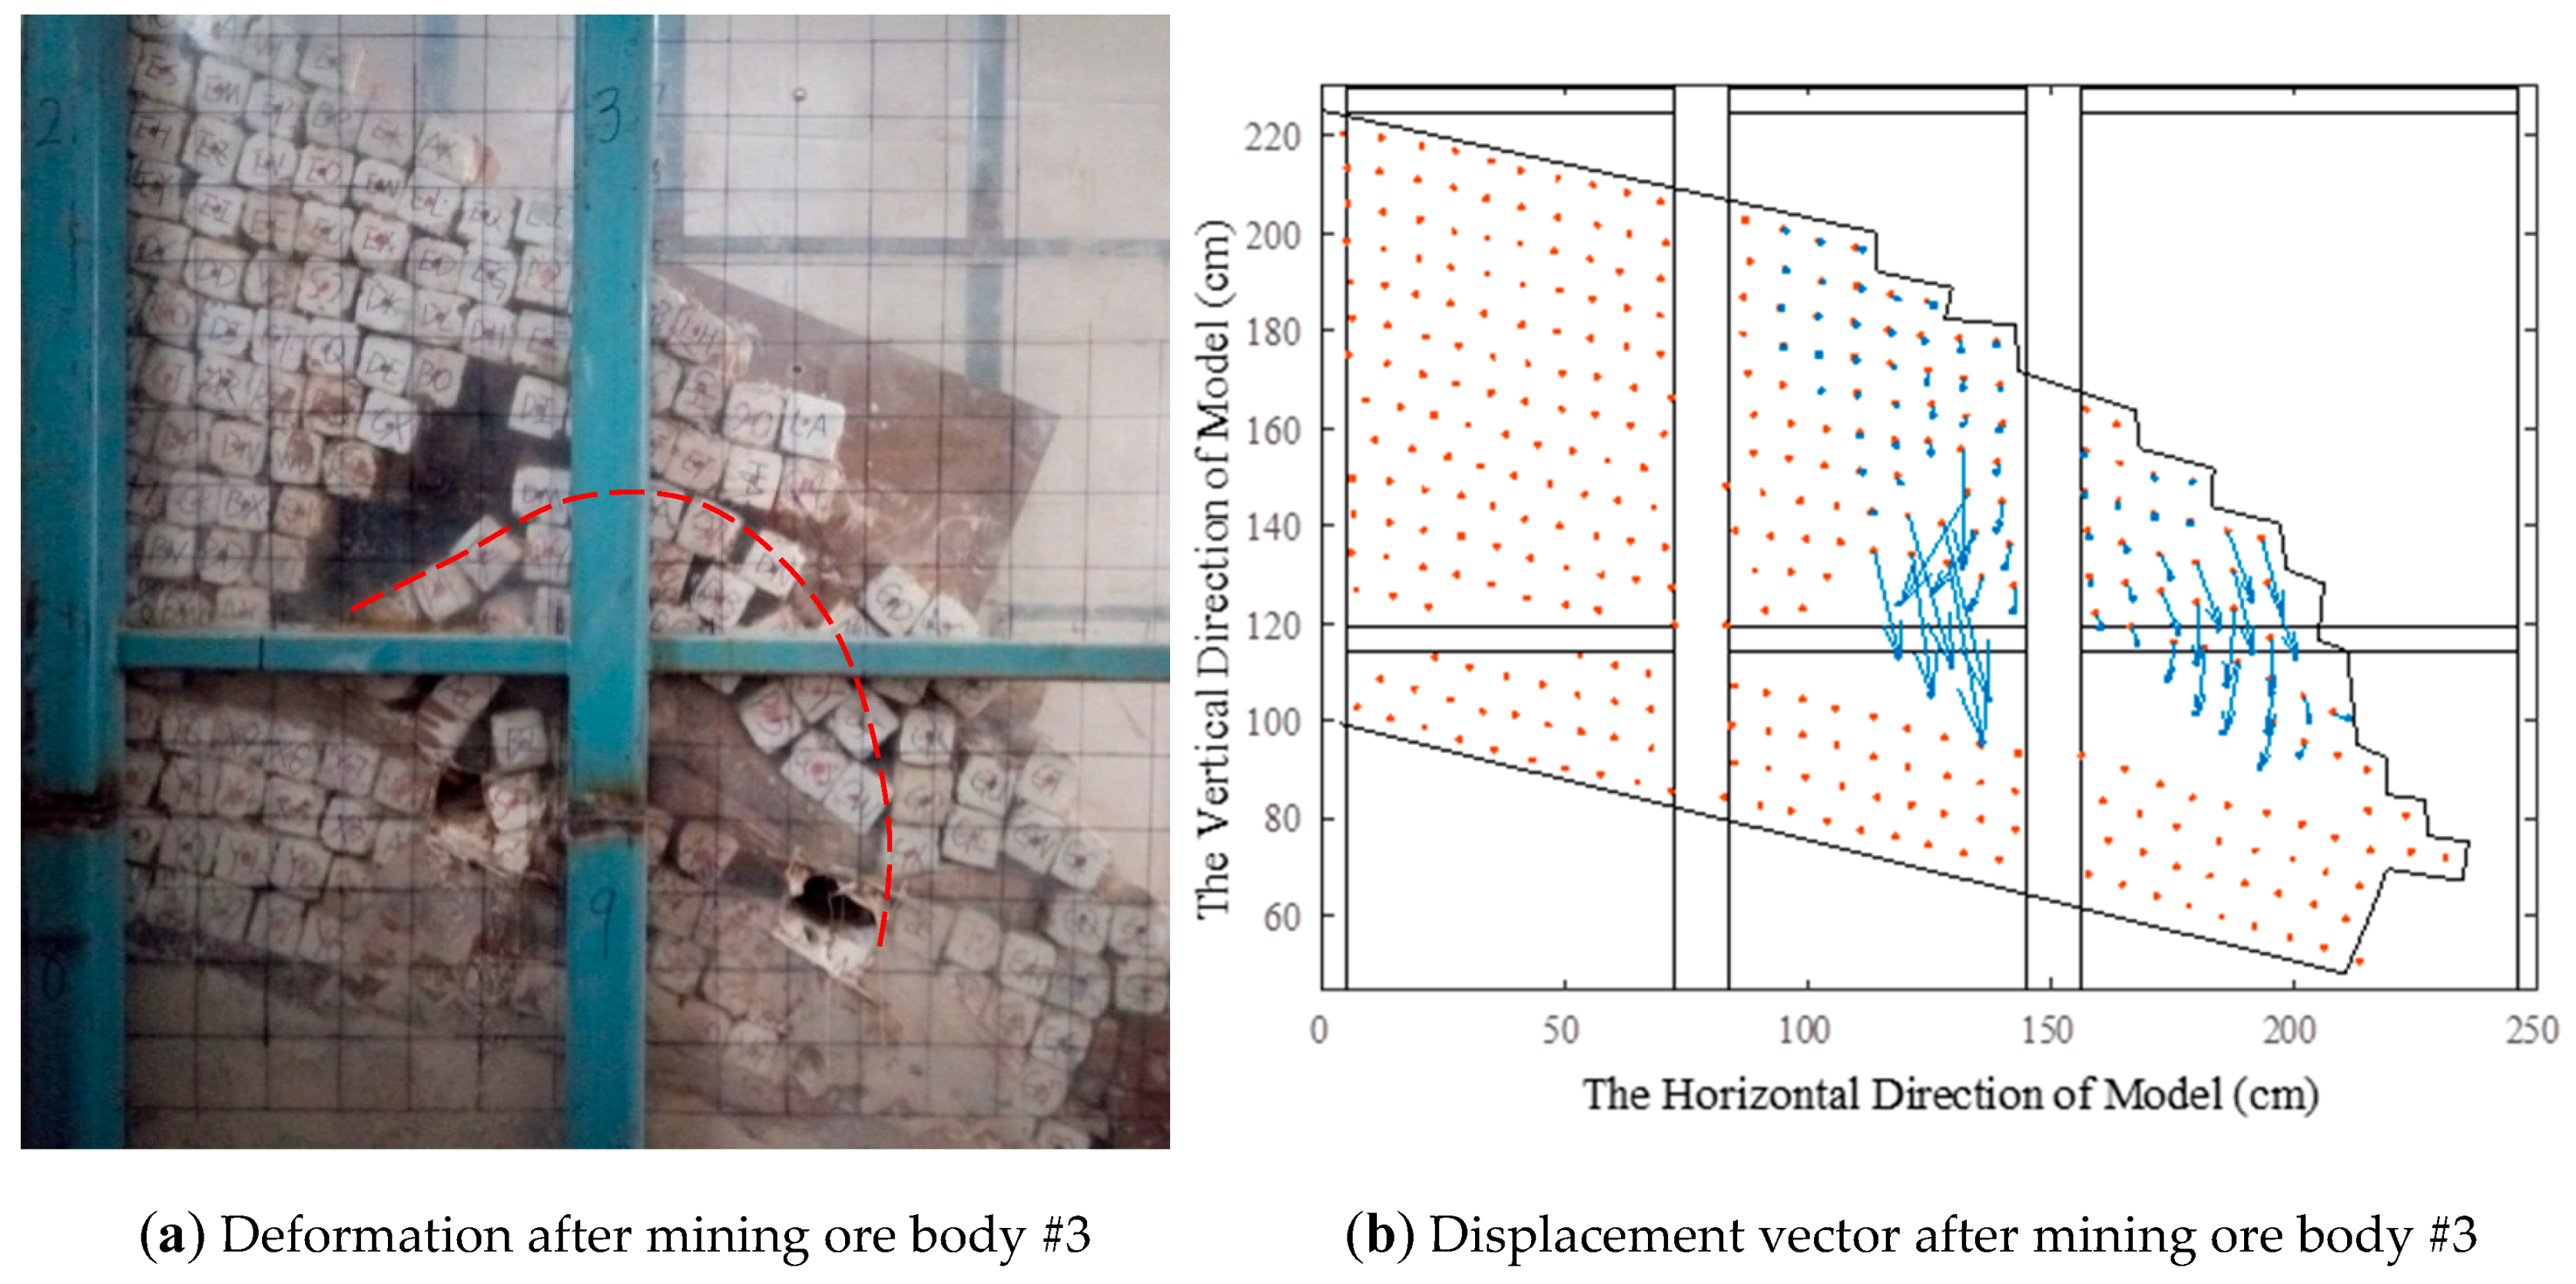
Figure 12.
Slope deformation and displacement vector after mining ore body #4.
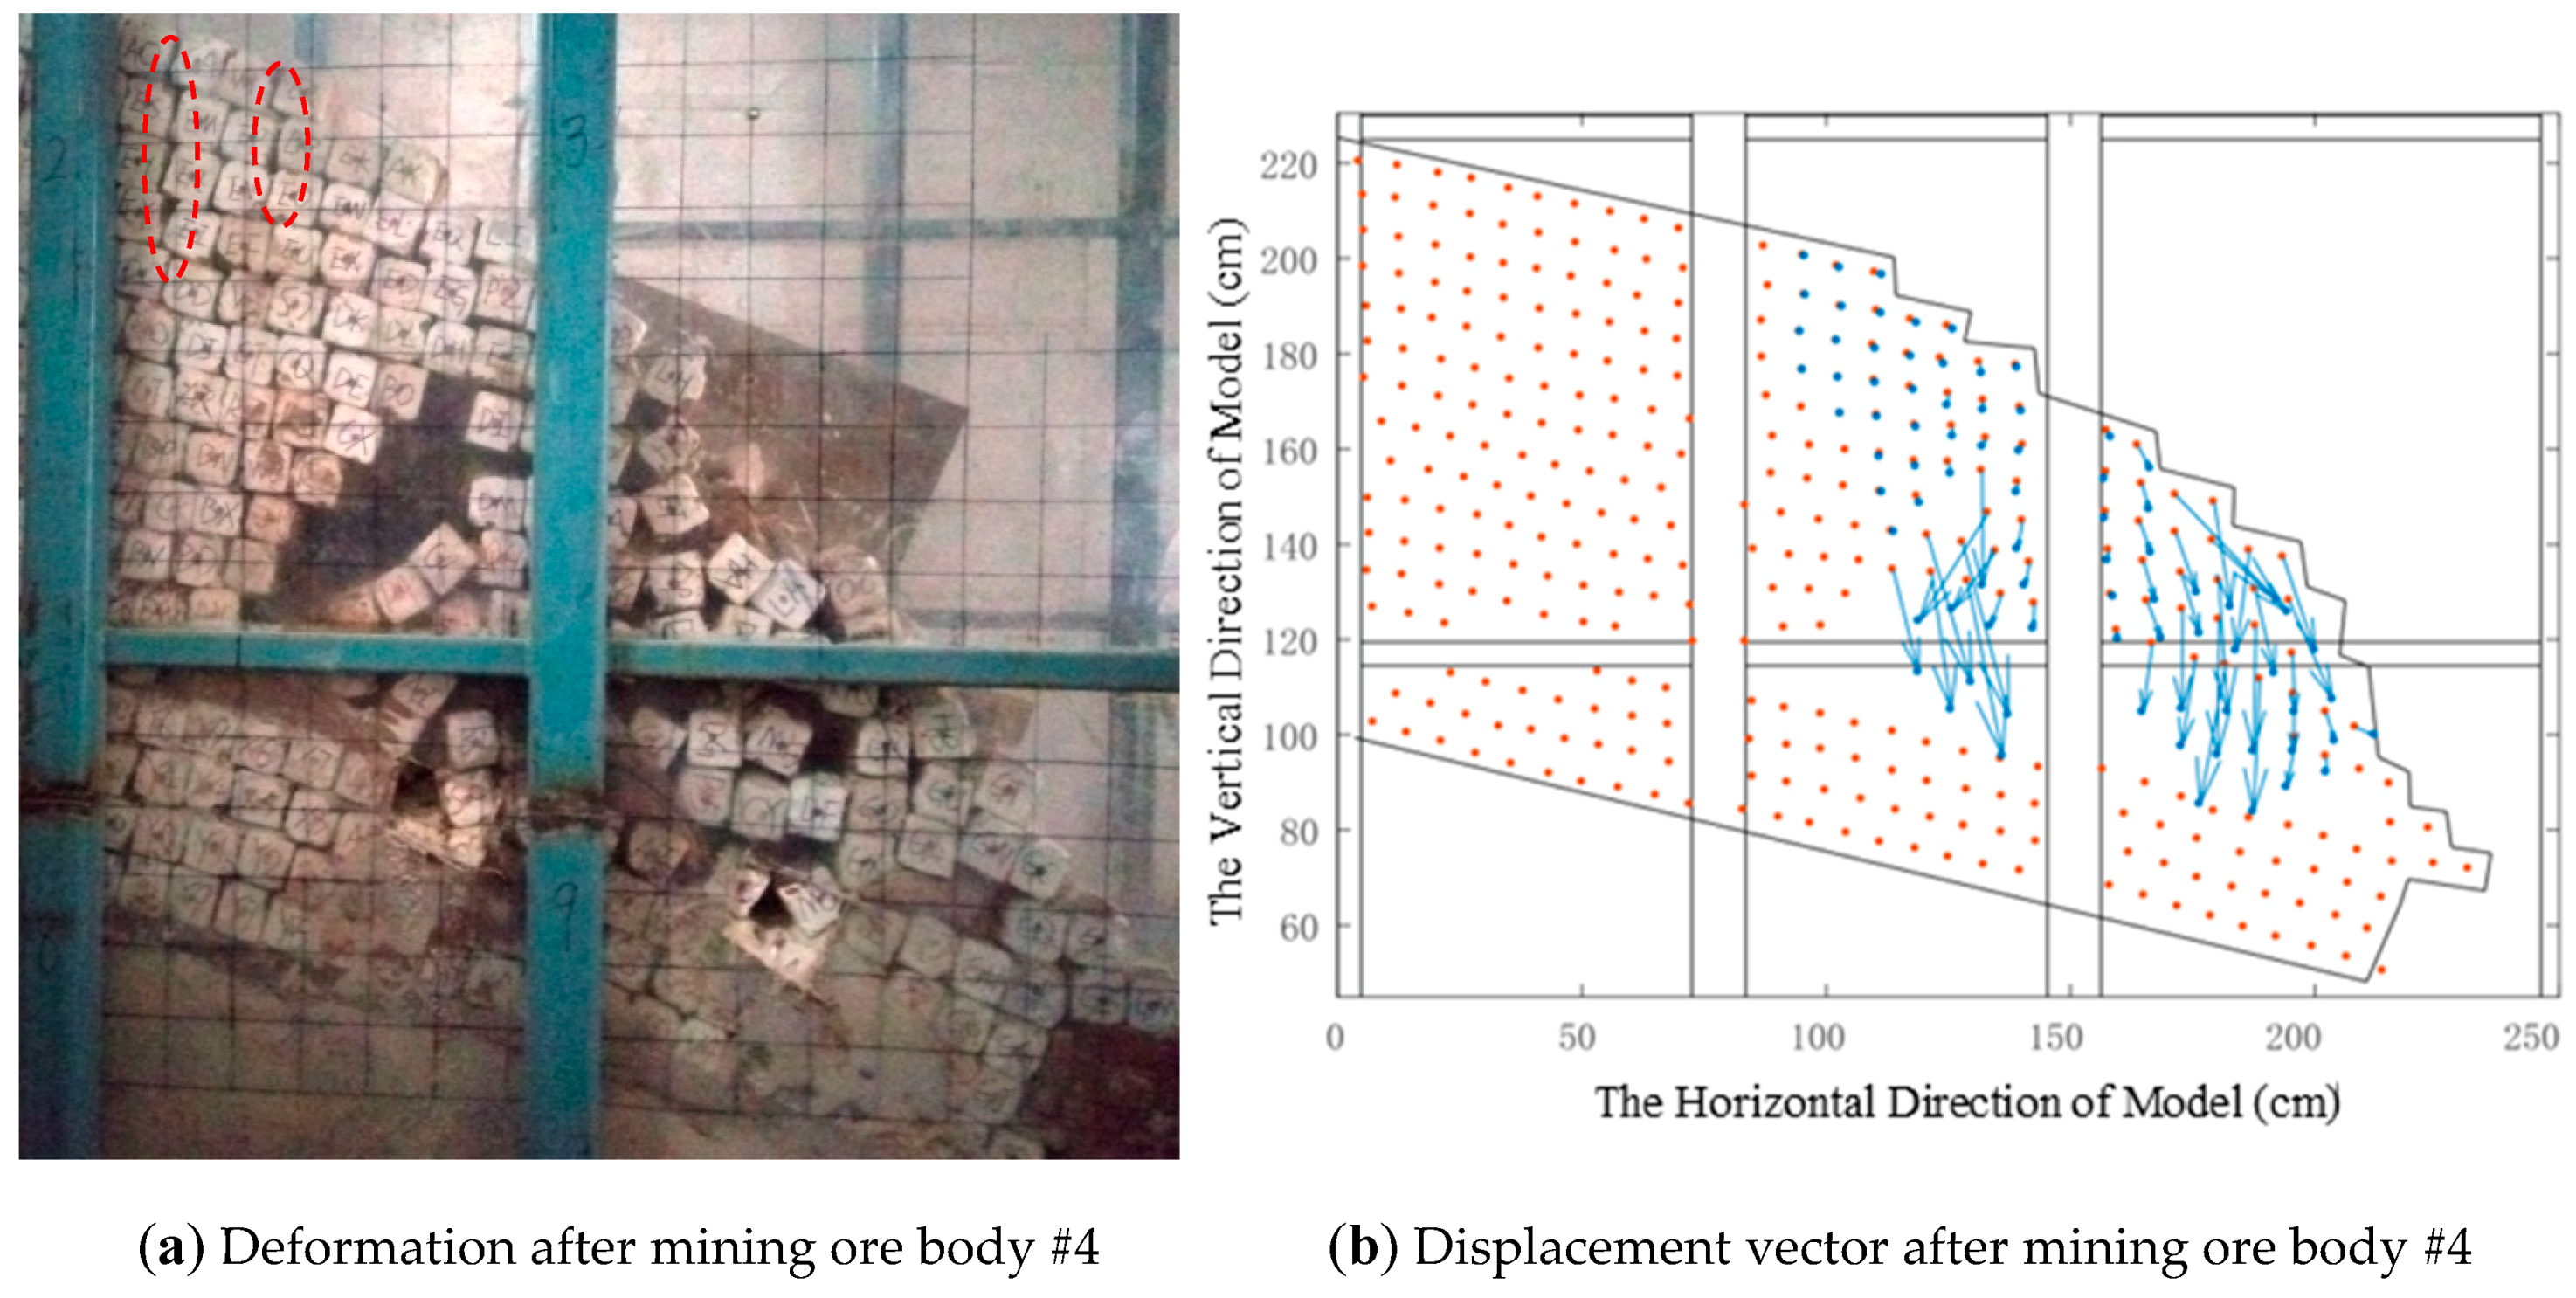
Figure 13.
Front view of the model slope after four stages of mining. Subsidence pit was formed above the mining area.
Figure 13.
Front view of the model slope after four stages of mining. Subsidence pit was formed above the mining area.
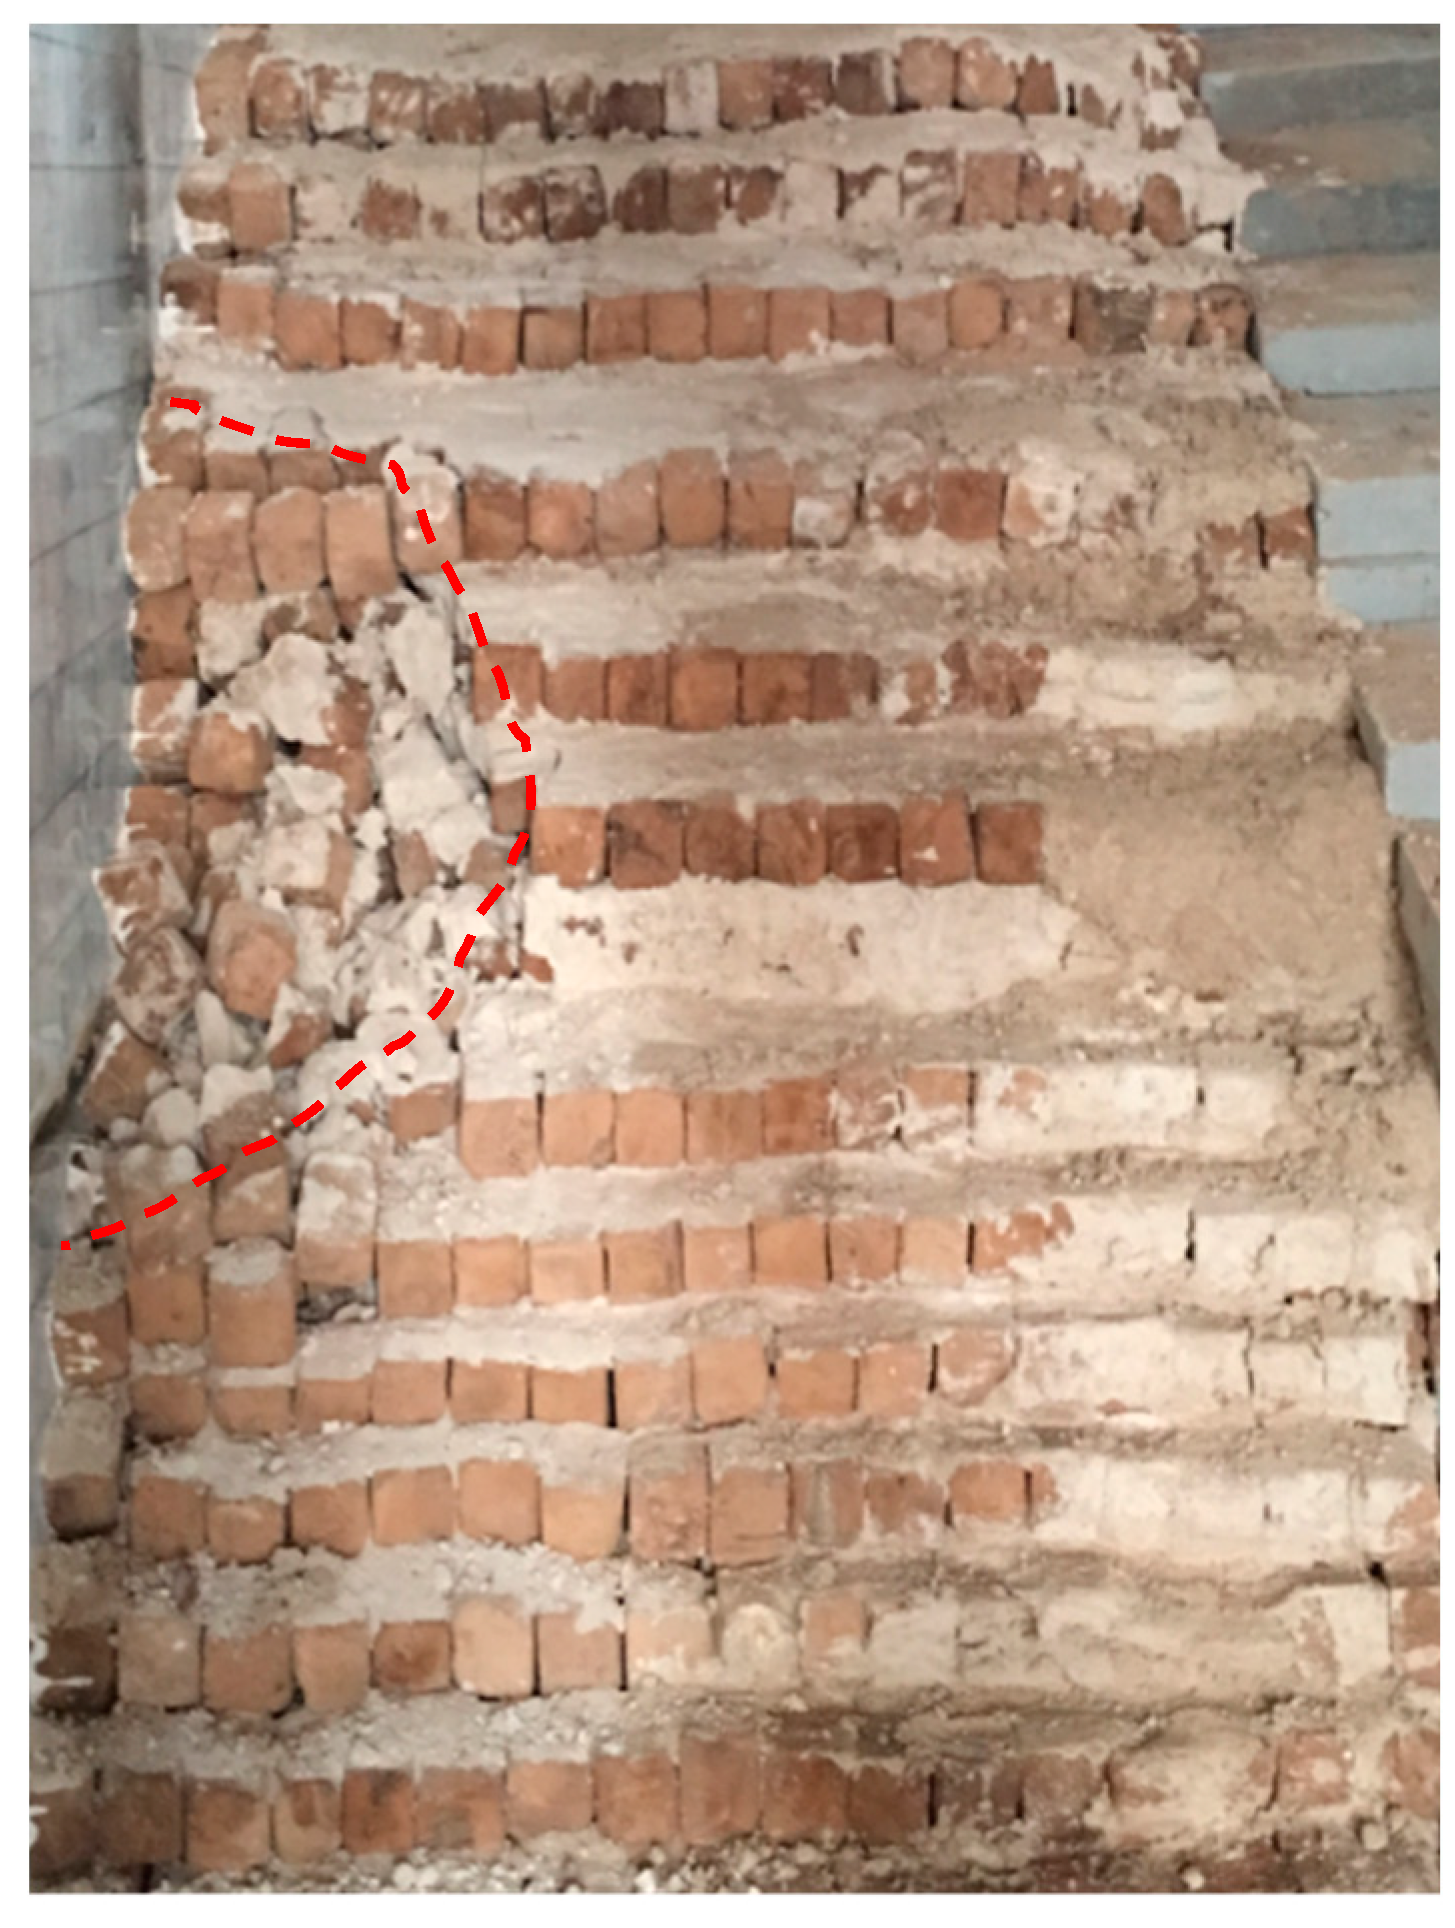
Figure 14.
Process of strata movement by numerical simulation.

Figure 15.
Vertical displacement by numerical simulation.

Table 1.
Mechanical parameters of the major rock masses found in the Yanqianshan iron mine.
| Rock Mass | Compressive Strength (MPa) | Deformation Modulus (GPa) | Cohesion (MPa) | Internal Friction Angle (°) |
|---|---|---|---|---|
| Mixed rock | 164.34 | 3~5 | 40~50 | 38~40 |
| Diorite | 181.47 | 2 | 55~60 | 40~42 |
| Carbonaceous phyllite | 44.52 | 1.5 | 35~38 | 35~38 |
| Chlorite quartz schist | 98.56 | 1.5~2 | 40~45 | 38~40 |
Table 2.
Similarity relationships of the main controlling parameters of the physical model.
| Parameters | Similarity Relationship | Similarity Ratio |
|---|---|---|
| Geometry () | —— | 200 |
| Bulk Density () | —— | 1 |
| Stress () | —— | 1 |
| Poisson’s Ratio () | —— | 1 |
| Friction Angle () | —— | 1 |
| Strain () | 200 | |
| Elastic Modulus | 200 |
Table 3.
The mass proportion of the model rock mass.
| Cement | Quartz Sand | Barite | Iron Powder | Gypsum | Water |
|---|---|---|---|---|---|
| 1 | 28 | 28 | 6.67 | 3 | 7.07 |
Table 4.
Mechanical properties of the model rock mass.
| Density (g/cm3) | Uniaxial Compressive Strength (MPa) | Deformation Modulus (MPa) | Cohesion (MPa) | Friction Angle (°) |
|---|---|---|---|---|
| 2.56 | 0.80 | 200.61 | 0.1735 | 38.94 |
Table 5.
Mass proportion of the adhesive used.
| Barite | Quartz Sand | Gypsum | White Latex |
|---|---|---|---|
| 3.5 | 4.8 | 0.9 | 1 |
Table 6.
Mechanical properties of rock joint strength (model scale).
| Cohesion (MPa) | Friction Angle (°) | Tensile Strength (MPa) | |
|---|---|---|---|
| Joint strength of model slope | 0.164 | 20.45 | 0.00698 |
| Joint strength of field rock | 33 | 21 | 1.5 |
© 2019 by the authors. Licensee MDPI, Basel, Switzerland. This article is an open access article distributed under the terms and conditions of the Creative Commons Attribution (CC BY) license (http://creativecommons.org/licenses/by/4.0/).
Share and Cite
MDPI and ACS Style
Yang, G.; Leung, A.K.; Xu, N.; Zhang, K.; Gao, K. Three-Dimensional Physical and Numerical Modelling of Fracturing and Deformation Behaviour of Mining-Induced Rock Slopes. Appl. Sci. 2019, 9, 1360. https://doi.org/10.3390/app9071360
AMA Style
Yang G, Leung AK, Xu N, Zhang K, Gao K. Three-Dimensional Physical and Numerical Modelling of Fracturing and Deformation Behaviour of Mining-Induced Rock Slopes. Applied Sciences. 2019; 9(7):1360. https://doi.org/10.3390/app9071360
Chicago/Turabian StyleYang, Guoxiang, Anthony K. Leung, Nengxiong Xu, Kunxiang Zhang, and Kunpeng Gao. 2019. "Three-Dimensional Physical and Numerical Modelling of Fracturing and Deformation Behaviour of Mining-Induced Rock Slopes" Applied Sciences 9, no. 7: 1360. https://doi.org/10.3390/app9071360
Note that from the first issue of 2016, this journal uses article numbers instead of page numbers. See further details here.