Curable Area Substantiation of Self-Healing in Concrete Using Neutral Axis


1
Department of Civil and Environmental Engineering, Chonnam National University, Yeosu, Chonnam-do 59626, Korea
2
Department of Civil Engineering, Pusan National University, Busan 46241, Korea
*
Author to whom correspondence should be addressed.
Appl. Sci. 2019, 9(8), 1537; https://doi.org/10.3390/app9081537
Submission received: 4 March 2019
/
Revised: 21 March 2019
/
Accepted: 11 April 2019
/
Published: 13 April 2019
(This article belongs to the Special Issue Fatigue and Fracture of Non-metallic Materials and Structures)
Abstract
:Featured Application
This study substantiates a curable area with self-healing in concrete material using a flexural test. The neutral axis was estimated as tension strains from attached successive strain gauge, and this before and after healing specified the curable area.
Abstract
The self-healing nature of concrete has been proved in many studies using various methods. However, the underlying mechanisms and the distinct area of self-healing have not been identified in detail. This study focuses on the limits of the area of self-healing. A bending specimen with a notch is used herein, and its flexural strength and stiffness before and after healing are compared and used for self-healing assessment. In addition, the neutral axis of the specimen was measured using successive strain gauges attached to the crack propagation part. Although the strength and stiffness of the concrete recovered after self-healing, the change in the location of the neutral axis before and after healing was insignificant, which indicates that physical recovery did not occur for once-opened crack areas.
1. Introduction
Self-healing of concrete is attracting attention as a solution for reducing maintenance costs and environmental issues. Conventionally, studies in the literature on concrete development have focused mainly on improving the properties of concrete such as strength; durability; resistance against acid, chlorides, corrosion, etc. [1]. Ultra-high-strength concrete of over 100 MPa has been developed [2], and the strength of the concrete used in actual applications has been increased [3,4]. Moreover, various admixtures are being applied to improve the durability of concrete [5,6,7,8,9]. These efforts ultimately aim to reduce construction costs by reducing the section areas of a framework. By contrast, there is a debate about reducing maintenance costs of an increasing cumulative number of old concrete structures [10,11,12]. In addition, research on mitigating environmental problems is required in the concrete industry based on the notion that environmental issues should be assessed at any cost [13]. Self-healing of concrete presents advantages in terms of reducing costs and solving environmental problems. The main aim is to reduce maintenance costs through automatic crack detection and recovery in general, and multiple self-healing methods are available to this end. Moreover, the increased lifetime of concrete structures due to self-healing reduces the overall usage of cement in the long term, thereby gradually mitigating the environmental harm arising from the CO2 generated during cement production.
Self-healing of concrete has been studied from various viewpoints over the past decade. The most famous study involved the active method of using capsules containing an adhesive [14,15,16,17,18,19,20]; this method is classified as active because it uses additives that are not used in normal concrete. Another famous active method was proposed based on the use of microorganisms [21,22,23,24], which help deposit crack-restoring substances. Moreover, many passive methods exist, for example, improvement of self-healing environment using fibers that prevent the occurrence of a single large crack and induce multiple cracks of small width [25,26,27,28]. The recovery due to self-healing is not only general strength recovery but also durability recovery such as decreased water permeability [29,30,31,32,33]. Furthermore, self-healing techniques have been studied in various ways depending on the types and shapes of cracks that can occur in a structure, and various methods for verifying the healing effect have been proposed. However, existing studies have generally measured the degree of healing by an indirect method because direct observation of cracks and post-healing conditions is not easy and has various limitations.
The most important part of self-healing assessment is to measure efficiently and quantify accurately the healing effects. Indirect measurements, such as strength measurement, permeability estimation, and ultrasonic pulse velocity measurement, can easily quantify the healing effect by comparing the measured values before and after healing. However, these measurements are limited to relative comparison because the generated cracks are not directly measured and compared after healing. In addition, it is difficult to exclude the influence of the portion with no cracking because the measurement range covers the entire specimen as opposed to only the area around the generated crack. Especially, the age effect, which is necessarily accompanied by healing time, makes it difficult to evaluate only the healing effect accurately. Therefore, to distinguish the self-healing effect more clearly, a more direct measure is required.
2. Experimental Setup
2.1. Three-Point Bending Test with A Notch
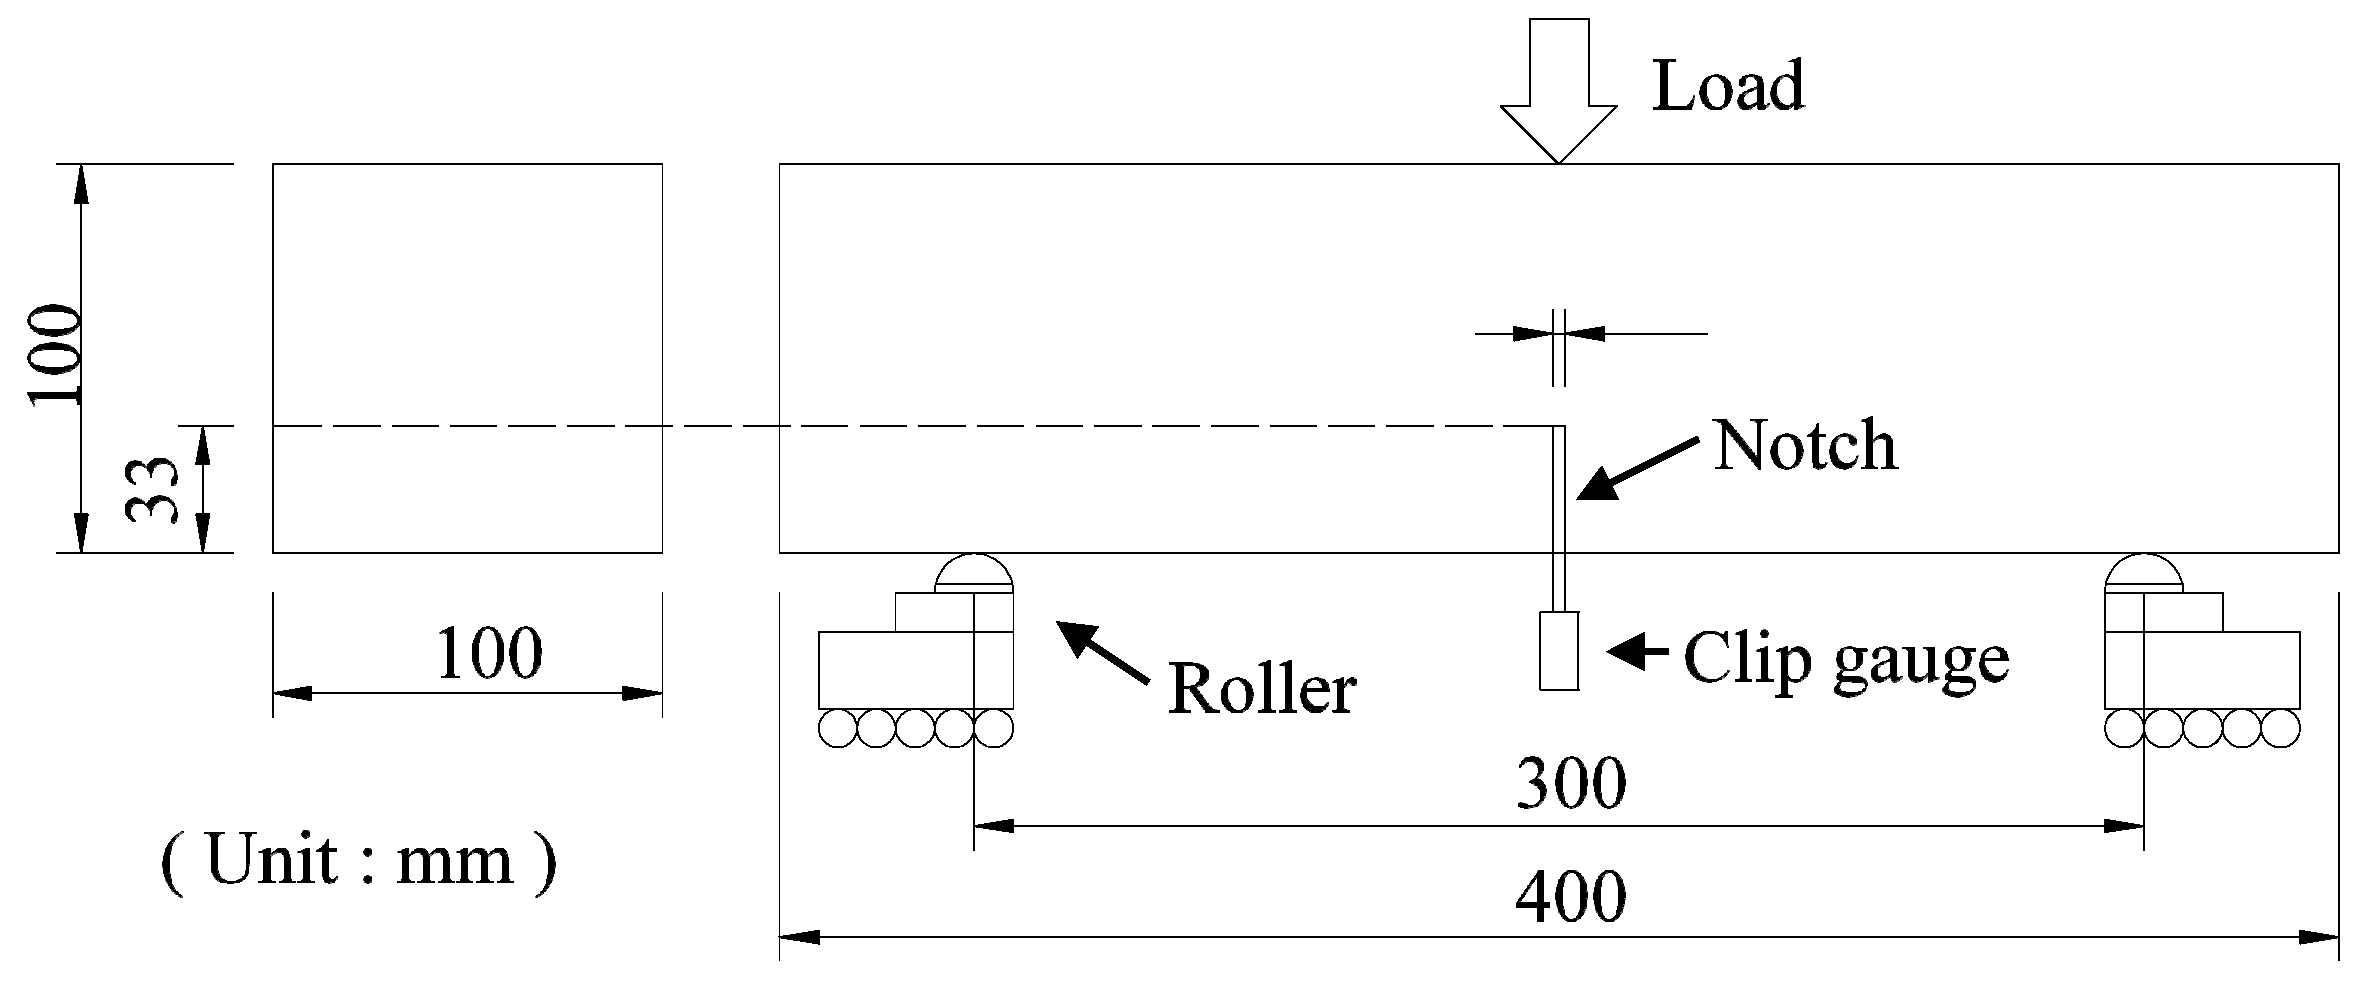
In this study, the three-point bending test with a notch was performed for assessment of the self-healing property of concrete. The self-healing measurement process generally proceeds in the order of crack inducement, performance measurement before healing, healing, and performance measurement after healing. Crack inducement involves determining the depth or area of a crack; in other words, the recoverable area is determined in this process. It is important to maintain constant width and depth of the crack for an accurate comparison of the healing effect, and the three-point bending test with a notch is advantageous in this respect. The notch given just below the load point limits the crack evolution to only a single crack, and the crack mouth opening displacement (CMOD) can be measured easily by installing the instrument at the bottom of the notch. Crack propagation is correlated directly to the CMOD in the three-point bending test; therefore, it can be controlled easily during the loading process. In addition, performance before healing can be measured by investigating the behavior of the specimen during the reloading process (2nd loading) just after crack inducement. After healing, the same scheme of loading (3rd loading) is applied to measure performance after healing. The 2nd loading and the 3rd loading follow the same loading schemes at different times, so the comparison before and after healing is easy and clear. Furthermore, the specimens used in this test can be fabricated easily without the use of any specialized equipment. Owing to the abovementioned reasons, we used the three-point bending test with a notch for assessments in this study. We performed the experiment by referring to the Réunion Internationale des Laboratoires et Experts des Matériaux (RILEM) and Japan Concrete Institute (JCI) standards [34,35]. Figure 1 shows a schematic of the experimental setup.
The degree of crack inducement was set to CMOD 0.05 mm. It is necessary to standardize the depth of the crack in all specimens to quantify the healing effect. The crack depth was controlled constantly by advancing the CMOD. Granger et al. used a certain percentage (60%) of the peak load as a standard for the crack depth [36]. However, it was confirmed that the behaviors of the specimens after the peak load differed, even in the case of specimens of the same age. Therefore, a constant CMOD of 0.05 mm was applied to the 1st loading of all cases by referring to the literature [23,37], and unloading was performed until the load decreased to zero. The 2nd loading was also conducted until a CMOD of 0.05 mm was achieved. The crack depth based on the CMOD was confirmed to be relatively even in all specimens.
2.2. Specimen
A prismatic specimen measuring L400 × W100 × D100 mm was used in this study, as specified in the JCI standard (JCI-S-001-2003). RILEM specifies a longer specimen for the three- or four-point bending test, but small specimens are convenient from the viewpoint of the most essential curing process in self-healing [38]. Ordinary Portland cement was used as the base material, and additional materials that can aid the healing process were not included because we sought to focus on the crack itself. The water–cement ratio (W/C) was set to 45%. Detailed specifications of the concrete mix are listed in Table 1.
All specimens were fabricated at the same time and with the same materials, and the notch was also created at the same time and cured for seven days. All specimens were cast in steel molds, and they were demolded and cured in fresh water at 20 °C for the following 24 h. Five different cases were considered in this study, and the faster loading process (1st loading) of these cases was planned on the seventh day after fabrication. Therefore, the notches in all specimens were sawed on the seventh day of the curing process. A wet concrete cutter with a diamond blade was used for sawing the notch.
The notch depth depends on the maximum load capacity of the specimens. If the notch is too deep, there would not be sufficient space to measure the neutral axis. Considering these aspects, the notch depth was set to 33 mm, which is one-third of the specimen depth, and the notch width was set to 3 ± 0.5 mm. Cracks occur near the peak load and begin to propagate, and the crack propagation speed is generally higher with a higher peak load. As a preliminary experiment, 25% of the load specified in RILEM or 30% of the load specified in the JCI standard was found to be too high as peak loads from the viewpoint of controlling crack propagation easily.
These were three loading processes per case. The 1st loading induced the crack in each specimen. The 2nd loading just followed the 1st loading. The 2nd loading was limited to the extent that the crack induced in the 1st loading was no longer advanced, and it measured performance before healing. After the 2nd loading, specimens entered the healing process. The healing process was done in different healing conditions (freshwater and air) and in different periods of time (21 days, 42 days and 63 days). The 3rd loading was performed after the healing process. We were able to determine the degree of healing effect by comparing the 2nd loading and the 3rd loading performed before and after the healing process.
Five different cases were planed; 7-28 case, 7-49 case, 7-70 case, 28-49 case and 49-70 case. The first number of case names indicates when the 1st loading and the 2nd loading took place. Both of them was done at the same days because the 2nd loading was just followed the 1st loading. The second number of case names indicates the date when the 3rd loading was made, and the healing period could be calculated from the difference between two numbers in the case name. For example, 28-70 case means that the 1st loading and the 2nd loading was done on the 28th days and the 3rd loading was done on the 70th day with a 42-day healing period. Finally, the letters W and A at the end of the case name represent the healing condition; healing in freshwater at 20 °C and healing in air in a curing room maintained at 20 °C.
The effect of the healing period would be investigated comparing 7-28 case, 7-49 case and 7-70 case. These cases took place on the 7th day of the same day as the 1st loading and the 2nd loading, only different healing period. And, the effect of the crack inducement time would be investigated comparing 7-28 case, 28-49 case and 49-70 case. The 1st loading and the 2nd loading were performed on different dates in these cases, but the healing period is the same as 28-day. More than three specimens were prepared for every case. Table 2 describes the test program
3. Self-Healing Assessment
3.1. Strength
The flexural strengths of the specimens at four points were compared in this study. Strength is the most widely used and most comparable criterion in the case of a specimen under a given condition. When using flexural strength, it is important to fix the points that are the subjects of comparison, because of which the degree of evaluation stabilizes accordingly. First, the load at the unloading point of the 1st loading was compared to the maximum load of the 3rd loading. If the latter was found to be larger than the former, the healing effect was considered to occur, although the age effect of the undamaged part may have played a role as well. That is, the increase in flexural strength after healing can be ascribed not only to the healing effect but also the age effect. Second, the load at CMOD 0.05 mm of the 3rd loading was compared to the load at the same point of the 2nd loading. This comparison made it relatively straightforward to compare the flexural strength recovery before and after healing because these values were measured with the same degree of damage. This comparison may be less affected by the age effect because it was made at the point at which the crack does not advance.
3.2. Flexural Stiffness
The initial flexural stiffness of the specimen was used for the self-healing assessment instead of the flexural strength. The healing area was limited to the crack tip because van Breugel reported that the recoverable limit of a crack was under 0.2 mm [21,22], and this crack tip may be involved in the initial behavior of the crack re-opening. By contrast, Jenq et al. reported that the modulus of elasticity of the specimen material is directly related to its flexural stiffness, which is described by the compliance between the CMOD and the load [39]. Moreover, Shah et al. reported that the flexural stiffness of the material is related to the critical stress intensity factor [40]. In addition, the initial part of flexural stiffness may explain the crack re-opening behavior. This is the reason why the initial flexural stiffness was compared in the present study.
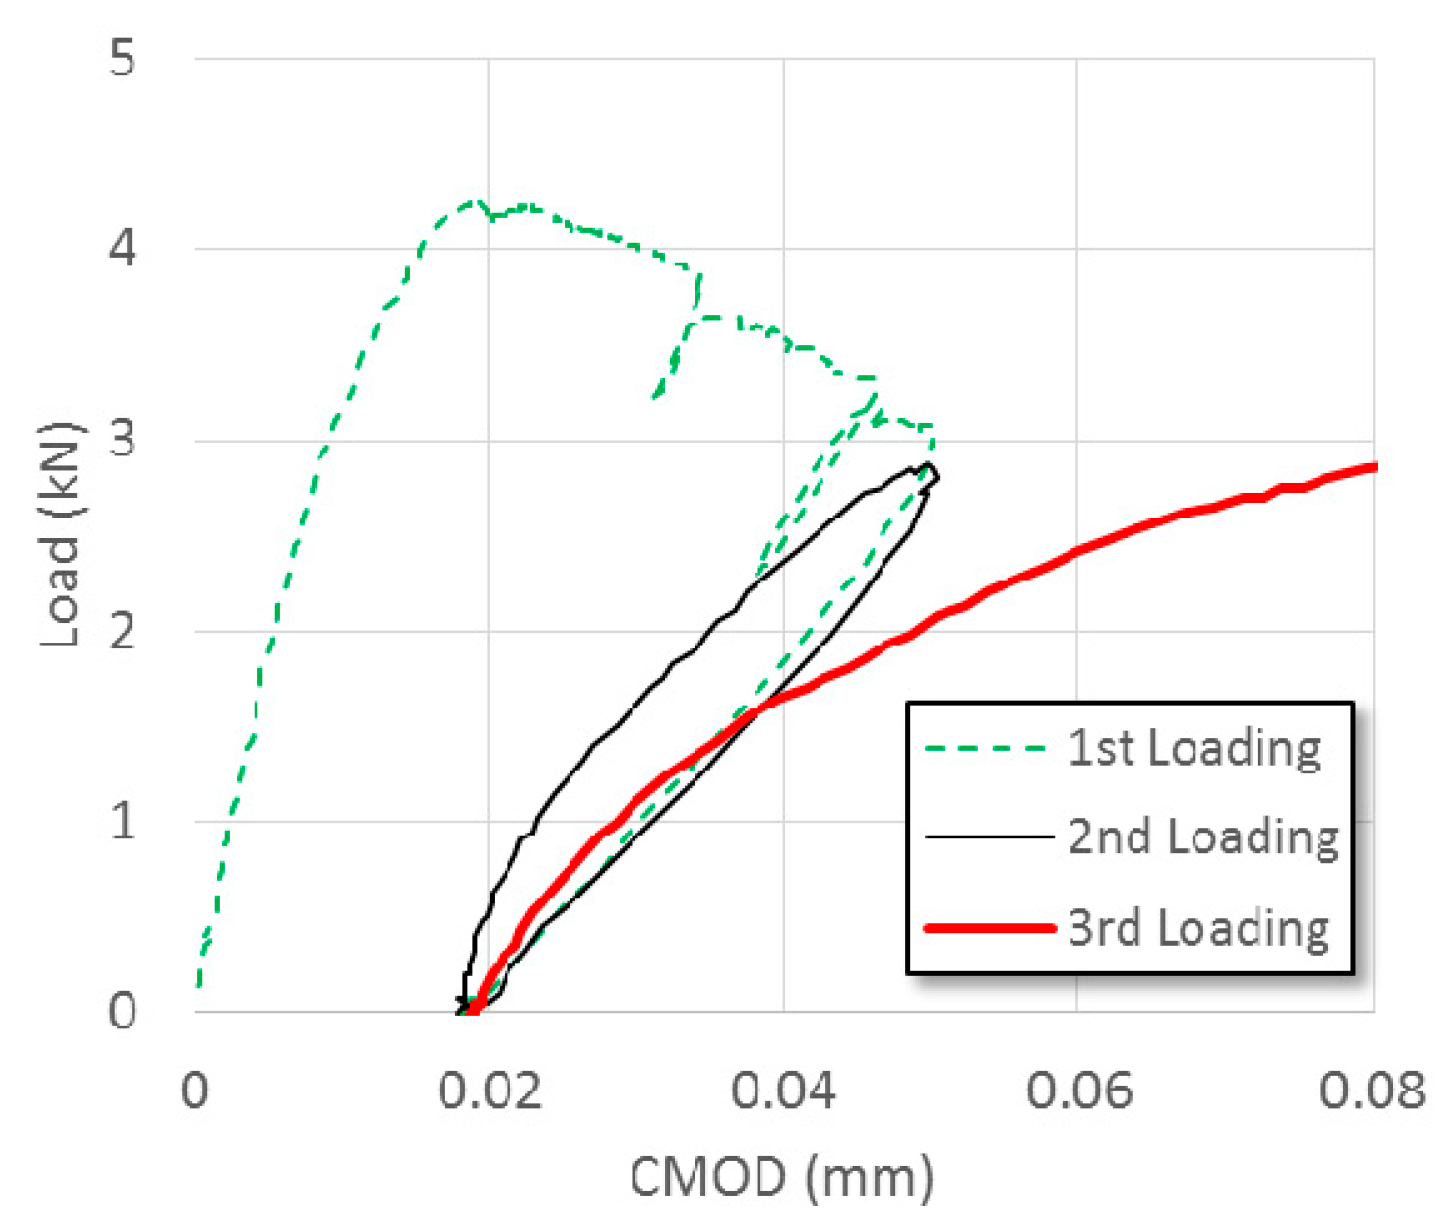
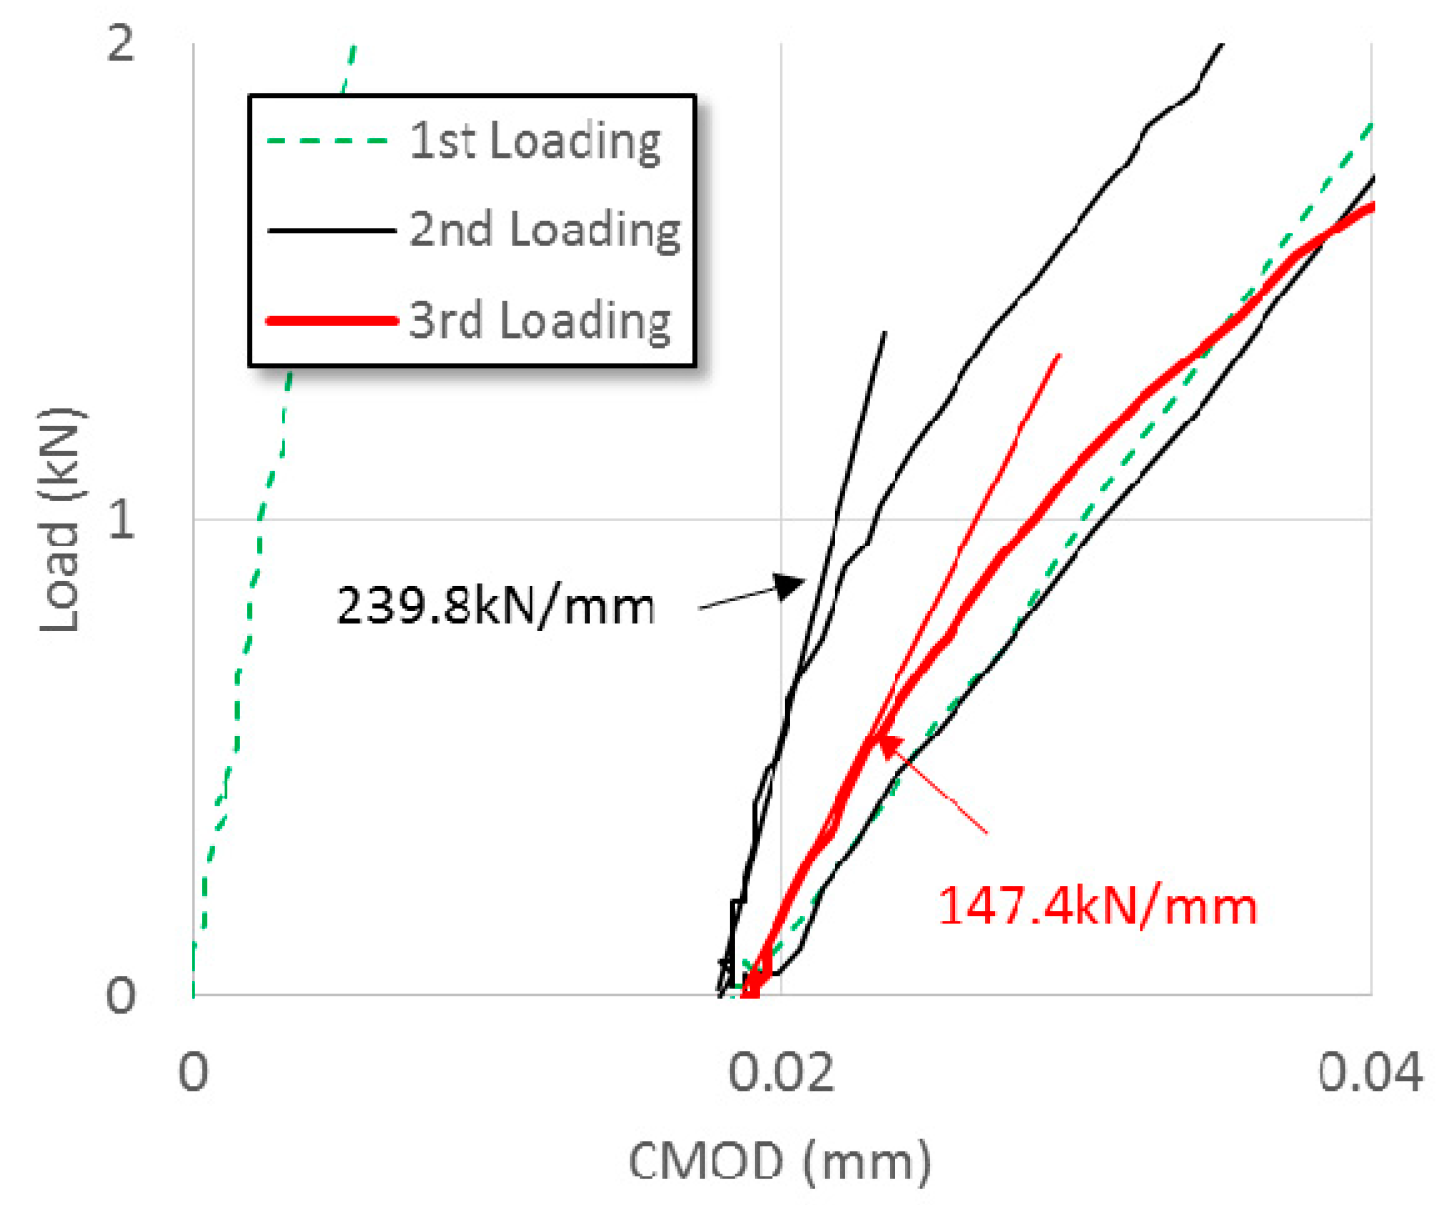
The initial flexural stiffness of the 2nd loading before healing and the 3rd loading after healing was compared in this study. The behaviors of the 2nd loading and the 3rd loading were different, as shown in Figure 2. Especially, the initial parts of these behaviors differed significantly according to the healing time and the healing condition. In the load-CMOD relationship, the slope from 0.004 mm to 0.005 mm of CMOD from the starting point of reloading (2nd and 3rd loading) which is a relatively straight line, was calculated as the initial flexural stiffness, as shown in Figure 3. The slopes of the 2nd and the 3rd loading were obtained and the ratio of these two values was used for the quantification of the healing effect.
3.3. Neutral Axis Estimation
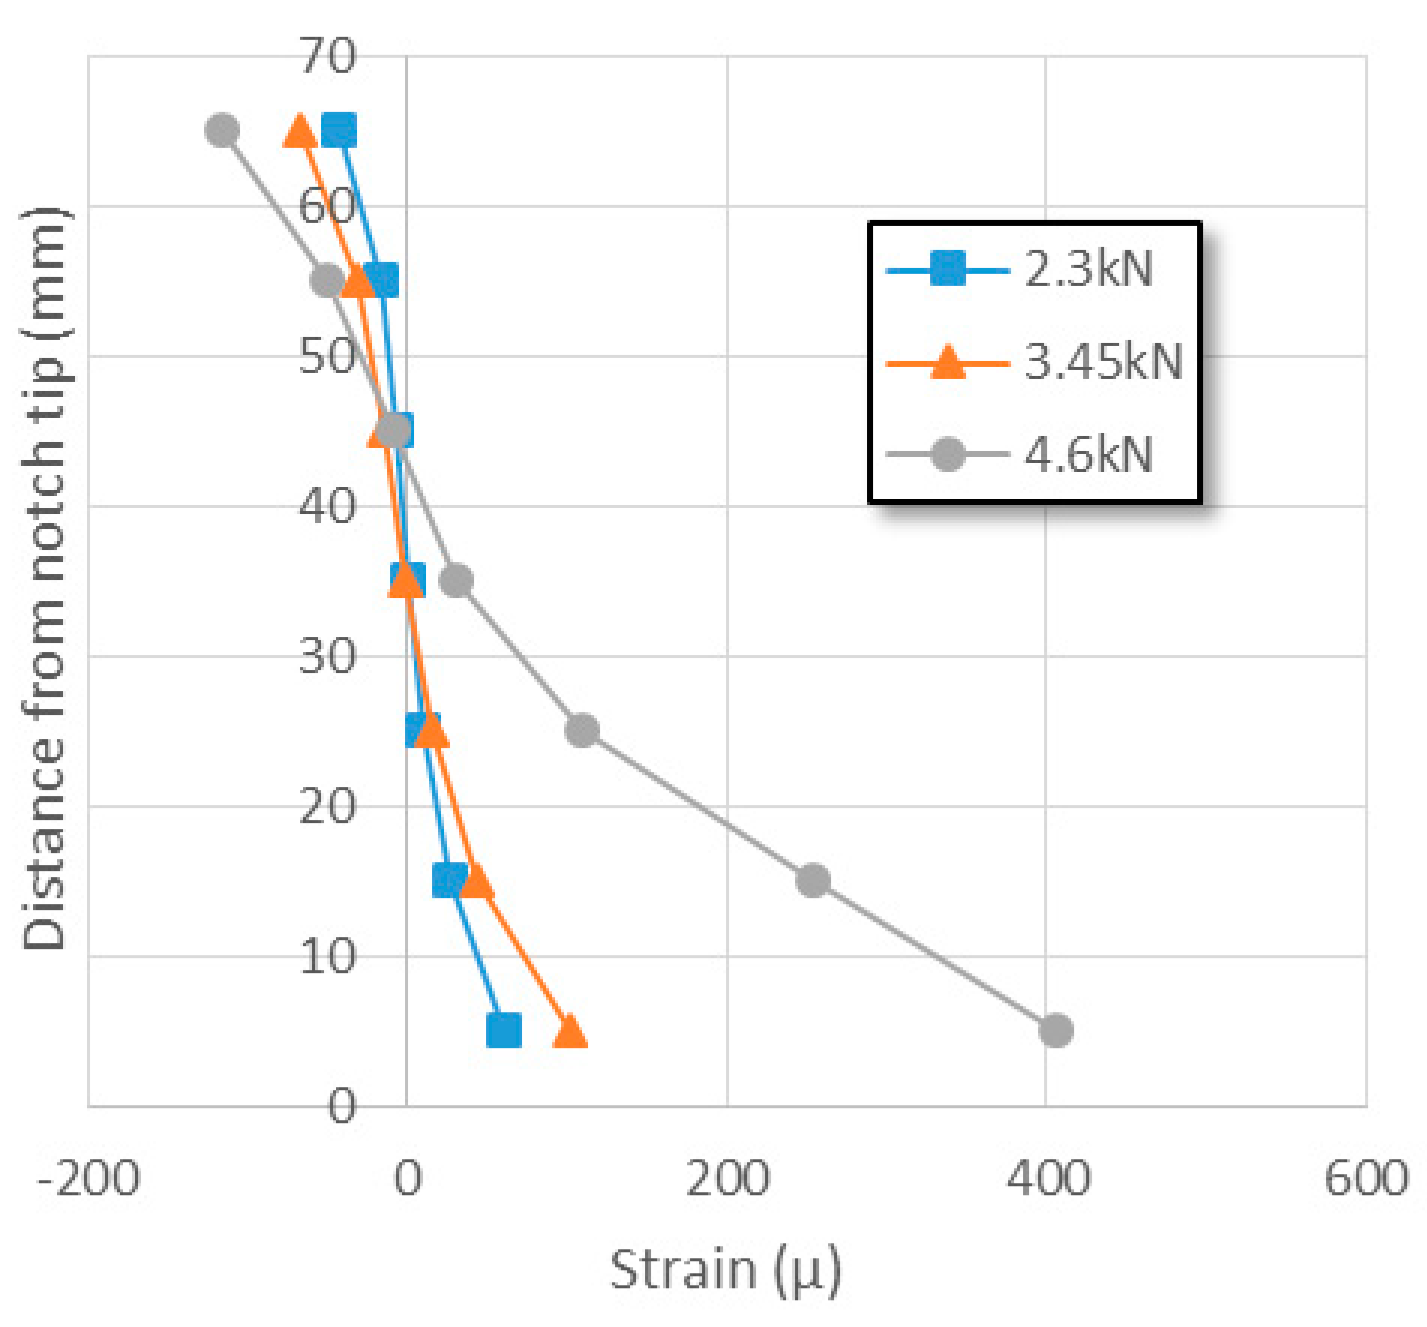
The strain distribution of the area in which crack propagation was expected to occur was investigated by the attached successive strain gauges. In the preliminary experiment, seven strain gauges were attached at intervals of 10 mm from 5 mm above the notch end, as shown in Figure 4, and the vertical strain distribution in the lower part of the load point was obtained, as shown in Figure 5. The crack induced at the end of the notch can obviously be expected to advance past this part in the three-point bending test with a notch. The strain showed a relatively linear distribution under the initial low load but it gradually changed to a nonlinear distribution with increasing load. The nonlinearity of the strain distribution may be ascribed to stress concentration due to the notch and tensile softening of the tensile part. The exact stress distribution could not be estimated directly from this strain distribution, even if the elastic modulus were to be known, because the stress–strain relationship of the tensile failure part remains unknown. However, it is known that in parts wherein the strain is zero, the stress is zero as well. In other words, the position of the neutral axis can be estimated.
The neutral axis clarifies the quantification of the healing effect. The neutral axis is probably located at the center of the cross-section at the beginning of the loading. It moves along with the crack’s propagation. In the bending test, the crack propagation is limited to the tensile side below the neutral axis. This indicates that the neutral axis explicitly indicates the area wherein self-healing is possible. Meanwhile, the neutral axis does not move without further crack propagation, so it is expected to not move in the 2nd loading conducted just after the crack inducement (1st loading). Thereafter, if this stress neutral axis changes after the healing period, such change can be ascribed to the self-healing effect as a physical recovery. The movement of the neutral axis depends on the physical recovery, and it is relatively unaffected by changes in material properties owing to the age effect.
The position of the neutral axis was estimated by seven successive strains gauges installed at intervals of 10 mm on the specimen in this study. Physical measurements at intervals less than 10 mm were not possible, and the interval selected herein seemed to be sufficient to reflect any changes in strain in the entire area. A few scattered data of the strain gauge attached underneath the loading point were detected, but the neutral area showed continuous data. The neutral axes were estimated by quadratic polynomial regression of the strain results obtained from the seven strain gauges at each point in time, as shown in Figure 6 and Table 3. As can be seen, the neutral axis moves upward the cross-section as the load increases and the crack propagates.
4. Results and Discussion
4.1. Behavior Change after Healing
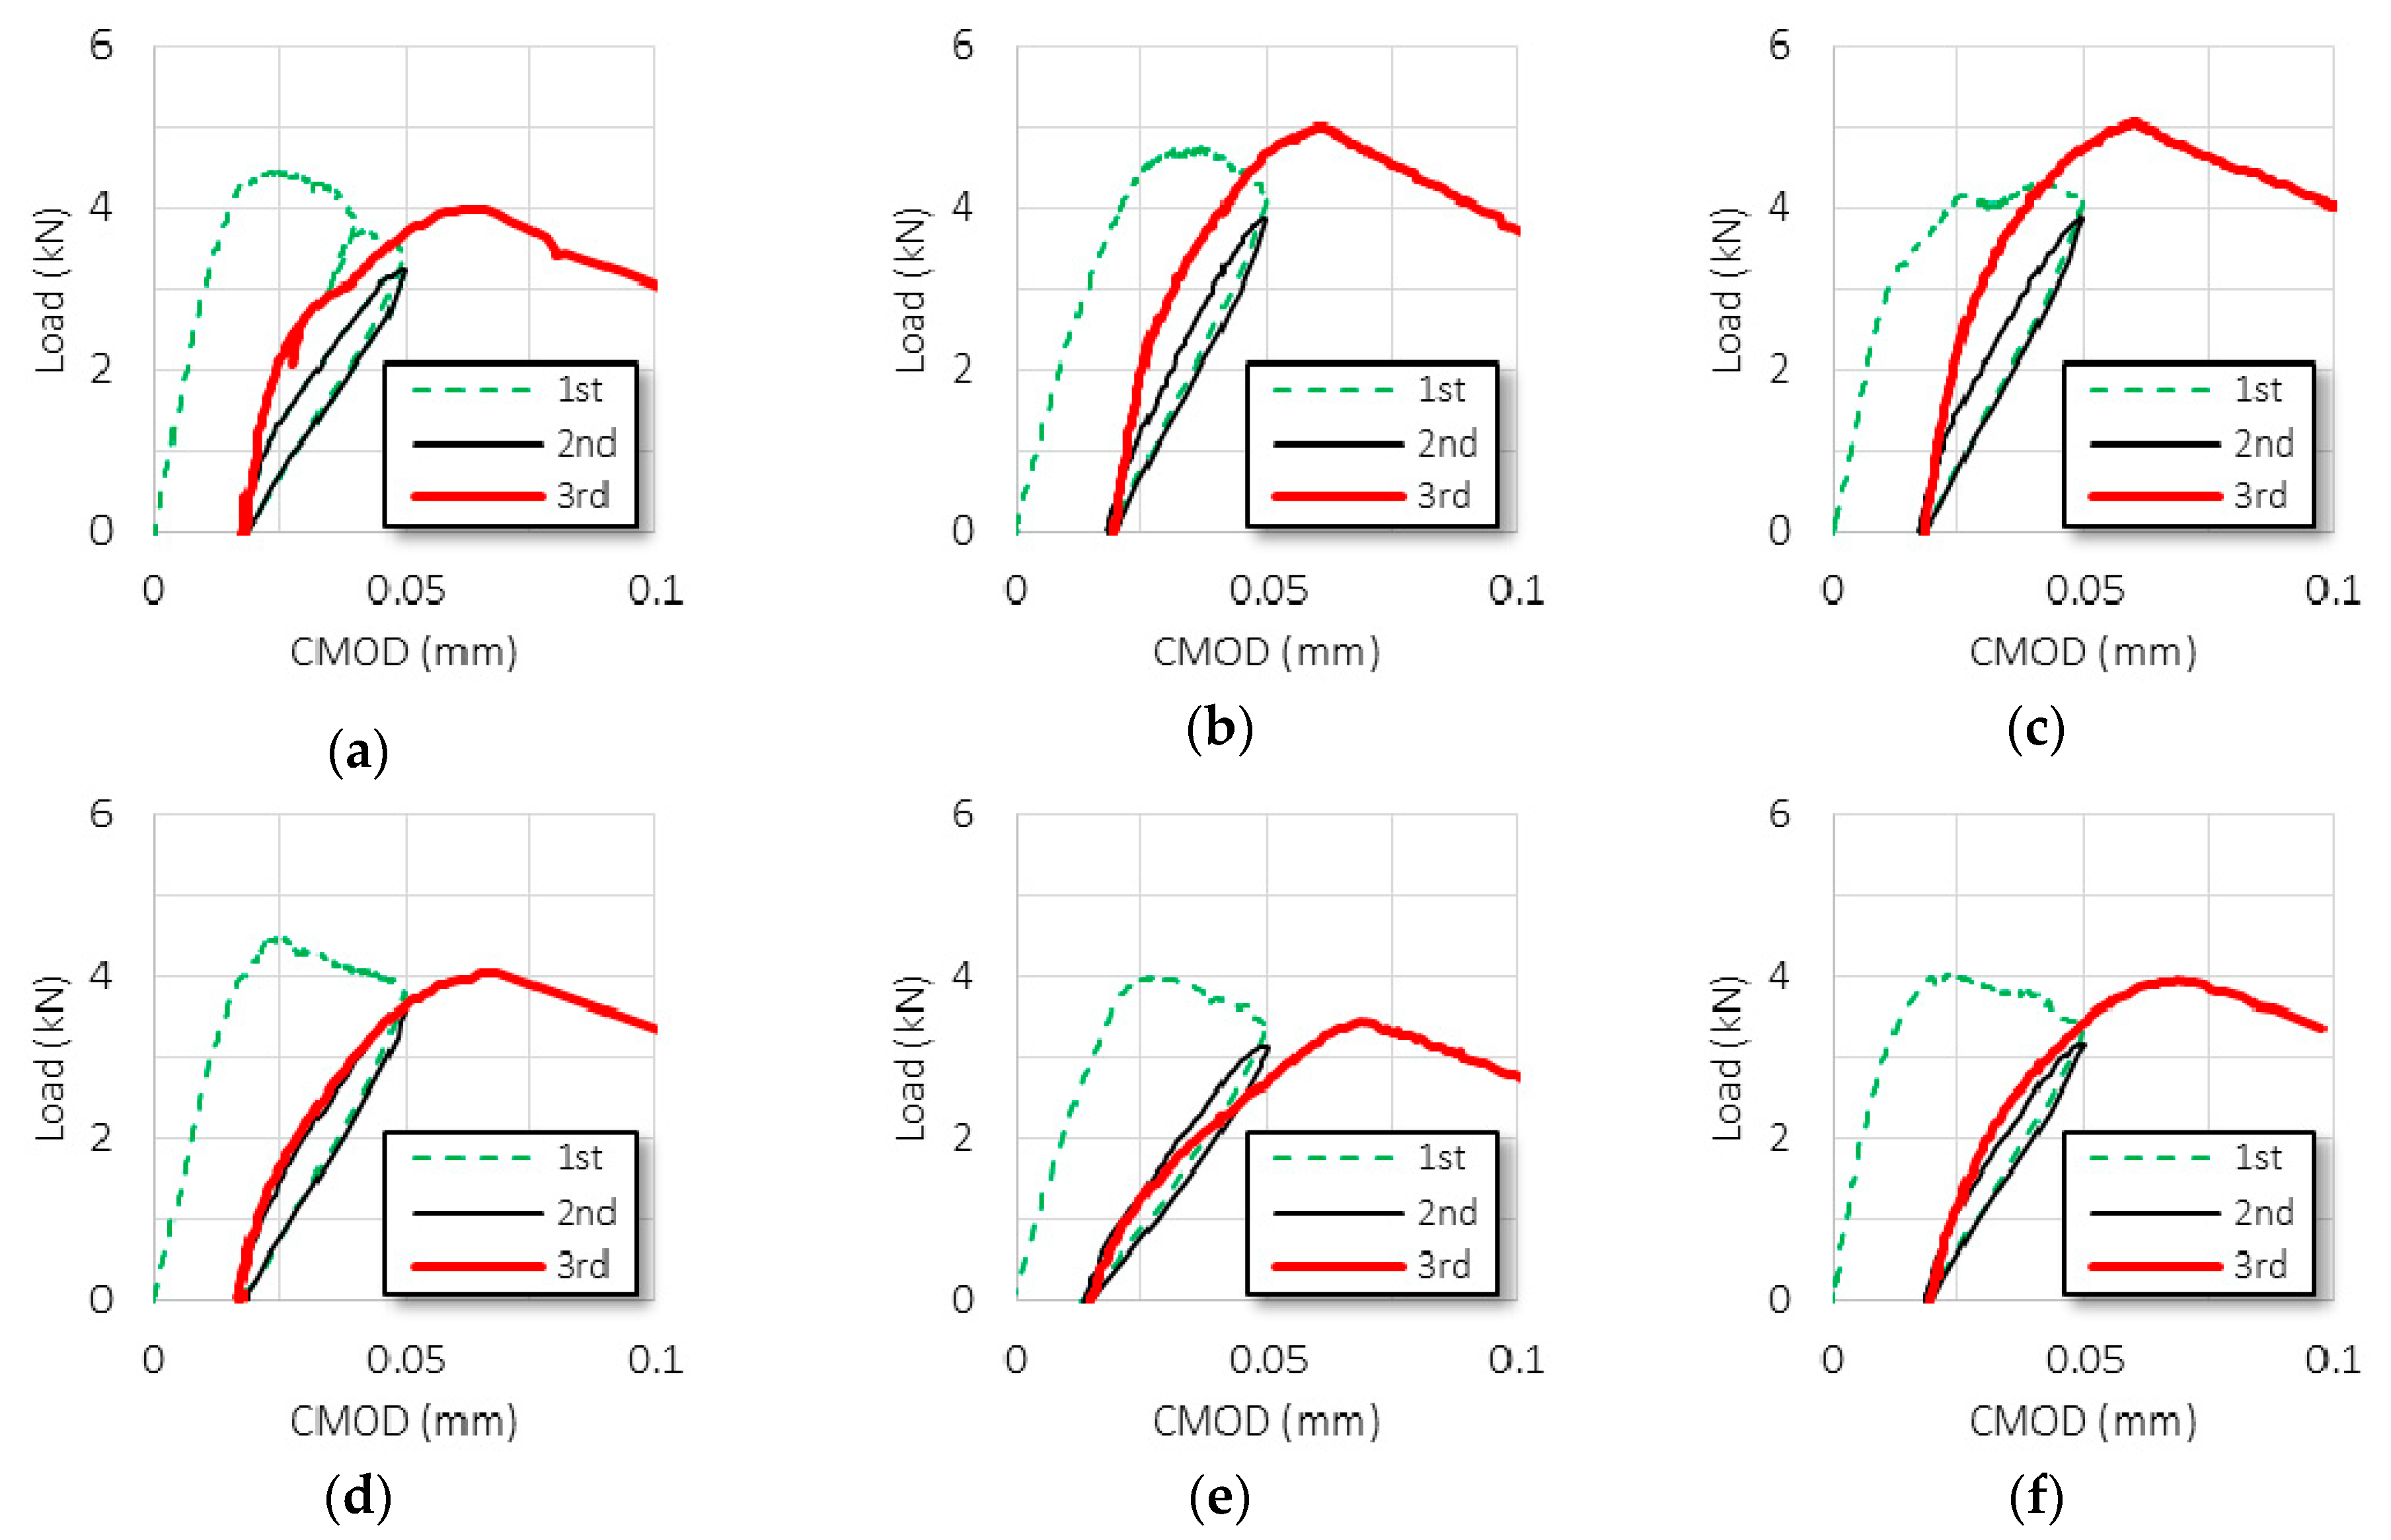
The behaviors in the 1st loading and the 2nd loading were almost equivalent, regardless of the case. Figure 7 shows the typical curves of the specimens with different healing periods, and Figure 8 shows the typical curves of the specimens with different crack inducement times. The dotted line indicates the crack inducement process, and the solid line and the thick solid line indicate the 2nd loading and the 3rd loading, respectively. The peak load increased with age, and the average peak loads were 4.5 kN on the 7th day, 4.9 kN on the 28th day, and 5.7 kN on the 49th day. The load at the unloading point increased with age as well. Therefore, the average ratio of these two values was almost similar: 0.86 on the 7th day, 0.88 on the 28th day, and 0.88 on the 49th day. These results indicate that the damage or the crack inducement due to the 1st loading was similar, regardless of age. The curves were drawn downward to the left during unloading, and the residual CMODs averaged around 0.017, regardless of the case. The 2nd loading was performed as soon as the unloading was completed, and the initial flexural stiffness of the 2nd loading was gentler (smaller) than that of the 1st loading. These two values were very different for each specimen; hence, the ratio of these two values was not constant. The 2nd loading was conducted as the CMOD reached 0.05 mm again. The maximum load of the 2nd loading was always less than the load at the unloading point, and the average ratio of these two values was 0.96, regardless of the case. The unloading curve of the 2nd loading followed the traces of the unloading curve of the 1st loading, and the residual CMOD remained almost unchanged. Table 4 shows the average values of the cases.
The behaviors associated with the 3rd loading after healing were different for each case. They could be classified into two main groups. One group of specimens seemed to be healed; the initial flexural stiffness associated with the 3rd loading was steeper than that associated with the 2nd loading, and the maximum load in case of the 3rd loading was higher than the load at the unloading point. These phenomena could be ascribed to the effect of healing. However, another group of specimens seemed to be not healed; in the cases of specimens from this group, the initial flexural stiffness was gentle, and the maximum load was low. As such, the initial flexural stiffness and the maximum load seemed to be related closely, as discussed separately in the subsequent sections.
4.2. Self-Healing Assessment Based on the Flexural Strength
The maximum load in case of the 3rd loading and the load at the unloading point of the same specimen were compared. Figure 9 shows the average ratios of cases for different healing periods: the blue square box denotes the results of the specimens cured in water, and the red triangle denotes the results of the specimens cured in air. As the figure indicates, all ratios are more than 1.0, which means the maximum load in case of the 3rd loading was higher than the load at the unloading point. This phenomenon in which the peak load of the 3rd loading after the healing process is higher than the previous peak load has been reported in previous studies [23,36]. The average ratio appears to increase as the age increases, but it does not increase considerably.
The loads of the 3rd loading and the 2nd loading at CMOD = 0.05 mm of the same specimen were compared. The maximum load of the 3rd loading must be accompanied by the age effect because it involves the uncracked part as well. To exclude the age effect to the extent as much as possible, the loads under the same damage conditions must be compared. Figure 10 shows the average ratios of the 2nd loading and the 3rd loading, and these load values were obtained when CMOD was 0.05 mm. In this comparison, the increasing trend was more evident when the aging period was longer, especially in the case of a specimen cured in air. However, the ratios of the cases 7-28-A and 2-49-A show values than lower 1.0; the maximum load after healing in air was lower than the load at the unloading point.
Figure 11 shows the average ratios of the maximum load of the 3rd loading and the load at the unloading point with different crack inducement times. As can be seen, the ratios decrease as the crack inducement time increases, regardless of the curing condition. However, the average ratios of the 3rd loading and the 2nd loading at CMOD = 0.05 mm do not show any significant decrease trend, as in Figure 12.
Compared to the results in Figure 9 and Figure 11, the results in Figure 10 and Figure 12 show more clearly the changes in the healing conditions and periods. A clearer difference is thought to be due to comparing flexural strength under certain conditions as the same CMOD, which is different from similar previous studies [23,36]. Three-point bending test with a notch is considered to be more advantageous in controlling comparative conditions than experiments of other criteria such as permeability or chloride transport [32,41,42,43].
4.3. Self-Healing Assessment Based on Initial Flexural Stiffness
A comparison of the initial flexural stiffness between the 2nd loading and the 3rd loading directly and quantitatively showed the changes before and after healing. The reloading after the crack inducement process degraded the performance of the specimen, even if the crack did not propagate further, because the microcracking zone accumulated damage and gradually turned into a bridging zone. Both the maximum strength and the initial flexural stiffness in case of the 2nd loading decreased slightly as a result of this damage accumulation. These two parameters varied depending on the healing period and the crack inducement time, and the self-healing assessment was quantified by comparing the degree of variation. As described above, the maximum strength clearly reflects not only the healing effect but also the age effect, so only the initial flexural stiffness was compared. The ratio of the slope of the 3rd loading to the slope of the 2nd loading could be expected to be greater than 1.0 if there was a positive effect during the healing period. A value less than or equal to 1.0 means that there was no positive effect, not even the age effect. This value was considered to represent the healing effect in this study and used as a quantitative marker in self-healing assessments.
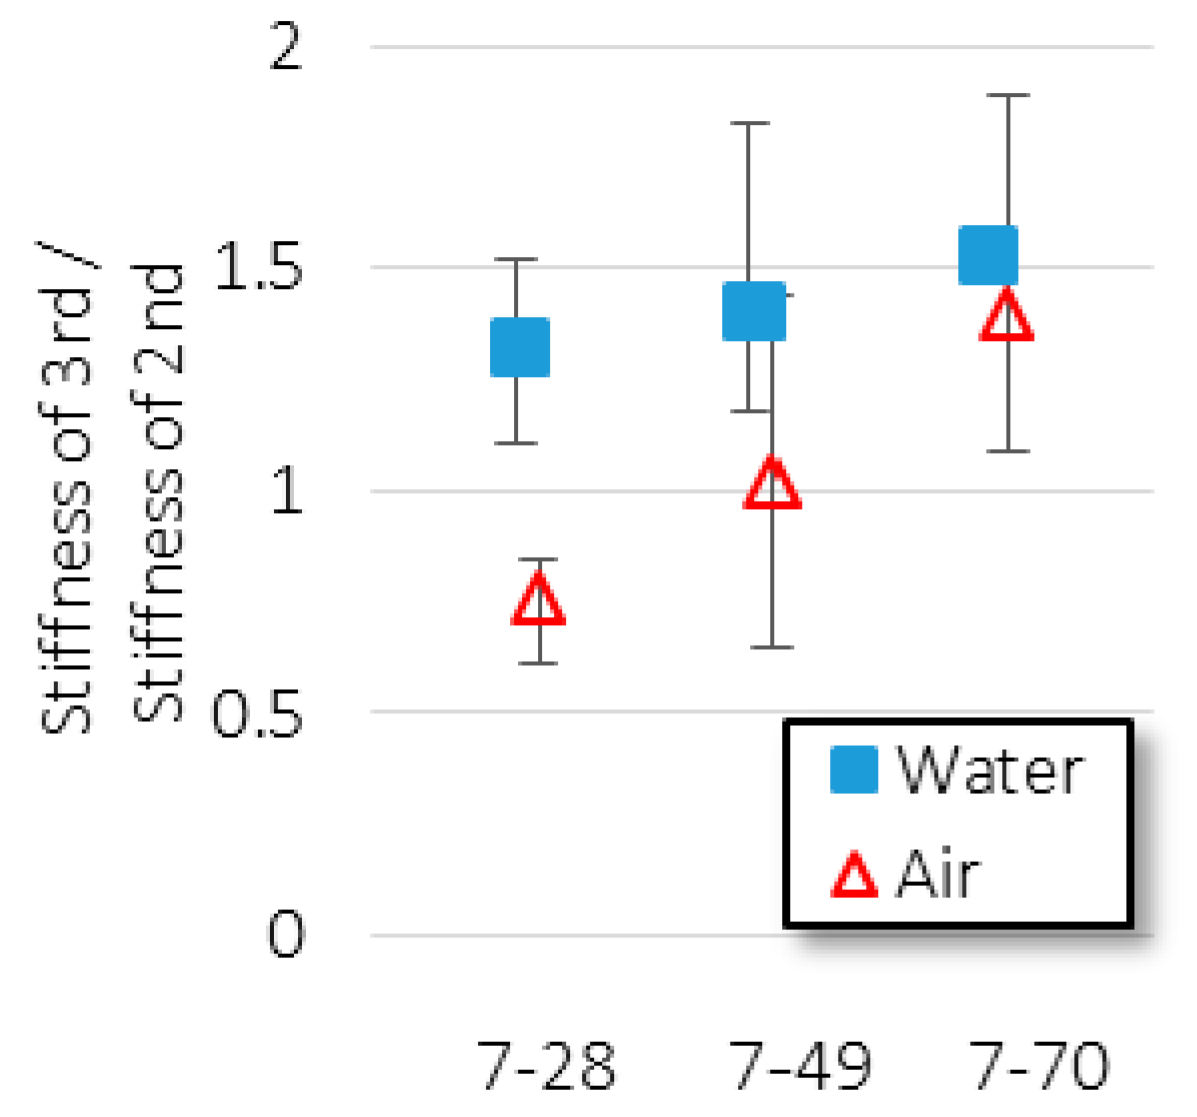
The initial flexural stiffness in case of the 3rd loading increased as the length of the healing period increased. For curing in freshwater, in Cases 7-28-W, 7-49-W, and 7-70-W, it can be seen that all the initial flexural stiffness values in case of the 3rd loading are steeper than those in case of the 2nd loading, as shown in Figure 7a–c; these results represent a positive effect. However, in Cases 7-28-A and 7-49-A, with healing in air, the slope in case of the 3rd loading decreases. Only in Case 7-70-A, in which the specimen was healed for 63 days, a positive effect was observed. This finding is similar to the results of Granger et al. [36], but a direct comparison of the same specimen before and after the healing makes our results more concrete. This is evident from the quantitative comparison of the slopes, as shown in Figure 13. Although there are deviations, the average healing effect increased with increasing healing time, especially the healing effect was greater than 1.0 in the cases of all specimens cured in water. The healing effect in case of the specimens cured in air was lower than 1.0 for 21 days of healing period (7-28), but it increased remarkably and reached a level similar to that of the specimens cured in water for 63 days (7–70). These results indicate that the healing effect depends on the healing period, regardless of the healing circumstance.
The initial flexural stiffness in case of the 3rd loading decreased with delayed crack inducement time. The curve of Case 7-28-W shows a positive effect, but the curves of Cases 28-49-W and 49-70-W are below the 2nd loading curve despite the fact that the specimens were cured in water. Furthermore, all specimens cured in air showed no positive effect, i.e., the 3rd loading curves are below the 2nd loading curves. Figure 14 shows the quantitative changes according to the crack inducement time. Despite curing in water, the healing effect decreased significantly as the crack inducement time was delayed. A more unexpected phenomenon can be seen in the results of specimens cured in air; all average healing effects with different crack inducement times were almost the same and less than 1.0. These results indicate that the healing effect is strongly influenced by the crack inducement time and the curing circumstance if the healing period is constant.
The results of the flexural strength comparison and the initial flexural stiffness comparison are similar if we look at the results themselves. However, considering that healing occurs primarily around the end of a crack in self-healing of concrete, it is deemed more reasonable to compare the stiffness of the moment when the healed crack is reopened than to compare the strength, which is the total ability of the specimen. Both the flexural strength and the initial flexural stiffness healed to a greater extent in case of the specimens cured in water. Regardless of the healing period and the crack inducement time, the healing effects were stronger in cases of the specimens cured in water compared to those in cases of the specimens cured in air. Although in a few cases it was observed that the specimens cured in air could be healed if the healing period was sufficiently long, the water condition was better for the self-healing of concrete. The healing tendency according to the healing condition is consistent with the results of many other studies [14,15,16,17,18,19,20,21,22,23,24,25,26,27,28,29,30,31,32,33,36,37,41,43]. It is a reasonable fact that the underwater environment is advantageous for self-healing of concrete. Importantly, these results were similar when obtained in the environment of the hydration reaction. The hydration reaction is time-dependent, and the longer the reaction time, the more effective is the reaction. However, the strength of the reaction decreases noticeably over time after casting. The results of the healing effects obtained in this study and those of the hydration reaction share a few commonalities. Consequently, the healing effect observed in this study can be said to be highly related to the re-hydration reaction, which is one of the two major mechanisms of self-healing of concrete.
4.4. Crack Depths and Neutral Axises
The real crack depth with CMOD = 0.05 mm was observed to be about 20 mm. It was observed by means of an ink injection after the crack inducement, and several surplus specimens of seven days of age were used for this purpose because the largest number of specimens was prepared for the seven cases. A cellophane adhesive tape was attached to both sides of the specimens to prevent ink leakage, and red ink was injected from the notch. Next, after sufficient time provision for ink injection and drying (24 h), reloading was applied to split the specimens. Figure 15 shows the cracked area stained by red ink injection. The crack depth was calculated by dividing the area stained with red ink by the specimen width, and the average crack depth of the specimens of seven days of age was about 20 mm. Five additional specimens of 28 days of age showed a crack depth of about 20 mm as well, although the deviation in their crack depths was larger than that in case of the seven-day-old specimens.
Meanwhile, the neutral axis ascended to about 44 mm. Figure 16 shows the change in the position of the neutral axis with changes in the CMOD. The neutral axis was estimated from seven strains measured by successive strain gauges, so slight scattering can be seen at the beginning of load introduction. Initially, the neutral axis was located at about 33 mm from the notch tip, which corresponds to the center of the un-notched section. It moved upward gradually with increasing CMOD and was located at 40–50 mm at CMOD = 0.05 mm. It changed insignificantly during the unloading process, but in the case of a few specimens, the neutral axis moved slightly upward. There was a minor difference among each of the specimens, and the differences in the position of the neutral axis when fully unloaded averaged 44 mm. The movement of the neutral axis in the 2nd loading almost followed the trail of the unloading, and it could not be distinguished. This result confirms that the 2nd loading did not induce additional crack propagation.
Accordingly, there was a difference of about 24 mm between the neutral axis and the actual crack depth when CMOD = 0.05 mm. Nanakorn and Horii mentioned that the fracture process zone of concrete comprises the microcracking zone and the bridging zone [44]. In the microcracking zone, the concentrated stress near the crack tip causes the existing defects and pores to expand. Moreover, the interface between aggregates and the cement matrix is weakened, and the two components began to separate. These deteriorations develop into the bridging zone, and the stress in this area starts to dissipate. This stress dissipation in the bridging zone is expressed as the tension-softening relationship of concrete. A fully separated section is considered a stress-free crack. The stress-free crack area was obviously stained with the injected red ink, and a portion of the bridging zone was also likely stained. Consequently, it can be expected that the microcracking zone and the bridging zone are located at about 24 mm between the neutral axis and the actual crack depth, as shown in Figure 17.
The neutral axis of the 3rd loading followed the neutral axis trace of the 2nd loading almost equally, regardless of the case. Figure 18 shows the typical stress-neutral axis curves of the specimens with different healing periods, and Figure 19 shows the typical stress-neutral axis curves of the specimens with different crack inducement times. Compare to Case 7-70-W (Figure 18c) and Case 49-70-A (Figure 19f), which are the strongest and the weakest healing effects in terms of the flexural strength and the initial flexural stiffness. As can be seen, the changes in the neutral axis in both cases are almost the same as that in the case of the 2nd loading until CMOD = 0.05 mm. Similar results were obtained in all other cases as well. This means there was no physical recovery to the extent that the neutral axis changed. In order words, in all cases, the cracks once opened were never reattached, even over a long healing period.
Consequently, the healing effect seems to have occurred between the neutral axis and the opened crack area, as opposed to over the opened crack area. In the introduction, we expected that recovery would occur through self-healing, as shown in Figure 20b. However, in practice, a certain area from the crack tip is closed, and this part is attached again, which restores the stiffness of the specimen. As a result, the neutral axis must move downward. However, the neutral axis shows no sign of movement, which means stiffness recovery did not occur in the once-opened cracked part. The initial flexural stiffness increased or decreased depending on the healing condition, and it can be stated confidently that this phenomenon depended on the area between the neutral axis and the crack tip, as opposed to the opened crack part, as shown in Figure 20c. In other words, the healing effect was limited to the fracture process zone, and the once-opened crack area did not recover physically.
The changes in the neutral axis can explain the dependence on the re-hydration reaction. Contrary to expectations outlined in the introduction, the neutral axis of the 3rd loading did not show any signs of healing in the once-opened crack area, and this indicated that physical recovery did not occur. The precipitation of calcium hydroxide, which is another of the two major mechanisms of self-healing and can be expected to occur in the opened crack area, was not helpful for restoring the physical properties of the opened crack area.
5. Conclusions
In this study, the three-point bending test with a notch was performed for assessing the self-healing of concrete, and the neutral axis was estimated to investigate the curable area by self-healing. Our results are as follows:
- (1)
- Within the scope of this study, the longer the healing period, the higher the healing effect. In the same healing period (21-day), the later the crack was induced, the less effective the healing effect was. These results are generally consistent with previous studies.
- (2)
- The method for estimating the neutral axis using successive strain gauges attached to the crack propagation part was proposed in this study. The estimated neutral axis showed proper behavior in comparison with Load-CMOD curve; the neutral axis moved slightly upward with crack propagation, but there was an insignificant move when the crack was closed or reopened.
- (3)
- Recovery of the flexural strength and the initial flexural stiffness before and after healing was confirmed, but no major fluctuations in the neutral axis were confirmed. Consequently, the curable area appears to be limited to the area between the neutral axis and the crack tip, as opposed to over the opened crack area.
The conclusions were judged to be valid within the scope of this study. We noted that all results in this study show a certain trend while data is statistically insufficient. It is considered that further experiments will produce more significant results.
Author Contributions
conceptualization, C.K. and T.K.; methodology, T.K.; software, C.K.; validation, C.K. and T.K.; formal analysis, C.K.; investigation, T.K.; writing—original draft preparation, C.K.; writing—review and editing, T.K.; visualization, T.K.; supervision, T.K.; project administration, C.K.; funding acquisition, C.K.
Funding
This research was funded by the Basic Science Research Program through the National Research Foundation of Korea(NRF) funded by the Ministry of Education, grant number NRF-2017R1D1A1B03034470.
Conflicts of Interest
The funders had no role in the design of the study; in the collection, analyses, or interpretation of data; in the writing of the manuscript, and in the decision to publish the results.
References
- Aguado, A.; Gettu, R.; Shah, S. Concrete technology: New trends, industrial applications. In Proceedings of the International RILEM Workshop; CRC Press: Boca Raton, FL, USA, 1994. [Google Scholar]
- Zhang, L.X.B.; Hsu, T.T. Behavior and analysis of 100 MPa concrete membrane elements. J. Struct. Eng. 1998, 124, 24–34. [Google Scholar] [CrossRef]
- Aïtcin, P.C. High Performance Concrete; CRC Press: Boca Raton, FL, USA, 2011. [Google Scholar]
- Kim, C.S.; Park, H.G.; Chung, K.S.; Choi, I.R. Eccentric axial load testing for concrete-encased steel columns using 800 MPa steel and 100 MPa concrete. J. Struct. Eng. 2011, 138, 1019–1031. [Google Scholar] [CrossRef]
- Caldarone, M.A.; Gruber, K.A.; Burg, R.G. High reactivity metakaolin (HRM): A new generation mineral admixture for high performance concrete. Concr. Int. 1994, 16, 37–41. [Google Scholar]
- Hassan, K.E.; Cabrera, J.G.; Maliehe, R.S. The effect of mineral admixtures on the properties of high-performance concrete. Cem. Concr. Compos. 2000, 22, 267–271. [Google Scholar] [CrossRef]
- Poon, C.S.; Kou, S.C.; Lam, L. Compressive strength, chloride diffusivity and pore structure of high performance metakaolin and silica fume concrete. Constr. Build. Mater. 2006, 20, 858–865. [Google Scholar] [CrossRef]
- Shi, H.S.; Xu, B.W.; Zhou, X.C. Influence of mineral admixtures on compressive strength, gas permeability and carbonation of high performance concrete. Constr. Build. Mater. 2009, 23, 1980–1985. [Google Scholar] [CrossRef]
- Barbudo, A.; de Brito, J.; Evangelista, L.; Bravo, M.; Agrela, F. Influence of water-reducing admixtures on the mechanical performance of recycled concrete. J. Clean. Prod. 2013, 59, 93–98. [Google Scholar] [CrossRef]
- Frangopol, D.M.; Lin, K.Y.; Estes, A.C. Life-cycle cost design of deteriorating structures. J. Struct. Eng. 1997, 123, 1390–1401. [Google Scholar] [CrossRef]
- Frangopol, D.M.; Liu, M. Maintenance and management of civil infrastructure based on condition, safety, optimization, and life-cycle cost. Struct. Infrastruct. Eng. 2007, 3, 29–41. [Google Scholar] [CrossRef]
- Kim, K.W.; Yun, S.H. A case study of life cycle cost analysis on apartment houses and Han-Ok. J. Korea Inst. Build. Constr. 2010, 10, 1–6. [Google Scholar] [CrossRef]
- Guggemos, A.A.; Horvath, A. Comparison of environmental effects of steel-and concrete-framed buildings. J. Infrastruct. Syst. 2005, 11, 93–101. [Google Scholar] [CrossRef]
- White, S.R.; Sottos, N.R.; Geubelle, P.H.; Moore, J.S.; Kessler, M.R.; Sriram, S.R. Autonomic healing of polymer composites. Nature 2001, 409, 794. [Google Scholar] [CrossRef]
- Brown, E.N.; Sottos, N.R.; White, S.R. Fracture testing of a self-healing polymer composite. Exp. Mech. 2002, 42, 372–379. [Google Scholar] [CrossRef] [Green Version]
- Mookhoek, S.D.; Blaiszik, B.J.; Fischer, H.R.; Sottos, N.R.; White, S.R.; Van Der Zwaag, S. Peripherally decorated binary microcapsules containing two liquids. J. Mater. Chem. 2008, 18, 5390–5394. [Google Scholar] [CrossRef]
- Dry, C. Three design for the internal release of sealants, adhesives and waterproofing chemical into concrete to release. Cem. Concr. Res. 2000, 30, 1969–1977. [Google Scholar] [CrossRef]
- Joseph, C.; Jefferson, A.D.; and Cantoni, M.B. Issues relating to the autonomic healing of cementitious materials. In Proceedings of the 1st International Conference on Self-Healing Materials, Noordwijk aan Zee, The Netherlands, 18–20 April 2007; pp. 1–8. [Google Scholar]
- Joseph, C.; Jefferson, A.D.; Isaacs, B.; Lark, R.; Gardner, D. Experimental investigation of adhesive-based self-healing of cementitious materials. Mag. Concr. Res. 2010, 62, 831–843. [Google Scholar] [CrossRef] [Green Version]
- Sun, L.; Yu, W.Y.; Ge, Q. Experimental research on the self-healing performance of micro-cracks in concrete bridge. Adv. Mater. Res. 2011, 250, 28–32. [Google Scholar] [CrossRef]
- van Breugel, K. Is there a market for self-healing cement based materials? In Proceedings of the 1st International Conference on Self Healing Materials, Noordwijk aan Zee, The Netherlands, 18–20 April 2007; pp. 1–9. [Google Scholar]
- van Breugel, K. Self-healing en vloeistofdichtheid. Cement 2003, 7, 85–89. [Google Scholar]
- Schlangen, E.; Heide, N.; van Breugel, K. Crack healing of early age cracks in concrete. In Measuring, Monitoring and Modeling Concrete Properties; Konsta-Gdoutos, M.S., Ed.; Springer: Dordrecht, The Netherlands, 2006; pp. 273–284. [Google Scholar]
- Kim, W.J.; Kim, S.T.; Park, S.J.; Ghim, S.Y.; Chun, W.Y. A study on the development of self-healing smart concrete using microbial biomineralization. J. Korea Concr. Inst. 2009, 21, 501–511. [Google Scholar] [CrossRef]
- Li, V.C.; Stang, H.; Krenchel, H. Micromechanics of crack bridging in fibre-reinforced concrete. Mater. Struct. 1993, 26, 486–494. [Google Scholar] [CrossRef]
- Stang, H.; Li, V.C.; Krenchel, H. Design and structural applications of stress-crack width relations in fibre reinforced concrete. Mater. Struct. 1995, 28, 210–219. [Google Scholar] [CrossRef]
- Kunieda, M.; Choonghyun, K.; Ueda, N.; Nakamura, H. Recovery of protective performance of cracked ultra high performance-strain hardening cementitious composites (UHP-SHCC) due to autogenous healing. J. Adv. Concr. Technol. 2012, 10, 313–322. [Google Scholar] [CrossRef]
- Williams, G.; Trask, R.; Bond, I. A self-healing carbon fibre reinforced polymer for aerospace applications. Compos. Part A Appl. Sci. Manuf. 2007, 38, 1525–1532. [Google Scholar] [CrossRef]
- Homma, D.; Mihashi, H.; Nishiwaki, T. Self-healing capability of fiber reinforced cementitious composites. J. Adv. Concr. Technol. 2009, 7, 217–228. [Google Scholar] [CrossRef]
- Hosoda, A.; Kishi, T.; Arita, H.; Takakuwa, Y. Self healing of crack and water permeability of expansive concrete. In Proceedings of the 1st International Conference on Self Healing Materials, Noordwijk aan Zee, The Netherlands, 18–20 April 2007. [Google Scholar]
- Jacobsen, S.; Sellevold, E.J. Self healing of high strength concrete after deterioration by freeze/thaw. Cem. Concr. Res. 1996, 26, 56–62. [Google Scholar] [CrossRef]
- Jacobsen, S.; Marchand, J.; Boisvert, L. Effect of cracking and heating on chloride transport in OPC concrete. Cem. Concr. Res. 1996, 26, 869–881. [Google Scholar] [CrossRef]
- Wang, G.; Guo, Z.Q.; Yu, J.; Shui, Z. Effect of self-healing materials on steel reinforcement corrosion of concrete. In Proceedings of the First International Conference on Self Healing Materials, Noordwijk aan Zee, The Netherlands, 18–20 April 2007. [Google Scholar]
- Barr, B.I.; Lee, M.K.; de Place Hansen, E.J.; Dupont, D.; Erdem, E.; Schaerlaekens, S.; Schnütgen, B.; Stang, H.; Vandewalle, L. Round-robin analysis of the RILEM TC 162-TDF beam bending test: Part 3—Fibre distribution. Mater. Struct. Mat. Constr. 2003, 36, 631–635. [Google Scholar] [CrossRef]
- JCI-S-001 Method of Test for Fracture Energy of Concrete by Use of Notched Beam; JCI Standards for Test of FRC; Japan Concrete Institute: Tokyo, Japan, 2003; pp. 1–13.
- Granger, S.; Loukili, A.; Pijaudier-Cabot, G.; Chanvillard, G. Experimental characterization of the self-healing of cracks in an ultra high performance cementitious material, Mechanical test and acoustic emission analysis. Cem. Concr. Res. 2007, 37, 519–527. [Google Scholar] [CrossRef]
- Matsushita, H.; Sue, Y.; Kiyosaki, R. A study of the strength recovery of mortar with an initiated crack. Proc/JCI 2003, 25, 605–610. [Google Scholar]
- TC162-TDF, RILEM. Test and design methods for steel fibre reinforced concrete: Bending test. Mater. Struct. 2000, 33, 3–5. [Google Scholar] [CrossRef]
- Jenq, Y.; Shah, S.P. Two parameter fracture model for concrete. J. Eng. Mech. 1985, 111, 1227–1241. [Google Scholar] [CrossRef]
- Shah, S.P. Determination of fracture parameters (KIcs and CTODc) of plain concrete using three-point bend tests. Mater. Struct. 1990, 23, 457–460. [Google Scholar] [CrossRef]
- Reinhardt, H.W.; Joosss, M. Permeability and self-healing of cracked concrete as a function of temperature and crack width. Cem. Concr. Res. 2003, 33, 981–985. [Google Scholar] [CrossRef]
- Edvardsen, C. Water permeability and autogenous healing of cracks in concrete. Mater. J. 1999, 96, 448–454. [Google Scholar]
- Yamada, K. Crack self healing properties of expansive concretes with various cements and admixture. In Proceedings of the 1st International Conference on Self Healing Materials, Noordwijk, The Netherlands, 18–20 April 2007. [Google Scholar]
- Nanakorn, P.; Horii, H. A finite element with embedded displacement discontinuity. Build. 21st Century 1995, 1, 33–38. [Google Scholar]
Figure 1.
Schematic of the experimental setup.

Figure 2.
Typical Load-CMOD (crack mouth opening displacement) curves (Case: 7-28-A).

Figure 3.
Initial flexural stiffness of the 2nd and 3rd loading.

Figure 4.
Seven strain gauges for investigation of the vertical strain distribution.

Figure 5.
Strain distribution with different loads.

Figure 6.
Estimation of a neutral axis.

Figure 7.
Typical load-CMOD curves for different healing periods: (a) 7-28W; (b) 7-49W; (c) 7-70W; (d) 7-28A; (e) 7-49A; (f) 7-70A.
Figure 7.
Typical load-CMOD curves for different healing periods: (a) 7-28W; (b) 7-49W; (c) 7-70W; (d) 7-28A; (e) 7-49A; (f) 7-70A.

Figure 8.
Typical load-CMOD curves for different crack inducement times: (a) 7-28W; (b) 28-49W; (c) 49-70W; (d) 7-28A; (e) 28-49A; (f) 49-70A.
Figure 8.
Typical load-CMOD curves for different crack inducement times: (a) 7-28W; (b) 28-49W; (c) 49-70W; (d) 7-28A; (e) 28-49A; (f) 49-70A.

Figure 9.
Ratios between the maximum load in the case of 3rd loading and unloading load in case of 1st loading (different healing periods).
Figure 9.
Ratios between the maximum load in the case of 3rd loading and unloading load in case of 1st loading (different healing periods).

Figure 10.
Ratios between the load of the 3rd loading and the load of the 2nd loading with CMOD = 0.05 mm (different healing periods).
Figure 10.
Ratios between the load of the 3rd loading and the load of the 2nd loading with CMOD = 0.05 mm (different healing periods).

Figure 11.
Ratios between the maximum load of the 3rd loading and the unloading load of the 1st loading (different crack inducement times).
Figure 11.
Ratios between the maximum load of the 3rd loading and the unloading load of the 1st loading (different crack inducement times).

Figure 12.
Ratios between load of 3rd loading and load of 2nd loading with CMOD = 0.05 mm (different crack inducement time).
Figure 12.
Ratios between load of 3rd loading and load of 2nd loading with CMOD = 0.05 mm (different crack inducement time).

Figure 13.
Ratios between flexural stiffness of 3rd loading and that of 2nd loading (different healing periods).
Figure 13.
Ratios between flexural stiffness of 3rd loading and that of 2nd loading (different healing periods).

Figure 14.
Ratios between flexural stiffness of 3rd loading and that of 2nd loading (different crack inducement times).
Figure 14.
Ratios between flexural stiffness of 3rd loading and that of 2nd loading (different crack inducement times).

Figure 15.
Investigation of crack depth by ink injection. (a) Stained crack part; (b) measured crack depth.
Figure 15.
Investigation of crack depth by ink injection. (a) Stained crack part; (b) measured crack depth.

Figure 16.
The behavior of the neutral axis with CMOD.

Figure 17.
The concept of actual crack depth and neutral axis.

Figure 18.
Typical stress neutral axis-CMOD curves for different healing periods. (a) 7-28W; (b) 7-49W; (c) 7-70W; (d) 7-28A; (e) 7-49A; (f) 7-70A.
Figure 18.
Typical stress neutral axis-CMOD curves for different healing periods. (a) 7-28W; (b) 7-49W; (c) 7-70W; (d) 7-28A; (e) 7-49A; (f) 7-70A.

Figure 19.
Typical stress neutral axis-CMOD curves for different crack inducement times. (a) 7-28W; (b) 28-49W; (c) 49-70W; (d) 7-28A; (e) 28-49A; (f) 49-70A.
Figure 19.
Typical stress neutral axis-CMOD curves for different crack inducement times. (a) 7-28W; (b) 28-49W; (c) 49-70W; (d) 7-28A; (e) 28-49A; (f) 49-70A.

Figure 20.
Schematic of neutral axis movement before and after healing. (a) Unloaded state; (b) assumed neutral axis movement; (c) measured result.
Figure 20.
Schematic of neutral axis movement before and after healing. (a) Unloaded state; (b) assumed neutral axis movement; (c) measured result.


Table 1.
Mixing proportions of the specimen.
| W/C (%) | Unit Content (kg/m3) | |||
|---|---|---|---|---|
| Water | Cement | Sand | Gravel | |
| 45 | 175 | 389 | 780 | 879 |
Table 2.
Test program.
| Case | Condition | Days after Casting | ||||||
|---|---|---|---|---|---|---|---|---|
| 7 | 28 | 49 | 70 | |||||
| 7-28 | Water | 1st loading 2nd loading | healing ▶▶▶▶ | 3rd loading | ||||
| Air | ||||||||
| 7-49 | Water | 1st loading 2nd loading | healing ▶▶▶▶ | 3rd loading | ||||
| Air | ||||||||
| 7-70 | Water | 1st loading 2nd loading | healing ▶▶▶▶ | 3rd loading | ||||
| Air | ||||||||
| 28-49 | Water | 1st loading 2nd loading | healing ▶▶▶▶ | 3rd loading | ||||
| Air | ||||||||
| 49-70 | Water | 1st loading 2nd loading | healing ▶▶▶▶ | 3rd loading | ||||
| Air | ||||||||
Table 3.
Estimated neutral axis with different load level.
| CMOD (mm) | 0.005 | 0.026 | 0.034 | |
|---|---|---|---|---|
| Load (kN) | 1.70 | 4.53 | 4.55 | |
| Measured strain (μ) | 5 mm | 43.6 | 330.8 | 518.5 |
| 15 mm | 19.0 | 153.4 | 284.1 | |
| 25 mm | 8.5 | 76.8 | 166.8 | |
| 35 mm | 0.9 | 18.0 | 66.9 | |
| 45 mm | −5.7 | −15.2 | 1.0 | |
| 55 mm | −11.4 | −50.2 | −51.2 | |
| 65 mm | −29.4 | −111.8 | −125.1 | |
| Neutral axis | 36.3 | 40.9 | 45.5 | |
Table 4.
Average load and ratio.
| Case | 7-28 | 7-49 | 7-70 | 28-49 | 49-70 | |||||
|---|---|---|---|---|---|---|---|---|---|---|
| Healing condition | Water | Air | Water | Air | Water | Air | Water | Air | Water | Air |
| ⓐ Peak load of 1st loading | 4.48 | 4.43 | 4.61 | 4.46 | 4.85 | 4.26 | 4.88 | 4.92 | 5.83 | 5.63 |
| ⓑ Unloading point | 3.83 | 3.70 | 4.19 | 3.72 | 4.36 | 3.63 | 4.25 | 4.38 | 5.21 | 4.91 |
| ⓒ Maximum load of 3rd loading | 4.46 | 3.88 | 5.01 | 3.88 | 5.08 | 4.20 | 4.32 | 4.26 | 4.83 | 4.53 |
| ⓑ/ⓐ | 0.85 | 0.83 | 0.91 | 0.84 | 0.90 | 0.85 | 0.87 | 0.89 | 0.89 | 0.87 |
| ⓒ/ⓑ | 1.16 | 1.04 | 1.19 | 1.04 | 1.16 | 1.17 | 1.03 | 0.98 | 0.93 | 0.92 |
© 2019 by the authors. Licensee MDPI, Basel, Switzerland. This article is an open access article distributed under the terms and conditions of the Creative Commons Attribution (CC BY) license (http://creativecommons.org/licenses/by/4.0/).
Share and Cite
MDPI and ACS Style
Kang, C.; Kim, T. Curable Area Substantiation of Self-Healing in Concrete Using Neutral Axis. Appl. Sci. 2019, 9, 1537. https://doi.org/10.3390/app9081537
AMA Style
Kang C, Kim T. Curable Area Substantiation of Self-Healing in Concrete Using Neutral Axis. Applied Sciences. 2019; 9(8):1537. https://doi.org/10.3390/app9081537
Chicago/Turabian StyleKang, Choonghyun, and Taewan Kim. 2019. "Curable Area Substantiation of Self-Healing in Concrete Using Neutral Axis" Applied Sciences 9, no. 8: 1537. https://doi.org/10.3390/app9081537
Note that from the first issue of 2016, this journal uses article numbers instead of page numbers. See further details here.