Article

Microfluidics-Driven Fabrication of a Low Cost and Ultrasensitive SERS-Based Paper Biosensor

1
International Iberian Nanotechnology Laboratory (INL), Avda. Mestre José Veiga, 4715-310 Braga, Portugal
2
Department of Analytical Chemistry, Physical Chemistry and Chemical Engineering, University of Alcalá (UAH), Crta. Madrid-Barcelona, Km. 33.600, 28805 Alcalá de Henares, Spain
3
Universidade Nova de Lisboa, Campus da Caparica, 2829-516 Caparica, Portugal
4
Instituto de Medicina Molecular, Faculdade de Medicina, Universidade de Lisboa, 1649-004 Lisbon, Portugal
*
Author to whom correspondence should be addressed.
Appl. Sci. 2019, 9(7), 1387; https://doi.org/10.3390/app9071387
Submission received: 18 February 2019 / Revised: 25 March 2019 / Accepted: 27 March 2019 / Published: 2 April 2019
(This article belongs to the Special Issue Surfaced Enhanced Raman Scattering (SERS) in Disease Diagnosis)

Abstract

:

Featured Application

The SERS-based paper nanosensors reported in here may be used for ultrasensitive label-free detection of biomolecules in disease monitoring, as well as in any other field of application in need of ultrasensitive analytical tools such as environment, food safety or water control, among others.

Abstract

Surface-enhanced Raman scattering (SERS) spectroscopy stands out due to its sensitivity, selectivity, and multiplex ability. The development of ready-to-use, simple, and low-cost SERS substrates is one of the main challenges of the field. In this paper, the intrinsic reproducibility of microfluidics technology was used for the fabrication of self-assembled nanoparticle structures over a paper film. The paper SERS substrates were fabricated by assembling anisotropic particles, gold nanostars (GNSs), and nanorods (NRs) onto paper to offer an extra enhancement to reach ultra-sensitive detection limits. A polydimethylsiloxane PDMS-paper hybrid device was used to control the drying kinetics of the nanoparticles over the paper substrate. This method allowed a high reproducibility and homogeneity of the fabrication of SERS substrates that reach limits of detection down to the picomolar range. This simple and low-cost fabrication of a paper-based sensing device was tested for the discrimination of different cell lineages.

Graphical Abstract

1. Introduction

Key enabling technologies (KETs) such as nanotechnology, surface-enhanced Raman scattering (SERS) spectroscopy, and microfluidics have been thriving in recent years. Actually, one of the techniques that most benefited from advances in nanotechnology is SERS. This ultrasensitive analytical technique overcomes the intrinsic low efficiency of Raman by using nanoparticles (NPs), which reach up to enhancing factors of 1012–1014 orders of magnitude [1,2]. The high sensitivity of this analytical tool allows it to be used to detect chemical and biological analytes that interact with active SERS substrates, even at very low detection limits [3,4,5,6]. However, one of the major challenges hindering the establishment of SERS as a standard analytical technique is the difficulty of controlling the reproducibility of those SERS substrates. SERS substrates are based in plasmonic NPs of different compositions (Ag, Au, Pt, Cu) and shapes [7]. Despite the availability of several top-down or bottom-up synthetic strategies, such as chemical and physical vapor deposition, mechanical or biological synthesis, which is the chemical approach leading to colloidal suspensions, has been the most used by far [8]. Metallic NPs in colloidal dispersions can be used as SERS substrates directly as they are or supported over solid substrates [9]. The use of metallic nanostructures as synthesized allows average measurements and avoids sample damage due to the Brownian motion of particles in liquid [10]. However, when performing average SERS, reaching very low detection limits can be challenging and the reproducibility highly depends on the NP batch. Furthermore, SERS is a distance effect and the analyte needs to be close to the surface of the nanostructure to undergo the SERS effect. In the case of colloidal dispersions, this is only possible for molecules that have affinity for the surface of the NP. Additionally, SERS performance in terms of sensitivity often relies on the formation of hot-spots, which are areas with an extra SERS enhancement occurring when NPs are in close vicinity [11,12,13,14,15]. Supporting NPs over different solid substrates for the development of SERS sensors increases the reproducibility of their optical properties, the control of hot-spots, and the physical adsorption of molecules with no-affinity for those SERS active nanostructures [16]. In addition, SERS substrates using anisotropic particles, such as gold nanostars (GNSs) and nanorods (NRs), offer an extra signal enhancement and facilitate label-free detection strategies [17].
Paper-based SERS substrates are popular due to their low cost, ease of use, flexibility, and suitability for on-field measurements [18,19,20]. However, reproducible deposition of NPs in paper is not straightforward, especially when using anisotropic NPs [18,19]. In recent years, several approaches for the fabrication of paper-based SERS substrates have been reported, including physical vapor deposition [21], laser driven deposition [22], dip coating [23,24], pen [25] and printer-based plasmonic inks [26], or painting brushing [27]. For instance, Polavarapu et al. [25] developed a pen-on-paper approach using plasmonic inks to write SERS arrays. Those SERS substrates showed a higher SERS performance when compared to commercial SERS substrates. Barman and co-workers focused their research on overcoming a common limitation of NP assemblies, which the coffee-ring effect caused when drop casting both the NPs and the sample [28]. In this work, they leveraged the coffee ring effect to achieve higher sensitivity by measuring at the ring zone in which the enhancement is superior. However, in all above-mentioned approaches, several limitations restrict the use of these paper sensors. Dip coating or soaking of paper usually takes a long time to achieve sufficient loading of NPs and requires high volumes, ink-based strategies may clog and there is a high dead volume of NPs, and laser or vapor deposition require high-tech instrumentation and expert personnel. The combination of microfluidics with SERS has tackled in a bidirectional way some of the bottlenecks of both technologies when used individually. The use of microfluidics allowed the controlled handling of NPs and NP assemblies in microfluidic channels [29,30]. The miniaturization and flow control in microfluidics also permits the use of reduced substrate and sample volumes [1]. On the other hand, the use of a powerful sensing technique as SERS when handling microfluidics is crucial due to the low sample volumes and sensing areas.
In this scenario, we present an interdisciplinary research work involving nanoparticles, SERS spectroscopy, and microfluidics. By using microfluidics for the highly controlled assembly of NPs on paper, we demonstrated the fast and low-cost fabrication of a paper-based sensing device in situ with improved efficiency and reproducibility. A hybrid and modular polydimethylsiloxane-paper (PDMS-paper) device was used for the controlled deposition of GNSs and core-shell gold silver nanorods (Au@AgNRs). These anisotropic NPs were self-assembled on a paper substrate by taking advantage of a reservoir-like architecture on the PDMS device, which allowed for the kinetic control of the wettability and evaporation during the self-assembly process. The sensitivity was tested using the Raman model molecule 1-naphthalenethiol (1-NAT), which achieved values of 10−12 M for both GNSs and Au@AgNRs, and showed a high homogeneity over the sensing area. As a proof-of-concept, and to demonstrate the potential of these SERS substrates as biosensors, human colorectal cancer cells (SW480) and human peripheral blood mononuclear cells (PBMCs) were lysed and analyzed using the PDMS-paper substrates.

2. Materials and Methods

2.1. Materials

All chemicals were purchased at Sigma-Aldrich unless otherwise specifically stated. Milli-Q ultrapure water (Millipore, Burlington, MA, USA) was used throughout all the experiments.

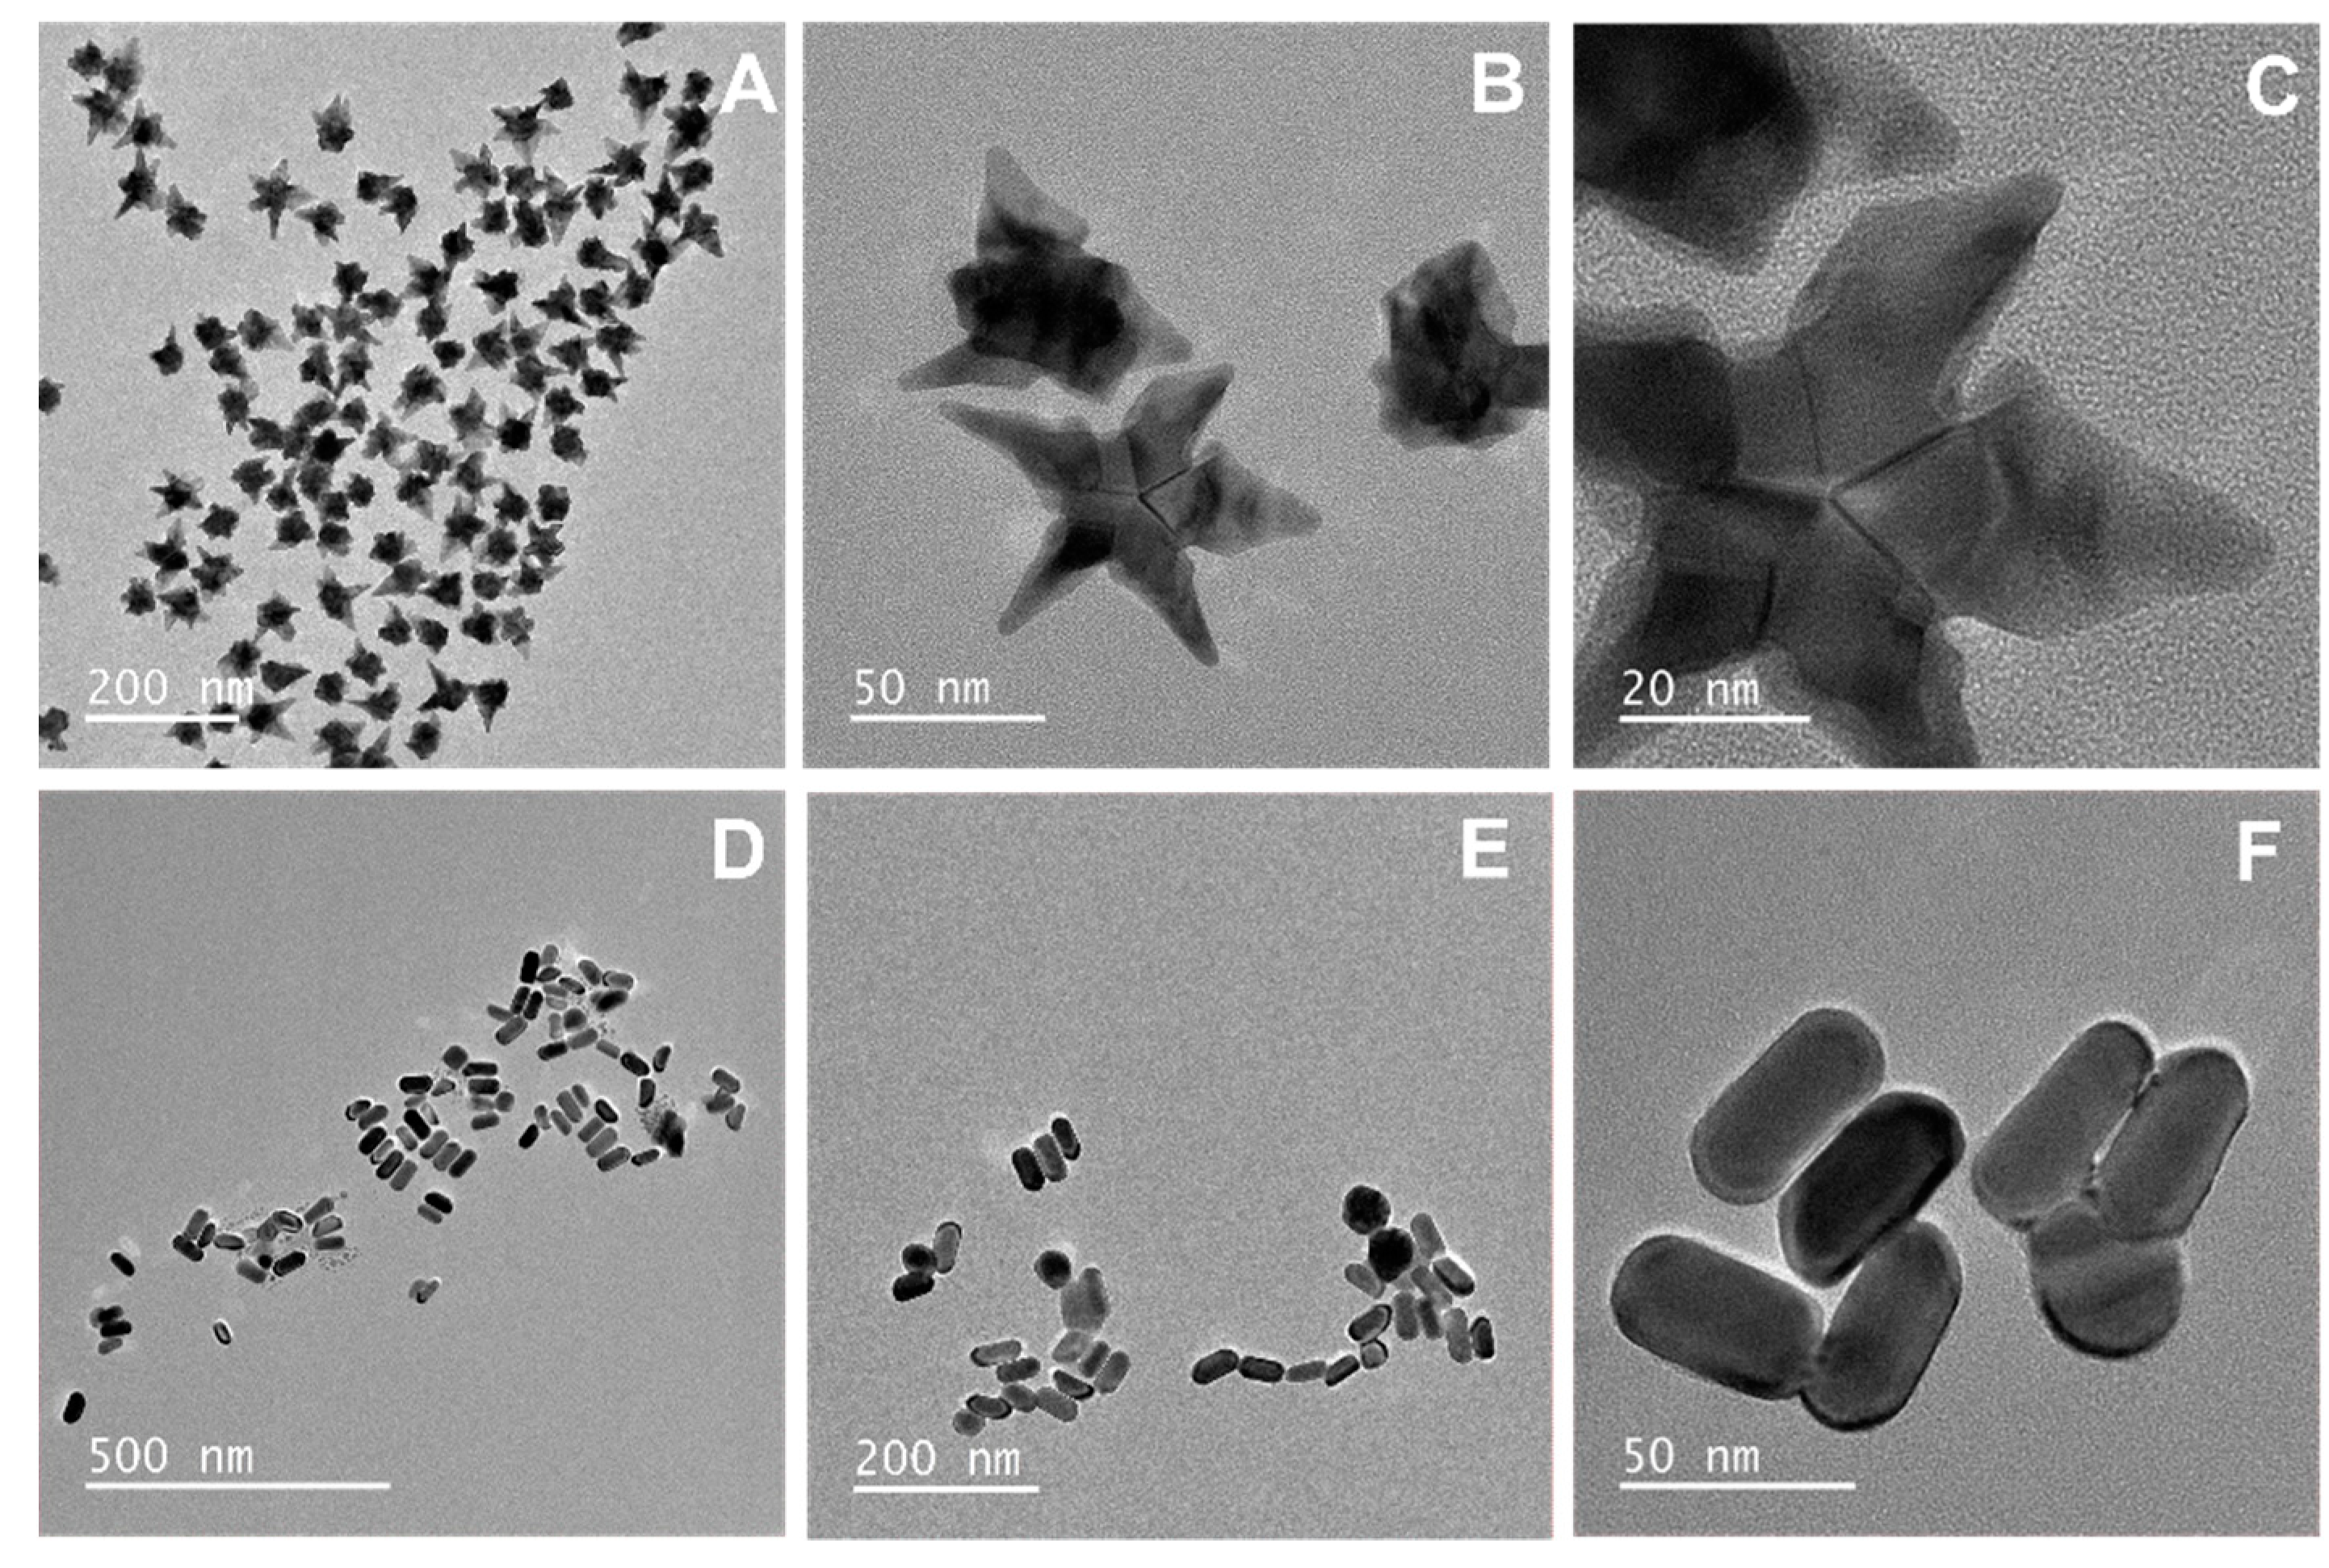
2.2. Synthesis of Gold Nanostars

GNSs were prepared by using a modification of the seed-mediated growth previously reported [31]. Gold spheres of 15 nm were used as seeds and synthesized by the Turkevich method [32]. Briefly, 5 mL of a 1% solution of sodium citrate dihydrate was added to 100 mL of boiling HAuCl4, at 0.5 mM, under vigorous magnetic stirring. Upon the addition of the sodium citrate, the solution was kept under magnetic stirring and boiling until the color changed from yellow to dark red. Following, citrate was replaced by polyvinylpyrrolidone 10K (PVP MW = 10,000 g mol−1), using 60 molecules of PVP per nm2. One mL of PVP (56 mg mL−1) was added to 25 mL of gold nanospheres (0.557 mM) under vigorous stirring and left overnight. The resulting solution was centrifuged for 90 minutes at 7000 rpm, re-dispersed in 25 mL of isopropanol, and stored in the fridge until further use.
For the seed-mediated growth of the gold nanostars, 25 g of PVP-10K were dissolved in 250 mL of N,N-dimethylformamide (DMF) for 15 minutes by using an ultrasound sonicator. In the following, 1 mL of an aqueous solution of 0.126 M chloroauric acid (HAuCl4) was added and the mixture was vigorously magnetically stirred for two minutes in order to allow the Au3+ to be reduced to Au1+. Afterward, 1.3 mL of 1.8 × 10⁻³ M Au@PVP seeds was added to the reaction flask and the reaction was left for 1 h under magnetic stirring. The resulting GNSs were washed six times (4000 rpm, 30 min) with /isopropanol to remove excess PVP and DMF, and stored in isopropanol protected from the light until further use.

2.3. Synthesis of Au@Ag Nanorods

The synthesis of the Au nanorods (AuNRs) was completed according to the seed-mediated growth method, with some modifications [33]. First, the seed solution was synthesized by mixing 2.5 mL of 0.2 M of cetyltrimethylammonium bromide (CTAB) with 1.5 mL of 1 mM HAuCl4. This process was followed by the fast addition of 600 μL of 0.01 M iced sodium borohydride (NaBH4) solution under vigorous stirring. The color of the solution tuned to dark brown, which indicates the formation of gold nano-seeds. Next, 180 μL of 15 mM silver nitrate (AgNO3), 1.25 mL of 15 mM HAuCl4, and 11 mL of water were sequentially added into 12.5 mL of 0.2 M CTAB solution under vigorous stirring. Then 0.1 M ascorbic acid (AA) solution was slowly, drop by drop, added into this mixture to obtain the ‘growth solution.’ Lastly, 20 μL of the seed solution was mixed with the prepared growth solution under magnetic stirring for 15 s and then left to react for 1 h without stirring. The formation of AuNRs was indicated by the color gradually turning into dark purple. For purification, the resulting solution was centrifuged at 9000 rpm for 20 min and re-dispersed in water.
For the fabrication of the core-shell Au@AgNRs, 2 mL of the purified AuNRs was sequentially mixed with 0.0728 g CTAB, 4 mL of water, 130 μL of 0.1 M AA, 140 μL of 15 mM AgNO3, and 240 μL of 0.1 M NaOH under vigorous stirring. The color gradually turned to dark red, which indicated the deposition of a silver shell onto the AuNRs. Lastly, the NPs were centrifuged once at 7500 rpm for 20 min and re-dispersed in water.

2.4. Optical and Morphological Characterization of the NPs

The resulting NPs were characterized by UV−visible spectrophotometry (SHIMADZU UV-2550, Kyoto, Japan), transmission electron microscopy (TEM, JEOL-2100, Kioto, Japan), and the scanning electron microscope (SEM, Fei Quanta 650, Portland, OR, US). UV−visible absorption spectra were acquired using a 1-cm optical path cuvette. TEM samples were prepared by drop casting 10 µL of the NP suspensions onto 400 mesh copper grids (Ted Pella, INC, Redding, CA, US). TEM images were acquired at 200 kV and nanoparticle dimensions were measured using ImageJ software. For the SEM analysis, paper substrates were sputtered with a 2 nm platinum layer. SEM imaging was performed under high vacuum conditions at a 3 to 15 kV beam line.

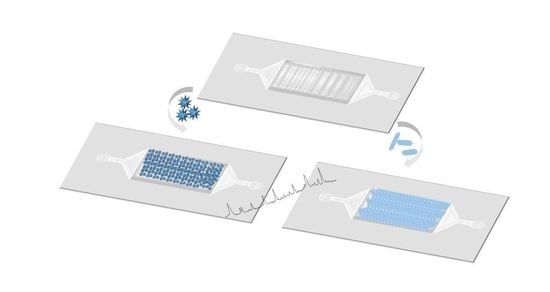
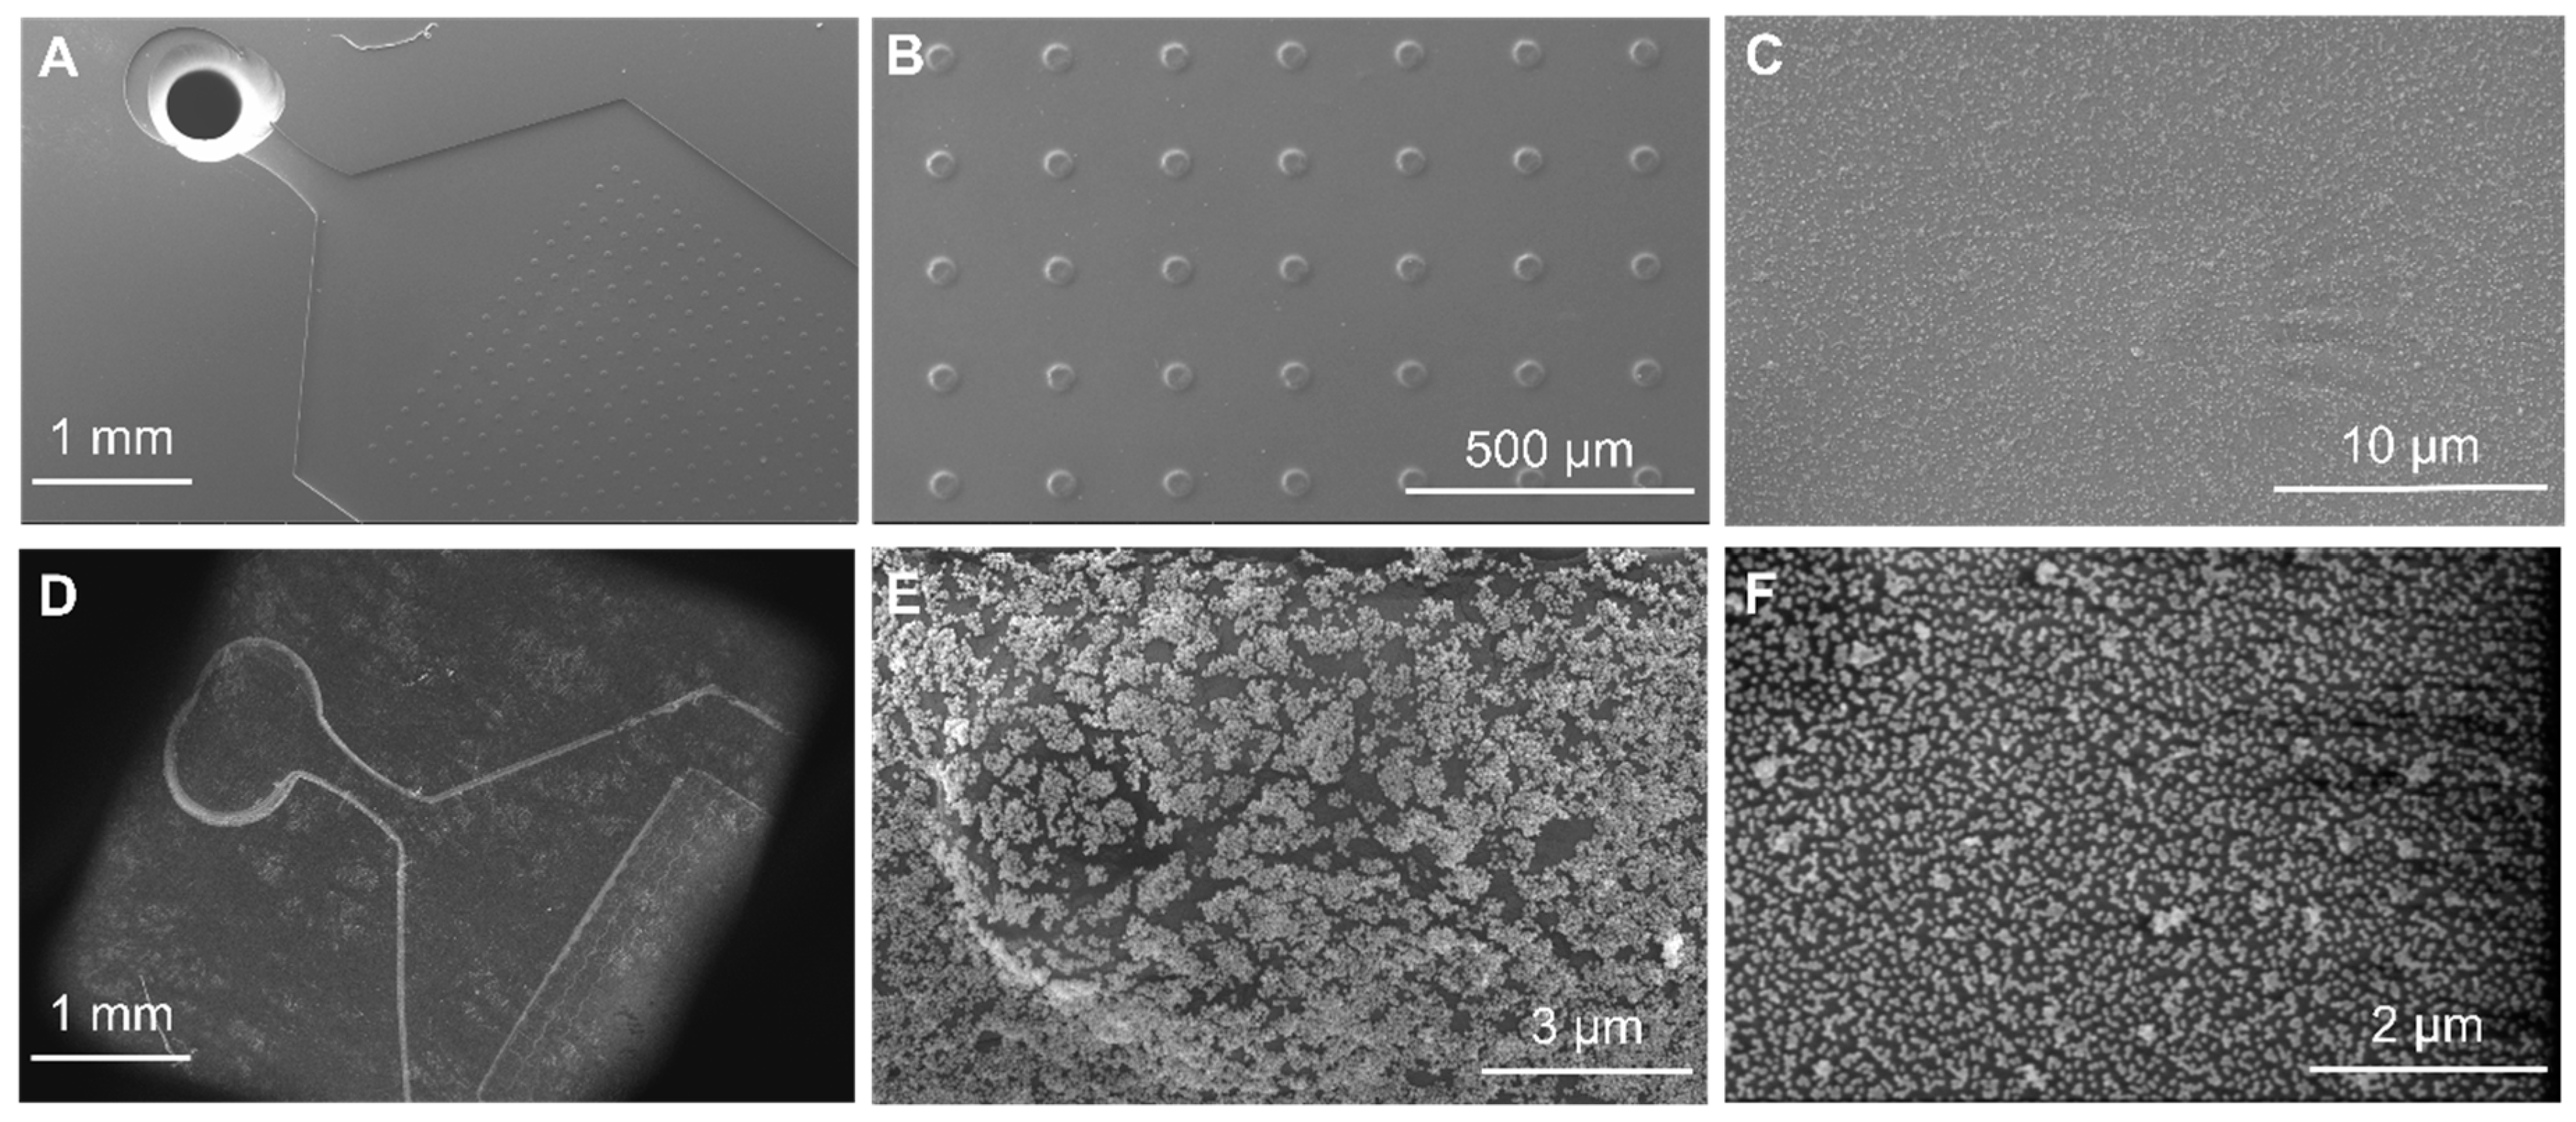
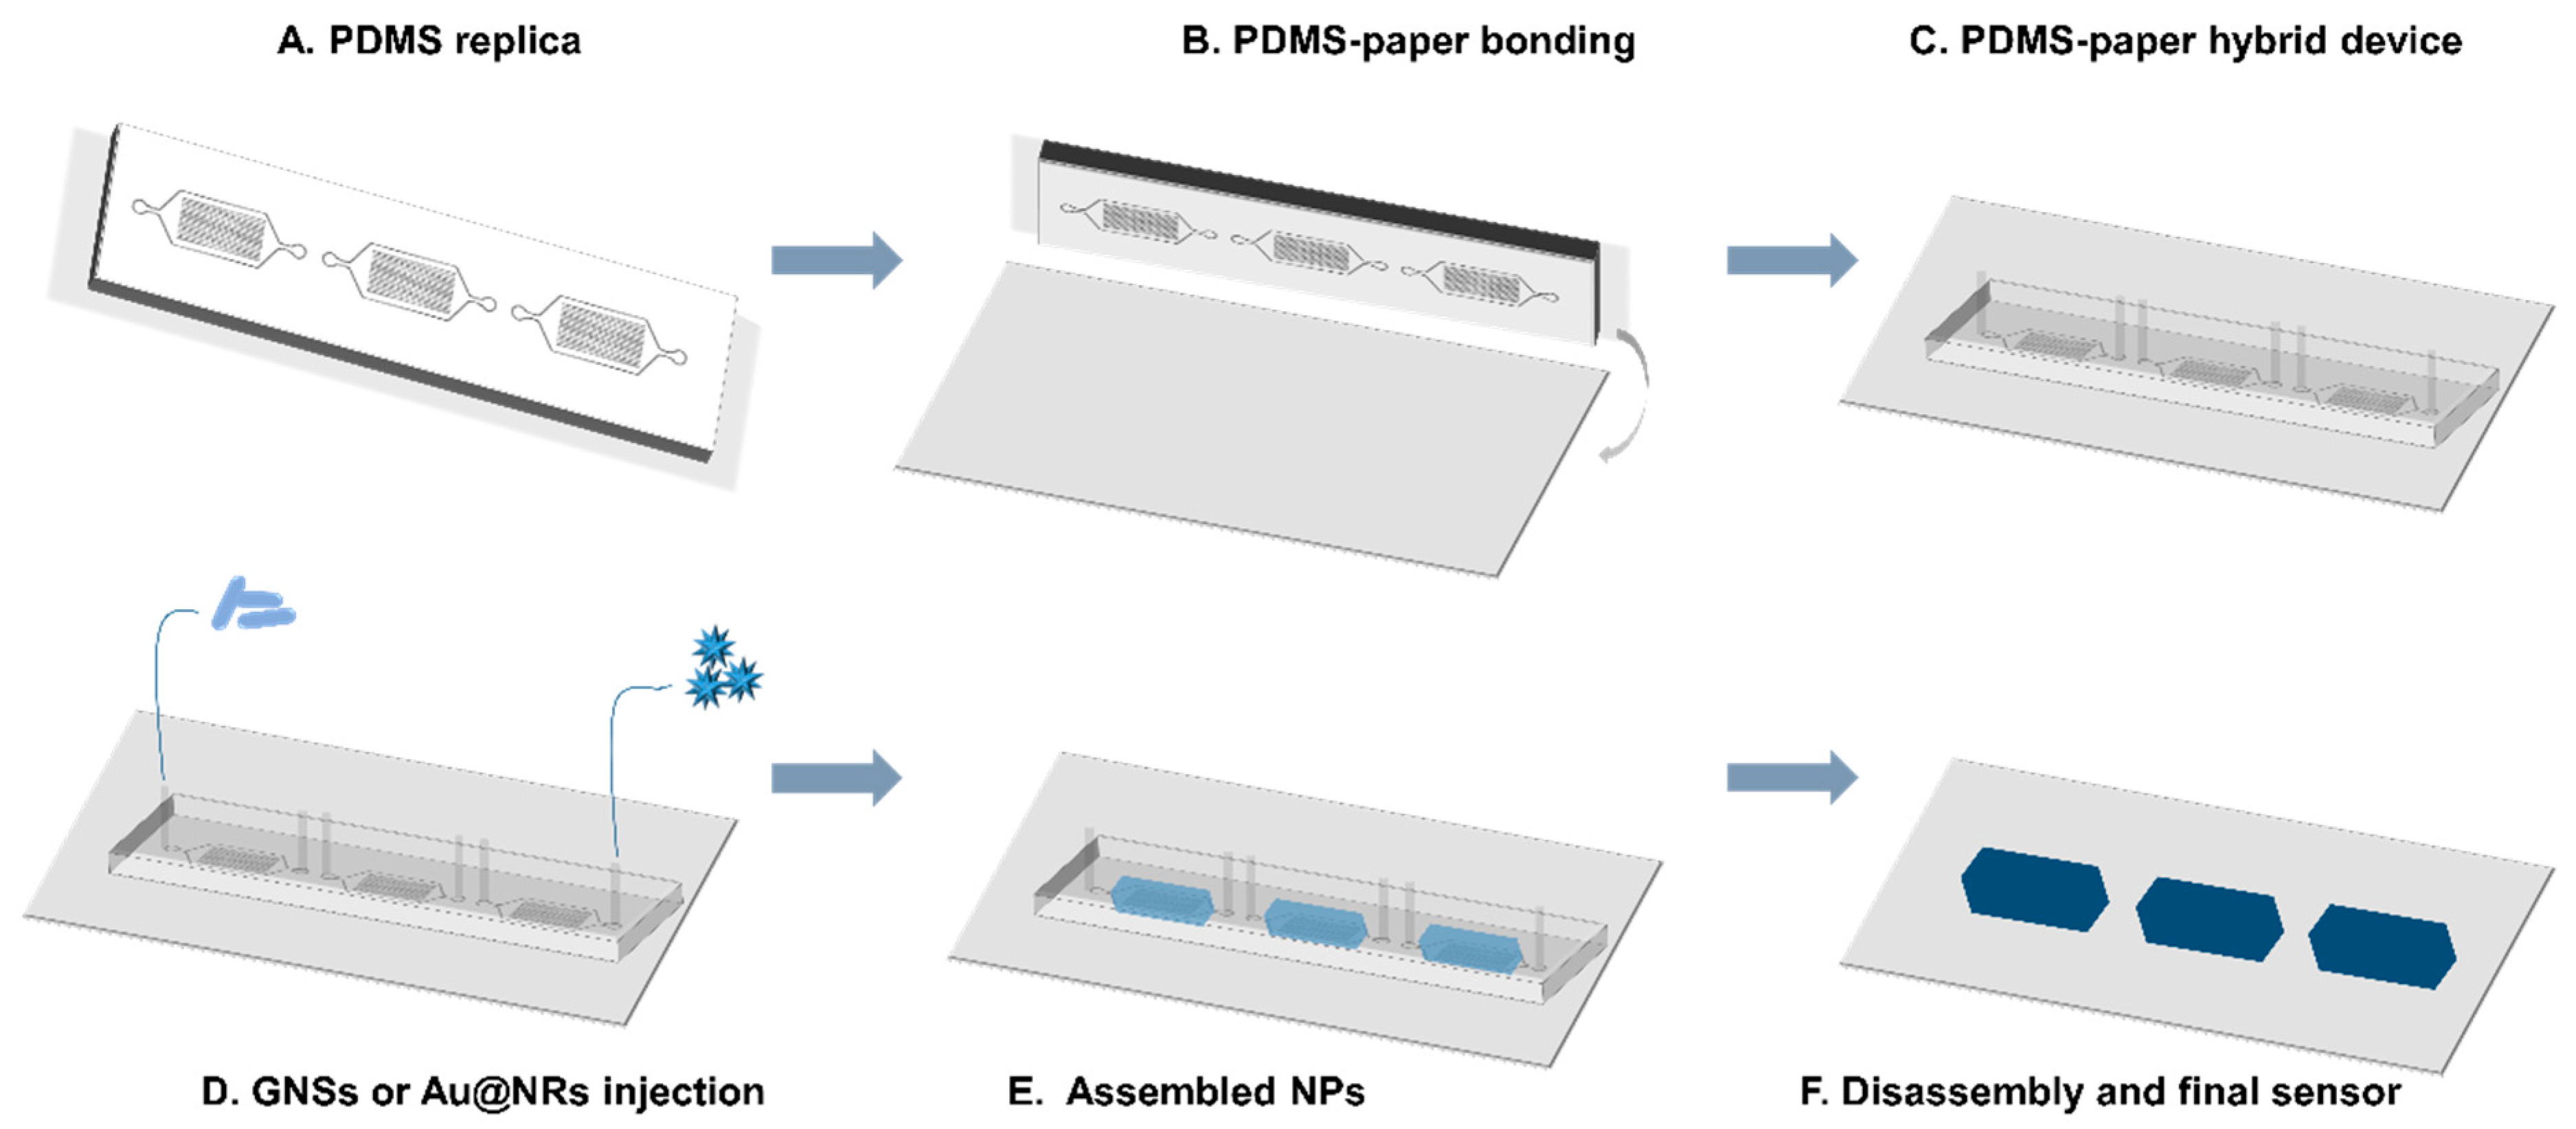
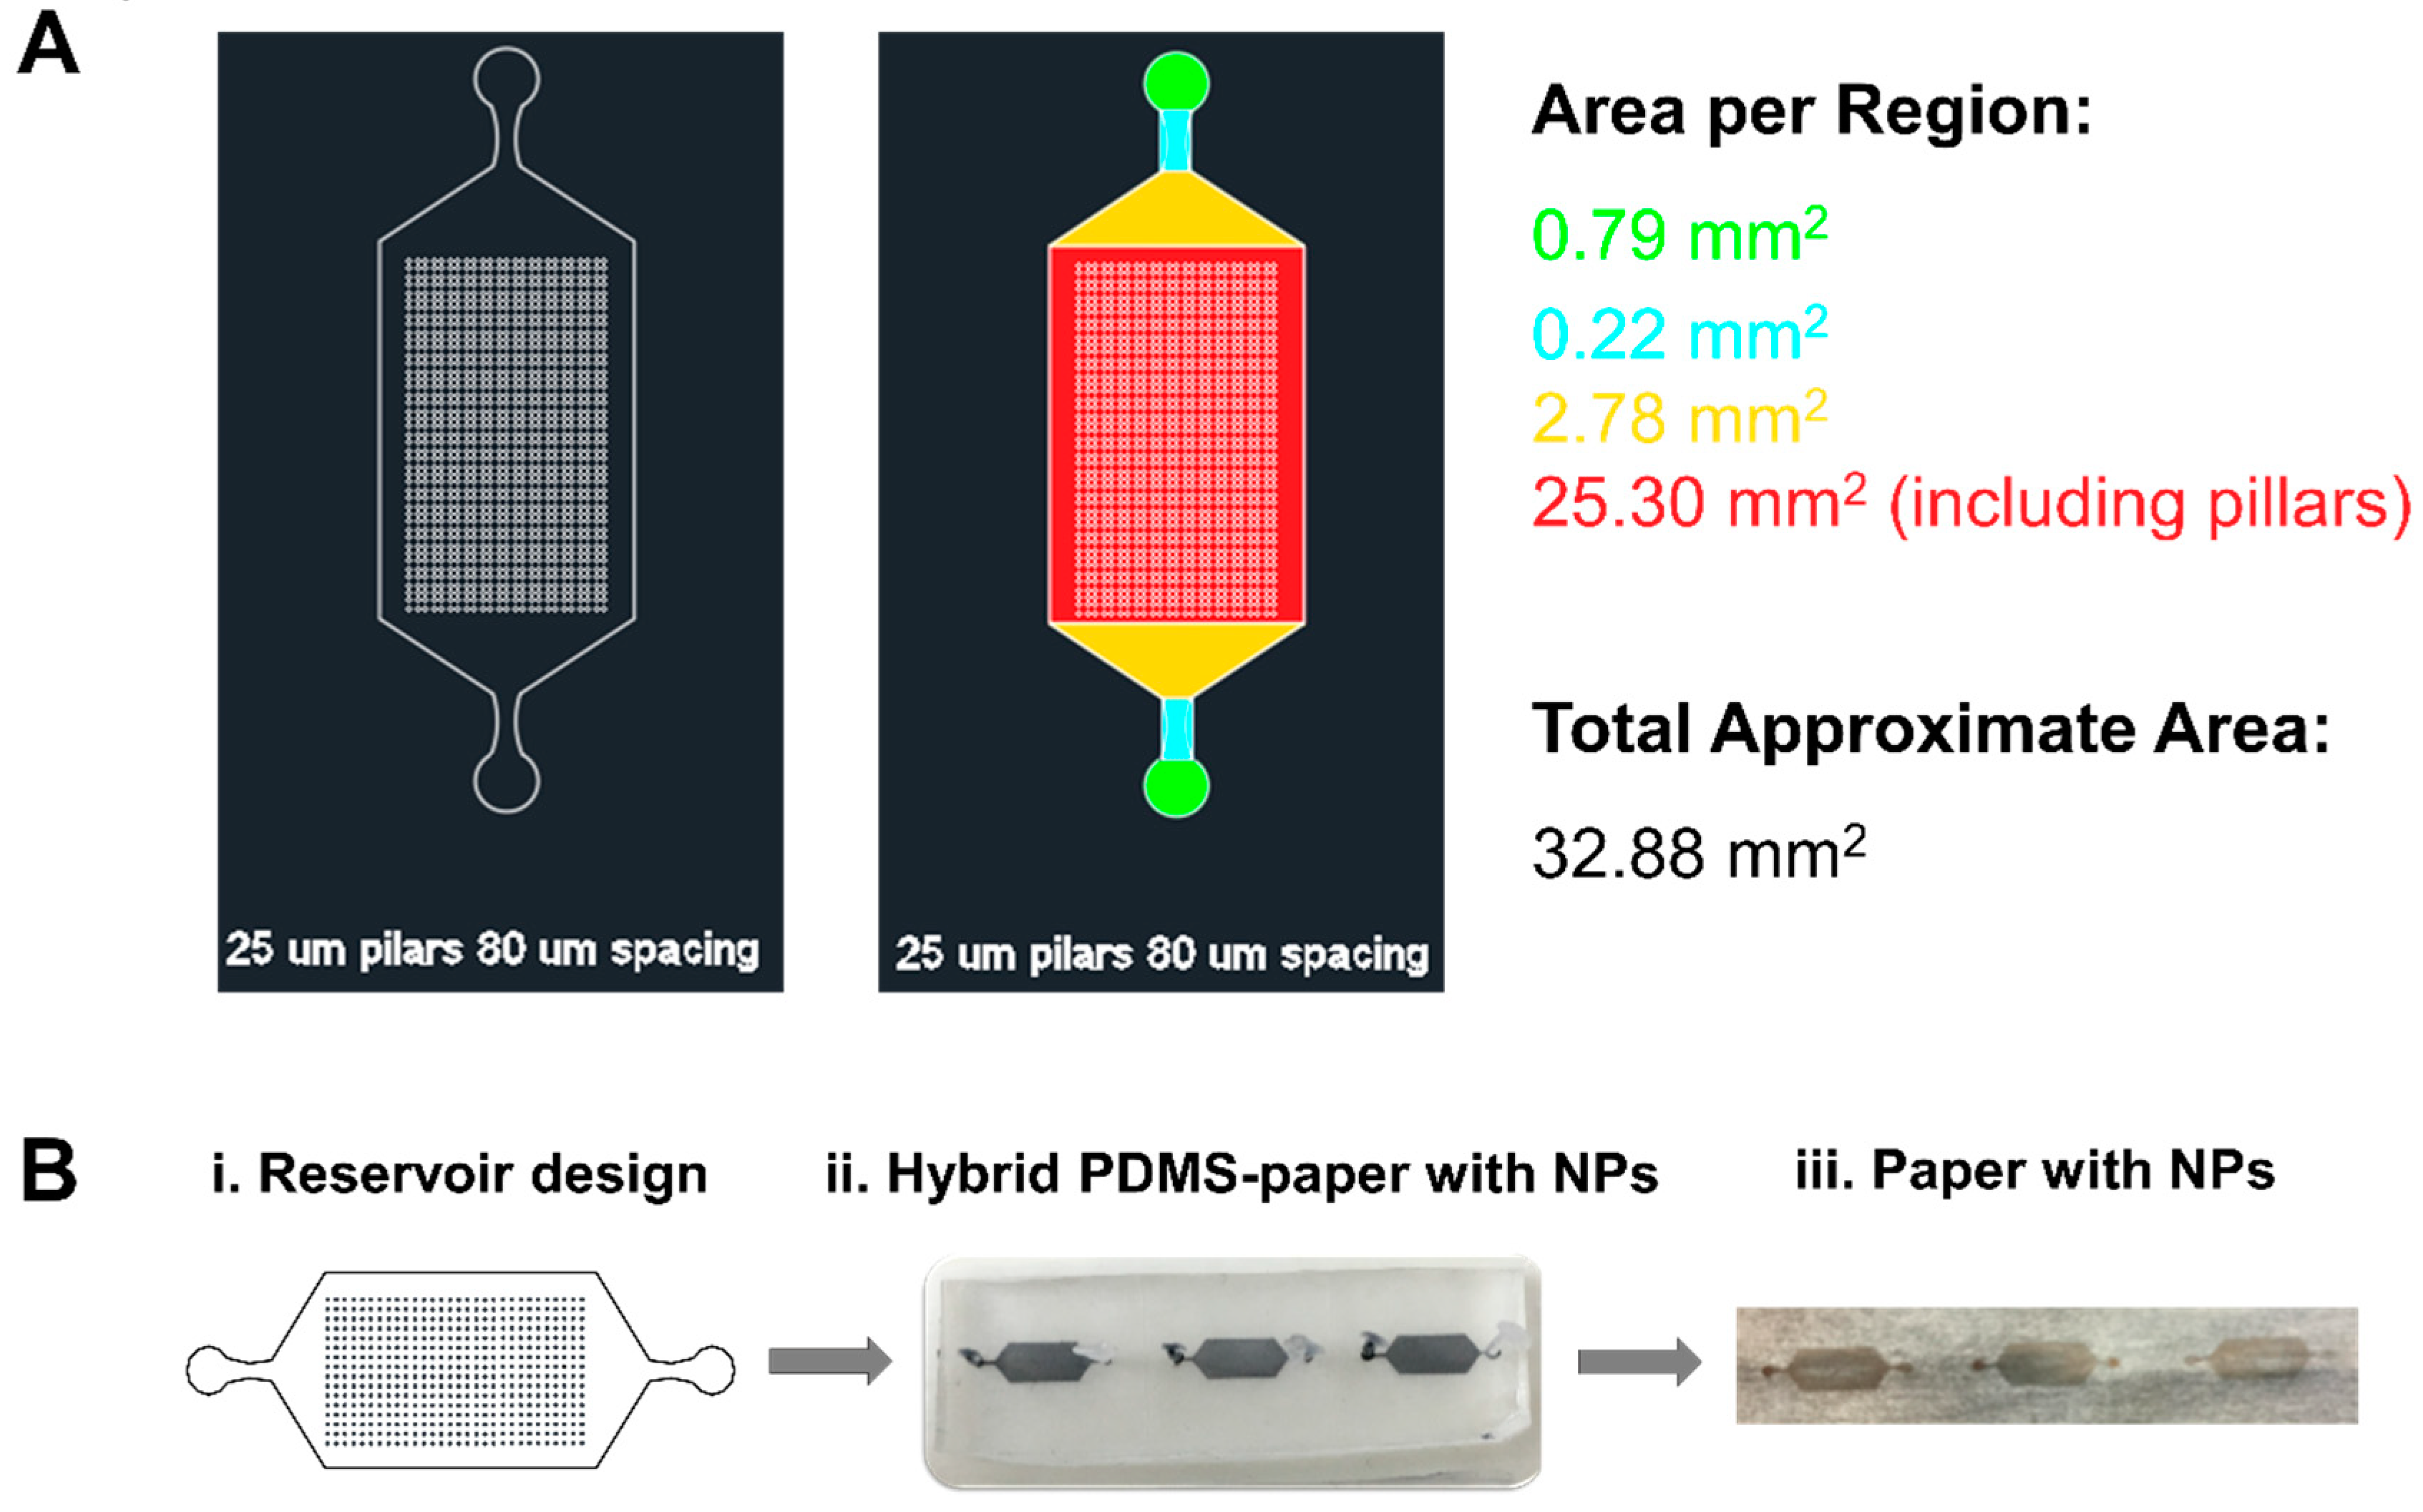
2.5. PDMS/Paper Device Fabrication

The PDMS module was fabricated by conventional soft lithography methods [34,35]. The device was first designed with Autocad 2013 (Autodesk) and a dark-field mask was printed (JD-Photo Data, UK). SU-8 2025 negative photoresist (MicroChem) was spin-coated onto a silicon wafer (diameter: 76.2 mm) at 500 rpm for 5 s and then ramped to 1000 rpm at an acceleration of 300 rpm s−1 for 33 s. After spinning, the wafer was prebaked (2 min at 65 °C, then 6 min at 95 °C) and exposed to UV light through the acetate mask on a mask aligner at 200 mJ cm−2 (MA6BA6, Suss Microtech). After post-baking (1 min at 65 °C and 3 min at 95 °C) and development in the SU-8 developer (PGMEA, Sigma Aldrich), the master was hard-baked for 2 min at 170 °C. A final thickness of 60 µm was obtained, as measured by using profilometry (KLA-Tencor). For the fabrication of the PDMS (PDMS, Sylgard 184) replicas, a mixture of the PDMS prepolymer and cross-linker (ratio 10:1, w/w) was poured on top of the master, degassed, and then cured for 1 h at 65 °C. The cured device was cut and peeled off from the master, and holes for tubing were made with a biopsy punch (diameter = 1.25 mm, Kai Medical). Lastly, for the preparation of the hybrid PDMS-paper devices, weighing paper and PDMS replicas were treated with oxygen plasma for 20 s. Afterward, the exposed surfaces of both PDMS and paper were bound. To guarantee the optimal sticking of all the features within the device to the paper, soft pressure was applied.

2.6. Assembly of NPs on PDMS-Paper Substrates

Pre-synthesized GNSs and Au@AgNRs were centrifuged at 4000 rpm for 30 minutes, the supernatant was discarded, and the NPs were re-dispersed in isopropanol to a final concentration of 20 mM and 10 mM, respectively. The GNSs and Au@AgNRs were injected manually into the PDMS-paper device using a 1 mL syringe connected via polyethylene tubing (Smith Medical, i.d. 0.38 mm) until a drop was visible at the outlet hole of the reservoir. The inlet and outlet holes were blocked and the isopropanol was allowed to dry for 30 min.

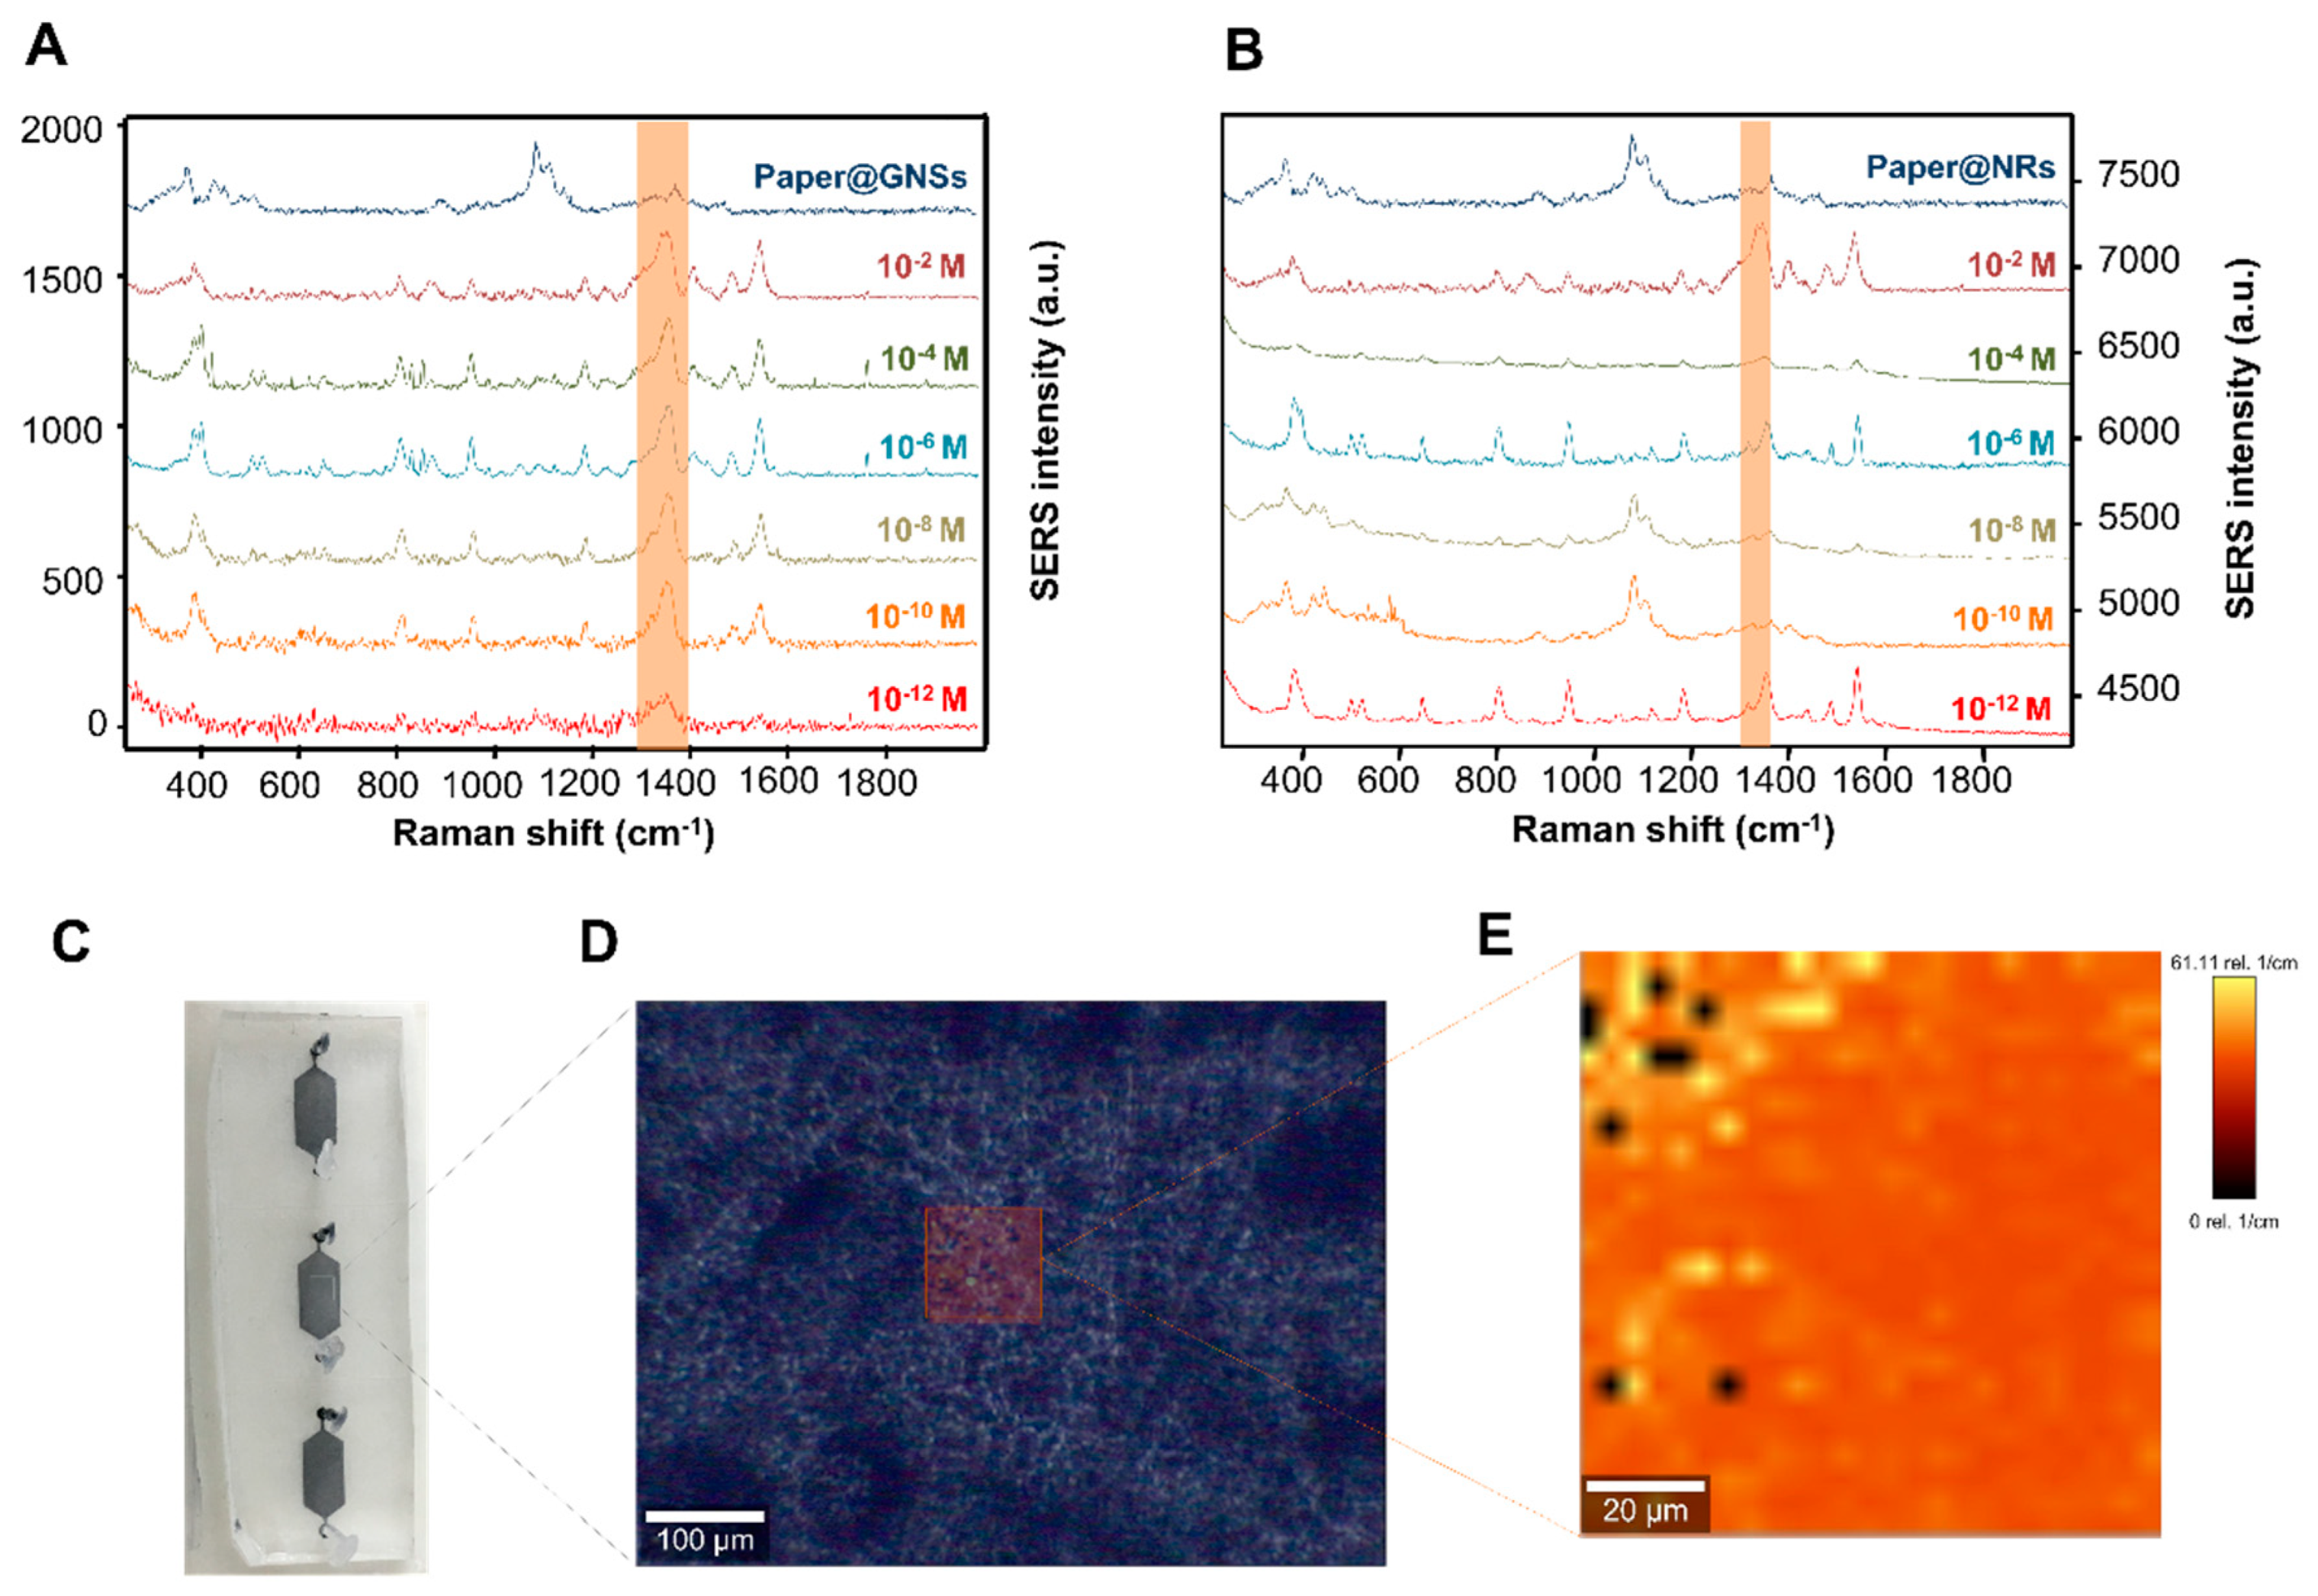
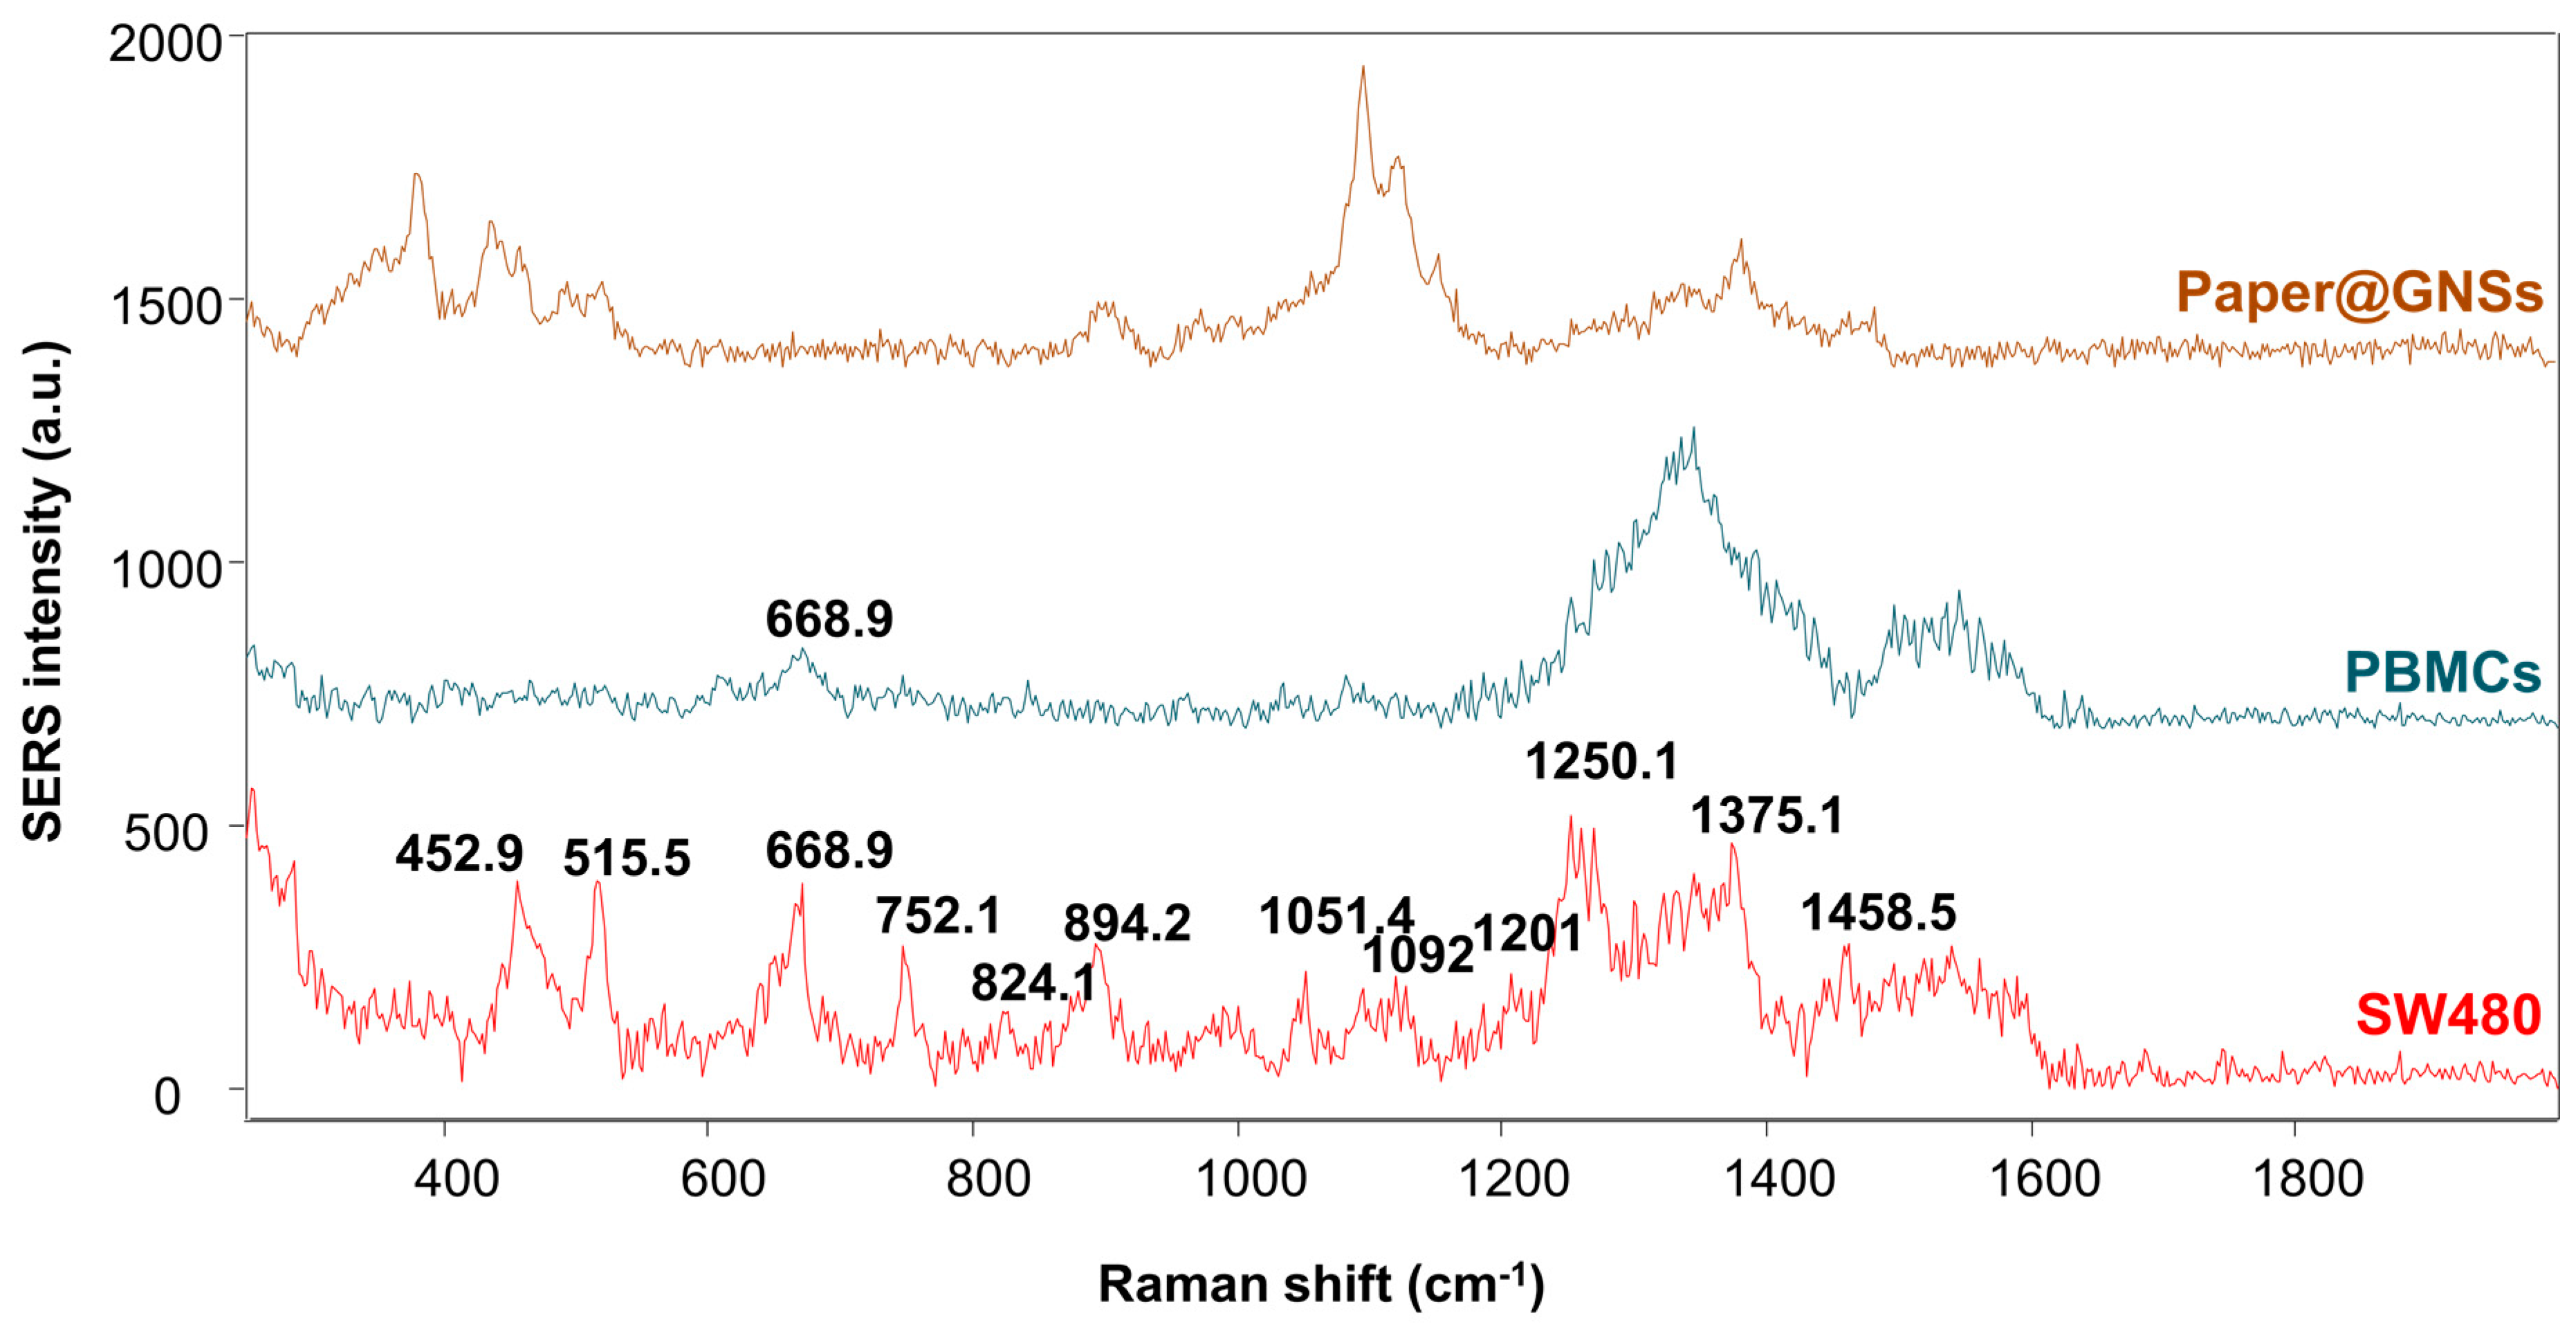
2.7. SERS Characterization

For SERS characterization, the model molecule 1-naphtalenethiol (1-NAT) was used. Sample solutions were prepared at concentrations 10−2 M, 10−4 M, 10−6 M, 10−8 M, 10−10 M, and 10−12 M. These different solutions were injected in the PDMS-paper device containing the assembled NPs, and allowed to dry. After drying, the PDMS part was dissembled from the paper part for measurement. Raman measurements were carried out in a 300R Confocal Raman microscope (WITec) using the 785 nm laser line grating (600 gr cm−1) as the excitation source and a 100× objective. Acquisition was performed for 1 s at five different points of the NP-assembled area. A map of 625 spectra was also acquired from the GNSs paper substrate to analyze the homogeneity of the sample. Each individual spectrum of the map was acquired for 1 s with a step size of 4 µm using the 10× objective. SERS spectra were processed with the Project4 WITec software for background and cosmic ray removal corrections and GRAMS/AI Spectroscopy software for figure preparation.

2.8. Cell Culture, Sample Preparation, and SERS Analysis

Peripheral blood samples were collected from healthy donors upon informed consent according to the principles of the Declaration of Helsinki. About 9 mL of blood was obtained from each donor using EDTA-coated collection tubes, and PBMCs were isolated by Ficoll-Histopaque-10771 gradient centrifugation, according to the manufacturer’s instructions. Anticoagulated blood was diluted with an equal volume of phosphate-buffered saline, pH 7.4 (PBS; Gibco), containing 2% fetal bovine serum (FBS; Gibco). Diluted blood was layered over the Histopaque samples that were centrifuged at 400× g for 30 min at room temperature in a swing-out rotor with no brakes. The PBMC interface was carefully removed by pipetting and washed with PBS-2% FBS by centrifugation at 300× g for 10 min. The PBMC pellet was re-suspended in PBS-2% FBS followed by the cell number assessment by standard hemocytometer count.
SW480 human colon cancer cells (ECACC, CCL-228) were cultured in Dulbecco’s modified Eagle’s medium (DMEM; Gibco) supplemented with 10% fetal bovine serum and 1% penicillin/streptomycin (Corning) and incubated at 37 °C under 5% CO2.
For the SERS analysis, 1 mL of each cell suspension containing 1 × 10⁶ cells was centrifuged, re-suspended in 300 µL of ethanol absolute, and ultrasonicated to trigger cell rupture and mechanical lysis. The resulting 300 µL of the sample was deposited in the GNSs paper substrate after removal of the PDMS reservoir, and allowed to dry before analysis. The resulting substrates were analyzed using the 785 nm laser excitation line. Five spectra for each of the samples were acquired for 10 s.

3. Results and Discussion

Figure 1 shows the morphology of the different metallic nanoparticles used to fabricate the assemblies on the paper. GNSs of an average size of 70 nm and Au@AgNRs of an aspect ratio of 1.6 were synthesized. The electron microscopy images show a narrow size distribution for the nanoparticles that will then be self-assembled using the PDMS-paper hybrid device. Additionally, UV-vis spectra for both types of NPs are shown in the Supplementary Information (Figure S1). Figure S1A shows the extinction spectrum of the AuNRs and Au@AgNRs with the longitudinal plasmon band maxim absorbance at 545 and 688 nm, and the transverse plasmon band maximum absorbance at 395 and 526 nm, respectively. The extinction spectrum of the GNSs used along this work is shown in Figure S1B, and the maximum absorbance for the plasmon band corresponding to the core and tips are 561 and 832 nm, respectively.
For the fabrication of the PDMS-paper device, an AutoCAD design for microfluidic reservoirs was adapted from previous works [36]. For the preparation of the hybrid self-assembling platform, the process depicted in Figure 2 was followed. The PDMS replicas of the reservoirs (Figure 2A) were bonded to standard wax weighing paper by plasma activation (Figure 2B). The bonding, despite not being permanent, allowed the injection of the anisotropic NPs dispersed in isopropanol by using connection tubing (Figure 2D). The fact of the bonding not being permanent benefits the system, since the researcher can choose to introduce the sample via tubing, or, for on-field application, the paper piece can be submerged in the sample to test. After introducing the NPs, they were allowed to dry, and a homogeneous assembly of NPs was deposited on the surface of the paper (Figure 2E). Lastly, the PDMS part was unsealed from the paper substrate for analysis (Figure 2F). The use of PDMS was crucial for the development of this substrate because it permits the control of the evaporation of the solvent to achieve homogeneous deposition and also the use of reduced NP and sample volumes. Figure S2 shows additional SEM images of the paper substrates after the self-assembly process and after de-bonding of the PDMS for different repetitions of the same experiment. The high magnification images of Figure S2F demonstrates that the self-assembly lead to a closed packed arrangement of the NPs, and, thus, to the formation of hot-spots along the substrate. The internal volume of the PDMS reservoir (depth 60 µm) used for the assembly was 1.85 µL. In this way, the amount of NPs needed for the fabrication of this SERS substrate is considerably lower than the volume needed with previous dip-coating approaches [37,38] or with the silver mirror reaction method, which is usually no less than 10 mL [23,39]. The active area of the assembly was that of the reservoir design, 32.88 mm2 (Figure 3A), and, thus, the active area for sensing can be extended when compared to previous approaches [40]. The surface coverage for the GNSs and NRs sensors were 0.6 mM mm−2 and 0.3 mM mm−2, respectively. Despite the very low volume of NPs needed for the assembly, the naked-eye assessment of the homogeneity (Figure 3B) of the deposition and concentration of NPs was comparable to alternative strategies. For example, Villa et al. [40] reported on the fabrication of a gold nanoparticle array on paper by drop-casting using different NP concentrations. In order to achieve a close packed NP arrangement, they needed to use a 50-fold pre-concentrated NPs solution of the well-known Turkevich [41] gold NPs. The latter is equivalent to a gold concentration of 25 mM. The pre-concentration step is needed and the process took about 1 hour. Notably, the drying process using the microfluidics-based strategy presented in this work took a maximum of 30 min. This is considerably less than the usual assembly times for dip-coating (10-12 h). Additionally, the NPs are attached to the surface of the paper, and not to the top layer of the hybrid device (the PDMS), as confirmed by scanning electron microscopy imaging. Figure 4 shows the surface of the PDMS (Figure 4A–C) and of the paper (Figure 4D–F) at different magnifications after de-bonding. The concentration of NPs in the PDMS is remarkably lower than in the paper part. Furthermore, Figure 4F shows a very homogeneous distribution of the GNSs over the surface of the paper.
In order to characterize the SERS capability of these new approaches for the fabrication of paper SERS substrates, the Raman probe 1NAT was used. The 1NAT solution was injected into the hybrid at decreasing concentrations for the GNSs and Au@AgNRs, respectively, using the 785 nm excitation line. A control experiment of the paper with the NPs but not the analyte was performed and is shown as the first spectrum of each series for both GNSs and Au@AgNRs. The spectra of the paper shows two intense peaks that are assigned to the C-O ring stretch modes of cellulose [42]. The limit of detection (LoD) of a SERS method can be defined as the lowest concentration at which a distinguished SERS spectrum from the blank can be obtained [43]. According to the method for the calculation of the limit of blank (LoB) and LoD described by Armbruster and Pry [44],
LoB = meanblank + 1.645 (SDblank)
LoD = LoB + 1.645 (SDlow concentration sample)
the LoB based on data shown in Figure S3 is 1.6 SERS counts (a.u.), and the LoD is 14.4 counts (a.u.). Considering the intensity at 1368 cm−1 (I1368) band for the lowest tested concentration (1 pM) being 48.8 ± 7.80 counts (a.u.), above the LoD, we may conclude that the limit of detection of this method is in the picomolar range. Alternatively, if we use the blank determination method, the LoD follows the following equation [45].
LoD = meanblank + 3(SDblank)
According to Equation (2), the LoD = 6.8 counts (a.u.), again confirm that the LoD is in the picomolar range, since the lowest measured concentration is 10−12 M and the mean signal for this concentration is 48.8 ± 7.80 counts (a.u.). The different LoDs with the two reported methods are due to the confidence interval taken into account for each of them. For the method described by Armbruster, the confidence interval is 95%, whereas, for the blank determination method using three times the standard deviation of the blank to assess the noise influence, the confidence interval is 98 %. The latter demonstrates the potential of these substrates to be used in ultrasensitive sensing experiments. The homogeneity of the NPs assembly and SERS signal was tested by mapping a 100 × 100 µm2 area (Figure 5C,D and Figure S4). Figure 5C is a macroscopic optical picture of a row of three of the resulting SERS paper substrates. Figure 5D is a microscopic white light image of the resulting substrate in which the orange defined area is that of the SERS map presented in Figure 5E. Figure 5E shows a very homogeneous intensity profile of the mapped area for the selected characteristic band of the 1NAT (1368 cm−1, ring stretching) [46].
The remarkable SERS efficiency of these substrates is not only based on the ability of controlling the drying conditions to obtain homogenous assemblies, but also arises from the use of anisotropic NPs. Anisotropic morphologies provide an extra SERS enhancement due to the strong near-fields concentrated at their vertices [17]. Furthermore, the formation of hot-spots, which are areas with an extra enhancement due to the vicinity of NPs, contributed to the high efficiency of the substrate [17]. According to Figure 5A,B, the best results and most homogenous substrates were those obtained with the GNSs (for Supplementary information, see Figure S4). This fact may be due to different reasons, such as the concentration of GNSs being 20 mM, whereas the Au@AgNRs were used at a concentration of 10 mM due to stability reasons. Despite the fact that the 1NAT signal at 1368 cm−1 could still be found in the sample prepared with 10−12 M concentration of 1NAT, the reproducibility of the measurements was much lower. In Figure 5B, the average for five measurements does not always give a clear positive result (i.e., 10−4 M and 10−8 M) in the case of NRs. The lower homogeneity of the Au@AgNRs substrates can also be explained on the basis of the self-assembly distribution of Au@AgNRs. The application of NRs in SERS spectroscopy strongly relies on: (i) the orientation of the longitudinal and transverse bands of the NRs to the incident polarized light, (ii) to the arrangement of the nanorods with respect to each other (tip to tip, side to side, or side to tip), and (iii) to the adsorption of the molecules either on the tips or on the sides of the nanorod [12,47]. When the longitudinal band of the nanorods is parallel to the incident light, there is a higher enhancement than when the incident light is parallel to the longitudinal band [48]. As seen in this substrate, there was no control over the orientation of the nanorods, which means the resulting substrate was less homogenous than the one with the GNSs.
For the demonstration of the applicability of these substrates as biosensors in disease diagnosis and monitoring, we used the GNSs-paper substrates to analyze the lysed product of two different cell types, which are PBMCs (healthy cells) and SW480 (colorectal cancer cell line). For this purpose, ethanol and ultrasonication were used to lyse samples containing one million cells of each type. Despite it being possible to inject the lysed samples in the same way than when the 1NAT was used, to demonstrate the flexibility of use of these substrates, aliquots of the cell lysates were casted on top of the GNSs paper assemblies after de-bonding and let dry. The average of five measurements at different positions of the paper substrate, and, in three substrates, are shown in Figure 6. The different peaks can be assigned to different biochemical components and molecular structures, such as nucleic acids, proteins, and lipids. Table 1 shows a list of the assignment of Raman characteristic peaks for cellular components based on previous studies. The SERS spectrum of PBMCs vs. SW480 showed a significantly different profile.
Notably, the SW480 cells spectrum showed a higher enhancement on the peaks at 452, 515, 669, 752, 824, 1051, 1092, 1251, 1272, and 1458 cm−1. The prominent Raman peaks of the SW480 cells, compared with the PBMCs, at around 747 cm−1 and 1000–1300 cm−1 regions can be assigned to the molecular structures of the nucleic acids, proteins, and lipids (phospholipids) (Table 1). The higher intensities of these SERS peaks in SW480 cells demonstrated that there was an increase in the amount of proteins, as expected for cancer cells [49]. Many spectral differences between PBMCs and SW480 cells can be clearly observed, which suggests the feasibility of these substrates to differentiate between different cell populations. For example, within the field of liquid biopsy, and, more specifically, for the isolation of circulating tumor cells (CTCs) from whole blood, it is relevant to be able to distinguish between CTCs, white blood cells (WBCs), and red blood cells (RBCs) [50]. The isolation of CTCs from white blood cells and red bloods cells has been an intense field of study due to their clinical relevance [51].
In this context, being able to distinguish between different cell populations is of outmost relevance for the liquid biopsy field. These preliminary results need to be further developed, but are promising for the feasibility of this strategy as a potential diagnostic system. Toward this purpose, the authors plan the implementation of chemometric tools, as well as increase the number of samples to be analyzed, and eventually to validate the system with clinical samples.

4. Conclusions

In conclusion, this work presents a novel strategy for the fabrication of a SERS paper-based sensor with high sensitivity, with high homogeneity and reproducibility. This method allowed careful control over the generation of hot-spots, while avoiding the coffee ring effect of previously reported NP assemblies. In addition, the assembly process of the NPs on the paper by using this method takes less than 30 min and several substrates can be prepared simultaneously. These results confirm that this strategy for the fabrication of SERS paper substrates renders excellent efficiencies in terms of homogeneity, surface coverage, time, and portability. The proof-of-concept experiment allowed the differentiation of different cell populations by paving the way toward the development of advanced diagnosis tools based on nanotechnology.

Supplementary Materials

The following are available online at https://www.mdpi.com/2076-3417/9/7/1387/s1, Figure S1: UV-vis extinction spectra of the AuNRs and Au@AgNRs and of GNSs, Figure S2: SEM images at different magnifications for three paper substrates with GNSs fabricated in the same conditions, Figure S3: Plotted average SERS intensity (log10) and standard deviation for different concentrations of 1NAT for 5 measurements at different places of the GNSs substrate., Figure S4: Mapping (100 × 100 um; step size 4 um) obtained by plotting the SERS intensity of the characteristic band of the 1NAT at 1368 cm−1 for GNSs and Au@AgNRs.

Author Contributions

The authors of this publication have contributed to this work as follows: conceptualization, S.A.-C., A.T., and J.F.H.-R. Methodology, S.A.-C., A.T., and J.F.H.-R. Validation, A.T., J.F.H.-R., L.W., K.K., and S.A.-C. formal analysis, S.A.-C., A.T. Investigation, S.A.-C., A.T., and J.F.H.-R. Resources, A.T., J.F.H.-R., L.W., K.K., P.P., K.O., and S.A.-C. Data curation, S.A.-C. and A.T. Writing—original draft preparation, S.A.-C., A.T. Writing—review and editing, A.T., J.F.H.-R., L.W., K.K., P.P., K.O., L.D. and S.A.-C. Supervision, S.A.-C. Project administration, S.A.-C. and L.D. Funding acquisition, S.A.-C. and L.D.

Funding

This research was funded by the “Innovative Microfluidic Platform for Analysis of myeloid Leukemia blasts” project (030782) co-funded by FCT and the ERDF through COMPETE2020, the CANCER project (NORTE-01-0145-FEDER-000029) funded through the NORTE-45-2015-02 program and the NanoTrain4Growth II postdoctoral program funded by the E.U. Framework Program for Research and Innovation H2020 COFUND, Grant Agreement 713640.

Conflicts of Interest

The authors declare no conflict of interest.

References

  1. Kant, K.; Abalde-Cela, S. Surface-Enhanced Raman Scattering Spectroscopy and Microfluidics: Towards Ultrasensitive Label-Free Sensing. Biosensors 2018, 8, 62. [Google Scholar] [CrossRef] [PubMed]
  2. Aroca, R. Surface-Enhanced Vibrational Spectroscopy; John Wiley & Sons, Ltd.: Hoboken, NJ, USA, 2006; ISBN 978-0-471-60731-1. [Google Scholar]
  3. Kneipp, K.; Wang, Y.; Kneipp, H.; Perelman, L.T.; Itzkan, I.; Dasari, R.R.; Feld, M.S. Single molecule detection using surface-enhanced raman scattering (SERS). Phys. Rev. Lett. 1997, 78, 1667–1670. [Google Scholar] [CrossRef]
  4. Li, A.; Tang, L.; Song, D.; Song, S.; Ma, W.; Xu, L.; Kuang, H.; Wu, X.; Liu, L.; Chen, X.; Xu, C. A SERS-active sensor based on heterogeneous gold nanostar core–silver nanoparticle satellite assemblies for ultrasensitive detection of aflatoxinB1. Nanoscale 2016, 8, 1873–1878. [Google Scholar] [CrossRef] [PubMed]
  5. Xu, L.; Yin, H.; Ma, W.; Kuang, H.; Wang, L.; Xu, C. Ultrasensitive SERS detection of mercury based on the assembled gold nanochains. Biosens. Bioelectron. 2015, 67, 472–476. [Google Scholar] [CrossRef]
  6. Etchegoin, P.; Maher, R.; Cohen, L.; Hartigan, H.; Brown, R.J.; Milton, M.J.; Gallop, J. New limits in ultrasensitive trace detection by surface enhanced Raman scattering (SERS). Chem. Phys. Lett. 2003, 375, 84–90. [Google Scholar] [CrossRef]
  7. Li, W.; Zhao, X.; Yi, Z.; Glushenkov, A.M.; Kong, L. Plasmonic substrates for surface enhanced Raman scattering. Anal. Chim. Acta 2017, 984, 19–41. [Google Scholar] [CrossRef]
  8. Abalde-Cela, S.; Carregal-Romero, S.; Coelho, J.P.; Guerrero-Martínez, A. Recent progress on colloidal metal nanoparticles as signal enhancers in nanosensing. Adv. Colloid Interface Sci. 2016, 233, 255–270. [Google Scholar] [CrossRef] [PubMed]
  9. Hamon, C.; Liz-Marzán, L.M. Colloidal design of plasmonic sensors based on surface enhanced Raman scattering. J. Colloid Interface Sci. 2018, 512, 834–843. [Google Scholar] [CrossRef] [PubMed]
  10. LeRu, E.C.; Etchegoin, P. Principles of Surface-Enhanced Raman Spectroscopy; Elsevier: Amsterdam, The Netherlands, 2009; ISBN 9780444527790. [Google Scholar]
  11. Schlücker, S. Surface-Enhanced Raman Spectroscopy: Concepts and Chemical Applications. Angew. Chemie Int. Ed. 2014, 53, 4756–4795. [Google Scholar] [CrossRef] [PubMed]
  12. Kim, N.H.; Hwang, W.; Baek, K.; Rohman, M.R.; Kim, J.; Kim, H.W.; Mun, J.; Lee, S.Y.; Yun, G.; Murray, J.; et al. Smart SERS Hot Spots: Single Molecules Can Be Positioned in a Plasmonic Nanojunction Using Host–Guest Chemistry. J. Am. Chem. Soc. 2018, 140, 4705–4711. [Google Scholar] [CrossRef]
  13. Chen, A.; DePrince, A.E.; Demortière, A.; Joshi-Imre, A.; Shevchenko, E.V.; Gray, S.K.; Welp, U.; Vlasko-Vlasov, V.K. Self-Assembled Large Au Nanoparticle Arrays with Regular Hot Spots for SERS. Small 2011, 7, 2365–2371. [Google Scholar] [CrossRef]
  14. Sugawa, K.; Akiyama, T.; Tanoue, Y.; Harumoto, T.; Yanagida, S.; Yasumori, A.; Tomita, S.; Otsuki, J. Particle size dependence of the surface-enhanced Raman scattering properties of densely arranged two-dimensional assemblies of Au(core)–Ag(shell) nanospheres. Phys. Chem. Chem. Phys. 2015, 17, 21182–21189. [Google Scholar] [CrossRef]
  15. Wustholz, K.L.; Henry, A.-I.; McMahon, J.M.; Freeman, R.G.; Valley, N.; Piotti, M.E.; Natan, M.J.; Schatz, G.C.; Van Duyne, R.P. Structure−Activity Relationships in Gold Nanoparticle Dimers and Trimers for Surface-Enhanced Raman Spectroscopy. J. Am. Chem. Soc. 2010, 132, 10903–10910. [Google Scholar] [CrossRef] [PubMed]
  16. Tanoue, Y.; Sugawa, K.; Yamamuro, T.; Akiyama, T. Densely arranged two-dimensional silver nanoparticle assemblies with optical uniformity over vast areas as excellent surface-enhanced Raman scattering substrates. Phys. Chem. Chem. Phys. 2013, 15, 15802–15805. [Google Scholar] [CrossRef] [PubMed]
  17. Reguera, J.; Langer, J.; Jimé Nez De Aberasturi, D.; Liz-Marzá, L.M. Anisotropic metal nanoparticles for surface enhanced Raman scattering. This J. is Cite this Chem. Soc. Rev. 2017, 3866, 3866–3885. [Google Scholar] [CrossRef] [PubMed]
  18. Nery, E.W.; Kubota, L.T. Sensing approaches on paper-based devices: a review. Anal. Bioanal. Chem. 2013, 405, 7573–7595. [Google Scholar] [CrossRef] [PubMed]
  19. Lee, C.H.; Hankus, M.E.; Tian, L.; Pellegrino, P.M.; Singamaneni, S. Highly Sensitive Surface Enhanced Raman Scattering Substrates Based on Filter Paper Loaded with Plasmonic Nanostructures. Anal. Chem. 2011, 83, 8953–8958. [Google Scholar] [CrossRef] [PubMed]
  20. Betz, J.F.; Yu, W.W.; Cheng, Y.; White, I.M.; Rubloff, G.W. Simple SERS substrates: Powerful, portable, and full of potential. Phys. Chem. Chem. Phys. 2014, 16, 2224–2239. [Google Scholar] [CrossRef]
  21. Zhang, R.; Xu, B.-B.; Liu, X.-Q.; Zhang, Y.-L.; Xu, Y.; Chen, Q.-D.; Sun, H.-B. Highly efficient SERS test strips. Chem. Commun. 2012, 48, 5913–5915. [Google Scholar] [CrossRef] [PubMed]
  22. Yu, C.-C.; Chou, S.-Y.; Tseng, Y.-C.; Tseng, S.-C.; Yen, Y.-T.; Chen, H.-L. Single-shot laser treatment provides quasi-three-dimensional paper-based substrates for SERS with attomolar sensitivity. Nanoscale 2015, 7, 1667–1677. [Google Scholar] [CrossRef] [PubMed]
  23. Cheng, M.-L.; Tsai, B.-C.; Yang, J. Silver nanoparticle-treated filter paper as a highly sensitive surface-enhanced Raman scattering (SERS) substrate for detection of tyrosine in aqueous solution. Anal. Chim. Acta 2011, 708, 89–96. [Google Scholar] [CrossRef] [PubMed]
  24. Ngo, Y.H.; Li, D.; Simon, G.P.; Garnier, G. Gold Nanoparticle–Paper as a Three-Dimensional Surface Enhanced Raman Scattering Substrate. Langmuir 2012, 28, 8782–8790. [Google Scholar] [CrossRef] [PubMed]
  25. Polavarapu, L.; La Porta, A.; Novikov, S.M.; Coronado-Puchau, M.; Liz-Marzán, L.M. Pen-on-paper approach toward the design of universal surface enhanced Raman scattering substrates. Small 2014, 10, 3065–3071. [Google Scholar] [CrossRef] [PubMed]
  26. Yu, W.W.; White, I.M. Inkjet-printed paper-based SERS dipsticks and swabs for trace chemical detection. Analyst 2013, 138, 1020–1025. [Google Scholar] [CrossRef] [PubMed]
  27. Zhang, W.; Li, B.; Chen, L.; Wang, Y.; Gao, D.; Ma, X.; Wu, A. Brushing, a simple way to fabricate SERS active paper substrates. Anal. Methods 2014, 6, 2066–2071. [Google Scholar] [CrossRef] [Green Version]
  28. Huang, Z.; Nagpal, A.; Siddhanta, S.; Barman, I. Leveraging coffee-ring effect on plasmonic paper substrate for sensitive analyte detection using Raman spectroscopy. J. Raman Spectrosc. 2018, 49, 1552–1558. [Google Scholar] [CrossRef]
  29. Abalde-Cela, S.; Taladriz-Blanco, P.; De Oliveira, M.G.; Abell, C. Droplet microfluidics for the highly controlled synthesis of branched gold nanoparticles. Sci. Rep. 2018, 8. [Google Scholar] [CrossRef] [PubMed]
  30. Gómez-Graña, S.; Fernández-López, C.; Polavarapu, L.; Salmon, J.-B.; Leng, J.; Pastoriza-Santos, I.; Pérez-Juste, J. Gold Nanooctahedra with Tunable Size and Microfluidic-Induced 3D Assembly for Highly Uniform SERS-Active Supercrystals. Chem. Mater. 2015, 27, 8310–8317. [Google Scholar] [CrossRef]
  31. Senthil Kumar, P.; Pastoriza-Santos, I.; Rodríguez-González, B.; Javier García de Abajo, F.; Liz-Marzán, L.M. High-yield synthesis and optical response of gold nanostars. Nanotechnology 2008, 19, 015606. [Google Scholar] [CrossRef]
  32. Turkevich, J.; Stevenson, P.C.; Hillier, J. A study of the nucleation and growth processes in the synthesis of colloidal gold. Discuss. Faraday Soc. 1951, 11, 55–75. [Google Scholar] [CrossRef]
  33. Nikoobakht, B.; El-Sayed, M.A. Preparation and Growth Mechanism of Gold Nanorods (NRs) Using Seed-Mediated Growth Method. Chem. Mater. 2003, 15, 1957–1962. [Google Scholar] [CrossRef]
  34. Whitesides, G.M.; Stroock, A.D. Flexible Methods for Microfluidics. Phys. Today 2001, 54, 42–48. [Google Scholar] [CrossRef] [Green Version]
  35. Duffy, D.C.; McDonald, J.C.; Schueller, O.J.A.; Whitesides, G.M. Rapid Prototyping of Microfluidic Systems in Poly(dimethylsiloxane). Anal. Chem. 1998, 70, 4974–4984. [Google Scholar] [CrossRef]
  36. Abalde-Cela, S.; Gould, A.; Liu, X.; Kazamia, E.; Smith, A.G.; Abell, C. High-throughput detection of ethanol-producing cyanobacteria in a microdroplet platform. J. R. Soc. Interface 2015, 12. [Google Scholar] [CrossRef] [PubMed]
  37. Wu, M.; Li, P.; Zhu, Q.; Wu, M.; Li, H.; Lu, F. Functional paper-based SERS substrate for rapid and sensitive detection of Sudan dyes in herbal medicine. Spectrochim. Acta Part. A Mol. Biomol. Spectrosc. 2018, 196, 110–116. [Google Scholar] [CrossRef]
  38. Meng, Y.; Lai, Y.; Jiang, X.; Zhao, Q.; Zhan, J. Silver nanoparticles decorated filter paper via self-sacrificing reduction for membrane extraction surface-enhanced Raman spectroscopy detection. Analyst 2013, 138, 2090–2095. [Google Scholar] [CrossRef]
  39. Zhu, Y.; Li, M.; Yu, D.; Yang, L. A novel paper rag as ‘D-SERS’ substrate for detection of pesticide residues at various peels. Talanta 2014, 128, 117–124. [Google Scholar] [CrossRef]
  40. Villa, J.E.L.; dos Santos, D.P.; Poppi, R.J. Fabrication of gold nanoparticle-coated paper and its use as a sensitive substrate for quantitative SERS analysis. Microchim. Acta 2016, 183, 2745–2752. [Google Scholar] [CrossRef]
  41. Enustun, B.V.; Turkevich, J. Coagulation of Colloidal Gold. J. Am. Chem. Soc. 1963, 85, 3317–3328. [Google Scholar] [CrossRef]
  42. Wiley, J.H.; Atalla, R.H. Band assignments in the raman spectra of celluloses. Carbohydr. Res. 1987, 160, 113–129. [Google Scholar] [CrossRef]
  43. Wu, X.; Gao, S.; Wang, J.-S.; Wang, H.; Huang, Y.-W.; Zhao, Y. The surface-enhanced Raman spectra of aflatoxins: Spectral analysis, density functional theory calculation, detection and differentiation. Analyst 2012, 137, 4226–4234. [Google Scholar] [CrossRef] [PubMed]
  44. Armbruster, D.A.; Pry, T. Limit of blank, limit of detection and limit of quantitation. Clin. Biochem. Rev. 2008, 29 (Suppl. 1), S49–S52. [Google Scholar]
  45. Shrivastava, A.; Gupta, V. Methods for the determination of limit of detection and limit of quantitation of the analytical methods. Chronicles Young Sci. 2011, 2, 21–25. [Google Scholar] [CrossRef]
  46. Abalde-Cela, S.; Ho, S.; Rodríguez-González, B.; Correa-Duarte, M.A.; Álvarez-Puebla, R.A.; Liz-Marzán, L.M.; Kotov, N.A. Loading of exponentially grown LBL films with silver nanoparticles and their application to generalized SERS detection. Angew. Chemie-Int. Ed. 2009, 48, 5326–5329. [Google Scholar] [CrossRef]
  47. Šubr, M.; Petr, M.; Kylián, O.; Štěpánek, J.; Veis, M.; Procházka, M. Anisotropic Optical Response of Silver Nanorod Arrays: Surface Enhanced Raman Scattering Polarization and Angular Dependences Confronted with Ellipsometric Parameters. Sci. Rep. 2017, 7, 4293. [Google Scholar] [CrossRef] [PubMed]
  48. Alvarez-Puebla, R.A.; Agarwal, A.; Manna, P.; Khanal, B.P.; Aldeanueva-Potel, P.; Carbó-Argibay, E.; Pazos-Pérez, N.; Vigderman, L.; Zubarev, E.R.; Kotov, N.A.; Liz-Marzán, L.M. Gold nanorods 3D-supercrystals as surface enhanced Raman scattering spectroscopy substrates for the rapid detection of scrambled prions. Proc. Natl. Acad. Sci. 2011, 108, 8157–8161. [Google Scholar] [CrossRef] [Green Version]
  49. Kuppusamy, P.; Govindan, N.; Yusoff, M.M.; Ichwan, S.J.A. Proteins are potent biomarkers to detect colon cancer progression. Saudi J. Biol. Sci. 2017. [Google Scholar] [CrossRef] [PubMed]
  50. Alix-Panabières, C.; Pantel, K. Circulating Tumor Cells: Liquid Biopsy of Cancer. Clin. Chem. 2013, 59, 110–118. [Google Scholar] [CrossRef]
  51. Abalde-Cela, S.; Piairo, P.; Diéguez, L. The Significance of Circulating Tumour Cells in the Clinic. Acta Cytol. 2019, 1–13. [Google Scholar] [CrossRef]
  52. Li, S.; Zhang, Y.; Xu, J.; Li, L.; Zeng, Q.; Lin, L.; Guo, Z.; Liu, Z.; Xiong, H.; Liu, S. Noninvasive prostate cancer screening based on serum surface-enhanced Raman spectroscopy and support vector machine. Appl. Phys. Lett. 2014. [Google Scholar] [CrossRef]
  53. Cai, C.; Chen, R.; Lin, J.; Li, Y.; Feng, S. Micro-Raman spectroscopy of single leukemic cells. Chin. Opt. Lett. 2008, 6, 938–940. [Google Scholar]
  54. Lin, D.; Pan, J.; Huang, H.; Chen, G.; Qiu, S.; Shi, H.; Chen, W.; Yu, Y.; Feng, S.; Chen, R. Label-free blood plasma test based on surface-enhanced Raman scattering for tumor stages detection in nasopharyngeal cancer. Sci. Rep. 2014. [Google Scholar] [CrossRef] [PubMed]
  55. Feng, S.; Lin, J.; Cheng, M.; Li, Y.-Z.; Chen, G.; Huang, Z.; Yu, Y.; Chen, R.; Zeng, H. Gold Nanoparticle Based Surface-Enhanced Raman Scattering Spectroscopy of Cancerous and Normal Nasopharyngeal Tissues under Near-Infrared Laser Excitation. Appl. Spectrosc. 2009, 63, 1089–1094. [Google Scholar] [CrossRef] [PubMed]
  56. Lin, D.; Feng, S.; Pan, J.; Chen, Y.; Lin, J.; Chen, G.; Xie, S.; Zeng, H.; Chen, R. Colorectal Cancer Detection by Gold Nanoparticle Based Surface-Enhanced Raman Spectroscopy of Blood Serum and Statistical Analysis. Opt. Express 2011, 19, 13565–13577. [Google Scholar] [CrossRef]
  57. Feng, S.; Chen, R.; Lin, J.; Pan, J.; Chen, G.; Li, Y.; Cheng, M.; Huang, Z.; Chen, J.; Zeng Haishan, H. Nasopharyngeal cancer detection based on blood plasma surface-enhanced Raman spectroscopy and multivariate analysis. Biosens. Bioelectron. 2010, 25, 2414–2419. [Google Scholar] [CrossRef] [PubMed]
  58. Duraipandian, S.; Zheng, W.; Ng, J.; Low, J.J.H.; Ilancheran, A.; Huang, Z. In vivo diagnosis of cervical precancer using Raman spectroscopy and genetic algorithm techniques. Analyst 2011, 136, 4328–4336. [Google Scholar] [CrossRef] [PubMed]
  59. Lin, J.; Chen, R.; Feng, S.; Pan, J.; Li, Y.; Chen, G.; Cheng, M.; Huang, Z.; Yu, Y.; Zeng, H. A novel blood plasma analysis technique combining membrane electrophoresis with silver nanoparticle-based SERS spectroscopy for potential applications in noninvasive cancer detection. Nanomed. Nanotechnol. Biol. Med. 2011, 7, 655–663. [Google Scholar] [CrossRef] [PubMed]
  60. Chen Yong Kah, J.; Wei Kho, K.; Guat Leng Lee, C.; James Richard Sheppard, C.; Xiang Shen, Z.; Chee Soo, K.; Carolene Olivo, M. Early diagnosis of oral cancer based on the surface plasmon resonance of gold nanoparticles. Int. J. Nanomed. 2007, 2, 785–798. [Google Scholar]
Figure 1. Transmission electron microscopy images of (AC) Au nanostars (GNSs) and (DF) silver coated gold nanorods (Au@AgNRs) at increasing magnifications.
Applsci 09 01387 g001
Figure 2. Schematic representation of the fabrication of the hybrid PDMS-paper device (AC) injection and self-assembly of the NPs (D) Raman model molecule or lysed cells injection (E) final disassembly of the paper sensor for analysis (F).
Applsci 09 01387 g002
Figure 3. AutoCAD design showing the total area calculation for the controlled NP self-assembly (A,B) AutoCAD design of the reservoir used for NP assembly (i), PDMS-paper after NP injection (ii), paper showing the assembled NPs after de-bonding the PDMS (iii).
Applsci 09 01387 g003
Figure 4. SEM images of the assembled GNSs after system de-bonding at different magnifications on the PDMS part (AC) and on the paper substrate (DF).
Applsci 09 01387 g004
Figure 5. Results of the characterisation of the SERS substrates with the Raman model molecule 1NAT: SERS spectra of different concentrations of 1NAT on the surface of the SERS-paper substrate assembled with GNSs (A); SERS spectra of different concentrations of 1NAT on the surface of the SERS-paper substrate assembled with Au@AgNRs (B); photograph of the final assembled NPs after injection of the Raman model molecule (C); bright field image at 5× magnification of the self-assembled GNSs on the paper substrate (D); mapping obtained by plotting the SERS intensity of the characteristic band of the 1NAT at 1368 cm−1 (E) in the area marked by the orange square in (D) for the GNSs substrates.
Applsci 09 01387 g005
Figure 6. Spectrum of the paper (blank), and cell lysate from healthy (PBMCs) and cancer (SW480) cells, obtained by using the developed SERS paper substrate. Each spectrum showed is the average of five spectra taken at different positions of the substrate.
Applsci 09 01387 g006
Table 1. Assignment of the Raman vibrations corresponding to cell molecular components.
Raman Shift (cm−1)Vibrational ModePeak AssignmentReference
516S–S Disulfide stretchingProteins[52]
638–642C–S Stretch
C–C Twist
Tyrosine[53,54]
649C–C twisting modeD-glucose, lactose[55]
725–728δ(C–H)Adenine, coenzyme[52,56]
758 Tryptophan[53]
823Ring BreathingTyrosine[56],
813,
886
v (C–C–O)
v (C–O–H)
L-Serine, glutathione,
Glutathione, d-(C)-galactosamine
[57]
925–935C–C stretching mode,
C–C α helix
Proteins and collagen[58]
979–999 Phospholipids, glucose-I′-phosphate,
DNA (around 980 cm−1)
[53,58]
1046, 1048C–H beddingGlycogen: C–O, C–C[59],
[53]
1080–1099C–C stretching,
v(PO2), v(CC), v(COC),
Nucleic acids, phospholipids[58]
1094–1134C–N stretch,
C–C stretching
Lipids, D-mannos[53],
[54]
1206Ring vibrationTyrosine[56]
1240–1260C–N, N–HAmide III[58]
1269δ (=CH)Phospholipids[60]
1316–1329CH vibration,
CH2 twisting
DNA/RNA, lipids[55],
[52]
1331v(C–H)Nucleic acid bases[57]
1347CH3CH2
wagging
Tryptophan, adenine, guanine[52]
1400–1420CH3Proteins, amino acids (around 1414 cm−1)[58]
1441–1445δ(CH2), δ(CH3)Proteins,
Collagen and phospholipids
[52],
[57]
1607 Phenylalanine or Tyrosine[59]
1625–1699ν(C=O) Amide I (α-helix), collagen, Amide I[56,57,58]

