Nanoplasmonic Sensor Based on Surface Plasmon-Coupled Emission: Review


1
Functional Device Laboratory, Institute of Advanced Technology, Universiti Putra Malaysia, Serdange 43400UPM, Selangore, Malaysia
2
Department of Physics, Faculty of Science, Universiti Putra Malaysia, Serdang 43400UPM, Selangor, Malaysia
*
Author to whom correspondence should be addressed.
Appl. Sci. 2019, 9(7), 1497; https://doi.org/10.3390/app9071497
Submission received: 14 November 2018
/
Revised: 26 December 2018
/
Accepted: 3 January 2019
/
Published: 10 April 2019
(This article belongs to the Special Issue Plasmonic Nanosensors)
Abstract
:The surface plasmon resonance (SPR) technique is a powerful method to detect chemical molecules. Fluorescent spectroscopy is a subject of great interest in the field of material science and biology. Recently, some optical sensors, based on plasmonic properties of nanomaterial, were introduced to enhance the investigation of the interaction of molecular while detecting the low concentration of molecular. The surface plasmon-coupled emission (SPCE) technique is a merit and accurate method to evaluate the interaction of nanomaterials and molecular. SPCE is based on fluorescence properties of interest molecule, and the surface plasmon enhances the fluorescence signal. According to SPR theory, the condition of excitation of fluorophore could be used in obtaining the SPCE signal. SPCE can be used to detect toxic chemicals and investigate the human molecular. In this review, the theory, experimental setup, condition of SPCE, and role of metal nanoparticles in SPCE were reviewed. In the end, the application of SPCE was presented for detection and monitoring the chemical material, heavy metal, and biologic molecules.
1. Introduction
Surface plasmon resonance (SPR) is a unique phenomenon due to its charge density oscillation at the interface of metal and dielectric medium. Surface plasmon-coupled emission (SPCE) is a versatile [1] and powerful technique based on fluorescence and plasmonic properties of the nanostructure, or nanoplasmonic effect, of metal nanoparticles. The sensors, based on fluorescence, have extensive application for numerous assays in the biotechnology, medical diagnostics, and biological research. Fluorescence detection is a highly sensitive technique, and the sensitivity must be enhanced for detection of particular molecular in small size [2].
The fluorescence can be controlled through a semitransparent thin metal film and a thin layer with fluorescence property. Fluorophores in an excited state can generate surface plasmon. In turn, surface plasmon can excite the fluorophores, such as nanomaterial and quantum dots [3]. This technique is based on highly sensitive sensors, probes, and new devices for the detection and interaction of molecules with fluorophores. On the other hand, when the molecules bind to fluorophores, there will be a shift in the energy in the fluorescence spectrum or the surface plasmon wave. This is the basis of detection of chemical low-concentrations and investigations of biomolecular interaction. In this article, the plasmonic and fluorescence properties of nanomaterial, SPR theory, the concept of SPCE, and the sensor application of SPCE using nanomaterial are presented.
2. Photoluminescence
Photoluminescence is the molecular emission in higher wavelength or lower energy than absorption of light. This phenomenon is called fluorescence. The molecules are usually excited before emission, and there is a molecular transfer to the excited state [4]. The occurrence of photoluminescence, or phosphorescence, is determined by the situation of excited state and time delay. If there is rapid emission of low photon energy by the molecule, the fluorescence will occur with a radiative life time of about 10−8 s, whereas phosphorescence photon will be emitted later than 10−3 s [5].
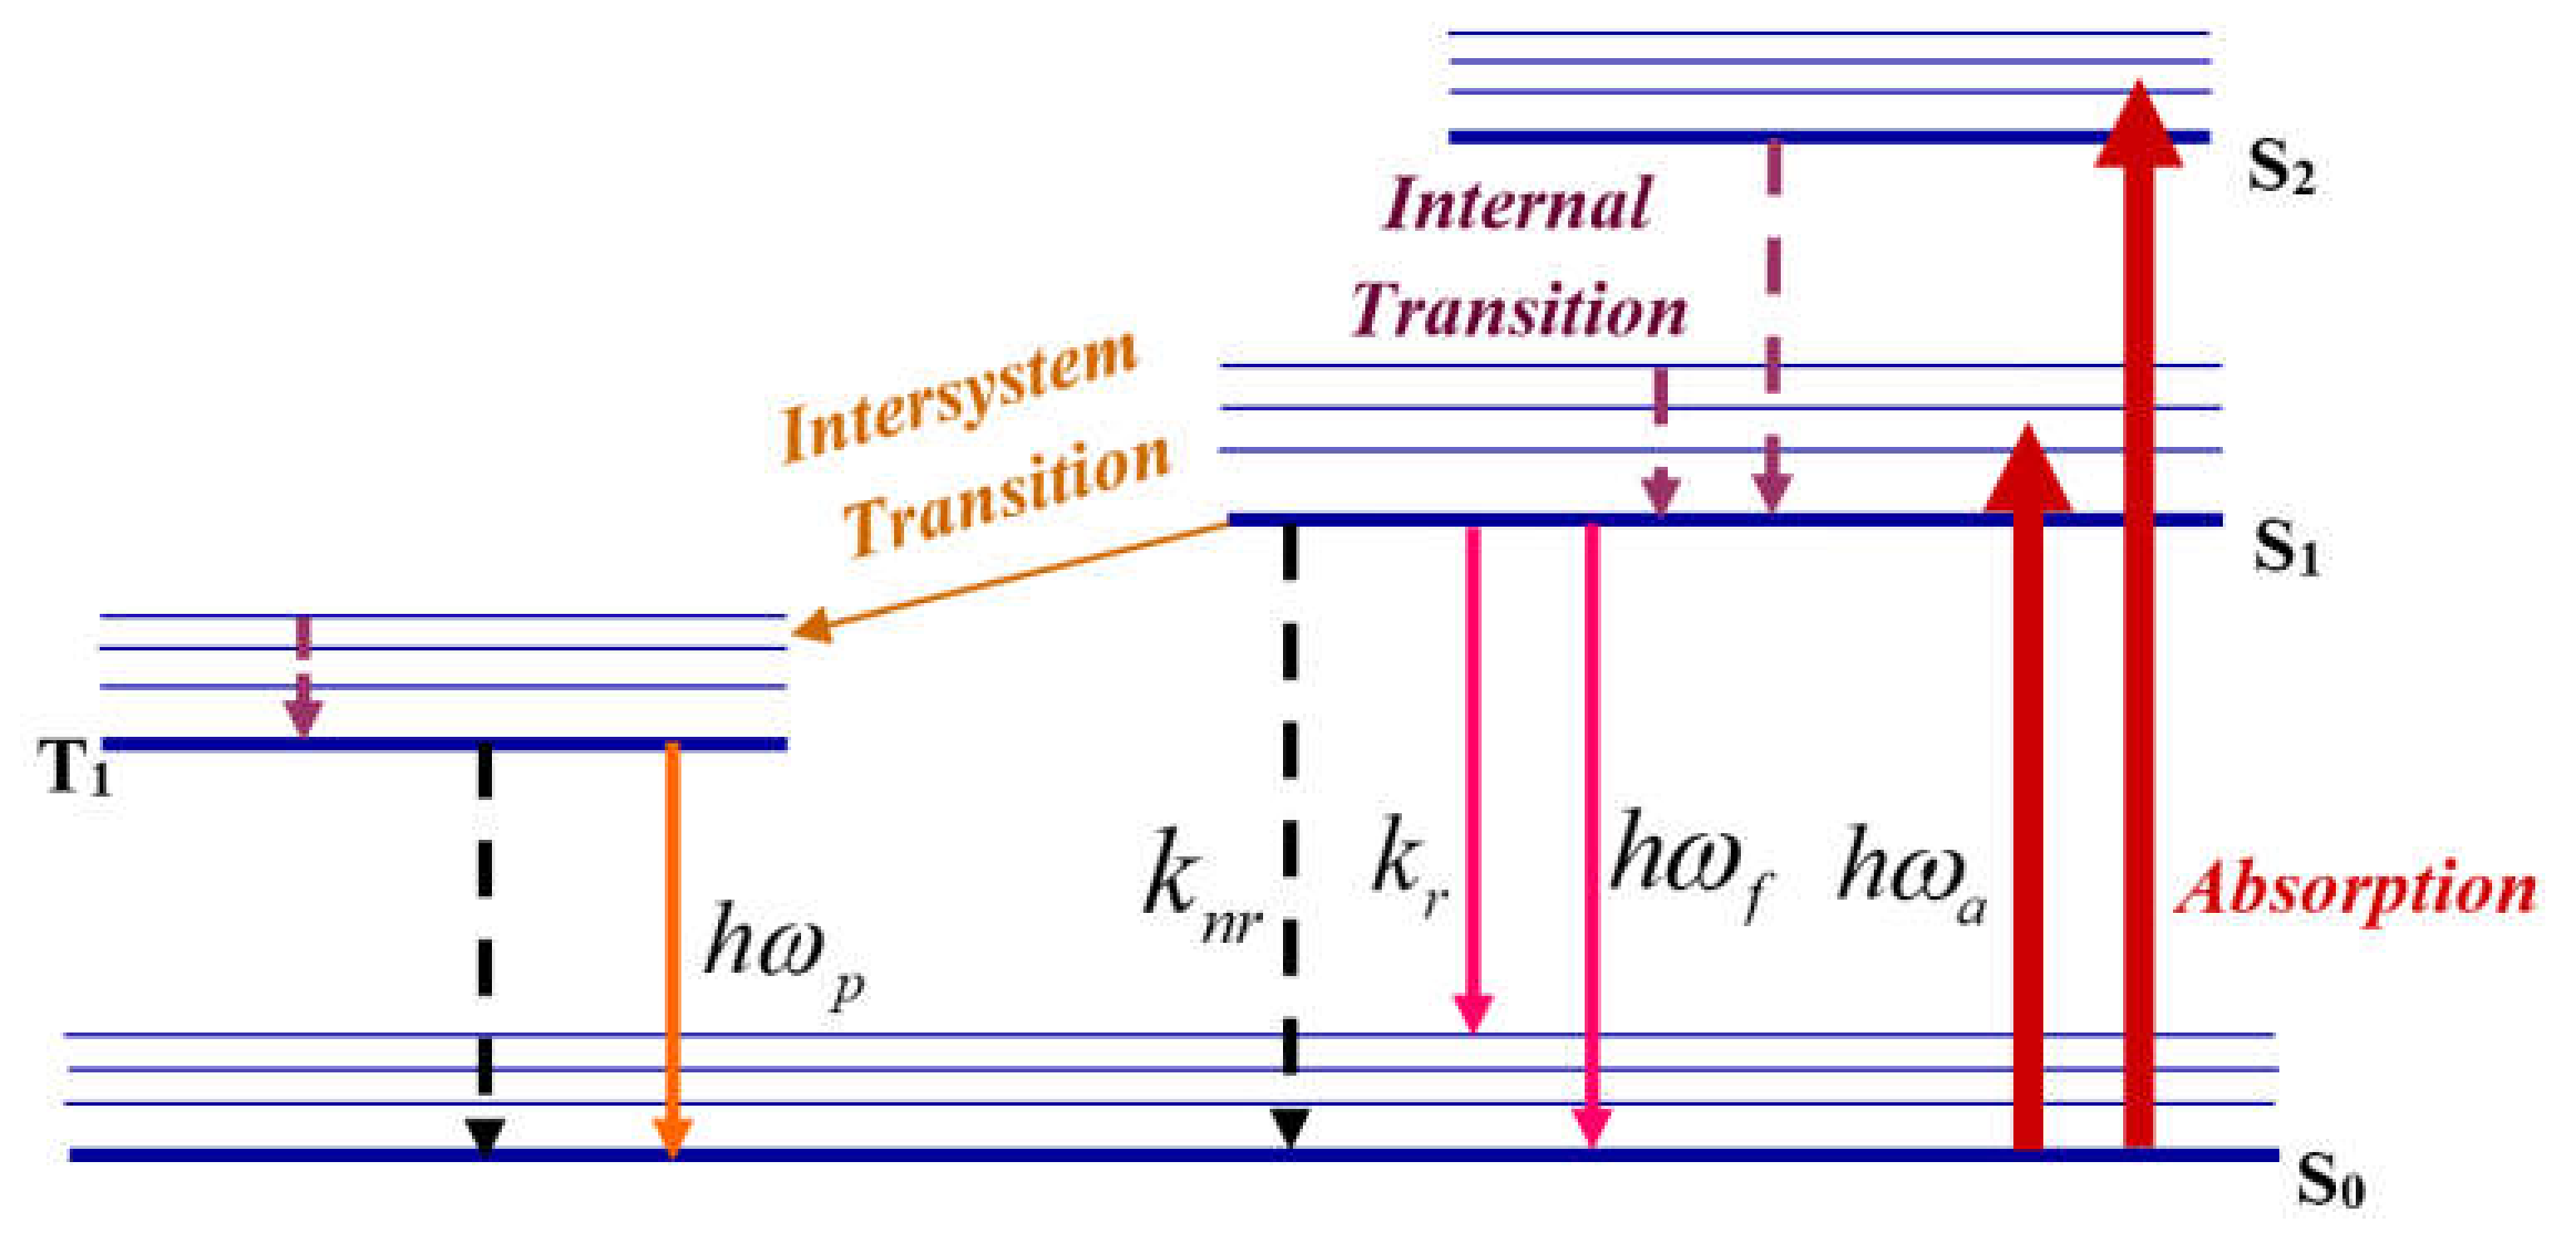
In the fluorescence process, a molecule absorbs high-energy photons and some molecules exit from the ground state to the vibrational or rotational excited state, depending on the energy level structure of the molecule. Sometimes, the electrons of ground state can absorb the energy of photons and the molecular changes to the electronic excited state. Figure 1 shows the energy level of a molecule. The emission in the range of UV to visible light corresponds to transition from the electronic excited state to the ground state, and the emission wavelength in the infrared range is due to transition of molecule between vibrational and rotational excited state to ground state [5].
Figure 1 shows the Jablonski diagram that depicts the absorption and emission of molecules. In the photoluminescence case, the molecules absorb the high-energy photon and remain excited from ground state (S0) to excited state (S1, S2) during 10−15 s (1fs). The molecular transition occurs rapidly to lower excited state (S1) during 10−12 s (1 ps).
The procedure of transition to ground state contains two processes as follows [6]: The first process is fluorescence transition, where the electrons change from excited state to ground state with a constant electron spin. This means that the electrons transfer between two singlet states during 10−8 s (0.1 ns) with the radiation process defined by radiative decay () parameter (Figure 1). This process can be gone along by a nonradiative transition defined by nonradiative decay parameter () that can be explained using internal or external quenching mechanism.
The second process is related to the production of the phosphorescence photons that can be explained by intersystem transition from singlet state (S1) to triplet state (T1). The intersystem transition causes the variation of the total spin of molecule that the triplet state has lower energy than singlet states. The triplet state contains sublevels, and the spin of electron o molecule is constant during the transition with the emission of photon or nonradiative decay. Moreover, the transition from triplet state to ground state occurs by emission of photon and change in the electron spin.
In the processes of fluorescence and phosphorescence, the energy of emitted photon is lower than the energy of excited photon. Therefore, the wavelength of emitted photon is longer than excited photon, which is the Stokes shift.
Quantum yield and lifetime are the significant parameters for evaluation of fluorescence that can be derived from Jablonski diagram, and they are based on radiative and nonradiative decays. Fluorescence quantum yield (Q) can be described by emitted photons and exited photons as follows [6]:
Typically, the fluorescence quantum yield is between 0 and 1. Because the fluorescence process is the Stokes transition process, the fluorescence quantum yield is always lower than unity.
Other parameter for the evaluation of the fluorescence emission is the lifetime of the excited state () which is the average time that the molecule remains in the excited state before the transition to ground state and is defined as follows:
3. Plasmonic and Nanoplasmonic
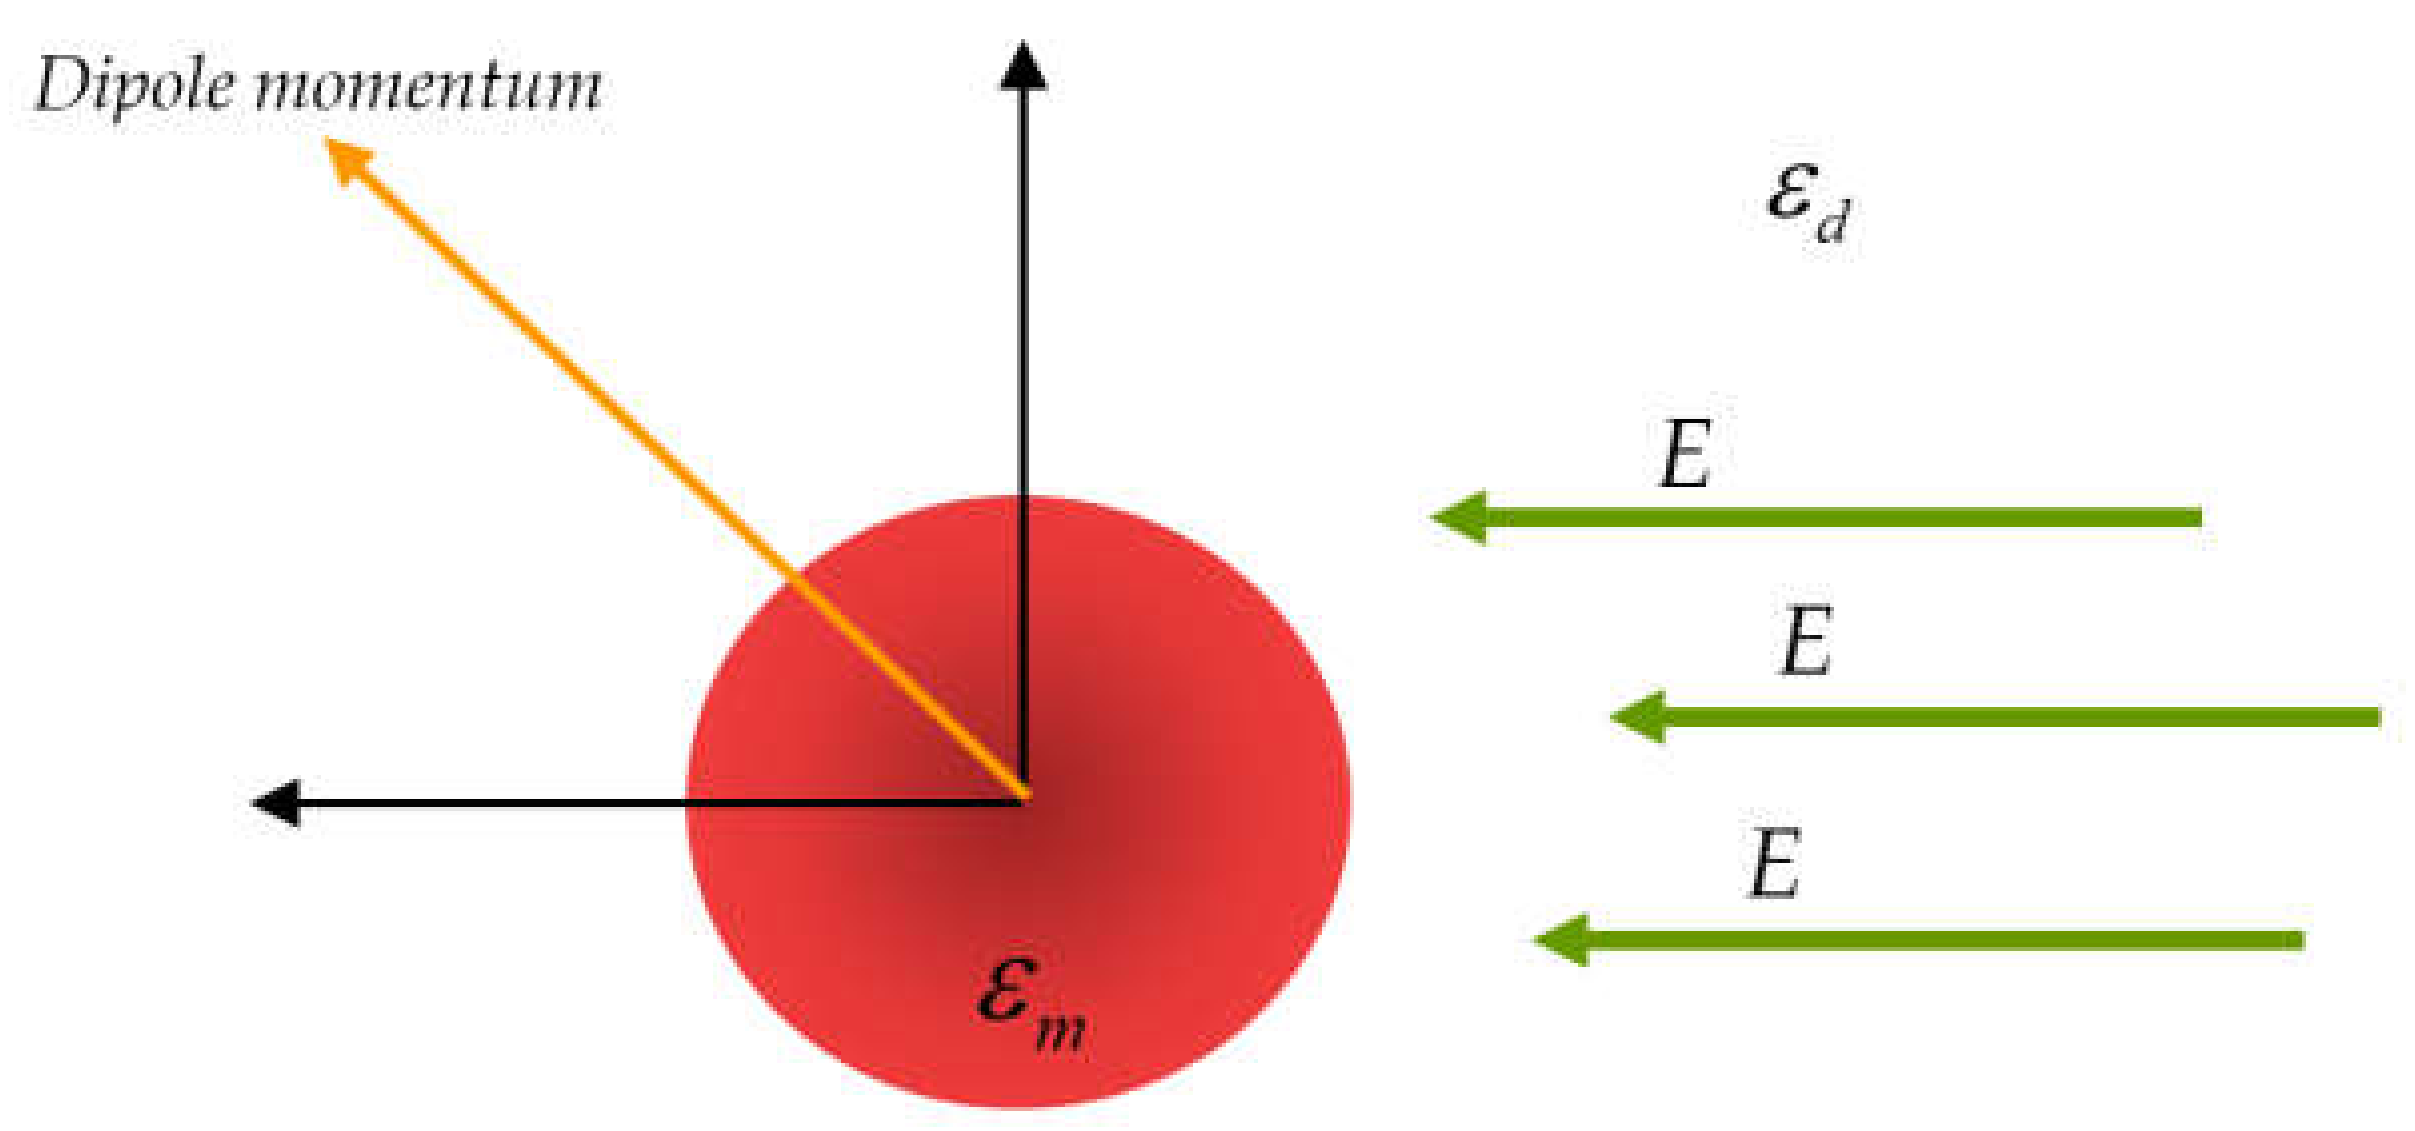
The collective oscillation of the free electron gas (charges) density is plasmon. On the other hand, plasmon is quasiparticles and a quantum of plasma oscillation. Plasmons can be obtained from the interaction of light and free charges. The topic, which is related to the application of this issue, is called plasmonic. Nanoplasmonic corresponds to charges density oscillation in nanomaterial, metal nanoparticle, metamaterials, and quantum dots. Sometimes, the light beam has an interaction with the charge density that is distributed on the surface of metal nanoparticles, thereby resulting in the absorption of light beam (Figure 2). This phenomenon, called localized surface plasmon resonance (LSPR) [7], is mainly used in explaining the UV-vis spectrum.
When the size of particle is smaller than the wavelength of the light, the charge distributed on the surface of metal cluster oscillates collectively with the light beam. The LSPR occurs when frequency of this oscillation is matched with the frequency of photons [8]. In this case, the unique absorption of UV-vis spectrum and Rayleigh scattering of light are observed in relation to plasmonic effect [9,10].
As mentioned above, the surface plasmon resonance occurs not only in the boundary of two materials with different dielectric sign, such as metal (gold or silver) and dielectric (glass), but also on the surface of metal cluster structure. When light incidents to the metal cluster in nano-size, the electrical field of electromagnetic wave interacts with free electron of metal cluster. The functions of the electric field and distribution of potential can be derived from Laplace equation in polar coordinate. Typically, the potential function is assumed of as follows:
where and are the radius part and angular parts (Legendre polynomials) of solution of Laplace equation, respectively. According to electromagnetism theory, the coefficient of Equation (3) will be calculated using boundary condition. To simplify the Equation (3), the potential of outside the metal cluster and inner one can be written as follows:
where and are the potential inside and outside of the metal cluster, respectively. If the boundary conditions are considered, the potential function for inside and outside the metal cluster will be derived as follows [11]:
The optical properties of metal cluster related to plasmonic effect can be justified in accordance with the potential of inside and outside of the metal cluster. The optical properties of metal nanoparticle and semiconductor depend on the plasmons. When the light beam interacts with materials, the electrical field of electromagnetic wave produces a force on the carrier charges in the material thereby inducing the dipole momentum in the material. If the particle size is smaller than the wavelength, the polarizability of the nanoparticle is [7]
where , , (), are polarizability, nanoparticle diameter, relative permittivity of the metal and surrounding medium. The optical response of the nanoparticle depends on polarizability. The strongest mode will be obtained when is near () or the denominator of Equation (8) is near to zero.
The total cross section is the combination of absorption and scattering cross section as follows:
4. Surface Plasmon Resonance
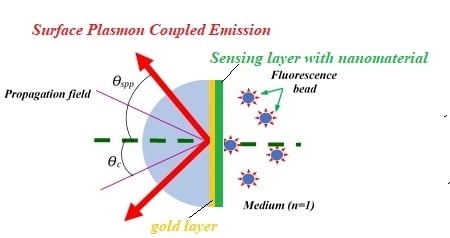
According to electromagnetism theory, electrical dipoles can radiate the evanescent wave in the far field. The amplitude of evanescent field decreases in the distance about the wavelength length from the source [12]. The evanescent field is observable in the near field. The evanescent wave can propagate in the medium with the refractive index smaller than that of the source medium. The excitation of evanescent wave occurs from propagation of light beam in the dense medium at the particular angle [12,13]. For example, if a gold layer is deposited on the surface of prism and the light beam passes through the prism, it can excite the evanescent wave and propagate in the layer that is placed after the gold thin film. Similarly, the evanescent wave will be excited when fluorescence emitted from the layer is placed at the other side of gold thin film. This phenomenon occurs in the layer with finite thickness and is SPCE [14].
For clarification of the mentioned phenomena, a system with three layers is presented in Figure 3, where the electric dipole is accommodated in the medium with unity refractive index. The gold layer with 50 nm thickness (nAu = 0.15 + 3.27i at the 560 nm wavelength) was coated on the glass slide (nprism = 1.515) [15]. The size of fluorescence ring is about 150 nm. The electromagnetic waves have two polarization modes, p-polarized and s-polarized, which are perpendicular one respect to the other, and called TM mode and TE mode [16].
In Figure 4, the transmission coefficient of the light amplitude of p-polarized and s-polarized as a function of the angle of emission in the glass medium is illustrated. It can be observed that within a specific angle of the glass medium, a dramatic absorption and emission of p-polarized light occurs, while the transmission and decay of the s-polarized wave occurs in the metal layer.
In order for SPCE to occur, there must be a correspondence between the magnitude of incident wave vector and wave number which can get a surface plasmonic wave excited:
where the wave number within the vacuum is denoted by when the wavelength is and are the permittivity of the medium where the dipole is embedded and the metal, respectively. Generally and [12,13], and , the wave number of surface plasma wave, frequently larger than the wave number within the medium where the dipole is immersed, denoted as ,
Based on this principle, the surface plasmonic of the metal can only be excited by the evanescent field is located close to an electric dipole. Therefore, the propagating waves pass under the angle smaller than the evanescent, whereas the passage of evanescent waves occurs under the angles that are larger than the anticritical angle ; the anti-critical angle can be shown as:
where the refractive index of air and glass are denoted by and [17,18,19,20]. The SPCE is excited by the evanescent field, whereas the propagating field simply passes through the metal layer. Thus, in this situation, the evanescent field will excite SPCE, while the propagating field will simply pass through the metal layer. Therefore, in this case, the combination of the SPCE wave and ordinary propagating waves makes the fluorescence [21,22].
The Fresnel theory can be used to evaluate the SPR signals. Typically, the fluorophore medium is coated on the gold layer and the medium with high refractive index, prism or hemisphere glass is located at the other side of gold layer. The main beam is in the Y-Z plan so the amplitude of reflected light (Ar) and incident (Ai) can be expressed as [23]:
where r123 is the amplitude reflection coefficient which depends on thickness (d) as follows:
where r12, r23 and k2x are the reflection coefficient of metal dielectric, the reflection coefficient of glass metal and the phase constant [24], respectively. The kix and kjx are
where the kz is the propagation constant (), and rij is
The reflectance is .
5. Surface Plasmon-Coupled Emission
The theory of SPCE is similar to SPR and can be derived from Maxwell and Fresnel equations [16,25,26,27] discussed in the previous section. On the other hand, SPCE is the reverse process of SPR, as seen in the angle dependent absorption of thin metal film and it has numerous applications in bioscience. SPCE sensors have high sensitivity, and the mechanism related to the coupling between fluorophores and surface plasmons due to exclusive collection of emitted light occurs only near the bio-affinity surface.
The surface plasmons are quantum phenomena due to collective oscillations of electron charge density at the interface between a gold or a silver layer and medium. The near field wave, which damps rapidly in the short length at the interface of metal layer and medium is the evanescent waves. If the gold or silver layer is coated on the surface of high refractive index glass, the plasmons, which are generated in the metal layer, can couple in the substrate. The strong evanescent field was induced using surface plasmon wave. It can excite a fluorophore with thickness of about 200 nm placed on top of gold or silver films in the aqueous solution.
The reverse process is also possible, i.e., the fluorophores that are near the gold and silver layer can be excited with laser beam. It can couple with surface plasmons in the metal layer and penetrate to substrate, while appearing at a sharply defined angle p-polarized form. This is SPCE, and it is closely related to SPR [25,28,29,30,31]. The coupling between the field of the excited fluorophore and the thin gold or silver layers results in the creation of surface plasmons. For a thin gold or silver layer and the high-refractive index of the glass substrate, the surface plasmons can couple to photons in the glass substrate and a surface plasmon is converted to light [2].
As mentioned above, two configuration setups for the SPCE suggest an experiment in Figure 5. The first configuration setup (Figure 5a) is Kretschmann configuration and the incident light passes through the prism. When the wave number of light and plasmons matches together, the resonance occurs in the oscillation of surface plasmons near the fluorophores, thereby resulting in the excitation of the fluorophores by the evanescent wave [32,33]. The second configuration is reverse Kretschmann (Figure 5b). The fluorophores can be excited directly by laser beam from the fluorophores side, and the near-field dipoles are coupled with surface plasmon on the metal layer, caucusing the direct emission in the prism with the wavelength near the excitation wave length, and the emission appears near the SPR angle with p-polarization. To compare the Kretschmann configuration with the reverse Kretschmann, the intensity of SPCE is very large and strong in the Kretschmann, since the excitation of fluorophores depends on the evanescent wave which is strong in the resonance. Typically, direction of emission, background, polarization of emission and distance of coupling are significant parameters for the evaluation of the SPCE signal and it depends on optical parameter of fluorophores, concentration of fluorophores and optical parameters of layers. Sometimes, the calculation of power flow needs to evaluate the response of fluorophores that must be derived from Sommerfeld identity. Hence, the power flow was achieved based on Parseval’s equation in the layers system, which was coated on the prism as follows [34]:
where , , are refractive index, refractive indices of first medium, and that corresponding to wave vector component in z-direction, respectively. , , and are the power flow in z direction, input power, electrical field coefficient for forward and backward electromagnetic component, respectively.
Figure 6 shows the penetration depth of evanescent field. A penetration depth of evanescent wave is a significant parameter for evaluating and designing the sensing layer in SPCE. The penetration depth is a function of incident angle and it is proportional to wavelength of incident light beam as follows [4,35]:
where and are the refractive indices of first and second medium, respectively. is the depth of evanescent wave in second dielectric medium [35].
Consequently, SPCE occurs in the interface between molecules and thin metal film and it is the outcome of the interaction in near field of radiating with biomolecule, chemical molecule and metal cluster. Hence, SPCE has been a subject of research in sensor and biosensor.
6. Physical Interaction of Surface Plasmon and Fluorophore
The cross-section of plasmonic-enhanced fluorescence from metal nanoparticle is . It depends on the emission of wavelengths (), the excitation wavelengths () and the average distance of molecular fluorophores from the gold thin layer (). The cross-section of plasmonic-enhanced fluorescence is as follows [36,37,38]:
where , and are the total enhanced fluorescence factor, enhanced fluorescence corresponds to evanescent wave and molecular fluorescence emission, respectively. is cross section related to fluorophore in air. In SPCE, it was observed that there was a rapid energy transfer between fluorophore and gold thin layer that is defined with . Equation (19) expresses that a balance in the increase of excitation rate and radiative decay rate during the procedure of SPCE was achieved. Moreover, the quenching effect of nonradiative energy from fluorophore to gold layer is in equilibrium with transfer energy to gold layer. These parameters depend on penetration of evanescent wave or the distance between the gold thin layer and the fluorophore [38,39].
7. The Effect of Nanomaterial in SPCE
Briefly, SPCE signals were obtained by inducing the surface plasmon resonance in the metal layer due to fluorescence emission of fluorophores. SPCE is used in microscopy and sensing the chemical and biochemical molecules. The SPCE response depends on fluorophore emission and the fluorescence emission enhancement is a subject of great interest in sensor and biosensing with high sensitivity. Nanomaterials such as gold nanoparticle, silver nanoparticle, zinc oxide nanoparticle, graphene quantum dots, and carbon quantum dots have the potential of enhancing the fluorescence emission of fluorophores. Gold and silver nanoparticles enhance the fluorescence via the interaction between the induced localized surface plasmon with excited state of fluorophores during two main processes [38,40]. First, the nonradiative emission occurs, and the excited state of fluorophores will be coupled with the localized surface plasmons, increasing the electrical field due to polarization of charge density on the surface of metal cluster. Second, the photon absorption of fluorophores located in gold or silver, is enhanced with electrical field around the nanoparticle [41,42]. Consequently, the population of excited state increases and the intensity of fluorescence emission is enhanced. This phenomenon is called metal-enhanced fluorescence (MEF).
8. Application of SPCE for Detection of Molecules
Fluorescence-based sensor is a significant and sensitive instrument for the detection of chemical material and biomolecules [41]. The SPCE-based sensors are devices that work by the interaction of surface plasmon and emission from fluorophores. Monitoring of biological interaction, display of the diagnostic signal, detection of glucose, oxygen, carbon dioxide, DNA, and toxic chemical are the subjects in the area of sensing and biosensing. The significant parameters are sensitivity, selectivity, response time and repeatability. The advantages of SPCE-based sensors include small volume for detection of chemical and biochemical materials, low background noise, and high-sensing limitations. Thus, a combination of fluorescence and SPR can provide a significant method of overcoming the limitations of other methods used in sensing the biomolecules and toxic chemicals. The SPCE was used to detect the oxygen using ruthenium dye, and the response time was about 100 ms. The sensor was inexpensive and highly sensitive for the detection and recognition of the low concentration of oxygen [43]. In 2012, Liu et al. used SPCE to detect the heavy metals and found that the SPCE of semiconductor quantum dots (QD), such as CdTe-QD, is adequately sensitive to recognize the mercury ions. They used the synthesis of the CdTe-QD in solution form attaching it to a gold layer and the limit of detection was 0.23 nmol L−1 [44]. In 2013, Mulpur et al. utilized the silver-α nano alumina thin film hybrids as a sensing layer for detection of heave metals. They arranged the reverse Kretschmann setup and exited the fluorophores using laser at 532 nm, and succeeded in measuring 1 µM concentration of Cd2+ [45].
The SPCE is a merit method to evaluate an antigen or an antibody as immunoassay. Immunoassay based on fluorescence spectroscopy is highly interesting method in biosensing [46,47] and medical diagnostics [37]. Immunoassay based on fluorescence is a sensitive and accurate method, but it has high background fluorescence and interaction with the signal [48]. The SPCE is an approach to overcome the interference of fluorescence signal with background fluorescence. In 2004, Matveeva et al. presented a biosensor based on SPCE and improved the SPCE sensor for immunoassay based on two wavelengths. They detected simultaneously two antibodies with different labels [34]. The SPCE was used to perform the fluorescence immunoassay method in human samples such as human serum and human blood using anti-rabbit immunoglobulin G (IG) on the surface of metallic thin layer including gold or silver films [2]. Recently, graphene oxide (GO) was used to enhance the fluorescence signal in immunoassay based on fluorescence sensor. The GO was coated on the surface of metal thin layer and the SPCE signal enhanced about 20 times compared to SPCE without GO layer. The reverse Kretschmann configuration was used to measure the human IgG with sensitivity of about 0.006 ng/mL [49]. The SPCE is a versatile physical technique for investigating DNA and human gene. DNA hybridization was measured using SPCE that depends on interaction of fluorophore and surface plasmon. When DNA hybridization occurs, the angle of SPCE signal will be changed and it monitors the interaction of DNA with another DNA biomolecule [50].
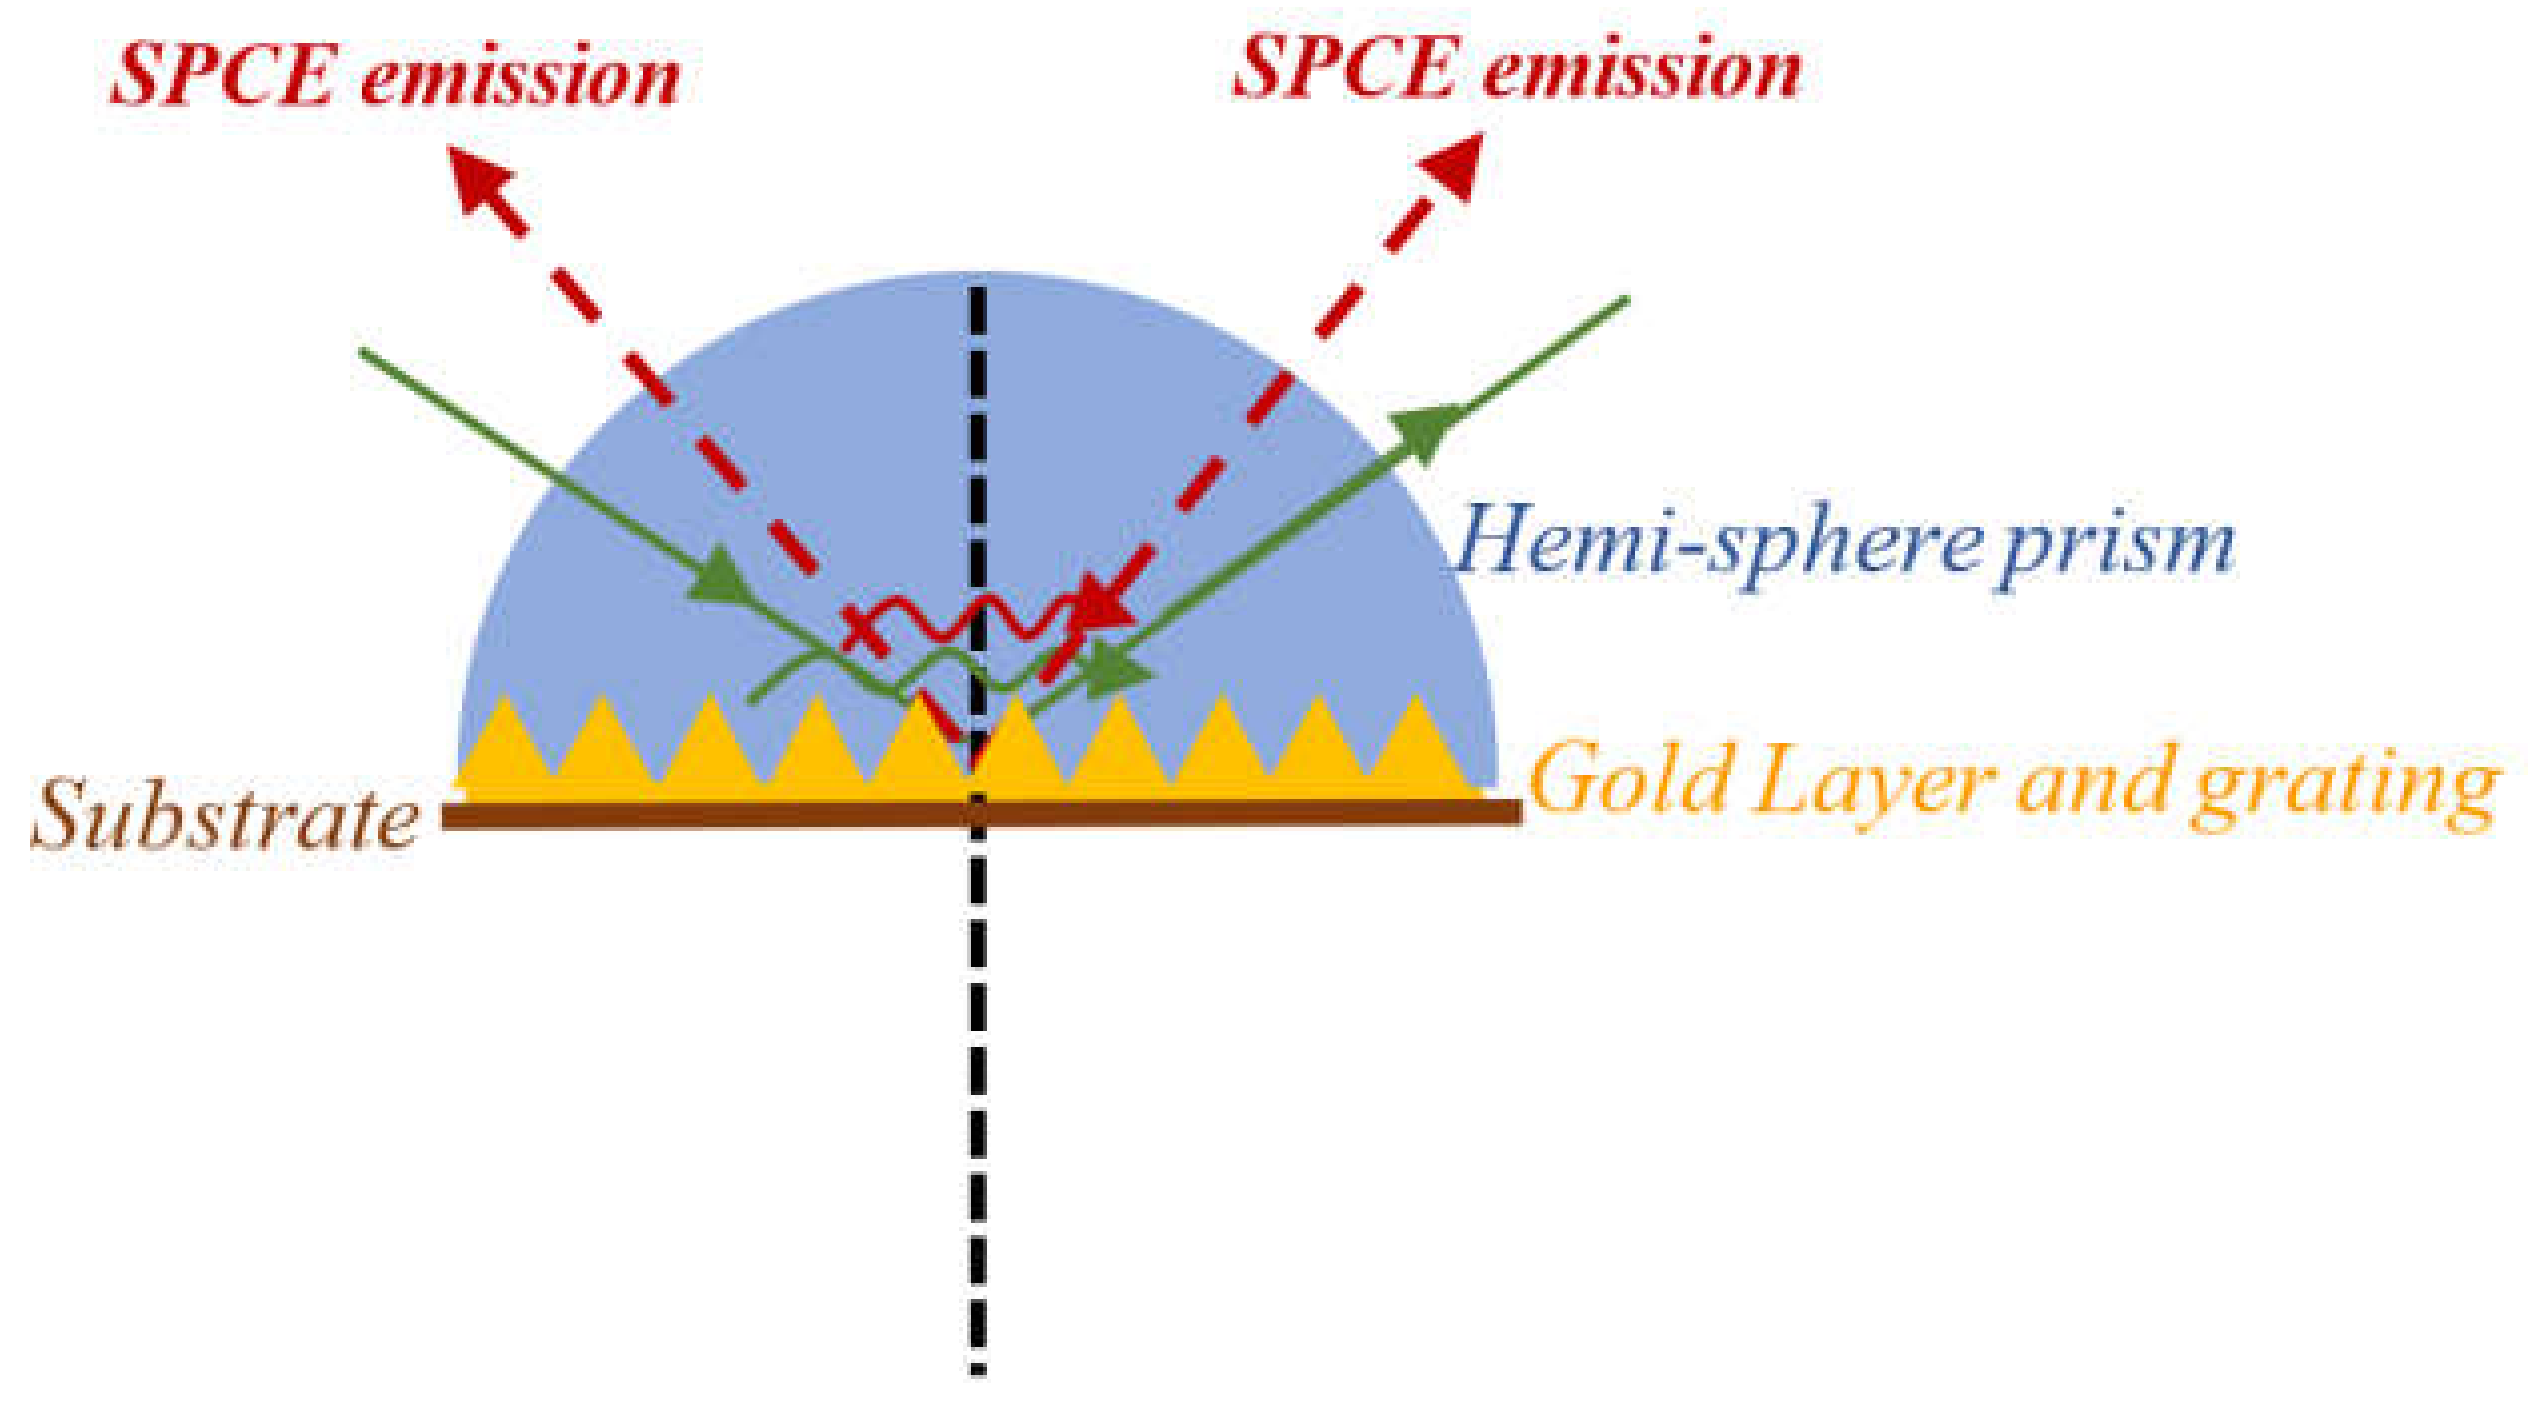
Recently, the grating surface plasmon couple emission was considered as a highly sensitive analytical tools to recognize the biological molecules. The basic concept is the same as SPCE based on prism coupling. Figure 7 shows a grating SPCE structure that the grating was used to excited the surface plasmons at the interface of metal and dielectric medium [51]. Many researchers were focused on the application of the grating SPCE to recognize the biological molecule. Wood et al. used the plasmonic grating to obtain the image single molecules [52]. They enhanced the emission intensity of fluorescence using surface plasmon resonance. The SPR excitation was used from a high-description digital grating frame to recognize different fluorophores by angular emission of biomolecules [52]. Gold grating SPCE sensor was considered to evaluate and detect some biomolecular. Yuk et al. used the gold grating SPCE to measure the human serum Ig using anti-mouse IgG as a receptor antibody. They were able to show incorporation of SPR and SPCE. The SPCE was a sensitive optical tool to analysis the biomaterial to compensation the sensitivity of SPR [51].
Essentially, SPR and SPCE sensor-based prism-coupling have advantages and disadvantages, such as being label-free and enzyme-free, being in real-time, high cost of suitable prism, and limitation in sensitivity. The plasmonic gratings are the appropriate and convenient candidate to improve the sensitivity of sensor and overcoming the mentioned disadvantages. Phase-interrogation technique based on nanostructure were presented to optimize and improve the SPR sensor response [53]. This method can be applied in a microfluidic chamber and is suitable for plasmonic sensor in a lab-on-a-chip platform and is easy for detection of procedures without any limitation to measure the volume [53].
9. Conclusions
The surface plasmon-coupled emission is based on excitation of fluorescence and enhances the surface plasmon wave. The SPCE signals were emitted by excitation of surface plasmon and interaction of surface plasmon with fluorophore in Kretschmann configuration or reverse one. The significant parameters are the distance between fluorescence bead and the gold layer and penetration depth of evanescent wave and the SPCE can be explained using surface plasmon resonance theory. The SPCE is used to detect heavy metal, investigate the DNA, and evaluate the antigen or antibody. Consequently, the SPCE is a versatile method for the evaluation of chemical and biomolecules.
Author Contributions
A.R.S., Y.W.F., and S.S.: Methodology; A.R.S.: Software; A.R.S. and Y.W.F.: Formal analysis; A.R.S., S.S.: Investigation; A.R.S.: Data curation; A.R.S.: Writing—original draft preparation; A.R.S.: Writing—review and editing; S.S.: Project administration; S.S.: Funding acquisition.
Acknowledgments
The authors acknowledge the Institute of Advanced Technology (ITMA), Universwiti Putra Malysia to support this project and provide the analytical facility. This research received no external funding.
Conflicts of Interest
The authors declare no conflicts of interest.
References
- Homola, J. Present and future of surface plasmon resonance biosensors. Anal. Bioanal. Chem. 2003, 377, 528–539. [Google Scholar] [CrossRef] [PubMed]
- Matveeva, E.G.; Gryczynski, Z.; Malicka, J.; Lukomska, J.; Makowiec, S.; Berndt, K.W.; Lakowicz, J.R.; Gryczynski, I. Directional surface plasmon-coupled emission: Application for an immunoassay in whole blood. Anal. Biochem. 2005, 344, 161–167. [Google Scholar] [CrossRef]
- Sadrolhosseini, A.R.; Rashid, S.A.; Noor, A.S.M.; Lim, H.N.; Lim, Y.S.; Mahdi, M.A. Reduced Graphene Oxide Decorated with Polypyrrole Nanoparticle Layer for Detection of Pyrene Using Surface Plasmon Resonance Technique. ECS J. Solid State Sci. Technol. 2016, 5, Q7–Q12. [Google Scholar] [CrossRef]
- Trnavsky, M. Surface Plasmon-Coupled Emission for Applications in Biomedical Diagnostics. Ph.D. Thesis, National Centre for Sensor Research, Dublin City University, Dublin, Ireland, 2009. [Google Scholar]
- Geddes, C.D. Surface Plasmon Enhanced, Coupled and Controlled Fluorescence, 1st ed.; John Wiley & Sons: New York, NY, USA, 2017. [Google Scholar]
- Lakowicz, J.R. Principles of Fluorescence Spectroscopy, 3rd ed.; Plenum Press: New York, NY, USA, 2006. [Google Scholar]
- Li, Y.; Jing, C.; Zhang, L.; Long, Y.-T. Resonance scattering particles as biological nanosensors in vitro and in vivo. Chem. Soc. Rev. 2012, 41, 632–642. [Google Scholar] [CrossRef]
- Stewart, M.E.; Anderton, C.R.; Thompson, L.B.; Maria, J.; Gray, S.K.; Rogers, J.A.; Nuzzo, R.G. Nanostructured plasmonic sensors. Chem. Rev. 2008, 108, 494–521. [Google Scholar] [CrossRef]
- Eustis, S.; El-Sayed, M.A. Why gold nanoparticles are more precious than pretty gold: Noble metal surface plasmon resonance and its enhancement of the radiative and nonradiative properties of nanocrystals of different shapes. Chem. Soc. Rev. 2006, 35, 209–217. [Google Scholar] [CrossRef]
- Daniel, M.-C.; Astruc, D. Gold nanoparticles: Assembly, supramolecular chemistry, quantum- size-related properties, and applications toward biology, catalysis, and nanotechnology. Chem. Rev. 2004, 104, 293–346. [Google Scholar] [CrossRef] [PubMed]
- Long, Y.-T.; Jing, C. Localized Surface Plasmon Resonance Based Nanobiosensors, 1st ed.; Springer: Berlin/Heidelberg, Germany, 2014. [Google Scholar]
- Arnoldus, H.F.; Foley, J.T. Transmission of dipole radiation through interfaces and the phenomenon of anti-critical angles. J. Opt. Soc. Am. A 2004, 21, 1109–1117. [Google Scholar] [CrossRef]
- Török, P. Propagation of electromagnetic dipole waves through dielectric interfaces. Opt. Lett. 2000, 25, 1463–1465. [Google Scholar] [CrossRef]
- Lakowicz, J.R.; Malicka, J.; Gryczynski, I.; Gryczynski, Z. Directional surface plasmon-coupled emission: A new method for high sensitivity detection. Biochem. Biophys. Res. Commun. 2003, 307, 435–439. [Google Scholar] [CrossRef]
- Tang, W.T.; Chung, E.; Kim, Y.-H.; So, P.T.; Sheppard, C.J. Investigation of the point spread function of surface plasmon-coupled emission microscopy. Opt. Express 2007, 15, 4634–4646. [Google Scholar] [CrossRef] [PubMed]
- Raether, H. Surface Plasmons on Smooth and Rough Surfaces and on Gratings, 1st ed.; Springer: Berlin/Heidelberg, Germany, 1988. [Google Scholar]
- Sadrolhosseini, A.R.; Moksin, M.M.; Yunus, W.M.M.; Talib, Z.A.; Abdi, M.M. Surface Plasmon Resonance Detection of Copper Corrosion of Biodiesel Using Polypyrrole-Chitosan Layer Sensor. Opt. Rev. 2011, 18, 331–337. [Google Scholar] [CrossRef]
- Lukosz, W. Light emission by magnetic and electric dipoles close to a plane dielectric interface. III. Radiation patterns of dipoles with arbitrary orientation. J. Opt. Soc. Am. 1979, 69, 1495–1503. [Google Scholar] [CrossRef]
- Lukosz, W.; Kunz, R. Light emission by magnetic and electric dipoles close to a plane dielectric interface. II. Radiation patterns of perpendicular oriented dipoles. J. Opt. Soc. Am. 1977, 67, 1615–1619. [Google Scholar] [CrossRef]
- Lukosz, W. Light emission by multipole sources in thin layers. I. Radiation patterns of electric and magnetic dipoles. J. Opt. Soc. Am. 1981, 71, 744–754. [Google Scholar] [CrossRef]
- Ge, B.; Zhu, L.; Kuang, C.; Zhang, D.; Fang, Y.; Ma, Y.; Liu, X. Fluorescence emission difference with defocused surface plasmon-coupled emission microscopy. Opt. Express 2015, 23, 32561–32572. [Google Scholar] [CrossRef]
- Sadrolhosseini, A.R.; Noor, A.S.M.; Moksin, M.M. Application of Surface Plasmon Resonance Based on Metal Nanoparticle. In Plasmonics—Principles and Applications; Kim, K.Y., Ed.; Intech: London, UK, 2012; pp. 253–282. [Google Scholar]
- Sadrolhosseini, A.R. Surface Plasmon Resonance Characterization of Biodiesel. Ph.D. Thesis, Department of Physics, Universiti Putra Malaysia, Seri Kembangan, Malaysia, 2011. [Google Scholar]
- Homola, J. Surface Plasmon Resonance Based Sensors; Springer: Berlin/Heidelberg, Germany, 2006; pp. 26–31. [Google Scholar]
- Raether, H. Surface plasma oscillations and their applications. In Physics of Thin Films, Advances in Research and Development; Hass, G., Francombe, M.H., Hoffman, R.W., Eds.; Academic Press: New York, NY, USA, 1977; pp. 145–261. [Google Scholar]
- Salamon, Z.; Macleod, H.A.; Tollin, G. Surface plasmon resonance spectroscopy as a tool for investigating the biochemical and biophysical properties of membrane protein systems. I: Theoretical principles. Biochim. Biophys. Acta 1997, 1331, 117–129. [Google Scholar] [CrossRef]
- Melendez, J.; Carr, R.; Bartholomew, D.U.; Kukanskis, E.; Elkind, J.; Yee, S.; Furlong, C.; Woodbury, R. A commercial solution for surface plasmon sensing. Sens. Actuators B Chem. 1996, 35–36, 212–216. [Google Scholar] [CrossRef]
- Lakowicz, J.R. Radiative decay engineering: III. Surface plasmon coupled directional emission. Anal. Biochem. 2004, 324, 153–169. [Google Scholar] [CrossRef] [PubMed]
- Gryczynski, I.; Malicka, J.; Gryczynski, Z.; Lakowicz, J.R. Radiative decay engineering: IV. Experimental studies of surface plasmon coupled directional emission. Anal. Biochem. 2004, 324, 170–182. [Google Scholar] [CrossRef]
- Pockrand, I. Surface plasma oscillations at silver surfaces with thin transparent and absorbing coatings. Surf. Sci. 1987, 72, 577–588. [Google Scholar] [CrossRef]
- Lakowicz, J.R. Radiative decay engineering: V. Metal-enhanced Fuorescence and plasmon emission. Anal. Biochem. 2005, 337, 171–194. [Google Scholar] [CrossRef]
- Matveeva, E.; Malicka, J.; Gryczynski, I.; Gryczynski, Z.; Lakowicz, J.R. Multi-wavelength immunoassays using surface plasmon-coupled emission. Biochem. Biophys. Res. Commun. 2004, 313, 721–726. [Google Scholar] [CrossRef]
- Liebermann, T.; Knoll, W. Surface-plasmon field-enhanced fluorescence spectroscopy. Colloids Surf. 2000, 171, 115–130. [Google Scholar] [CrossRef]
- Gryczynski, Z.; Matveeva, E.G.; Calander, N.; Zhang, J.; Lakowicz, J.R.; Gryczynski, I. Surface Plasmon Nanophotonics; Brongersma, M.L., Kik, P.G., Eds.; Springer: Dordrecht, The Netherlands, 2007. [Google Scholar]
- Schasfoort, R.B.M.; Tudos, A.J. Handbook of Surface Plasmon Resonance; RSC Publishing: Cambridge, UK, 2008; p. 15. [Google Scholar]
- Galloway, C.M.; Etchegoin, P.G.; Le Ru, E.C. Ultrafast Nonradiative Decay Rates on Metallic Surfaces by Comparing Surface-Enhanced Raman and Fluorescence Signals of Single Molecules. Phys. Rev. Lett. 2009, 103, 063003. [Google Scholar] [CrossRef]
- Johansson, P.; Xu, H.X. Surface-enhanced Raman scattering and fluorescence near metal nanoparticles. Phys. Rev. B. 2005, 72, 035427. [Google Scholar] [CrossRef]
- Dong, J.; Zhang, Z.; Zheng, H.; Sun, M. Recent Progress on Plasmon-Enhanced Fluorescence. Nanophotonics 2015, 4, 472–490. [Google Scholar] [CrossRef]
- Itoh, T.; Iga, M.; Tamaru, H.; Yoshida, K.; Biju, V. Quantitative evaluation of blinking in surface enhanced resonance scattering and fluorescence by electromagnetic mechanism. J. Chem. Phys. 2012, 136, 024703. [Google Scholar] [CrossRef]
- Geddes, C.D. Metal-Enhanced Fluorescence; John Wiley & Sons. Inc.: Hoboken, NJ, USA, 2010. [Google Scholar]
- Asian, K.; Previte, M.J.; Zhang, Y.; Geddes, C.D. Surface plasmon coupled fluorescence in the ultraviolet and visible spectral regions using zinc thin films. Anal. Chem. 2008, 80, 7304–7312. [Google Scholar]
- Asian, K.; Holley, P.; Geddes, C.D. Metal-enhanced fluorescence from silver nanoparticle-deposited polycarbonate substrates. J. Mater. Chem. 2006, 16, 2846–2852. [Google Scholar]
- Smith, D.S.; Kostov, Y.; Rao, G. SPCE-based sensors: Ultrafast oxygen sensing using surface plasmon-coupled emission from ruthenium probes. Sens. Actuators B 2007, 127, 432–440. [Google Scholar] [CrossRef]
- Liu, X.-Q.; Liu, Q.; Cao, S.-H.; Cai, W.-P.; Weng, Y.-H.; Xie, K.-X.; Li, Y.-Q. Directional surface plasmon-coupled emission of CdTe quantum dots and its application in Hg(II) sensing. Anal. Methods 2012, 4, 3956–3960. [Google Scholar] [CrossRef]
- Mulpur, P.; Patnaik, S.; Chunduri, A.; Rattan, T.M.; Rao, A.M.; Kamisetti, V. Detection of Cd2+ Ions Using Surface Plasmon Coupled Emission on Engineered Silver-α Nano Alumina Thin Film Hybrids. Soft Nanosci. Lett. 2013, 3, 27–31. [Google Scholar] [CrossRef]
- Vo-Dinh, T.; Sepaniak, M.J.; Griffin, G.D.; Alarie, J.P. Immunosensors: Principles and applications. ImmunoMethods 1993, 3, 85–92. [Google Scholar] [CrossRef]
- Chen, C.; Zhao, J.; Lu, Y.; Sun, J.; Yang, X. Fluorescence Immunoassay Based on the Phosphate-Triggered Fluorescence Turn-on Detection of Alkaline Phosphatase. Anal. Chem. 2018, 90, 3505–3511. [Google Scholar] [CrossRef]
- Tetin, S.Y.; Stroupe, S.D. Antibodies in diagnostic applications. Curr. Pharm. Biotechnol. 2004, 5, 9–16. [Google Scholar] [CrossRef]
- Xie, K.-X.; Cao, S.-H.; Wang, Z.-C.; Weng, Y.-H.; Huo, S.-X.; Zhai, Y.-Y.; Chen, M.; Pan, X.-H.; Li, Y.-Q. Graphene oxide-assisted surface plasmon coupled emission for amplified fluorescence immunoassay. Sens. Actuators B 2017, 253, 804–808. [Google Scholar] [CrossRef]
- Malicka, J.; Gryczynski, I.; Gryczynski, Z.; Lakowicz, J.R. Use of Surface Plasmon-Coupled Emission to Measure DNA Hybridization. J. Biomol. Screen. 2004, 9, 208–215. [Google Scholar] [CrossRef]
- Yuk, J.S.; Gibson, G.N.; Rice, J.M.; Guignonc, E.F.; Lynes, M.A. Analysis of immunoarrays using a gold grating-based dual mode surface plasmon-coupled emission (SPCE) sensor chip. Analyst 2012, 137, 2574–2582. [Google Scholar] [CrossRef]
- Wood, A.; Mathai, C.J.; Gangopadhyay, K.; Grant, S.; Gangopadhyay, S. Single-Molecule Surface Plasmon-Coupled Emission with Plasmonic Gratings. ACS Omega 2017, 2, 2041–2045. [Google Scholar] [CrossRef]
- Rossi, S.; Gazzola, E.; Capaldo, P.; Borile, G.; Romanato, F. Grating-Coupled Surface Plasmon Resonance (GC-SPR) Optimization for Phase-Interrogation Biosensing in a Microfluidic Chamber. Sensors 2018, 18, 1621. [Google Scholar] [CrossRef]
Figure 1.
Jablonski diagram showing the processes of fluorescence and phosphorescence.

Figure 2.
Metal cluster in electrical field.

Figure 3.
Demonstration of surface plasmon-coupled emission (SPCE).

Figure 4.
Demonstration of TE and TM mode.

Figure 5.
The surface plasmon-coupled emission set up is presented in two configurations: (a) Kretschmann configuration with direct excitation of surface plasmon, the light beam generates the surface plasmon wave and surface plasmon wave will excite the fluorescence; (b) revers Kretschmann configuration, the surface plasmon is exited using the fluorescence emitted from molecules and it excites the surface plasmon wave.

Figure 6.
Scheme of surface plasmon wave and penetration depth of evanescent wave.

Figure 7.
Scheme of SPCE based on grating.

© 2019 by the authors. Licensee MDPI, Basel, Switzerland. This article is an open access article distributed under the terms and conditions of the Creative Commons Attribution (CC BY) license (http://creativecommons.org/licenses/by/4.0/).
Share and Cite
MDPI and ACS Style
Sadrolhosseini, A.R.; Shafie, S.; Fen, Y.W. Nanoplasmonic Sensor Based on Surface Plasmon-Coupled Emission: Review. Appl. Sci. 2019, 9, 1497. https://doi.org/10.3390/app9071497
AMA Style
Sadrolhosseini AR, Shafie S, Fen YW. Nanoplasmonic Sensor Based on Surface Plasmon-Coupled Emission: Review. Applied Sciences. 2019; 9(7):1497. https://doi.org/10.3390/app9071497
Chicago/Turabian StyleSadrolhosseini, Amir Reza, Suhaidi Shafie, and Yap Wing Fen. 2019. "Nanoplasmonic Sensor Based on Surface Plasmon-Coupled Emission: Review" Applied Sciences 9, no. 7: 1497. https://doi.org/10.3390/app9071497
Note that from the first issue of 2016, this journal uses article numbers instead of page numbers. See further details here.