Application of the Non-Contact Video Gauge on the Mechanical Properties Test for Steel Cable at Elevated Temperature

1
College of Civil Engineering; Nanjing Tech University, Nanjing 211800, China
2
Department of Civil and Environmental Engineering, National University of Singapore, Singapore 117575, Singapore
*
Author to whom correspondence should be addressed.
Appl. Sci. 2019, 9(8), 1670; https://doi.org/10.3390/app9081670
Submission received: 18 March 2019
/
Revised: 15 April 2019
/
Accepted: 18 April 2019
/
Published: 23 April 2019
(This article belongs to the Special Issue Advances in Digital Image Correlation (DIC))
Abstract
:As the limit of traditional contact measurement, it is difficult to precisely measure the steel cables twisted by a branch of wires especially at elevated temperature. In this paper the strain-stress relationships of S355 and S690 structural steel, 1860 MPa steel cable twisted by seven wires have been measured by the strain gauge, extensometer and non-contact video gauge at ambient temperature and elevated temperature, respectively. Comparison of the stress-strain curves gotten by different measuring technology, it indicates that the non-contact video gauge can provide a more efficient and reliable database than the strain gauge as well as extensometer, especially at an elevated temperature. It is worth noting that the non-contact video gauge can capture not only the full range of stress-strain curves of steel cables, but is also efficient for the specimens with a complex shape.
1. Introduction
In order to improve the reality of a structural response for pre-tensioned steel structures exposed to fire by using numerical simulation, it is very important to capture the full range of the stress-strain relationship at elevated temperature for steel cables, which are always with a complex shape. It is well known that the strain gauge can accurately capture the stress-strain relationship for steel material at ambient temperature, but cannot at an elevated temperature. In previous test, most of the stress-strain relationships of steel material have been tested by extensometers at an elevated temperature. The brittle ceramic arms of an extensometer had to be removed before the ultimate strength in order to prevent being broken due to the limit measuring range. Thus, it can only capture the partial range of the stress-strain curve before the ultimate strength at an elevated temperature [1]. Although the external mechanical device with linear variable displacement transducer can trace the full range of the stress-strain curve at an elevated temperature, the strain resulted from this kind of measurement device is the average strain, which is different from the engineering strain. Furthermore, it is difficult to grip a group of wires in a tensile test due to the complex surface of a steel cable twisted by a branch of wire. The displacement between the front end of an arm and the surface of the specimen always occurred, especially for the test object with a complex geometrical surface such as a steel cable [2].
Recently, a charge-coupled device camera (CCDC) system, which has been improved by the digital image correlation method (DICM), has been used to measure the strain in the test coupon subjected to tension. A computer program based on this correlation method was developed for the calculation of the displacement components and the deformation gradients of an object surface due to deformation [3,4]. Several experiments were performed to demonstrate the viability and accuracy of the correlation method.
To form a gauge length is the primary step to collect test data by CCDC. Hu et al. [5] presented a novel laser-engraving technology to create speckles on the surface of a metallic specimen, which will form gauge length and be kept up till the melting temperature of metallic materials. This kind of speckles was also applied to investigate the elastic modulus of tungsten material up to 1000 °C. However, it is not economical and convenient to mark gauge length for steel cable specimens compared with a high temperature paint sparkler.
In 1996, Lyons et al. [4] proposed that the thermal expansion tests of standard inconel specimens up to 650 °C was conducted by a combined dual element optical fiber lamp and digital camera. The normalized cross interaction function was developed to determine the value of thermal expansion of specimens. In 2010, Pan et al. [6] reported that the blue LED light and band-pass filter imaging system can overcome the decorrelation effect due to high bright light at elevated temperature. This kind of technology was used by CCDC to investigate the thermal expansion of Cr-Ni austenitic stainless steel up to 1200 °C. In 2012, Gales et al. [7] carried out a series of tensile tests on pre-stressing steel at an elevated temperature by a steady method and transient method, respectively. It indicates that the novel digital image correlation method can measure the strain of tendon at an elevated temperature. In 2015, Yang et al. [8] investigated the mechanical properties of Gh738 material at an elevated temperature using the digital image correlation method.
The CCDC is also used to investigate the mechanical response of welded joints, concrete members and structural members at ambient temperature and elevated temperature respectively [9,10,11,12,13,14].
In order to calibrate the CCDC system, which can be used to measure the steel cables with a complex shape till rupture at an elevated temperature, a different measurement method was compared with each other in the present study as there is no previous study that can be referenced directly for this proposal. Finally, the present study conducted the test to capture the full range of stress-strain curves at an elevated temperature, which can improve the accuracy of the fire resistance analysis for pre-tensioned steel structures in the civil engineering area.
2. Basic Principle of Digital Image Correlation Method
From then, now, the previous studies have contributed to update the algorithm of the digital image correlation method (DICM), which is the core technology of the CCDC system, and improved the accuracy of the measurement by CCDC system. Hereby, the basic principle of the CCDC system was introduced as below.
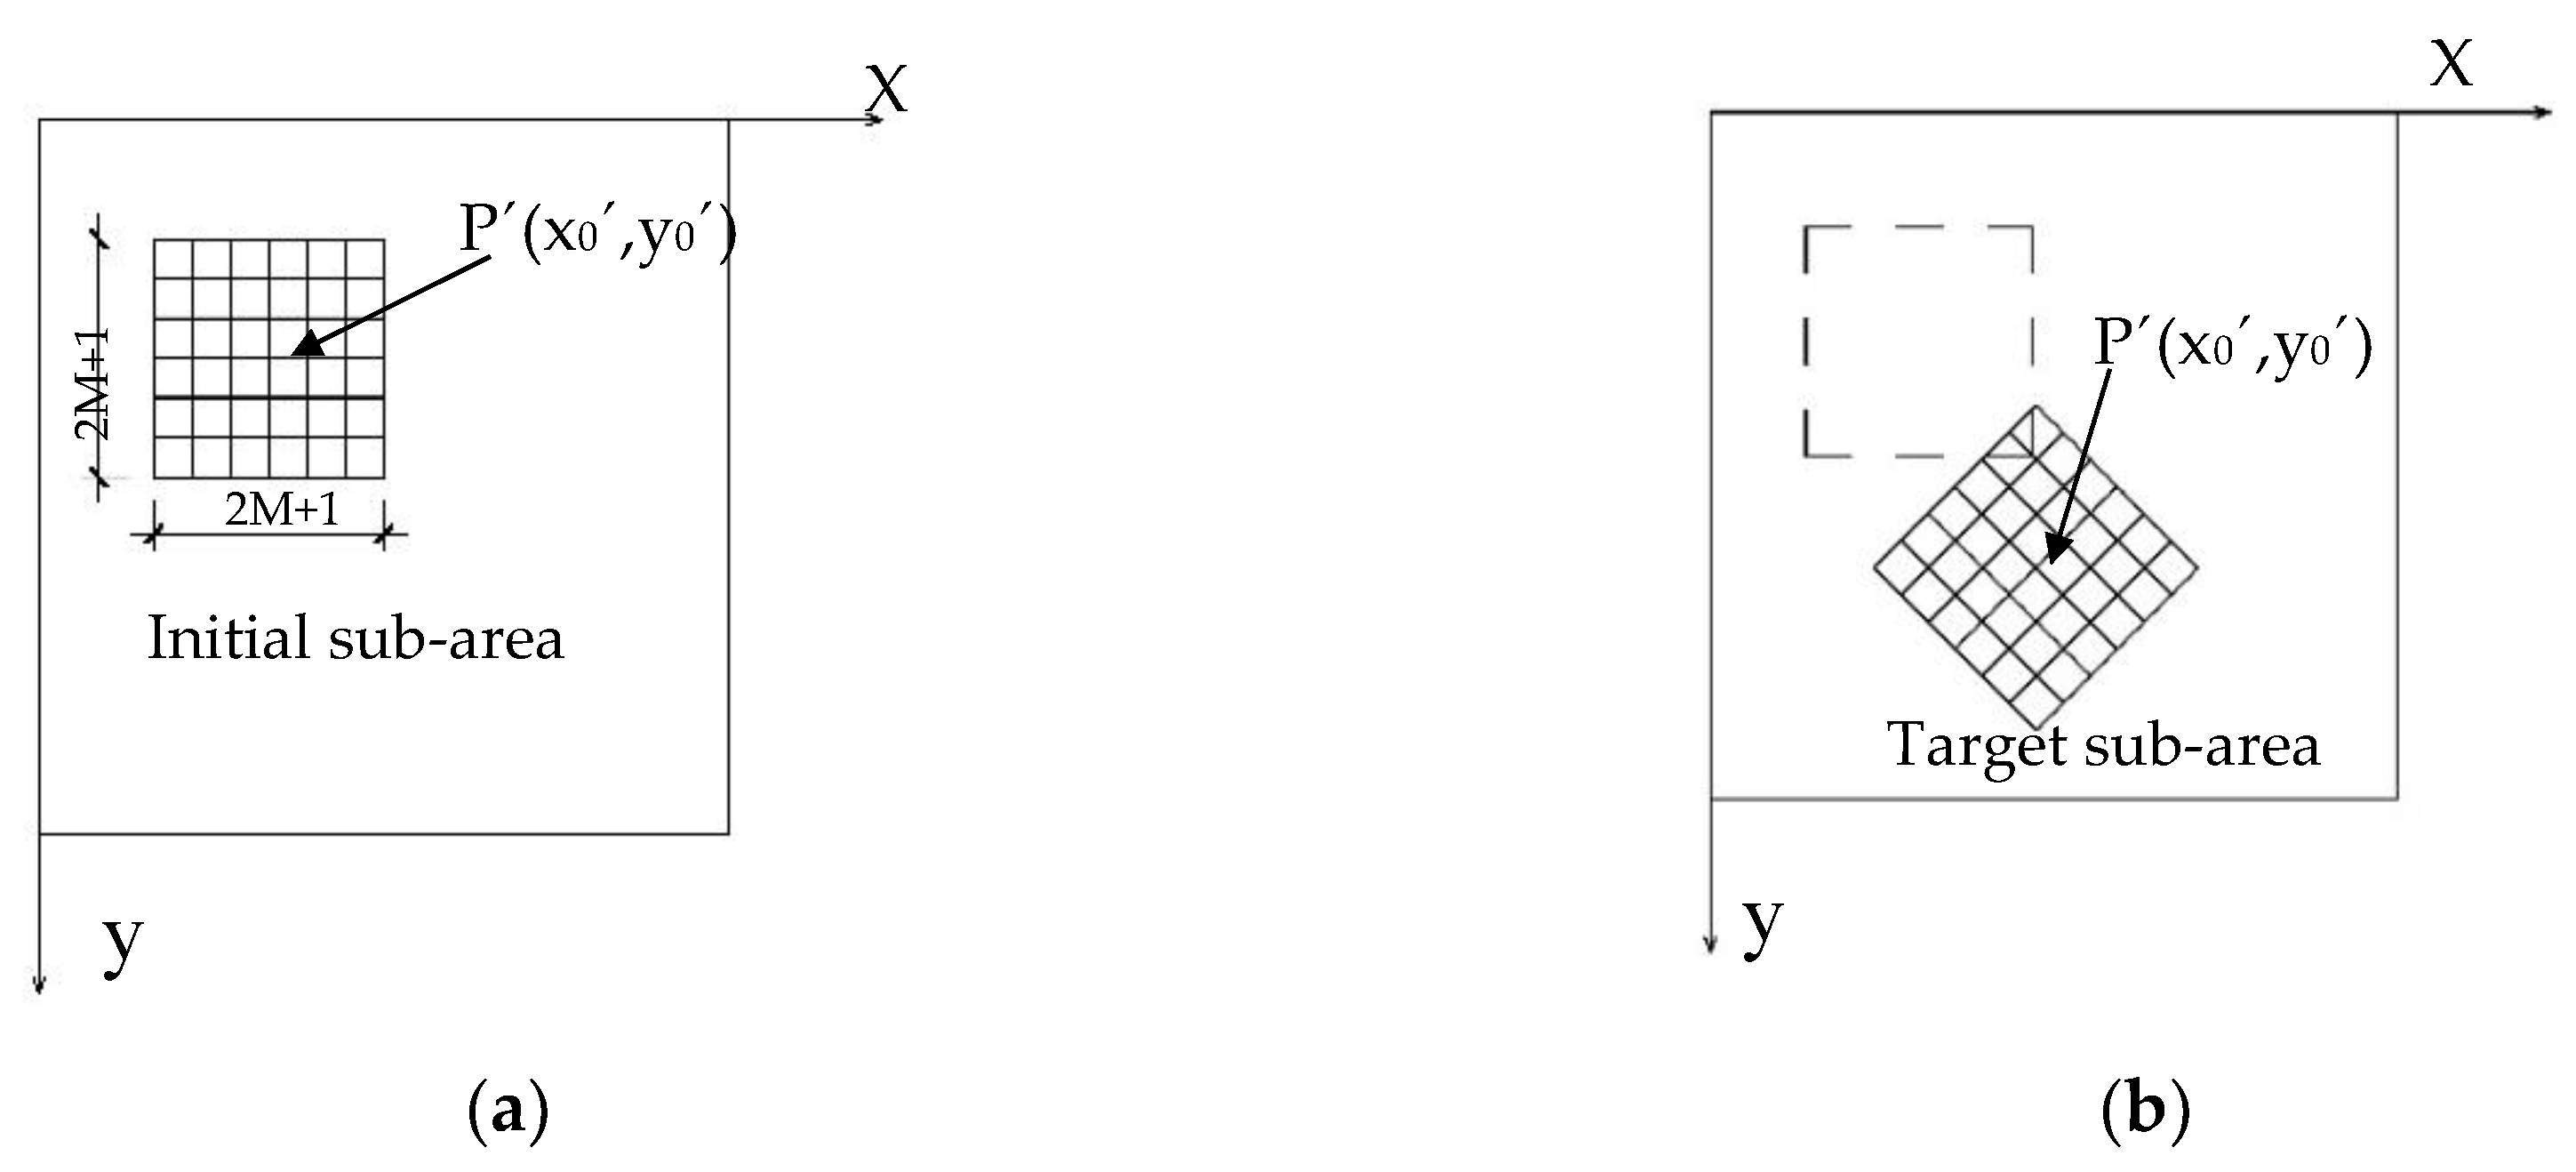
Digital image correlation method is an optical measurement based on digital image processing and numerical calculation. According to the basic principle of DIMC, speckle pattern is taken as the information resource of the deformation for an object [15,16]. Figure 1a displays the initial speckle pattern and Figure 1b shows the speckle pattern after deformation. Comparison of Figure 1a,b, the geometric coordination of a moving point, P, can be traced by using the digital image correlation method.
Based on the digital image correlation method, shown in Figure 2, a charge-coupled device camera has been used by the CCDC system to capture a series of speckle patterns and transferred to a data collector. In the meantime, the computer software, which developed on the base of the digital image correlation method, analyzed the database efficiently, and output the transient strain of a specimen. The measurement range of the non-contact video gauge is up to a strain of 100%, which can capture the full range of strain till specimens fails. The high quality video also can be recorded to review the test process once more. The practice of the non-contact video system is shown as Figure 3.
In present study, the CCDC pictured with 2452 pixels × 2056 pixels and a constant aperture of 1:1.8. The object distance of the special lens was 174 mm for material tests, and the magnification ratio of the lens was 0.338. The maximum frequency of data collection was 15 Hz. The resolution ratio of displacement was 0.012 μm and that of the strain was 5 με.
3. Calibration Tensile Test at Ambient Temperature
3.1. Uniaxial Tensile Tests on S355 Structural Steel
Both of the strain gauge and CCDC were used to investigate the stress-strain relationship of S355 structural steel. The dimension of the specimen for a standard uniaxial tensile test is shown as Figure 4. The standard uniaxial tensile tests were conducted on a servo-hydraulic testing machine, with a maximum stroke displacement of 75 mm and a capacity of 500 kN, shown in Figure 5.
There are two groups of specimen measuring by the strain gauge and CCDC system, respectively. For CCDC system measuring, the first step is to sprinkle black paint on the surface of each specimen to reduce the metallic brightness, and then, markers with white spots painting on a black color background were prepared within the middle part of a specimen surface of about 30 mm length. On the other side of the same specimen, a strain gauge with the measuring range of 100,000 με was pasted. The specimen was lightly tensioned to about 1 kN to eliminate any mechanical relaxation. Then, the tensile specimen was tested until failure at a straining rate of 0.0005 /s, in keeping with the strain rates set out in the EN 6892-1 [17]. As shown in Figure 6, the S355 steel specimen experienced a ductile model with necking phase. The broken cross section in the middle of length formed a cone-shape with cross section area gradually reduced towards the broken surface.
The stress-strain curves were obtained by a tensile test with strain gauge and CCDC system, respectively, as shown in Figure 7a. The elastic modulus can be determined by the tangent modulus of the initial linear phase of the stress-strain relationship. The effective yield strength is the intersection point of the stress-strain curve and the proportional line offset by 0.15% strain. The ultimate strength is the maximum stress in the stress-strain curve, and the fracture strain is dependent on the specimen broken. The mechanical properties of S355 steel are listed in Table 1.
Test results indicate that the ultimate strength obtained by different measurements was the same. As shown in Figure 7b, the elastic modulus and yield strength, which obtained by strain gauge were smaller than those obtained by CCDC, and the deviation was 1.34% and 1.55%, respectively, as listed in Table 1. The test process displayed that the tensile specimen also experienced a large strain from the ultimate strength till fracture. As the limited of measuring range, the strain gauge can only capture a partial range of the stress-strain curve before ultimate strength. Comparing the strain gauge, the CCDC system can obtain a full range of stress-strain curve until broken as shown in Figure 7a.
Therefore, it is more efficient to use the CCDC system than strain gauge to measure the specimens with large deformation through the test process.
3.2. Uniaxial Tensile Tests on Steel Cable
The dimension of a steel cable specimen with ultimate strength of 1860 MPa is shown in Figure 8. The nominal diameter is 15.2 mm and cross section area is 139 mm2. The process of marker painted is the same as mentioned in Section 3.1. Shown in Figure 9, the CCD camera was settled right ahead of the specimen in the distance of 1.5 m to form a measure plan and supplement brightness using a white lamp. Shown in Figure 10, an extensometer with the gauge length of 50 mm was settled in the mid-length of the same specimen. A couple of strain gauge was pasted on the surface of the mid-length. Thus, the stress-strain relationship of the steel cable was measured by three methods, i.e., strain gauge, extensometer and CCDC system, at ambient temperature. The standard tensile test was carried out by a servo-hydraulic test machine with a maximum stroke displacement of 75 mm and a capacity of 500 kN. There were four specimens repeatedly tested in a tensile test to get the average stress-strain curve as shown in Figure 10.
Shown in Figure 11, the stress-strain curves were obtained by different measuring methods. The effective yield strength, elastic modulus, ultimate strength and rupture strength were derived from each stress-strain curve with the same method as mentioned in Section 3.1. The values of the mechanical properties of steel cables obtained by different measuring methods are listed in Table 2, Table 3 and Table 4. There is a blank in Table 2 as a strain gauge is difficult to paste on the surface of a wire with 5 mm diameter, one of strain gauges split away off the surface of a wire and induced a blank in Table 2. As the arm of an extensometer cannot grab the steel cable tightly enough, there was the slipping displacement between the surface of the arm and steel cable. Thus, there are a few of blanks in Table 3. Comparison of the values of elastic modulus and effective yield strength, which were obtained by an extensometer and CCDC system, showed that they matched well with only 1.13% and 0.6% deviation, respectively. However, the values of elastic modulus and effective yield strength measured by a strain gauge were larger than those obtained by the extensometer and CCDC system. For an elastic modulus obtained by strain, the deviation was 2.83% and 3.99% compared to that by an extensometer and CCDC system. For the effective yield strength, the deviation was 16.6% and 17.1%, respectively.
As the strain gauge was pasted along twist wires, the strain measured by a strain gauge is off the longitudinal axis, which is smaller than the axis strain in the longitudinal direction. Thus, the smaller strain would induce the larger elastic modulus and yield strength. It also indicated that strain gauge cannot be suitable to measure the stress-strain curve of steel cables, which were twisted by a group of wires.
As listed in Table 3, the extensometer cannot captured the ultimate strength and rupture strain as its arm must be removed before the ultimate strength due to limited travel distance. Thus, an extensometer cannot capture the full range of stress-strain curves in a material properties test, especially for steel cables. The rupture strain of steel cables measured by the CCDC system was smaller than that by a strain gauge with 2.55% deviation. It also indicated that the strain gauge could only obtain stress-strain curve of one wire in a steel cable. Thus, the CCDC system was more efficient and accurate to measure the mechanical properties of steel cables than other methods.
4. Calibration Tensile Test at Elevated Temperature
4.1. Uniaxial Tensile Tests on S690 Structural Steel
The dimension of a S690 structural steel specimen for a standard uniaxial tensile test at an elevated temperature is the same as shown in Figure 4. The standard uniaxial tensile tests at an elevated temperature were also conducted on a servo-hydraulic testing machine, with a maximum stroke displacement of 75 mm and a capacity of 500 kN as shown in Figure 12. A specimen of S690 high-strength steel was installed and heated by a tubular high-temperature furnace as shown in Figure 13. The heat part was a split-tube furnace with a three-zone configuration and a side view window. A type K thermocouple was mounted at the centre of each zone to measure the heating temperature. The specimen was heated to 400 °C at the heat rate of 10 °C/min and subject to tension [18]. Both the extensometer and CCDC system were used to measure the strain in the specimen under the applied tension force.
As shown in Figure 13, the arms of the extensometer are ceramic rods with quartz chisel ends, which passed through the side entry port and contacted the test coupons. It is specified for a gauge length of 25 mm and could travel 2.5 mm. Thus, the maximum measurable strain was 10%. During testing, the displacements of the test coupons were directly detected and transmitted by the rods to the strain gauges placed within the extensometer body. A cooling fan was mounted close to the extensometer to maintain the temperature of the extensometer lower than 150 °C. There were four specimens repeatedly tested in a tensile test to measure the average high temperature stress-strain curve. Two specimens measured by an extensometer, and the other by the CCDC system.
The same as for the marker paint process in Section 3.1. For the high temperature test, the high temperature paint was used to make markers on the surface of test specimens.
Both the tests measured by the extensometer and CCDC system were conducted on the S690 steel. The target temperature was up to 400 °C at the heating rate of 10 °C/min and held for 30 min to obtain uniform temperature distributions in both the furnace and the test specimens. The strain rate was 0.003 /min [18]. For the CCDC system, the white light lamp was used to supply the brightness of the specimen, which was mounted in the furnace. The function of the exposure compensation was used to help the CCD camera eliminate the extra exposure due to a high temperature.
The tests observed that the high strength steel S690 experienced a necking at 400 °C. As shown in Figure 14, the broken cross section area gradually reduced towards the broken surface.
The stress-strain curves of S690 at 400 °C was shown in Figure 15, and the mechanical properties was listed in Table 5.
The mechanical properties listed in Table 5, i.e., elastic modulus, yield strength and ultimate strength of S690 steel at an elevated temperature obtained by the CCDC system was slightly larger than those by the extensometer. The deviation between them was 3.3%, 1.8% and 0.49%, respectively.
Since the ceramic arm of the extensometer has to be removed away from the test specimen before the rupture of the test specimen due to its limited travel distance as mentioned above; the extensometer reading can only cover the partial range of the stress-strain curve at an elevated temperature. The CCDC system can obtain the full range of the curve. A good fit between the extensometer and CCDC readings is generally observed as shown in Figure 15 and listed in Table 5. It is worth noting that the S690 steel experienced a long strain history after the ultimate strength at an elevated temperature. This ductility behavior of the S690 high strength steel at an elevated temperature is important to evaluate the mechanical response of structural members exposed to fire.
The test results showed that both the CCDC system and extensometer could capture the stress-strain curves accurately. However, the extensometer could only capture the partial range of the stress-strain curve due to its limited travel distance. The CCDC system was more efficient than the extensometer to obtain the full range of stress-strain curves, which is a benefit for analysis on the mechanical response of structural members exposed to fire.
4.2. Uniaxial Tensile Tests on 1860 MPa Pre-Tensioned Steel Cable
As the calibration tests have conducted as above, the CCDC system was used to measure the strain in the steel cables at different temperatures. The uniaxial tensile test process is the same as those illustrated in the Section 3.1. Three specimens were repeatedly tested at each temperature and the average of stress-strain relationships was obtained by the CCDC system as shown in Figure 16. Comparison of test curves and those resulted by EN1992-1-2 (2005) [19] indicated that the strain after the ultimate strength was ignored by EN1992-1-2 at an elevated temperature. The full range of stress-strain curve showed that steel cable specimens experienced a large strain after the ultimate strength, which would induce the large deformation of a pre-tensioned steel cable at an elevated temperature. Thus, the used of CCDC system could measure the stress-strain curves accurately and efficiently.
5. Cautions
As the CCDC system is an optical measurement technology based on the digital image correlation method, the speckles distribution, random vibration of servo-hydraulic testing machine can induce the deviation of test data in a limit range. The use of a high-temperature filter, exposure compensation system and rigid tripod can decrease the deviation. Meanwhile, the data collection frequent should be high enough to get more numbers of test data in each group. The more high data collection frequent reached, the more accurately the average value can be gained to improve the smoothness of data curves.
6. Conclusions
This paper investigated a series of calibrate standard uniaxial tension test at ambient temperature and an elevated temperature, respectively. The following conclusions can be drawn:
- At ambient temperature, the data measured with the strain gauge and CCDC system fit well before the ultimate strength in a uniaxial tensile test of structural steel. The strain gauge could not capture the full range of stress-strain curves, but the CCDC system could.
- Compared to the strain gauge and extensometer method, the CCDC system not only could measure the test data accurately as other measurement methods, but also was able to capture the full range of the stress-strain relationship curves for steel cables with a complex shape.
- The use of high temperature paint could make speckle to form on the gauge length, which could be captured by a CCD camera. The high temperature filter also could improve the efficient workability of the CCDC system for mechanical properties tested at an elevated temperature.
Author Contributions
Conceptualization, Funding acquisition, Investigation, Project administration, Resources, Supervision, Writing—review & editing, Y.D.; Data curation, Investigation, Validation, Visualization, Writing—original draft, Z.-m.G.
Funding
The Civil Engineering Disaster Prevention National Key Laboratory in China (SLDRCE14-05), the National Natural Science Foundation of China (51878348).
Acknowledgments
The authors gratefully acknowledge the International Structural Fire Research Laboratory (ISFRL) in Nanjing Tech University, China.
Conflicts of Interest
The authors declare no conflict of interest. The founding sponsors had no role in the design of the study; in the collection, analyses, or interpretation of data; in the writing of the manuscript, and in the decision to publish the results.
References
- Xiong, M.X.; Liew, J.R. Mechanical properties of heat-treated high tensile structural steel at elevated temperature. Thin-Walled Struct. 2016, 98 Pt A, 169–176. [Google Scholar] [CrossRef]
- Mellegard, K.D.; Pfeifle, T.W.; Fossum, A.F.; Senseny, P.E. Pressure and flexible membrane effects on direct-contact extensometer measurements in axisymmetric compression tests. J. Test. Eval. 1993, 21, 530–538. [Google Scholar]
- Winkler, J.; Fischer, G.; Georgakis, C.T. Measurement of local deformations in steel monostrands using digital image correlation. J. Bridge. Eng. 2014, 19, 04014042. [Google Scholar] [CrossRef]
- Lyons, J.S.; Liu, J.; Sutton, M.A. Sutton High-temperature deformation measurements using digital-image correlation. Exp. Mech. 1996, 36, 64–70. [Google Scholar] [CrossRef]
- Hu, Y.; Wang, Y.; Chen, J.; Zhu, J. A new method of creating high-temperature speckle patterns and its application in the determination of the high-temperature mechanical properties of metals. Exp. Tech. 2018, 42, 523–532. [Google Scholar] [CrossRef]
- Pan, B.; Wu, D.; Wang, Z.; Xia, Y. High-temperature digital image correlation method for full-field deformation measurement at 1200 C. Meas. Sci. Technol. 2010, 22, 015701. [Google Scholar] [CrossRef]
- Gales, J.A.; Bisby, L.A.; Stratford, T. New parameters to describe high-temperature deformation of prestressing steel determined using digital image correlation. Struct. Eng. Int. 2012, 22, 476–486. [Google Scholar] [CrossRef]
- Yang, Y.; Li, X.; Xiao, R.; Zhang, H. Digital image correlation and complex biaxial loading tests on thermal environment as a method to determine the mechanical properties of Gh738 using warm hydroforming. High. Temp. Mater. Process. 2015, 19, 47–69. [Google Scholar] [CrossRef]
- Konopík, P.; Džugan, J.; Rund, M.; Procházka, R. Determination of local mechanical properties of metal components by hot micro-tensile test. In Proceedings of the 25th Anniversary International Conference on Metallurgy and Materials, METAL 2016, Brno, Czech Republic, 25–27 May 2016. [Google Scholar]
- Le, D.B.; Tran, S.D.; Dao, V.T.; Torero, J. Deformation capturing of concrete structures at elevated temperatures. Procedia Eng. 2017, 210, 613–621. [Google Scholar]
- Barba, D.; Reed, R.; Alabort, E. Ultrafast miniaturised assessment of high-temperature creep properties of metals. Mater. Lett. 2019, 240, 287–290. [Google Scholar] [CrossRef]
- Sakanashi, Y.; Gungor, S.; Forsey, A.; Bouchard, P. Measurement of creep deformation across welds in 316H stainless steel using digital image correlation. Exp. Mech. 2017, 57, 231–244. [Google Scholar] [CrossRef]
- Chen, Y.; Lei, Z.; Bai, R.; Wei, Y.; Tao, W. Study on Elastoplastic Crack Propagation Behavior of Laser-welded 6061 Aluminum Alloy Using Digital Image Correlation Method. IOP Conf. Ser. Mater. Sci. Eng. 2017, 280, 012040. [Google Scholar] [CrossRef]
- Bai, R.; Wei, Y.; Lei, Z.; Jiang, H.; Tao, W.; Yan, C.; Li, X. Local zone-wise elastic-plastic constitutive parameters of Laser-welded aluminium alloy 6061 using digital image correlation. Opt. Lasers Eng. 2018, 101, 28–34. [Google Scholar] [CrossRef]
- Pan, B.; Qian, K.; Xie, H.; Asundi, A. Two-dimensional digital image correlation for in-plane displacement and strain measurement: A review. Meas. Sci. Technol. 2009, 20, 062001. [Google Scholar] [CrossRef]
- Hung, P.C.; Voloshin, A.S. In-plane strain measurement by digital image correlation. J. Braz. Soc. Mech. Sci. Eng. 2003, 25, 215–221. [Google Scholar] [CrossRef]
- EN 6892-1: Metallic Materials-Tensile Testing–Part 1: Method of Test at Room Temperature; European Committee for Standardization: Brussels, Belgium, 2009.
- BS EN 10002-5: Tensile Testing of Metallic Materials – Part 5: Method of Test at Elevated Temperatures; European Committee for Standardization: Brussels, Belgium, 1992.
- EN 1992-1-2, Design of Concrete Structures. Part 1. 2 General Rules—Structural Fire Design; CEN: Brussels, Belgium, 2004.
Figure 1.
Displacement information for the digital image correlation method. (a) Initial information; (b) Target information.
Figure 1.
Displacement information for the digital image correlation method. (a) Initial information; (b) Target information.

Figure 2.
Charge-coupled device camera system.

Figure 3.
Standard tensile test set-up for S355 structural steel at ambient temperature.

Figure 4.
Dimension of steel specimens for standard tensile test (unit = mm).

Figure 5.
Servo--hydraulic testing machine.

Figure 6.
View of tensile failure of S335 steel at ambient temperature.

Figure 7.
Comparison of stress-strain curves of S355 steel measured by different methods at ambient temperature. (a) Full range of stress-strain curve. (b) Partial range of stress-strain curve.
Figure 7.
Comparison of stress-strain curves of S355 steel measured by different methods at ambient temperature. (a) Full range of stress-strain curve. (b) Partial range of stress-strain curve.


Figure 8.
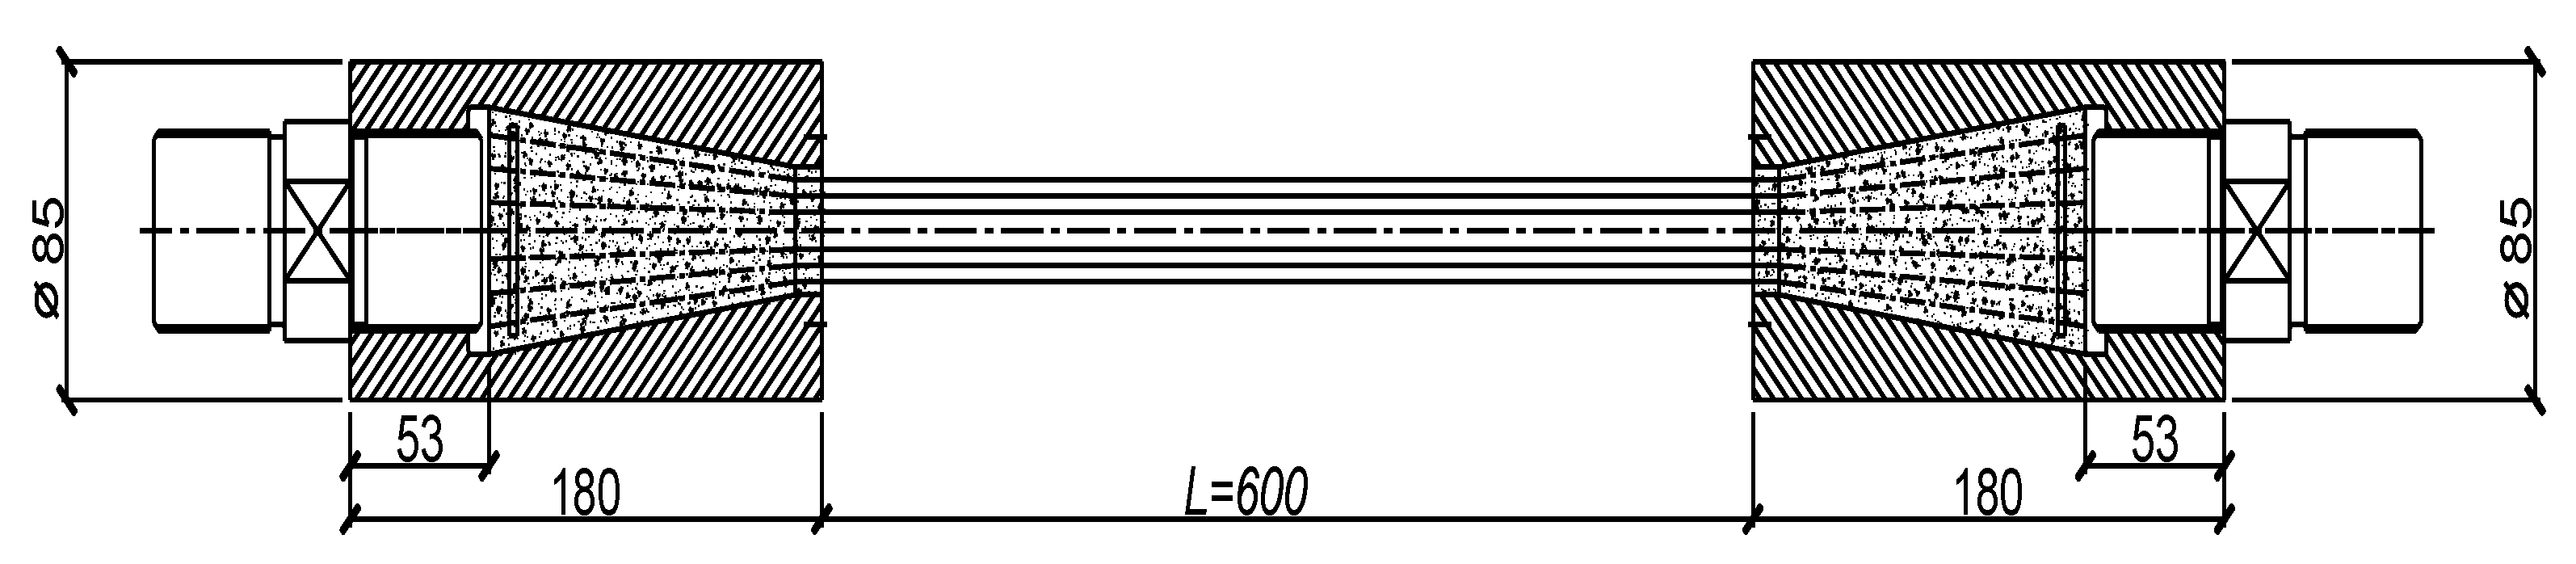
Dimension of a pre-stressed steel cable (Unit = mm).

Figure 9.
Tensile test set-up for pre-stressed steel cables at ambient temperature.

Figure 10.
Strain gauge and extensometer installation.

Figure 11.
Comparison of stress-strain curves of pre-stressed steel cables measuring by different measurement methods.
Figure 11.
Comparison of stress-strain curves of pre-stressed steel cables measuring by different measurement methods.

Figure 12.
Uniaxial tensile test set-up of S690 high strength steel under the high temperature.

Figure 13.
Tubular furnace and extensometer.

Figure 14.
Post-high temperature tensile test high strength steel specimens.

Figure 15.
Stress-strain curves of high strength steel at 400 °C obtained by different measurement methods.
Figure 15.
Stress-strain curves of high strength steel at 400 °C obtained by different measurement methods.

Figure 16.
Stress-strain relationships of high tensile strength steel cables at elevated temperature.
Figure 16.
Stress-strain relationships of high tensile strength steel cables at elevated temperature.


Table 1.
Mechanical properties of S355 steel at ambient temperature.
| Mechanical Properties | Measurement | Deviation | |
|---|---|---|---|
| Strain Gage | CCDC | ||
| Elastic Modulus (E/GPa) | 201.5 | 204.2 | 1.34% |
| Yield Strength (fy/MPa) | 400.6 | 406.8 | 1.55% |
| Ultimate Strength (fu/MPa) | 472.6 | 472.6 | 0% |
| Fracture Strain (ɛu) | 0.095 | 0.308 | 225% |
Table 2.
Mechanical properties of pre-tension steel cable obtained by strain gauge.
| Mechanical Properties | Specimen 1 | Specimen 2 | Specimen 3 | Specimen 4 | Average Value |
|---|---|---|---|---|---|
| Elastic Modulus (E/GPa) | 204.6 | 214.7 | 198.7 | 199.4 | 200.9 |
| Yield Strength (fy/MPa) | 1778 | 1751 | 1729 | 1724 | 1746 |
| Ultimate Strength (fu/MPa) | 2017.2 | 2008.2 | 2022.2 | 2015.9 | 2015.9 |
| Fracture Strain (ɛu) | - | 0.045 | 0.056 | 0.051 | 0.051 |
Table 3.
Mechanical properties of pre-tension steel cables obtained by extensometer.
| Mechanical Properties | Specimen 1 | Specimen 2 | Specimen 3 | Specimen 4 | Average Value |
|---|---|---|---|---|---|
| Elastic Modulus (E/GPa) | 196.1 | 195.5 | 194.8 | 195.1 | 195.4 |
| Yield Strength (fy/MPa) | 1732 | 1729 | 1725 | - | 1729 |
| Ultimate Strength (fu/MPa) | - | - | - | - | - |
| Fracture Strain (ɛu) | - | - | - | - | - |
Table 4.
Mechanical properties of pre-tension steel cables obtained by CCDC system.
| Mechanical Properties | Specimen 1 | Specimen 2 | Specimen 3 | Specimen 4 | Average Value |
|---|---|---|---|---|---|
| Elastic Modulus (E/GPa) | 195.1 | 191.2 | 193.7 | 192.9 | 193.2 |
| Yield Strength (fy /MPa) | 1729 | 1725 | 1710 | 1709 | 1718. |
| Ultimate Strength (fu/MPa) | 2017.2 | 2008.2 | 2014.3 | 2015.9 | 2015.9 |
| Fracture Strain (ɛu) | 0.0558 | 0.0548 | 0.0462 | 0.0527 | 0.0524 |
Table 5.
Mechanical properties of S690 high strength steel obtained by different measurement methods at 400 °C.
Table 5.
Mechanical properties of S690 high strength steel obtained by different measurement methods at 400 °C.
| Mechanical Properties | Extensometer | CCDC System | ||||
|---|---|---|---|---|---|---|
| Specimen 1 | Specimen 2 | Average Value | Specimen 1 | Specimen 2 | Average Value | |
| Elastic Modulus (E/GPa) | 181.6 | 175.9 | 178.7 | 170.7 | 175.4 | 173 |
| Yield Strength (fy/MPa) | 775 | 734 | 755 | 786 | 751 | 768.5 |
| Ultimate Strength (fu/MPa) | 767.4 | 782.6 | 775 | 803.4 | 754.3 | 778.8 |
| Fracture Strain (ɛu) | - | - | - | - | 0.1240 | 0.1240 |
© 2019 by the authors. Licensee MDPI, Basel, Switzerland. This article is an open access article distributed under the terms and conditions of the Creative Commons Attribution (CC BY) license (http://creativecommons.org/licenses/by/4.0/).
Share and Cite
MDPI and ACS Style
Du, Y.; Gou, Z.-m. Application of the Non-Contact Video Gauge on the Mechanical Properties Test for Steel Cable at Elevated Temperature. Appl. Sci. 2019, 9, 1670. https://doi.org/10.3390/app9081670
AMA Style
Du Y, Gou Z-m. Application of the Non-Contact Video Gauge on the Mechanical Properties Test for Steel Cable at Elevated Temperature. Applied Sciences. 2019; 9(8):1670. https://doi.org/10.3390/app9081670
Chicago/Turabian StyleDu, Yong, and Zhang-ming Gou. 2019. "Application of the Non-Contact Video Gauge on the Mechanical Properties Test for Steel Cable at Elevated Temperature" Applied Sciences 9, no. 8: 1670. https://doi.org/10.3390/app9081670
Note that from the first issue of 2016, this journal uses article numbers instead of page numbers. See further details here.