Labeling Strategy for Evaluating the Performance of Thin Asphalt Wearing Courses


Department of Civil and Environmental Engineering, Universitat Politècnica de Catalunya-BarcelonaTech, 08034 Barcelona, Spain
*
Author to whom correspondence should be addressed.
Appl. Sci. 2019, 9(8), 1694; https://doi.org/10.3390/app9081694
Submission received: 13 March 2019
/
Revised: 5 April 2019
/
Accepted: 9 April 2019
/
Published: 24 April 2019
(This article belongs to the Special Issue Asphalt Materials)
Abstract
:Traditional design procedures of asphalt mixtures are based on volumetric parameters and the compliance with the mechanical performance, while functional properties receive less attention. Additionally, even though the potential of sustainable technologies is proven, this is not sufficiently reflected in the technical specifications and their use is not widely spread. In order to face these challenges, the development of a useful tool that allows infrastructure managers an easy evaluation of the mechanical, functional, and environmental performance and the pursuit of balance between properties will encourage the optimization of road surfaces. The aim of this research is to develop a multi-labeling scheme for asphalt mixtures for thin wearing courses according to their mechanical, functional, and environmental attributes. In particular, the study focuses on the Spanish case, because all the collected data belong to the Spanish road network; however, the approached methodology is flexible enough to be adjusted to the requirements of individual countries. The findings in this research show promise because the developed labeling scheme allows not only the assignation of performance labels to any asphalt mixture based on its properties, but also the comparison of features between different asphalt mixtures.
1. Introduction
Road transportation generates a great impact on the surrounding area, not only does the construction of the infrastructure represent a strong impact on the territory, but its use affects both users (wet skid resistance, tire wear, fuel consumption, visibility, etc.) and local residents (tire–pavement noise, pollutant emissions, etc.).
Pavements must not only ensure a proper traffic-bearing capacity during their service life, but they must also provide a comfortable and safe running surface. Road safety studies indicate that approximately 20% of all road accidents occur during wet weather [1]. When water accumulates on pavement surface, the “splash and spray” effect occurs, resulting in visibility loss, as well as the “hydroplaning” effect, which leads to a reduction in skid resistance [2]. To minimize these occurrences, the design of the asphalt mixture plays a decisive role in the functional properties of the wearing course. Aggregate nature, morphology, gradation, and binder content are aspects that have a decisive influence on the frictional resistance and surface drainage capacity of the pavement.
Even though there are different methods to design asphalt mixtures and to determine the optimal design in the laboratory, the most commonly used methods (i.e., Marshall [3], Hveem [4], and Superpave methods [5]) are design procedures based on volumetric parameters and the compliance with the mechanical properties, while functional properties receive less attention. Indeed, most road administrations only establish compliance specifications for certain properties, without distinction among different acceptable levels of performances.
In the particular case of Spain, when designing asphalt mixtures, designers traditionally relied upon volumetric properties (i.e., air voids, voids in the mineral aggregate, and binder content) and mechanical properties (i.e., Marshall stability, flow value, permanent deformation, and the water sensibility) [6]. Additionally, the Spanish technical standard specifies minimum requirements for surface friction (in terms of macrotexture and sideway force coefficient) that must be checked in the field once the asphalt layer is extended. Nevertheless, the standard does not provide for a minimum requirement in terms of cracking performance, a property that plays a major role in the durability of the pavement.
Moreover, one of the main sources of pollution stemming from road transportation is the manufacturing, construction, and conservation of asphalt mixtures used in flexible pavements; thus, it is necessary to put this industry on a sustainable growth path and to reduce its carbon footprint [7]. Based on the above rationale, in the design, construction, and maintenance of roads, it is necessary to consider sustainability criteria. Indeed, the European Commission released the “European Union (EU) green public procurement criteria for road design, construction, and maintenance”, which proposes a set of environmental criteria to reduce the environmental impact of the industry [8].
With the increasing demands of sustainability, lots of effort was focused on developing new technologies to improve the sustainability of asphalt mixtures. The use of by-products from other industries, i.e., tire powder or bottom ash, and the replacement of non-renewable natural aggregates by recycled aggregates, such as carbon steel slag, recycled aggregate pavement, blast furnace slag, or waste glass, should be underscored [9]. A successful use of recycled materials not only saves money in purchasing and transporting, but also reduces virgin material consumption and pollution related to quarrying or processing of these materials. The design of asphalt mixtures at lower production temperature also represents a step forward, reducing the pollutant emissions and improving the working conditions during the laying of the bituminous mixture [10].
However, this is not the only challenge that road authorities are facing. Traffic noise also gained attention as it contributes to environmental pollution and generates other environmental problems. The development of low-noise pavements such as porous asphalt, thin layers, or asphalt rubber pavements contributed to the reduction of tire-tread impact noise [11].
Although experience demonstrated that the use of these technologies does not jeopardize the performance of the bituminous mixture and that it contributes to the sustainability of the infrastructure, the current technical specifications for the design of asphalt mixtures do not reflect the potential of these technologies and their use is not widespread. Therefore, apart from technological changes, there is a need for a behavioral change among stakeholders to reduce the environmental impacts of road infrastructure.
For all these reasons, the design of asphalt mixtures should seek balance between structural, functional, and environmental attributes to ensure the development of safe, durable, sustainable, and economic pavements.
A flexible tool that allows infrastructure managers (IMs) and the industry an easy evaluation of the mechanical, functional, and sustainable properties of the designed asphalt mixture will encourage the optimization of road surfaces. The development of performance labels may bring about the necessary behavioral change, as energy or eco-labels did in the past.
Originally introduced in Germany in the late 1970s, eco-labeling played an important role in the global expansion of environmentally friendly goods and services. It is a way of encouraging consumers to reduce unsustainable consumption and to make wiser use of resources and energy in the drive for sustainable development [12]. Eco-labels are tools that provide the buyer with information on the environmental impacts of products, allowing them to compare different products based on their environmental performance. They can help change consumption patterns by stimulating more sustainable purchases and, at the same time, they can also motivate producers or service providers to raise their environmental standards [13]. Indeed, eco-labels steadily rose since their origin, from a dozen worldwide in the 1990s to more than 435 labels to date. However, the development of labels for the road industry is not extended because it must consider multiple factors that are often difficult to measure.
The establishment of multi-labels (mechanical, functional, and environmental labels) and asphalt mixture ranking according to these criteria will stimulate the design and construction of flexible pavements with less cost to society. The main function of these labels will serve as a component of IMs’ choices, but they are also supposed to act as a reminder to take safety and environmental issues into account [14,15]. These labels should be designed in the form that they allow for both positive and negative labeling, as well as for performance ranking.
Road surface labels will stimulate the development and application of better road surfaces with less cost to society, as well as allow IMs to tune requirements to specific situations (i.e., increase functional requirements in rain-fed areas, etc.). In addition, it facilitates the cooperation between the IMs and the industry, resulting in faster innovation cycles (shorter turnaround of new products).
In the construction industry, one of the most relevant labeling systems is the green building rating system that promotes the use of sustainable solutions during the design, construction, operation, and maintenance of buildings and even entire neighborhoods. One of the most recognized certification systems is the Leadership in Energy and Environmental Design (LEED), which recognizes projects with different labels according to their efficiency [16].
Even though the usefulness of this tool is proven and there are some successful cases, there are not so many examples of label schemes in the transportation industry. One of these rare cases is the airline industry, where several attempts were made by various industry players to develop such a label but no industry-wide standards currently exist [17]. Another example is the ongoing research project Labeling road surfaces in the Netherlands, which aims at labeling road surfaces according to four indicators: skid resistance, noise reduction, rolling resistance, and lifespan [18].
Indeed, in the last few years, public administrations are willing to reward those road works whose quality is beyond the thresholds required by the specifications, and recognize these improvements in the construction practices and/or used materials in the technical evaluation of the tendering process. One example of this willingness is the promotion of public–private partnerships (PPP) for roadways based on performance-based indicators (PI) linked to bonuses and penalties [19]. The Spanish administration launched many PPP contracts based on availability payment depending on the fulfillment of a set of performance-based indicators. In this sense, a labeling system would smooth the introduction of award criteria into the road construction contracting process and would facilitate the assessment of the level of compliance.
For the abovementioned reasons, the aim of this research was to establish a multi-label scheme for wearing courses according to three categories: mechanical performance, functional performance, and environmental performance. In particular, this study focused on establishing a guideline to create labels for thin wearing courses because thin overlays are a preservation technique that is gaining popularity given the growing concern of IMs on safety and ride comfort.
Each category is influenced by different properties, but a unique global label is obtained for each category. The performance of each category is rated in terms of a set of performance classes from A to D on the label.
The ultimate goal of this study was to propose a guideline to create a flexible tool that allows evaluating any wearing course based on its mechanical, functional, and environmental performance, comparing attributes among different mixtures to select the optimum solution for each specific situation. The purpose was to develop a tool that facilitates communication between clients and contractors and stimulates better road surface practices. To make the proposed methodology more tangible, the establishment of the labels is particularized to the Spanish case.
2. Methodology
2.1. Database Development
The aim of this research was to categorize any asphalt mixture for thin wearing courses according to their mechanical, functional, and environmental performance through a labeling scheme that evaluates their attributes.
To do so, it was necessary to develop a wide database on bituminous mixture performance related issues. This database development was divided into three stages: (1) data collection, (2) laboratory testing, and (3) pavement monitoring.
The first stage started with the involvement of different IMs at national, regional, and local levels. Data of the quality controls carried out during the construction of national and local roads were collected by the provided access to the IMs’ database.
The sample size included more than 1500 quality control samples from 73 roads. The obtained data included mix design parameters (i.e., binder type and content, nature of the aggregate, aggregate gradation, filler content, air void content, and density), as well as mechanical and functional properties (i.e., stability, water sensibility, disaggregation resistance, macrotexture, and skid resistance). All roads had an average daily heavy traffic between 200 and 799 heavy vehicles per day. As expected, the collected data from the quality controls neither included results of a key property such as cracking resistance, because it is not specifically mentioned in the Spanish technical standard [20], nor any result related to their environmental performance (i.e., tire–pavement noise, recycled products, etc.).
For this reason, it was decided to carry out a laboratory testing to analyze in depth the cracking performance of asphalt mixtures for thin overlay and a monitoring phase to evaluate other properties related to the surface texture.
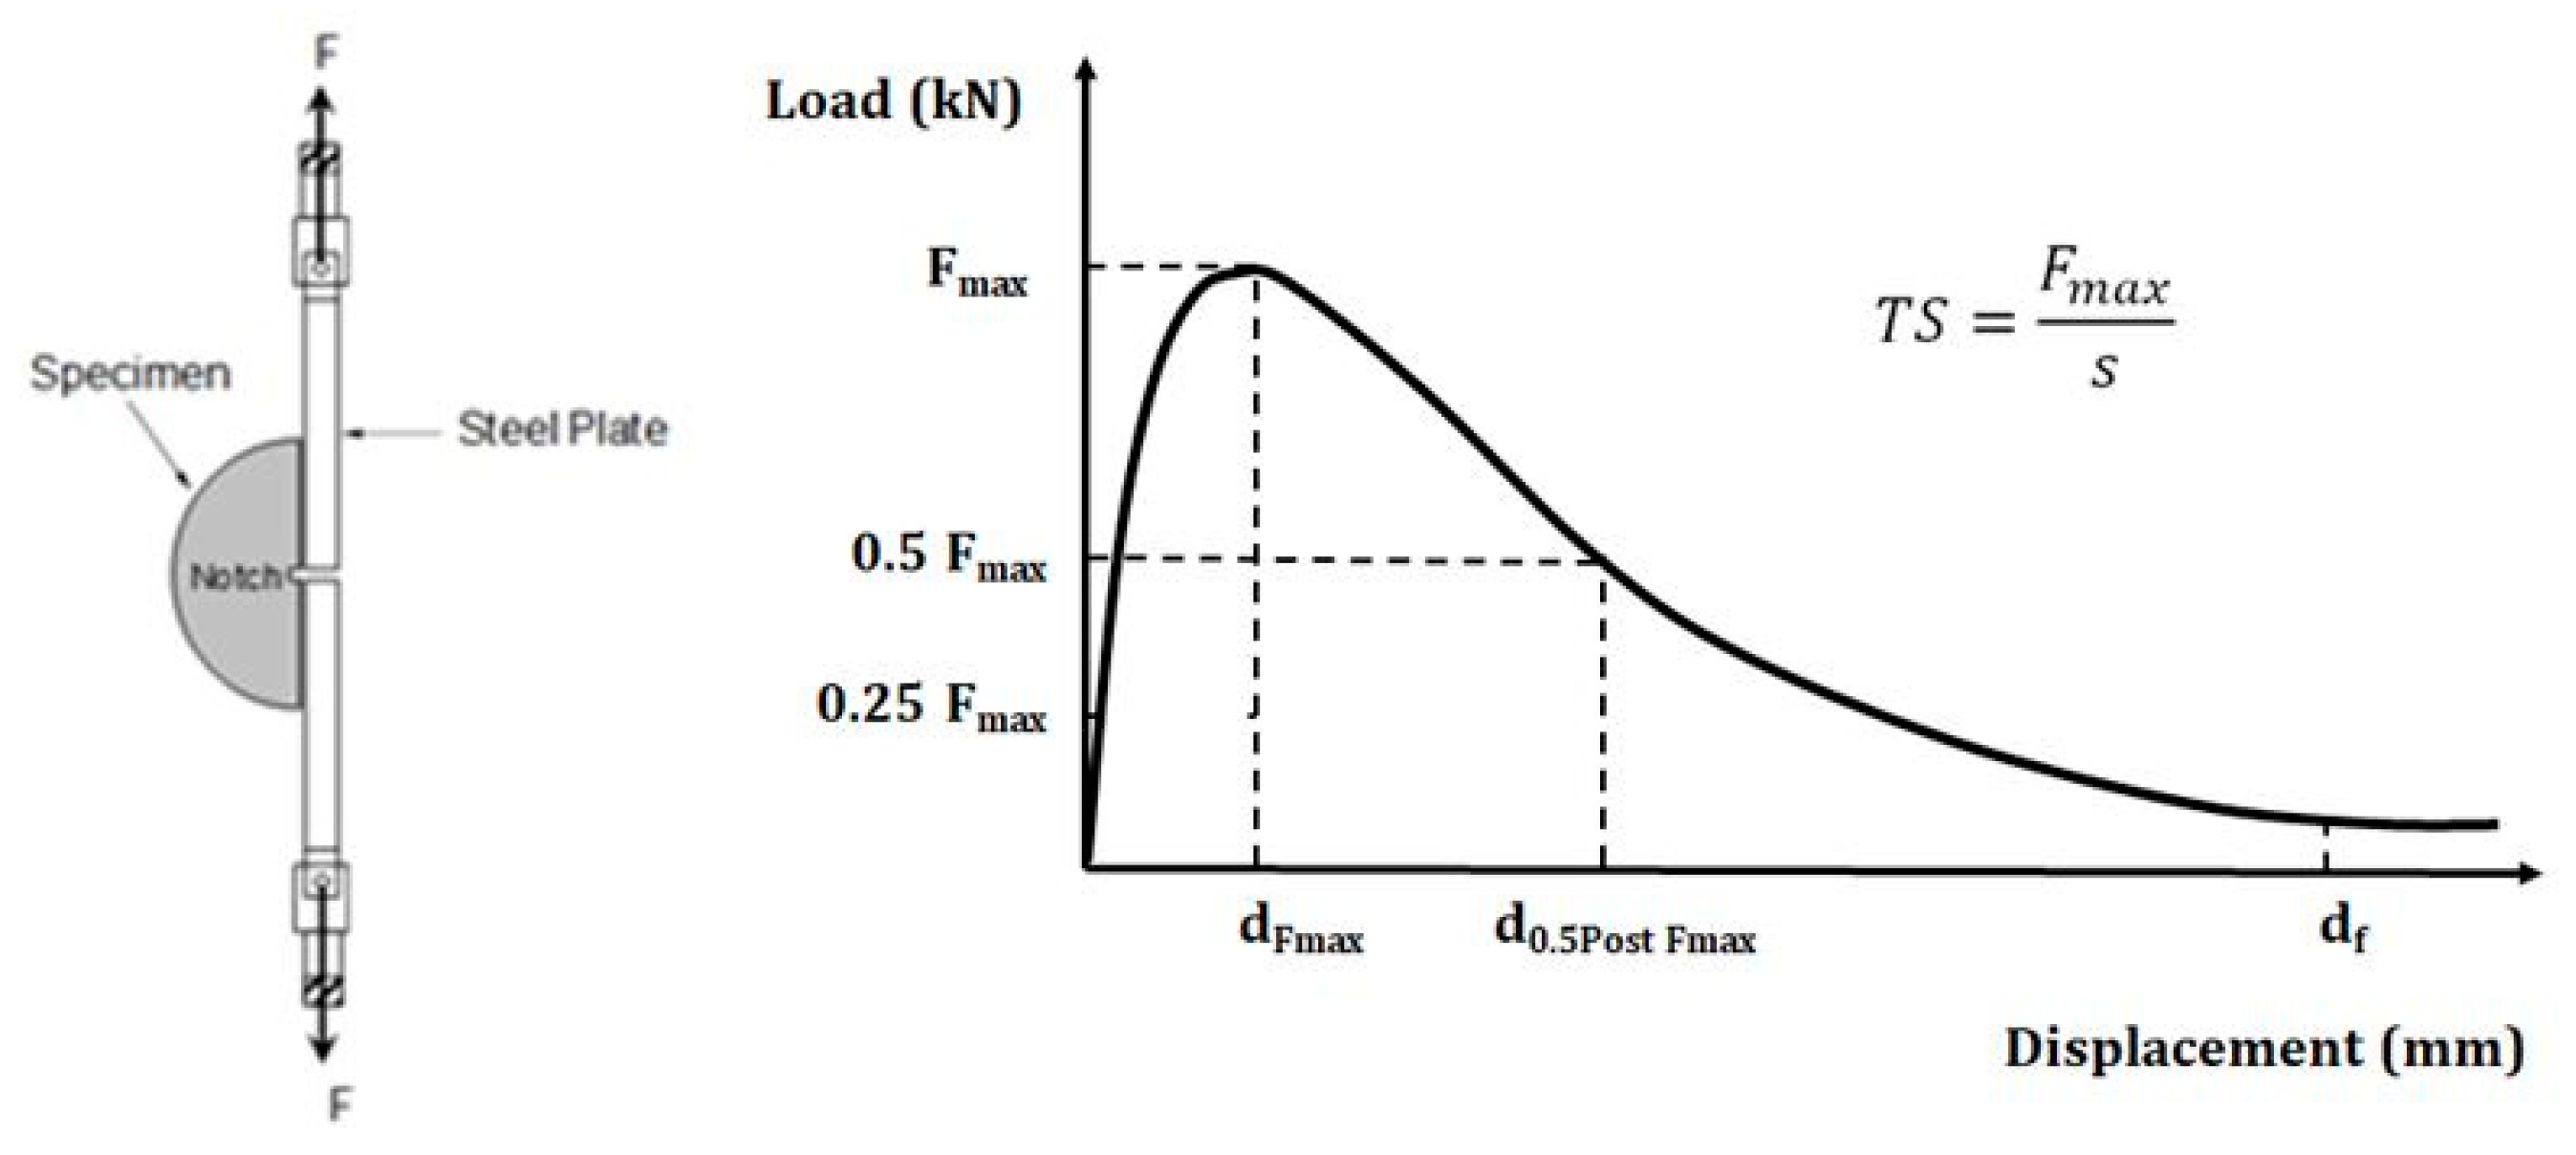
Laboratory testing was executed in two stages. At the first phase, the influence of binder type on the cracking performance of asphalt mixture was studied [21]. The second phase covered the influence aggregate gradation; in particular, the nominal maximum aggregate size and the fine fraction content were analyzed [22]. The Fénix test was applied to evaluate the cracking performance of the specimens. This test, developed by the Road Research Laboratory of the Technical University of Catalonia, is a direct tensile strength test that evaluates the cracking resistance of asphalt mixtures by calculating the dissipated energy during mixture cracking [23]. Asphalt mixtures were Fénix-tested and, based on their stress–displacement curve, two main parameters were considered to explain the cracking response of the tested mixtures (see Figure 1):
- The tensile strength (TS) is defined as the maximum load divided by the fracture surface and gives a notion of the cohesion provided by the asphalt mastic to the mixture;
- The displacement at 50% post-peak load (d0.5PostFmax) is directly related to the ductility of the mixture.
During the measurement campaign, different pavements with significantly different wearing courses (ultrathin asphalt concrete, gap-graded mixtures, open graded friction courses, and asphalt–concrete mixtures) were selected and monitored in order to obtain information about their “splash and spray” response and their tire–pavement noise emissions. Moreover, macrotexture and skid resistance measurements were taken to enlarge the collected data.
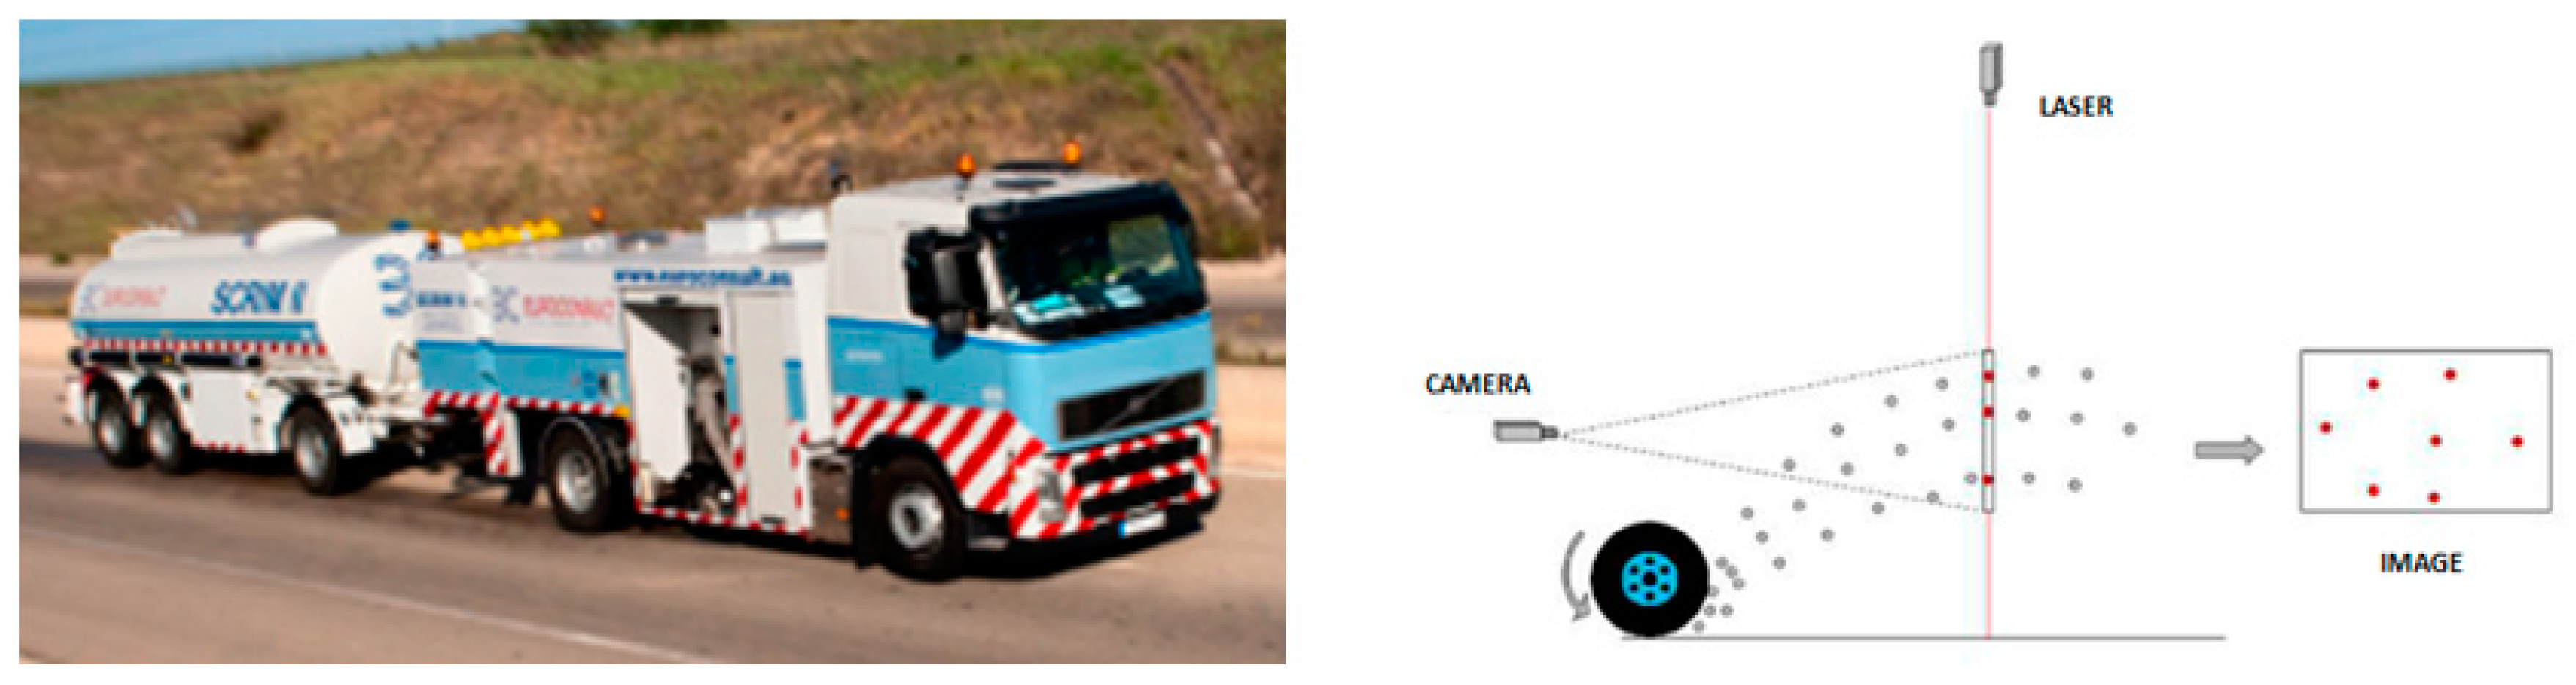
Splash and spray measurements were recorded by a test trailer developed by Euroconsult, a specialized auscultation company, and the Technical University of Catalonia, which was based on the traffic speed drainometer measuring principle and pulled by a SCRIM vehicle (sideway-force coefficient routine investigation machine) (see Figure 2) [24]. The obtained results measure the number of splashed raindrops that cross a reference plane at a given time.
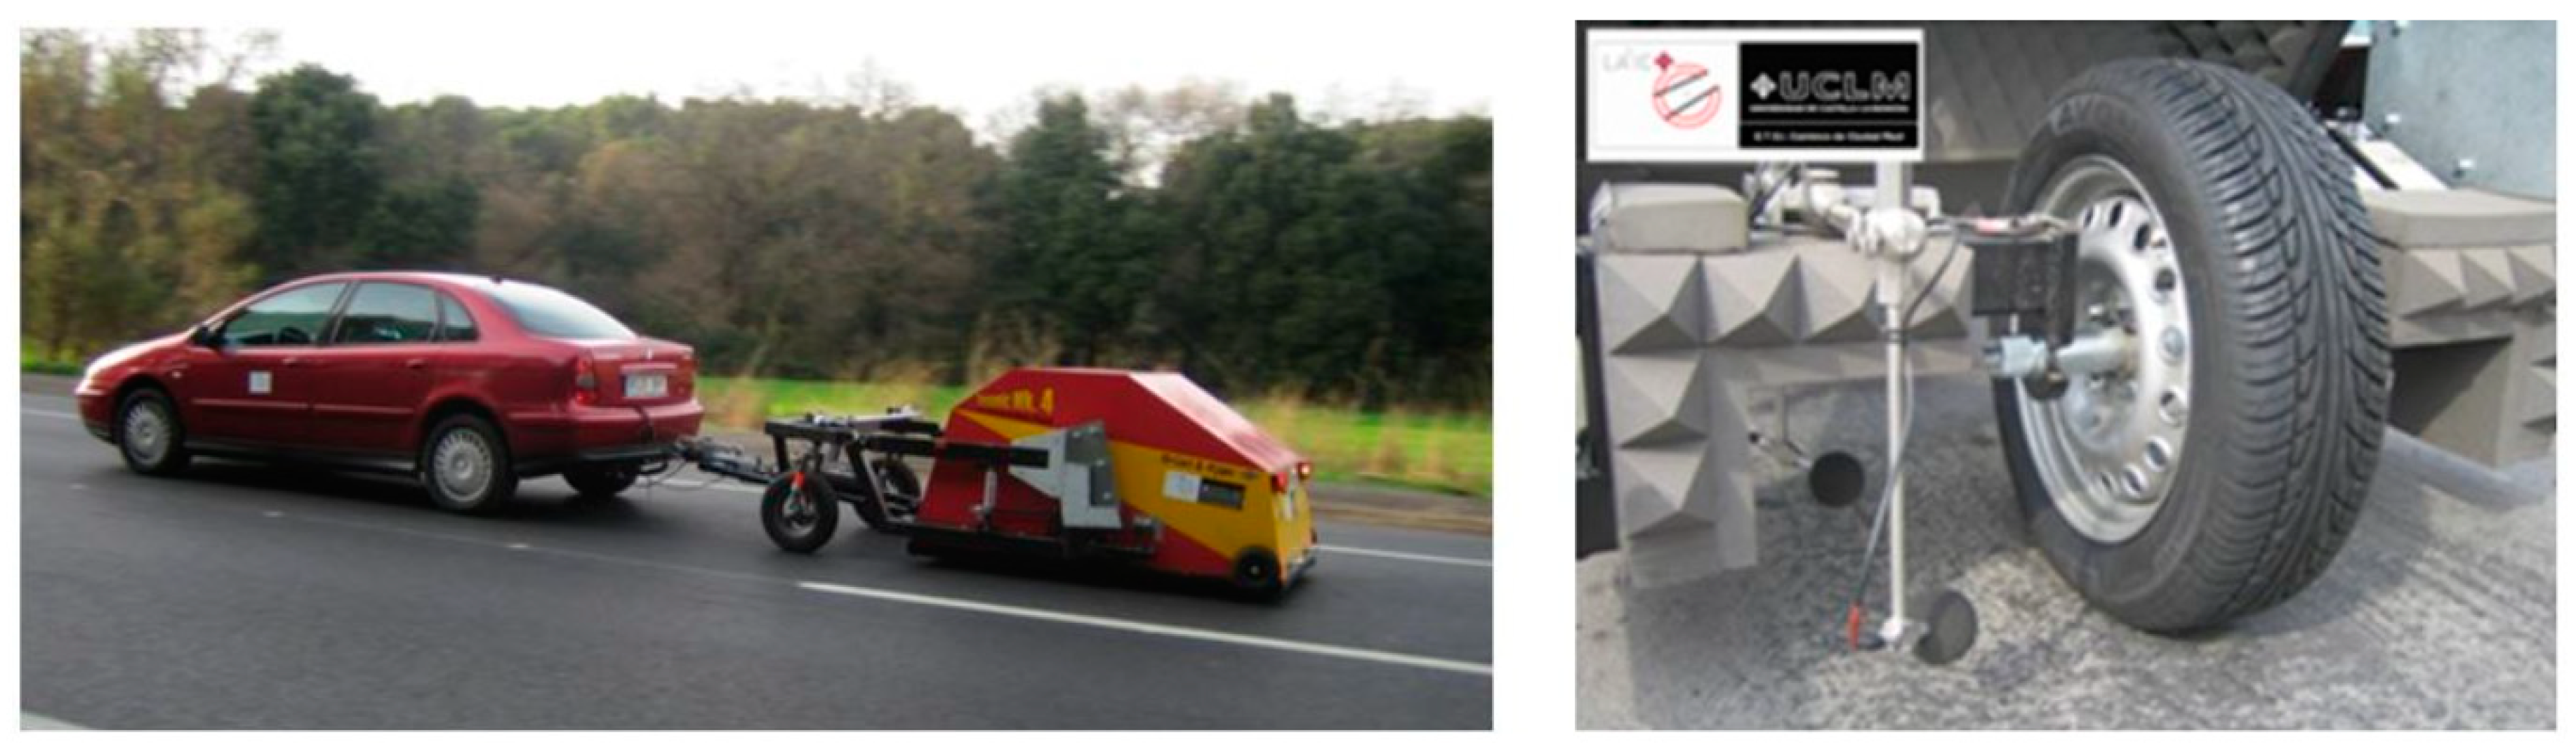
Noise measurements were performed according to the close-proximity (CPX) method. A test trailer named Tiresonic-Mk4-LA2IC, designed and built by the University of Castilla La Mancha in Spain was used (see Figure 3) [25]. Measurements were performed using three test tires at the test speed of 50, 80, and 110 km/h.
2.2. Labeling Scheme
Once all the data were collected, each property was classified into its category (see Table 1). The characterization methods of these properties were chosen to match existing European standards and practices as well as possible. In the cases where no harmonized European methods were available, the Spanish technical standard was used (see Table 1).
Even though characteristics of asphalt mixtures for thin overlays may differ widely between different applications (e.g., motorway vs. low-volume rural road), the designed labeling scheme was deliberately kept as simple as possible, and the same number of label classes was chosen for all the properties. This study proposes a set of performance classes from A to D on the label according to the reduced sample size of collected data, but the developed tool is flexible enough to scale-up the range of characterization as data arise.
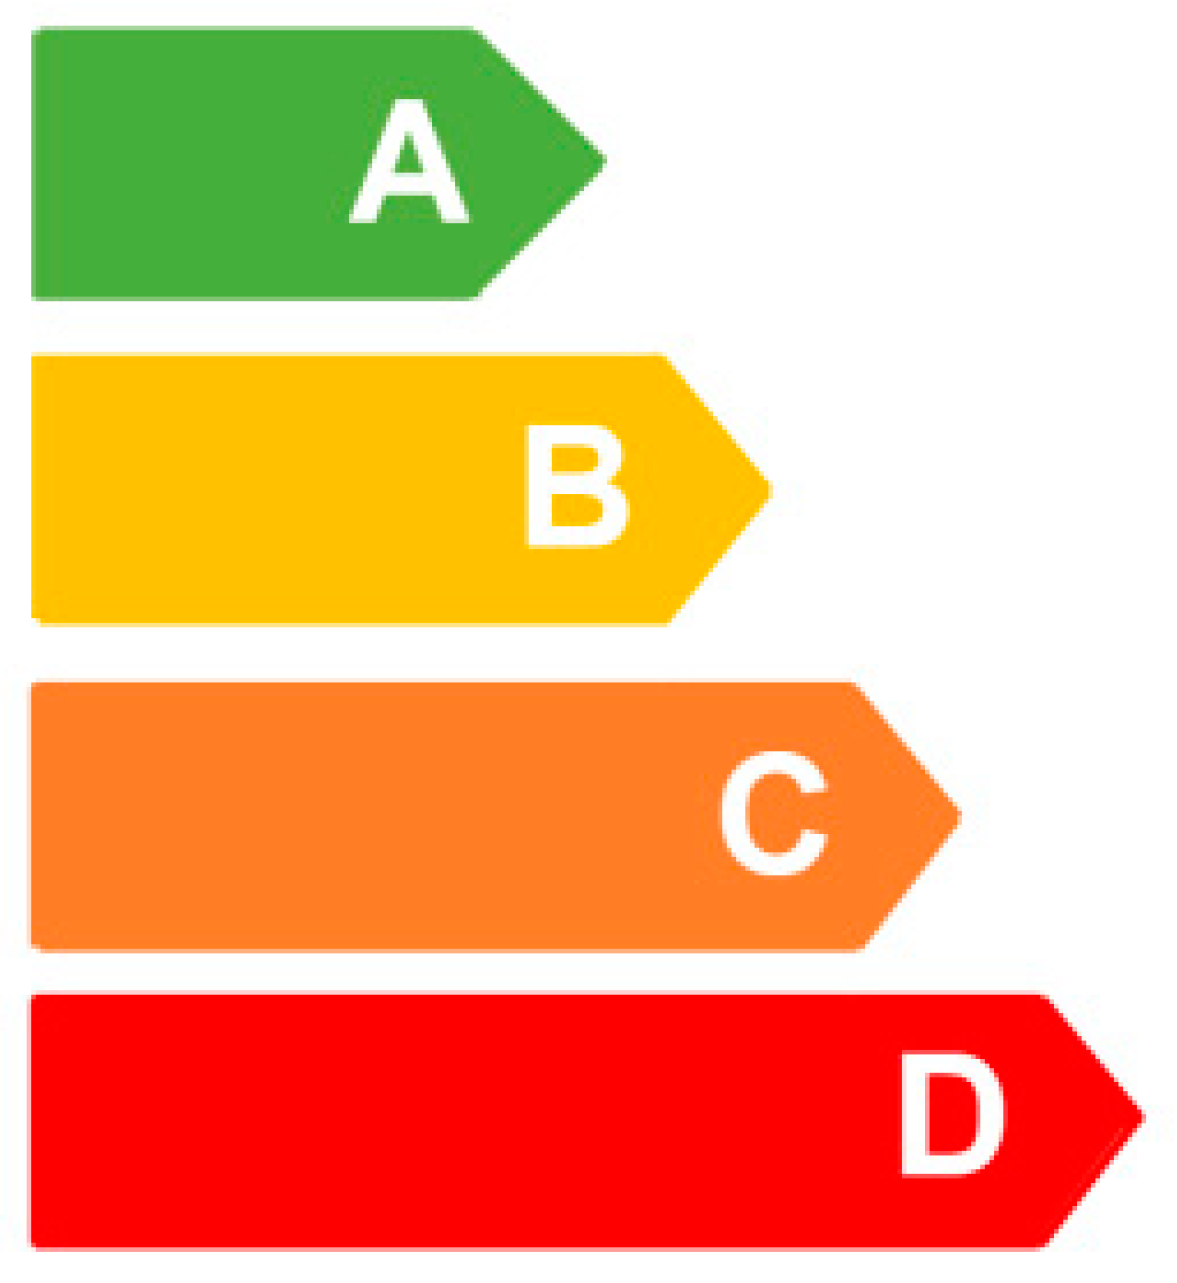
The proposed boundaries of the label classes are chosen such that A is excellent, B represents a current good practice, C represents an acceptable performance, and D does not meet the standards (see Figure 4).
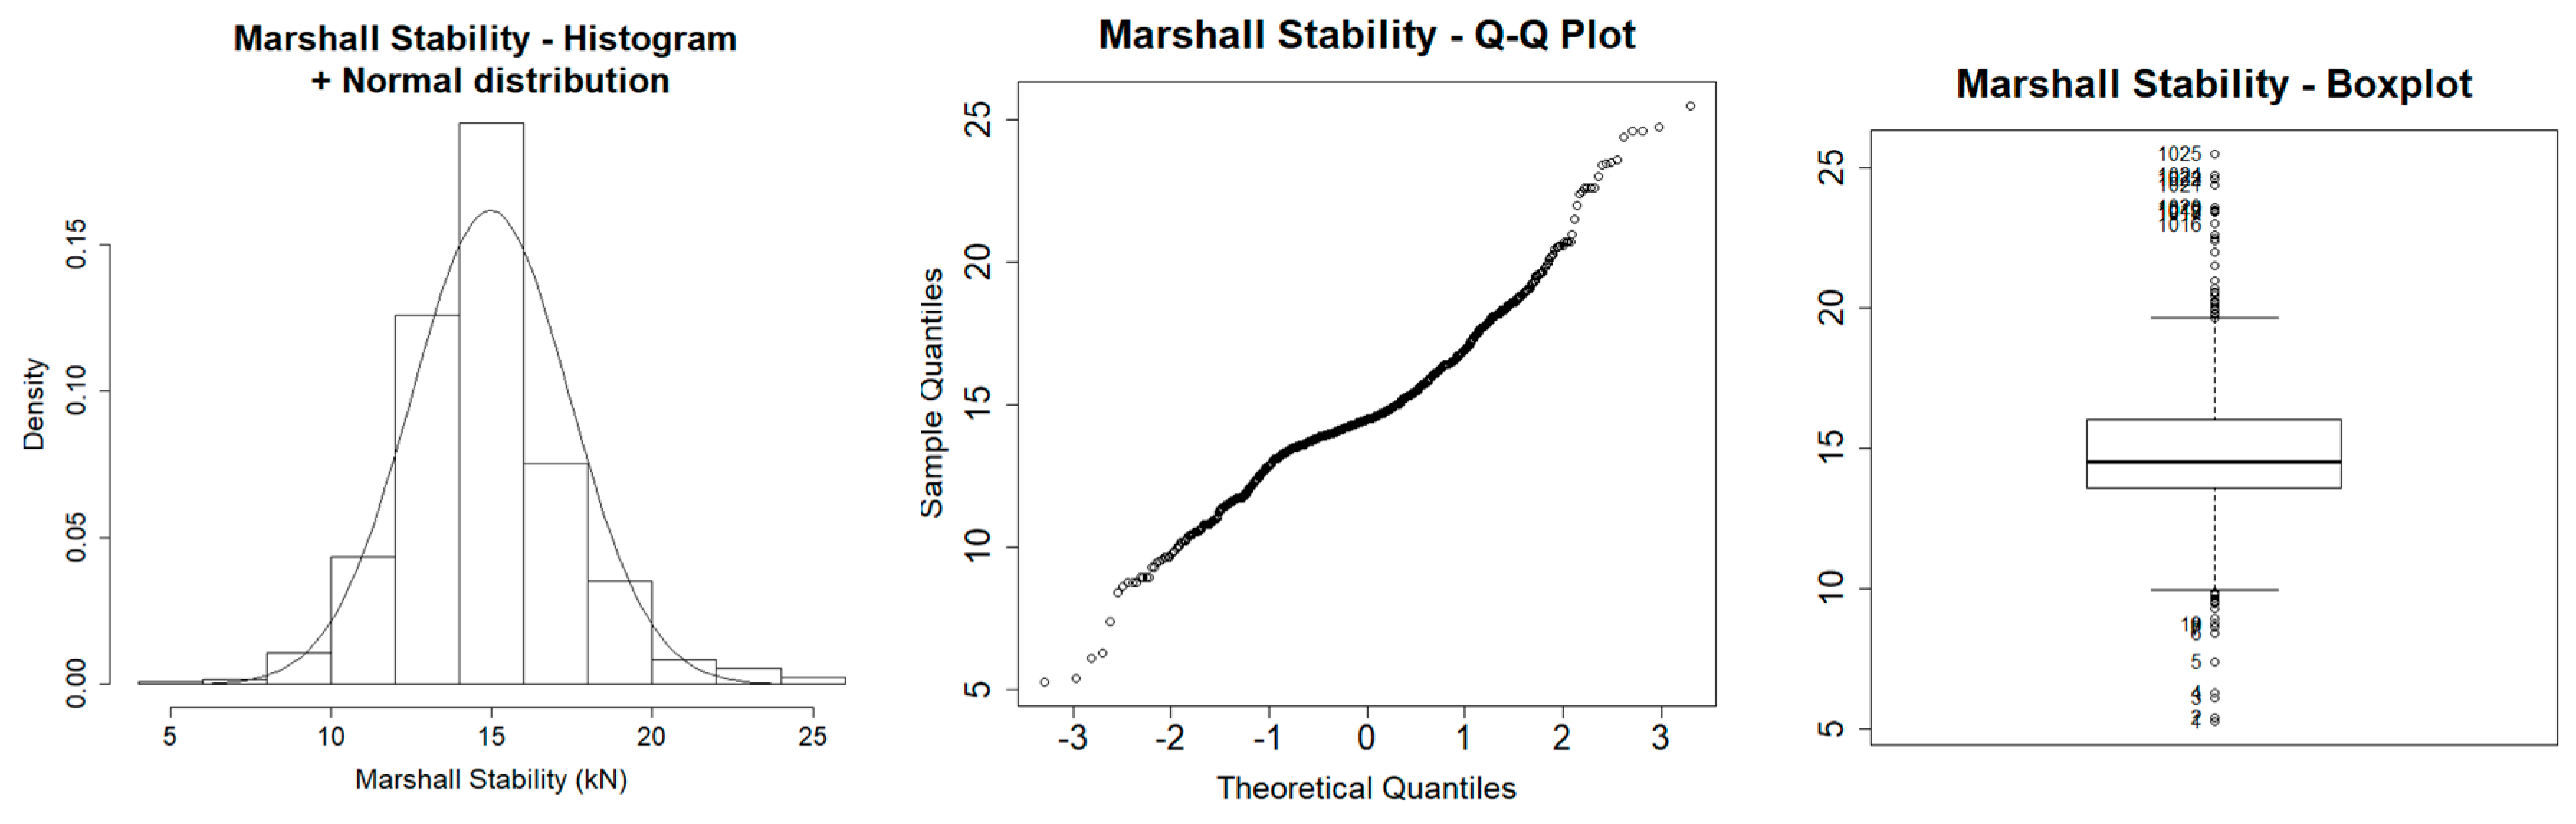
In order to define the limits of each label class, a statistical treatment of the results was carried out to detect outliers, and to establish the working range of the reliable results and their statistical distribution. All indicators were statistically tested to determine if the dataset was well modeled by a normal or log-normal distribution. In order to verify this assumption, normality tests were applied; in particular, graphical methods were used: the histogram was compared to the normal probability curve, the normal probability plot was analyzed, and the boxplot symmetry was checked (see Figure 5).
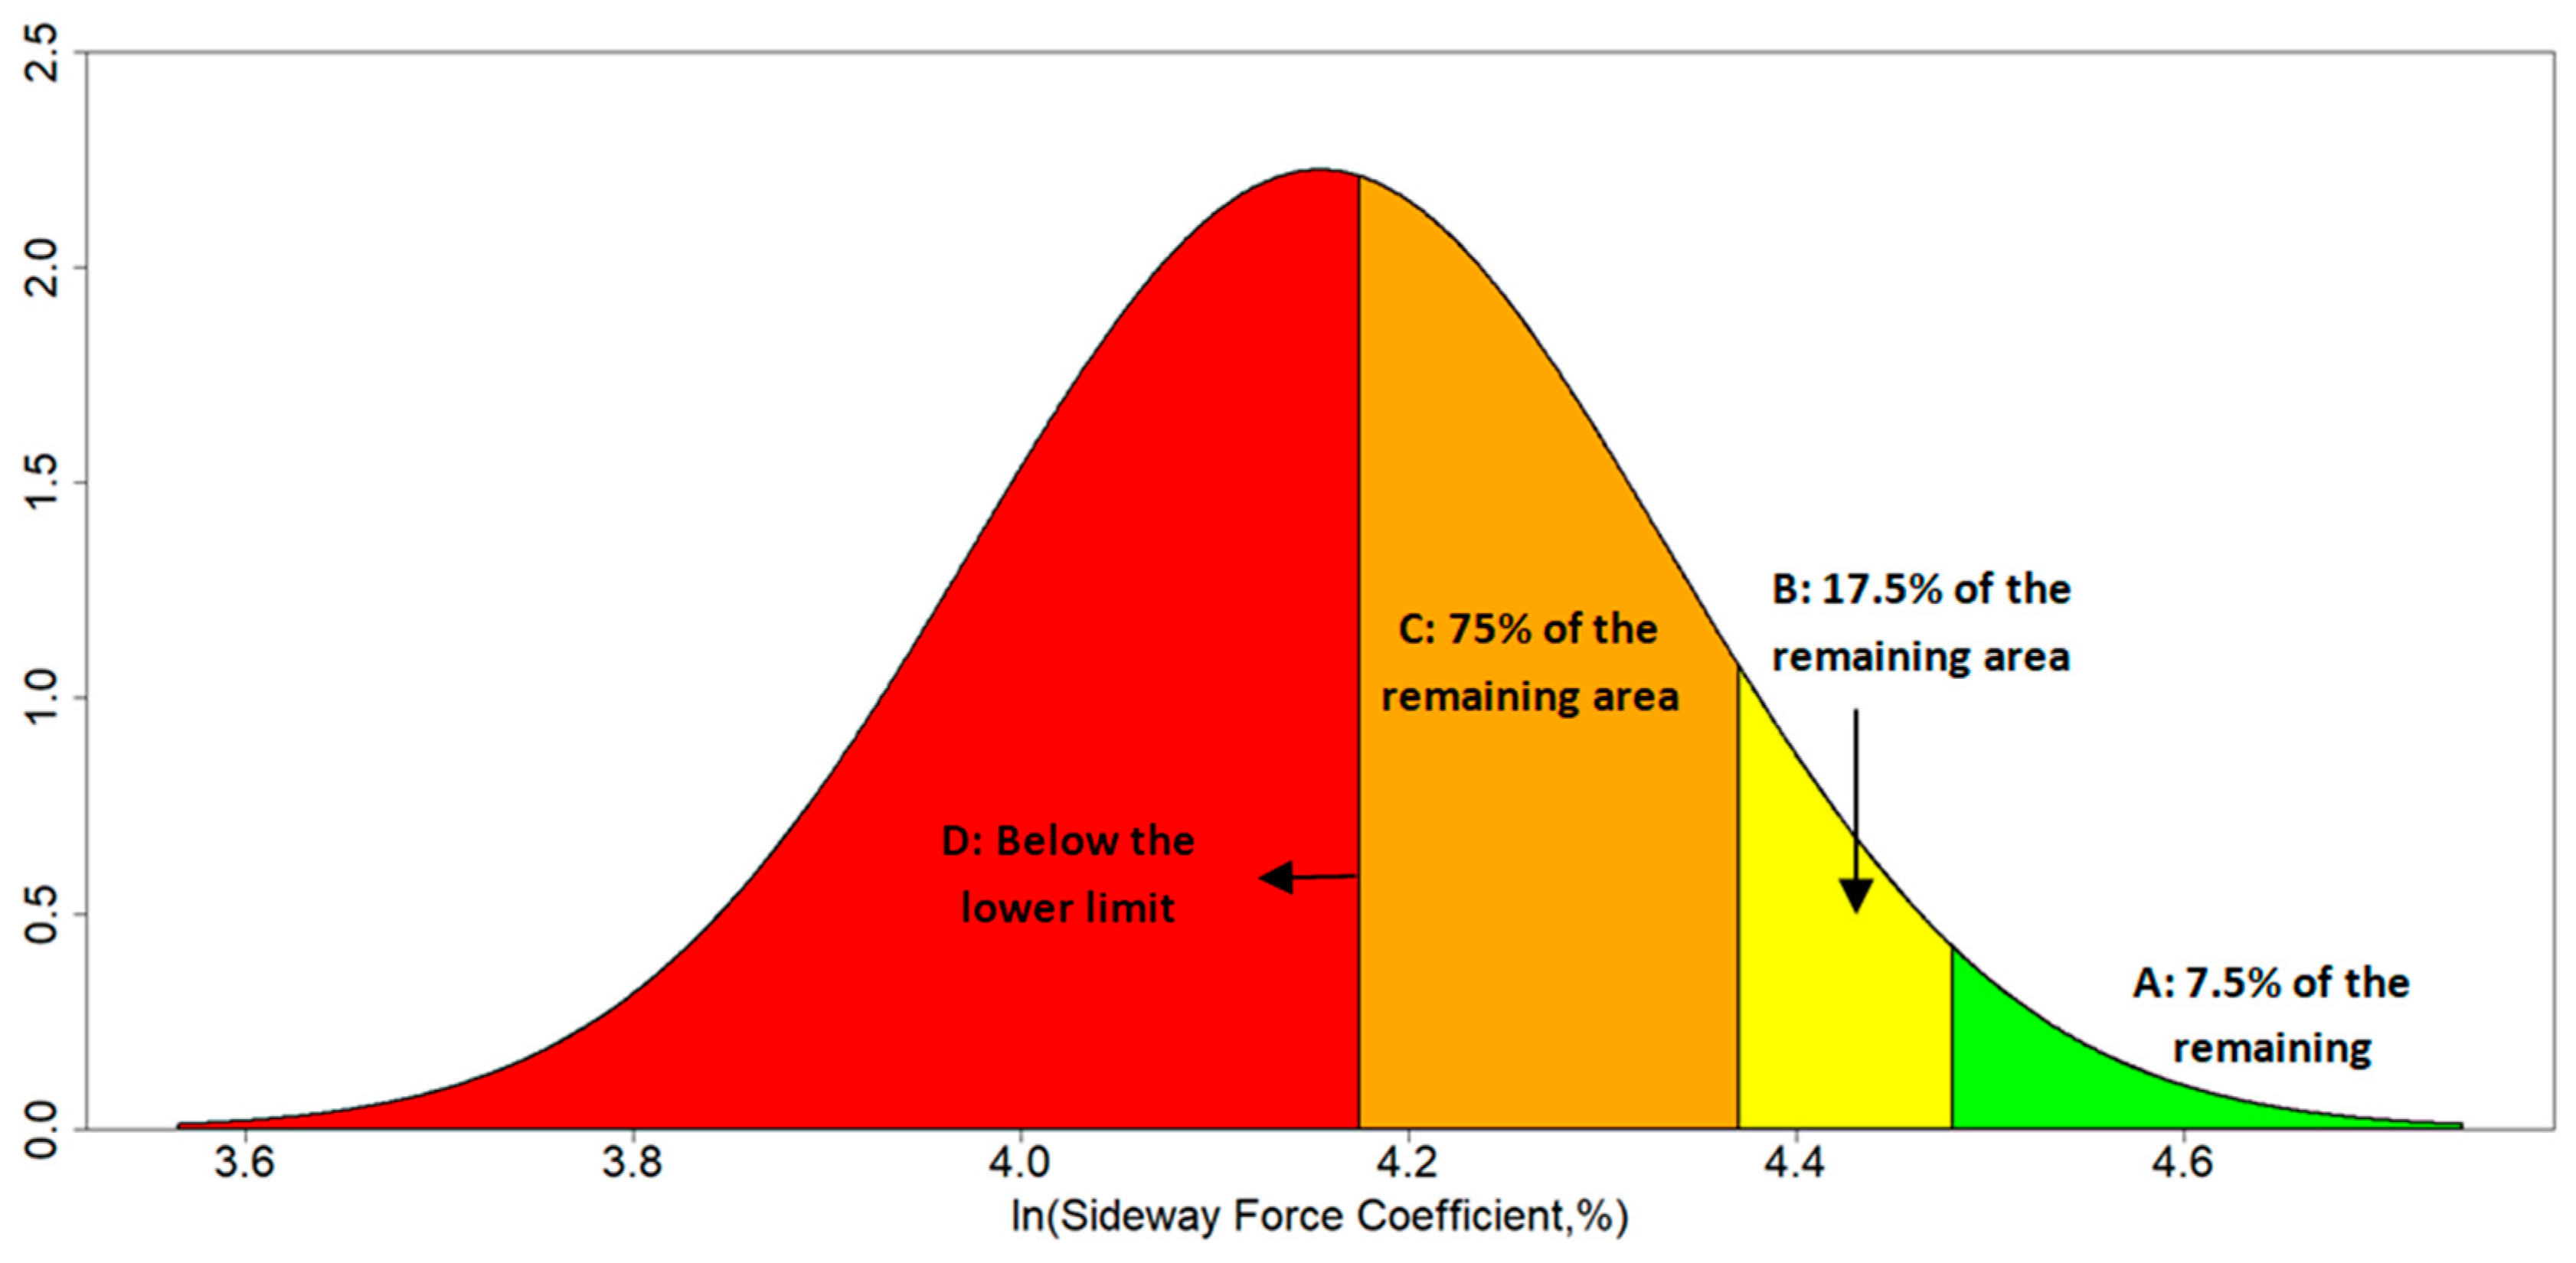
Based on the requirements established by the Spanish technical standard [20], the boundary between acceptable and non-acceptable label classes was defined, but it could be easily applied to any other international standard. Once the non-acceptable class label was defined, the boundaries between acceptable class labels (i.e., C, B, and A labels) were established according to the following percentiles of the statistical distribution (see Figure 6):
- Class D: all values that did not comply with the requirement established by the Spanish technical standard;
- Class C: 75% of the entire area above the lower limit or below the upper limit, as appropriate;
- Class B: 70% of the 25% remaining area, which represented the 17.5% of area;
- Class A: another 30% of the 25% remaining area, i.e., 7.5% of the events that fell into the upper/bottom tail, as appropriate.
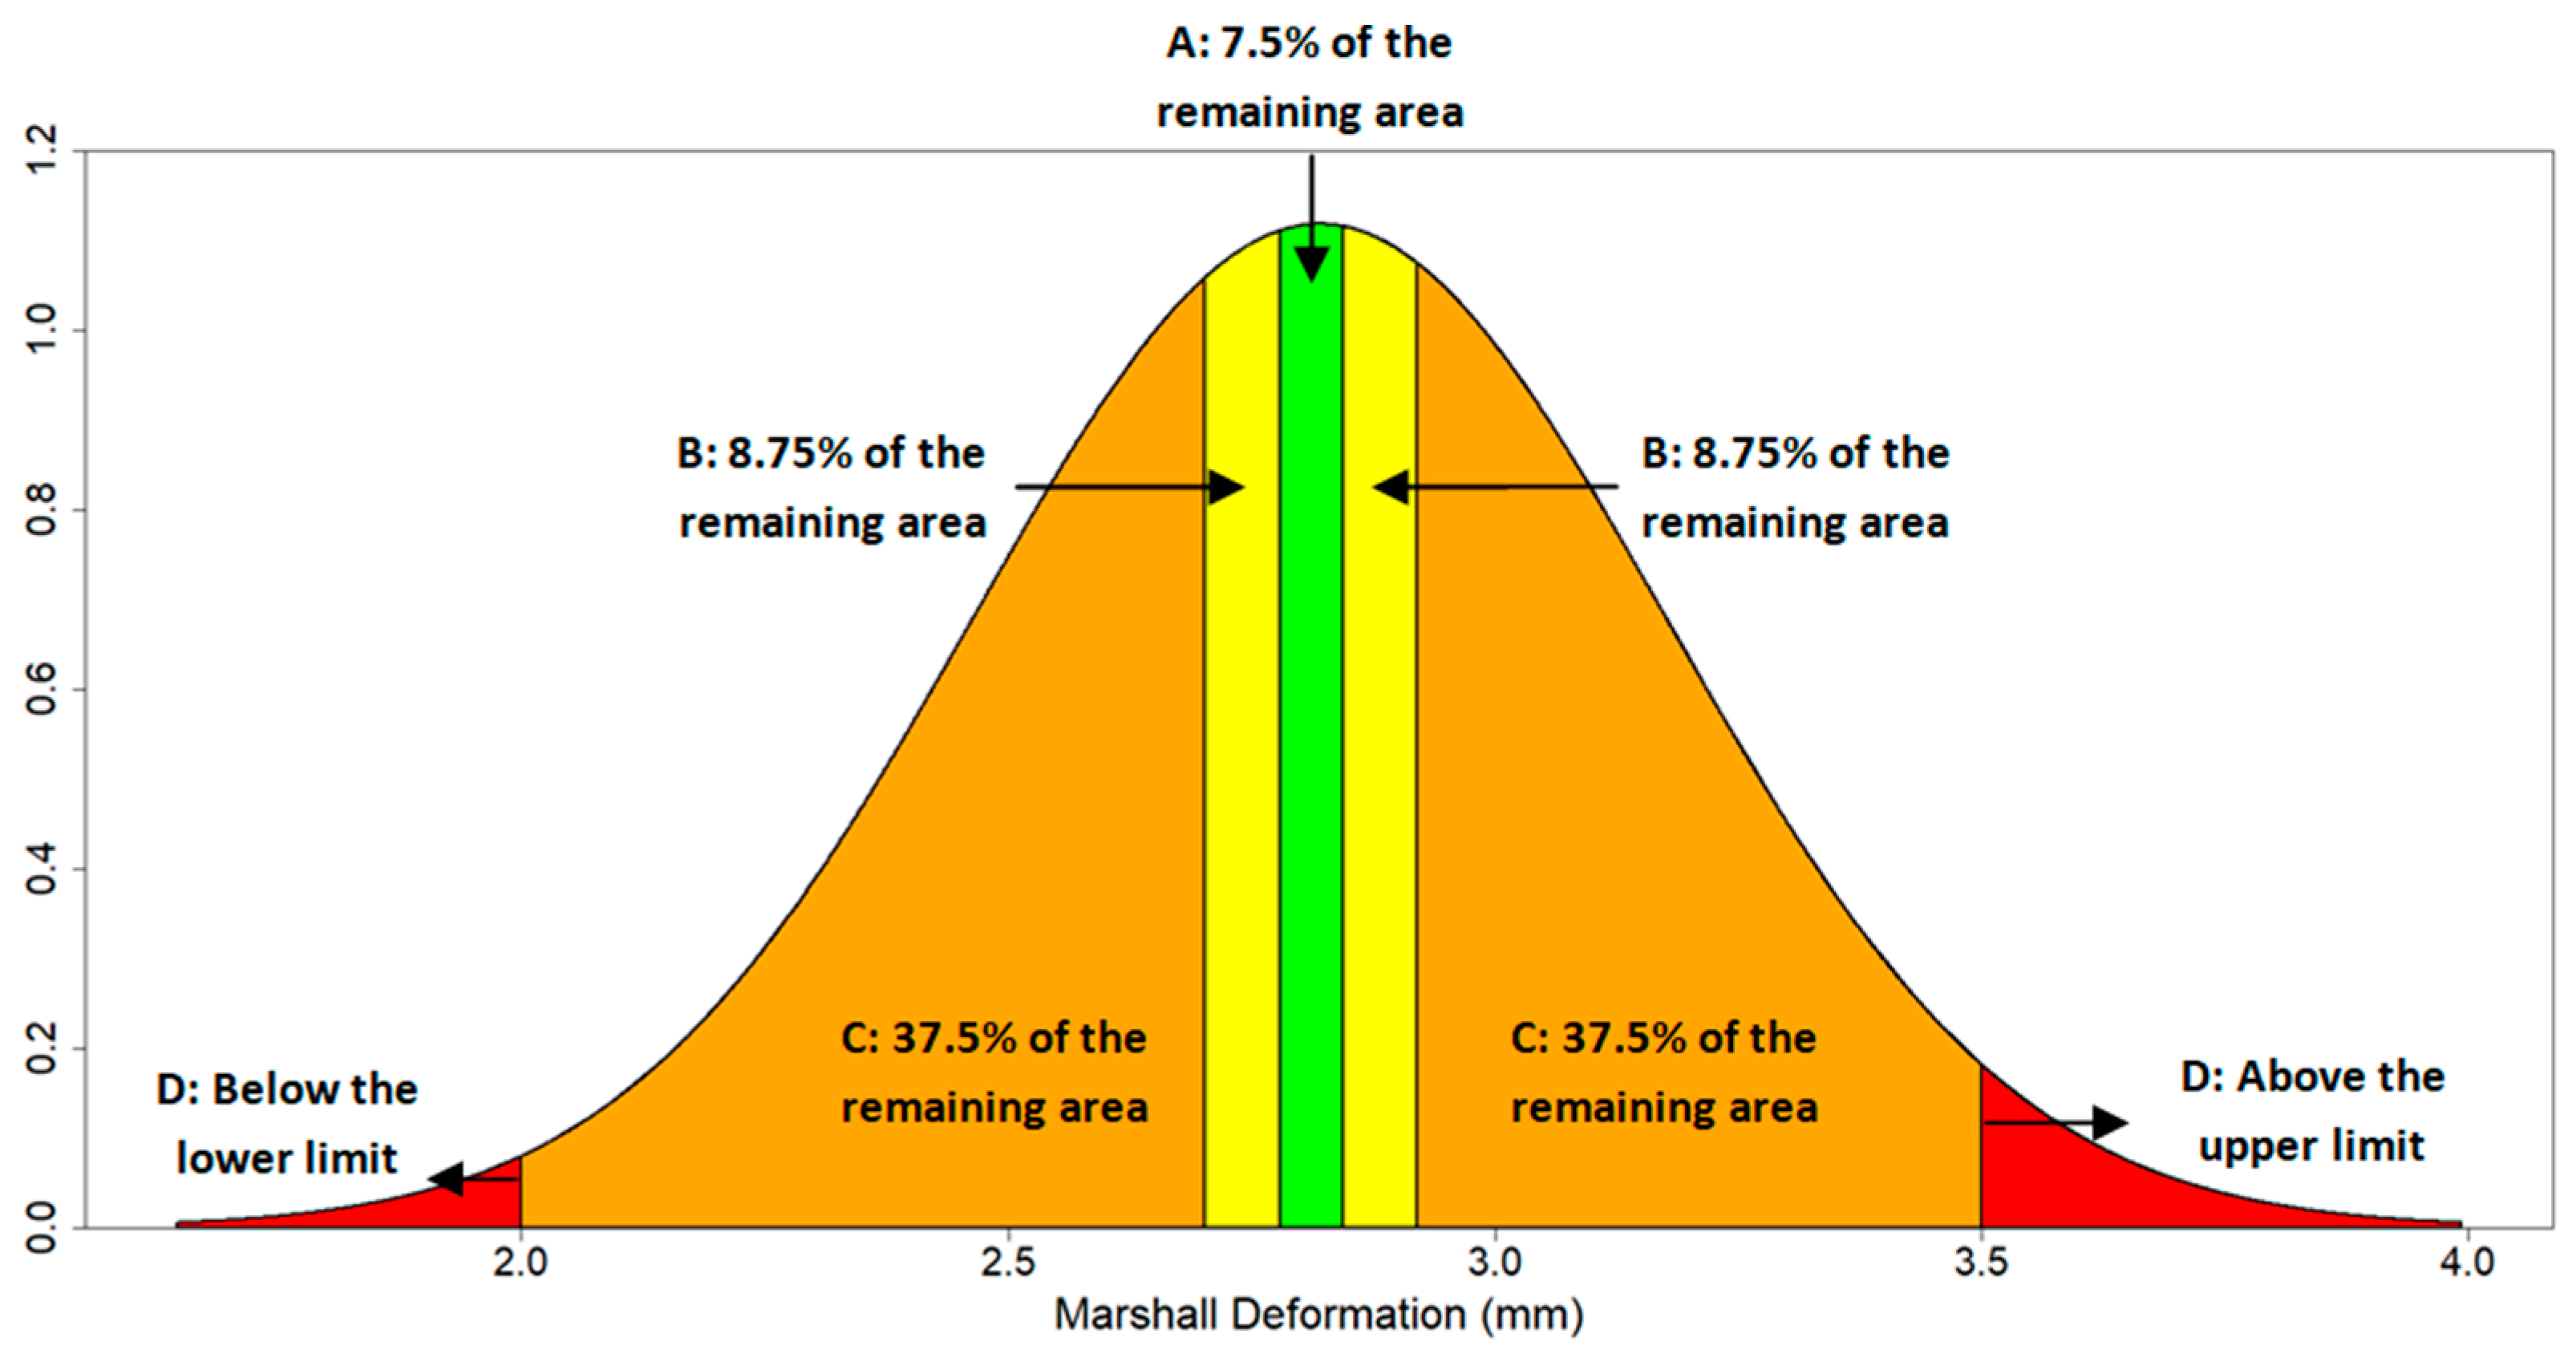
If the technical standard established an upper and a lower limit, the boundaries between classes would follow the same criteria but symmetrically (see Figure 7).
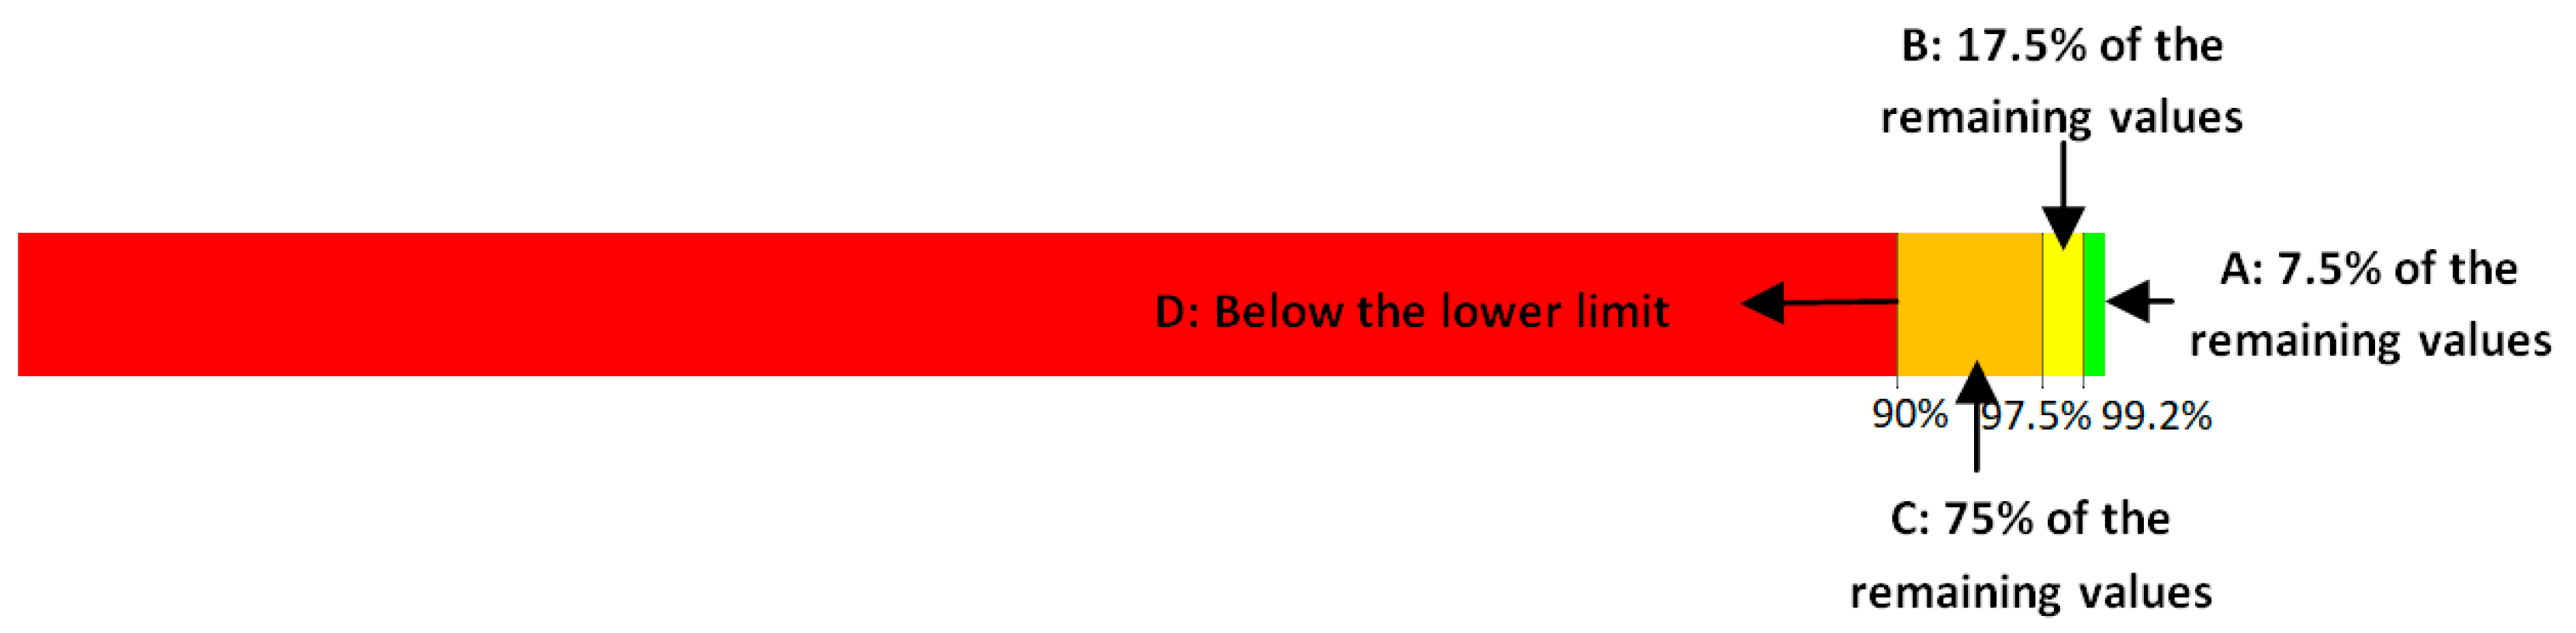
In the case that a property was not well modeled by a normal or log-normal distribution, the values were sorted, outliners were removed, and the same boundary criteria were applied directly to the values, not to their probability (see Figure 8).
Additionally, the Spanish technical standard established for certain indicators different values based on the type of mixture. Therefore, different labels were defined according to the mixture type, if applicable, and a global label was also determined for those situations in which the type of mixture is unknown.
It must be noted that, based on the available data and the requirements established by the road administration, the values of boundaries will change from one country to another, but the methodology and criteria for setting the class limits were designed to be applicable to any situation.
Once each property had its classification assigned, it was necessary to evaluate the set of properties to measure the performance of each category.
To do so, qualitative labels were transformed into quantitative indicators, rated at 0, 1, 2, and 3 for D, C, B, and A, respectively, and a geometric mean was applied to the set of properties to determine the global performance. The use of a geometric mean allowed for a performance penalty when one of the properties did not meet the technical requirements.
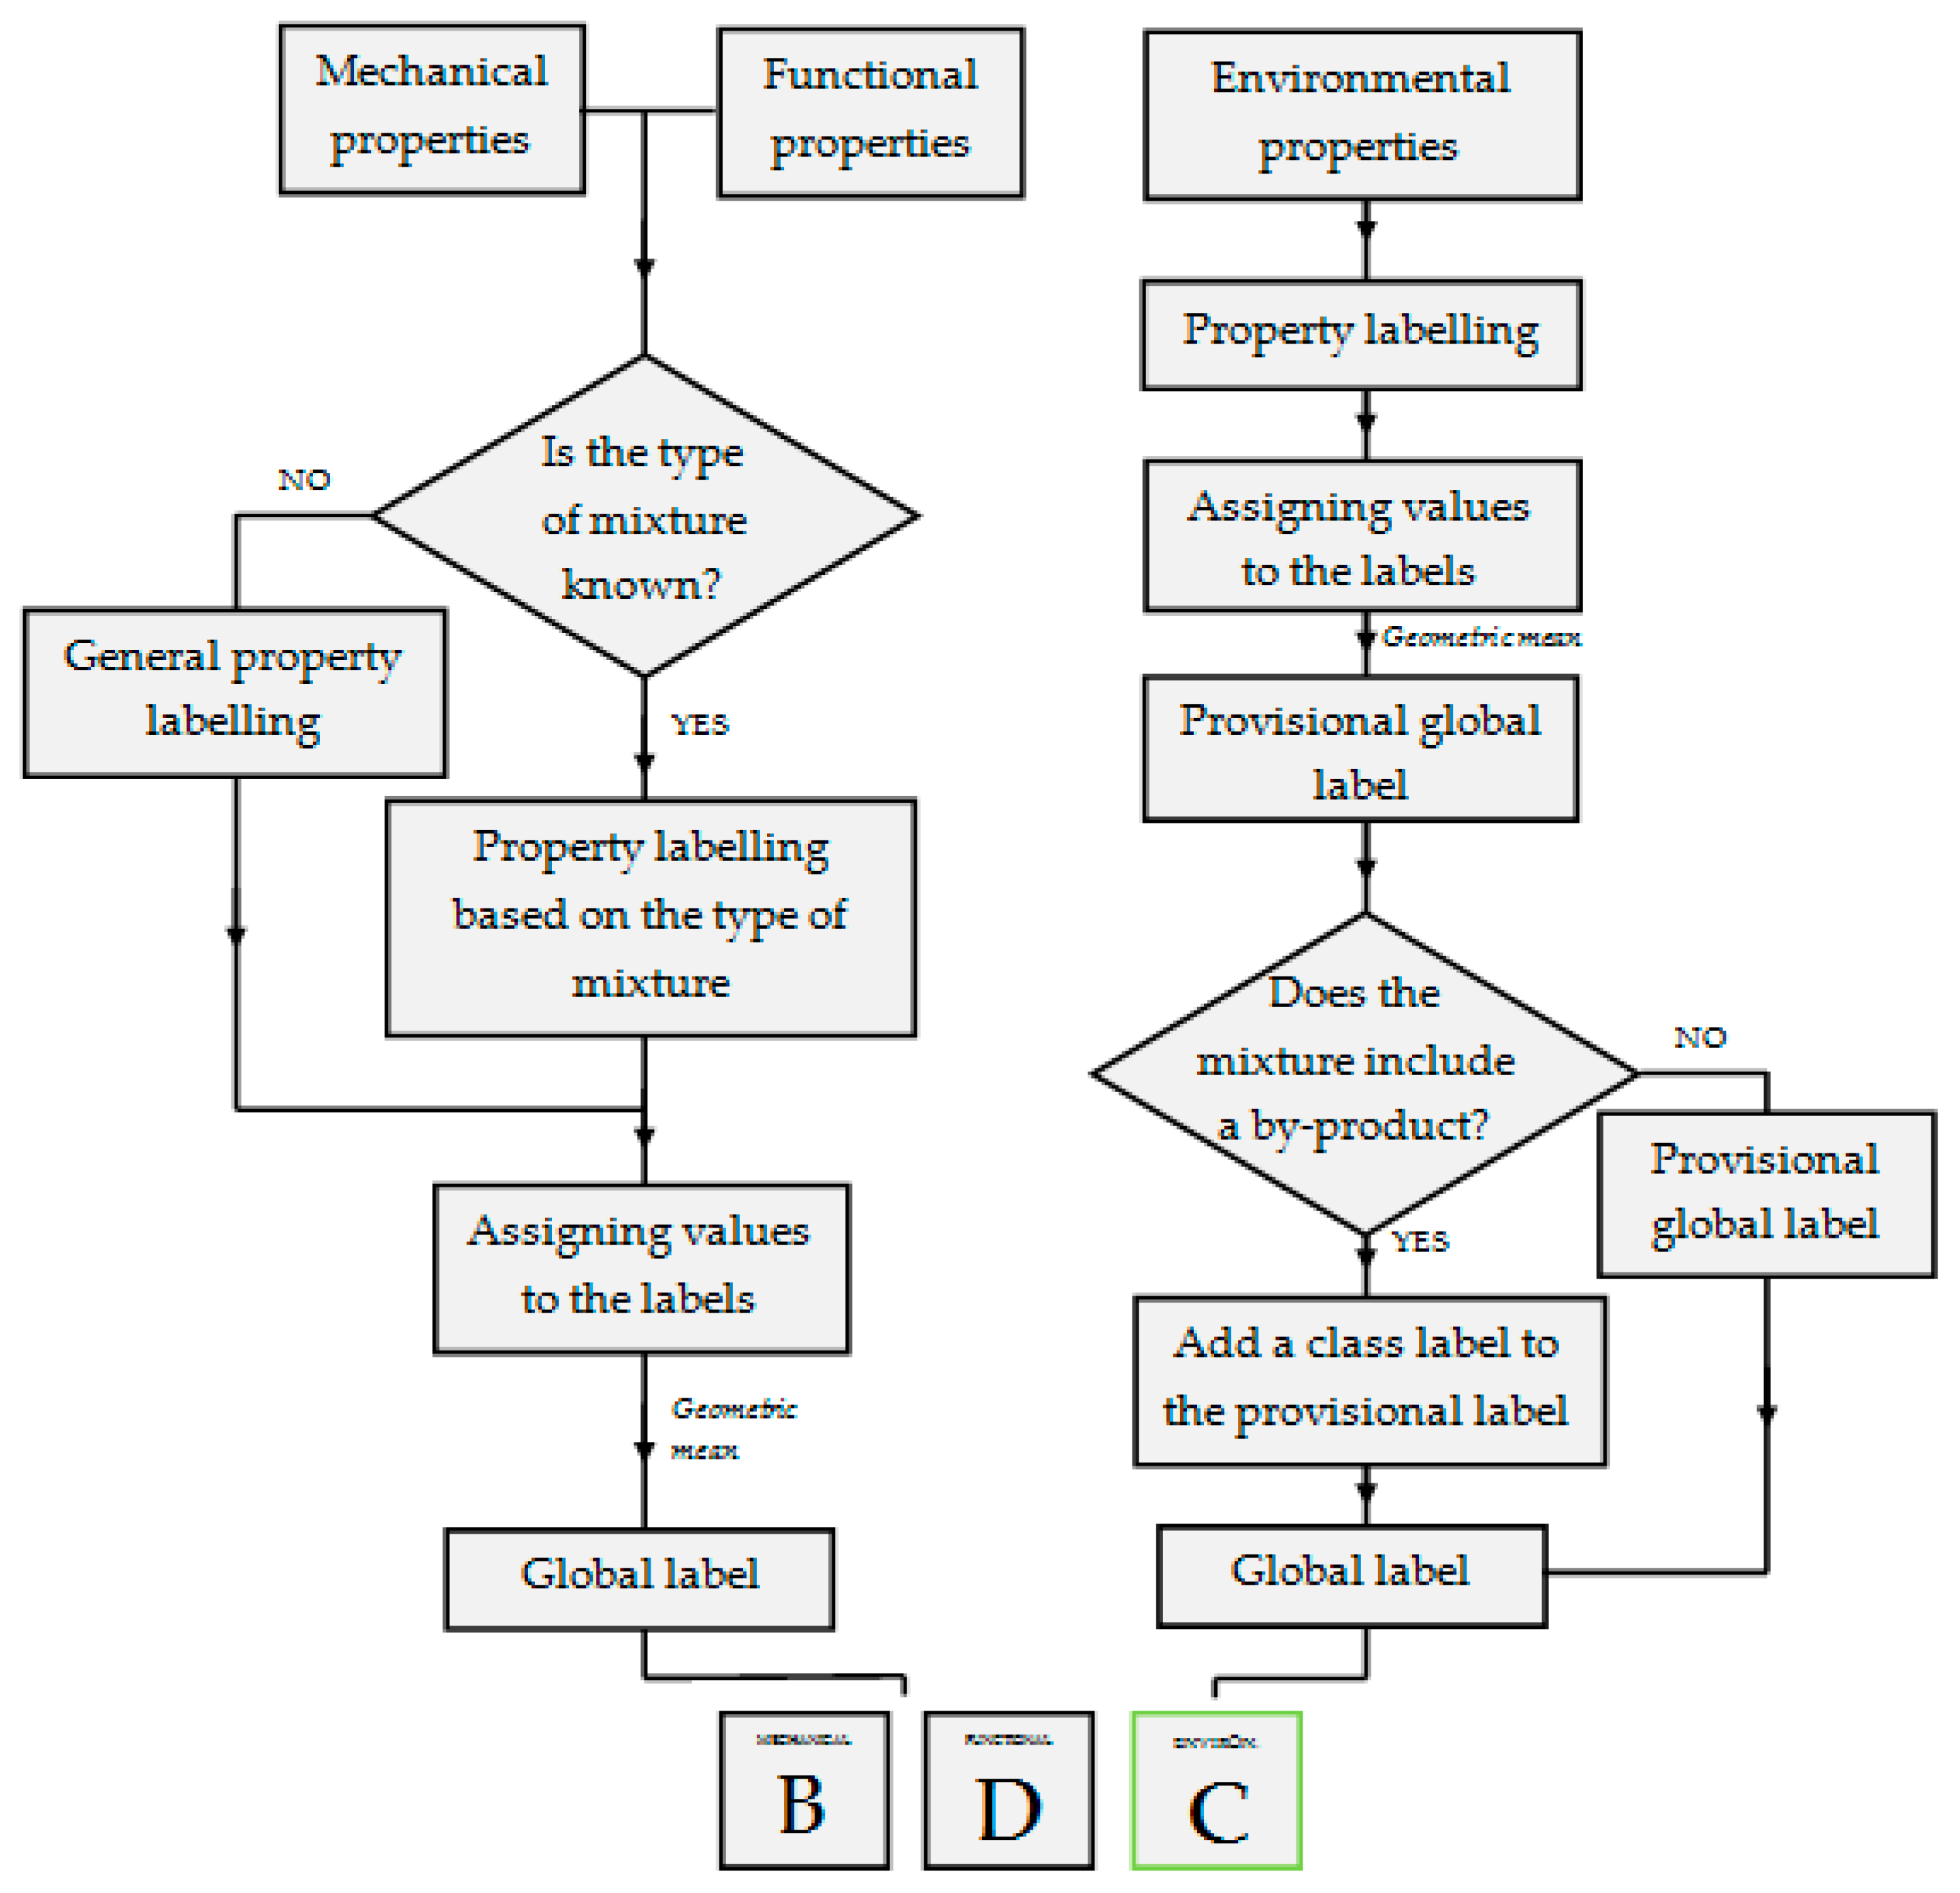
This approach could be easily applied to evaluate mechanical and functional performance; however, when it came to environmental performance, there were certain minor nuances. Environmental performance covered quantifiable and non-quantifiable properties. For instance, tire–pavement noise is a quantifiable property and performance ranges can be easily defined; the same applies to the percentage of replacement of virgin aggregates by recycled aggregate pavement or the production temperature of the asphalt mixture. On the other hand, the use of by-products or other recycled materials, which are less well studied to date, were considered as a non-quantifiable property; thus, they could not be transformed into a quantitative indicator, and they directly added a class label to the obtained provisional label from the geometric mean if the mixture included a by-product (see Figure 9).
It should be noted that the attainment of a D grade in terms of mechanical and functional performance means that the mixture does not comply with the technical standard; thus, its use must be refused. However, in the case of environmental performance, this label has a merely informative character and it only pretends to encourage the use of more sustainable technologies.
3. Results and Discussion
This section presents the obtained labels, based on the Spanish technical standard, for all the collected data from different roads of the Spanish network. As mentioned, the values of the label limits may vary based on the database and must be adjusted to each study case because technical standards, specifications, type of mixture, construction techniques, used materials, traffic, weather conditions, age of the pavement, preservation techniques, etc. differ from one country to another.
3.1. Mechanical Performance
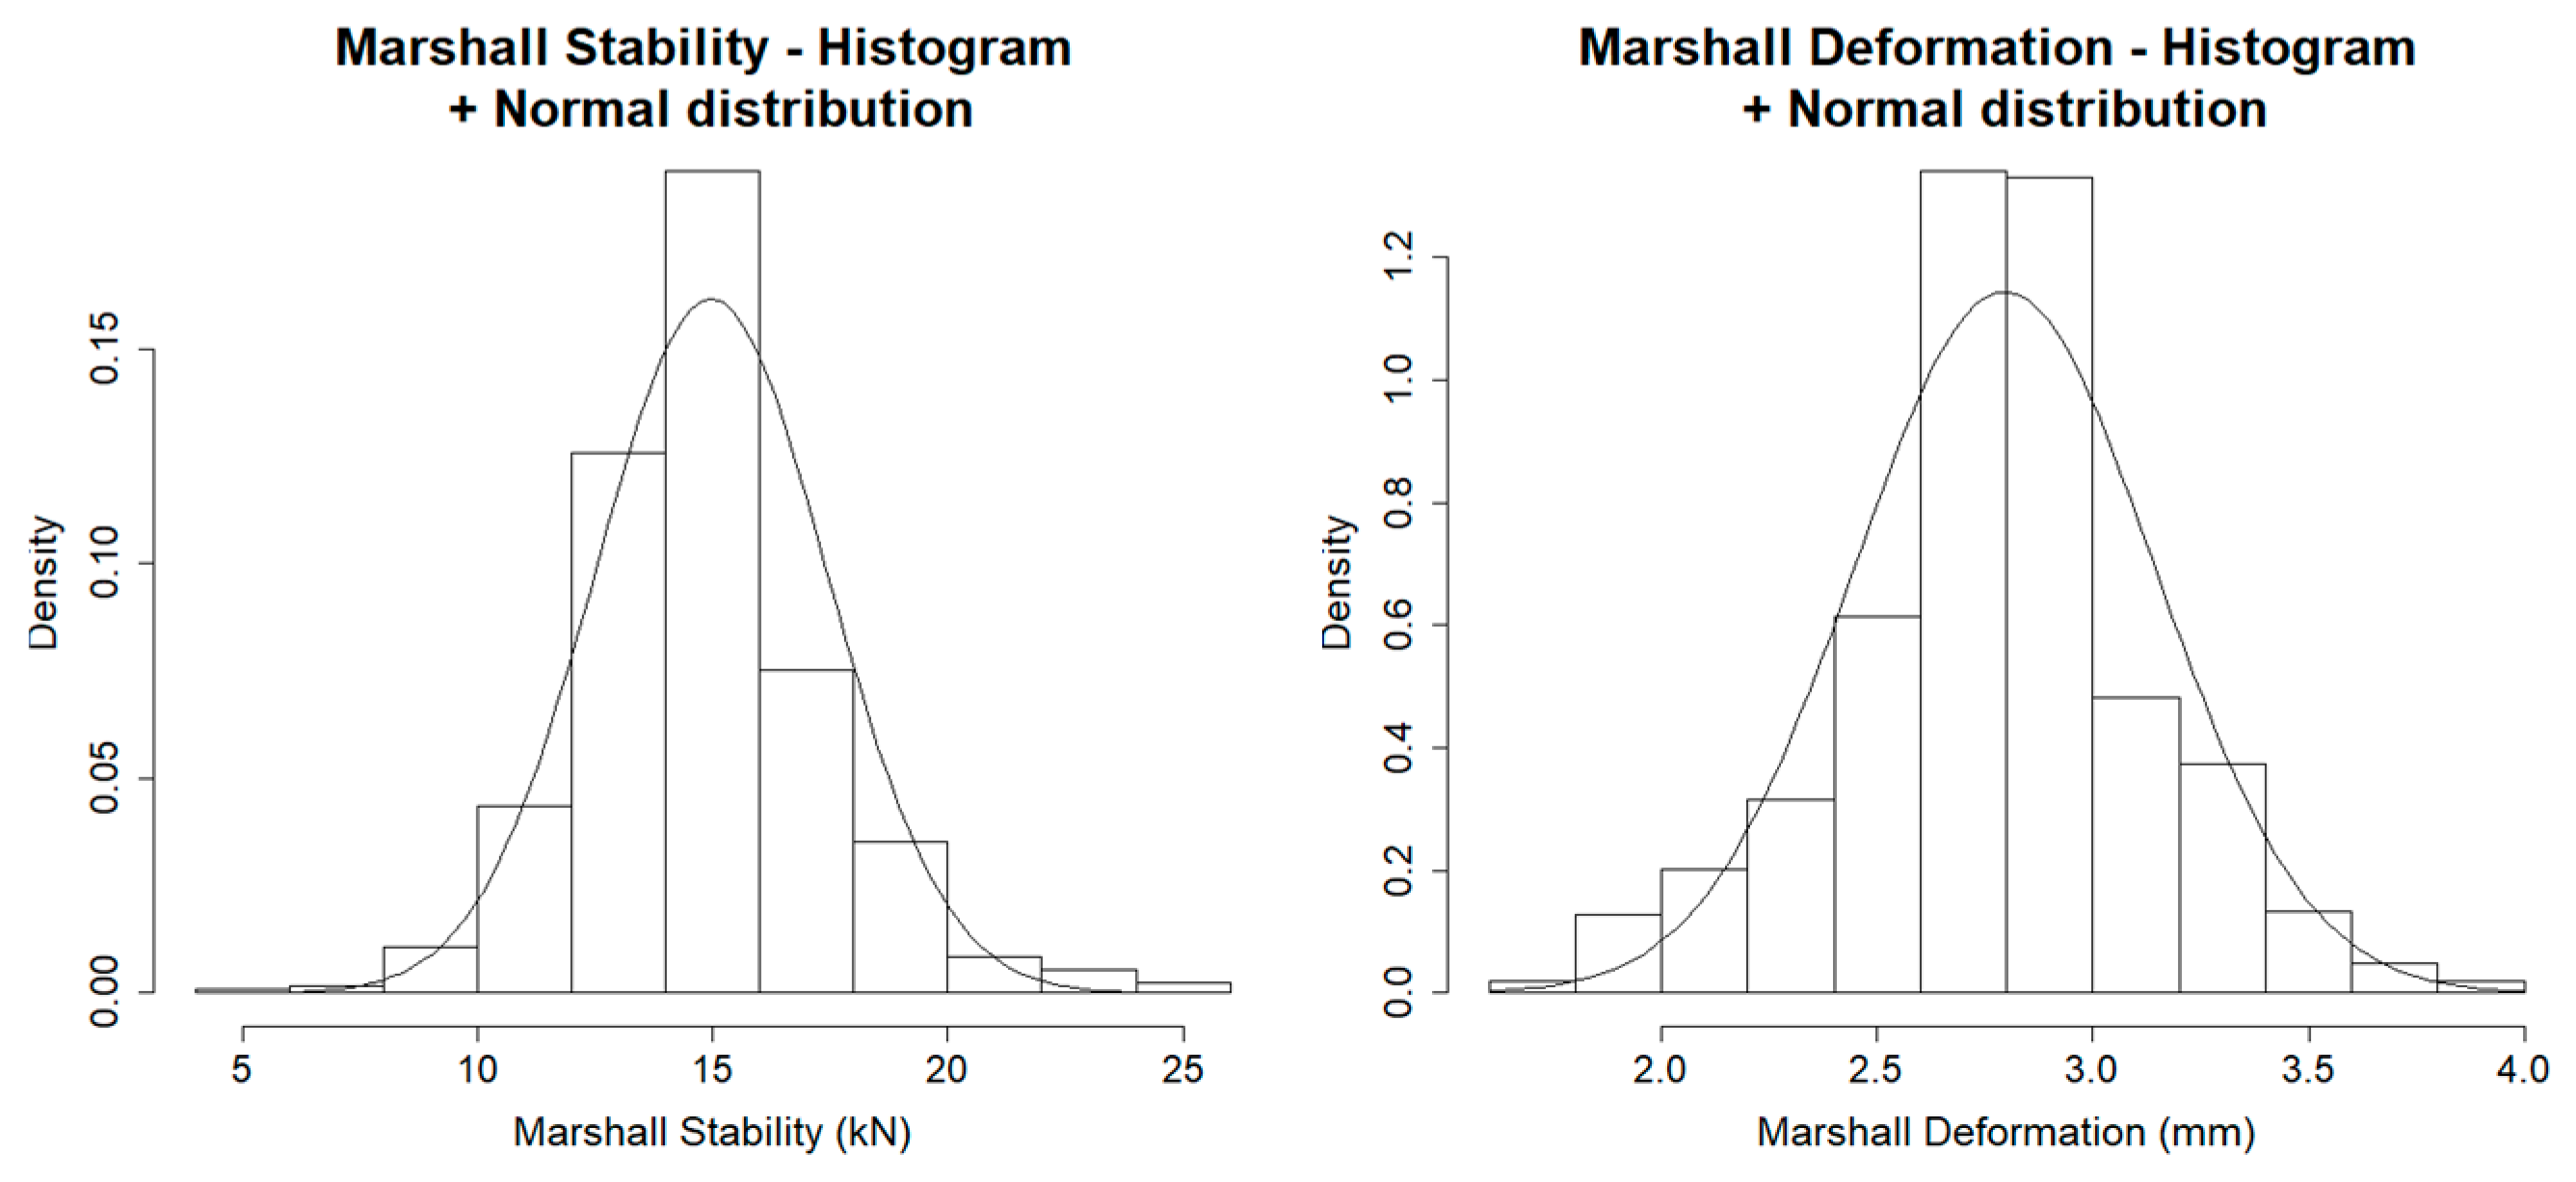
In terms of stability, two indicators were assigned: Marshall stability and Marshall deformation. Both properties were well represented by a normal distribution (see Figure 10); thus, the boundaries of the labels were defined according to the probabilistic criteria mentioned in Section 2.2.
The Spanish technical standard establishes a minimum value for Marshall stability. This may lead to the assumption that a higher stability value results in a greater performance, but this is not true for wearing courses for thin layers. A bituminous mixture with a high stability value may result excessively stiff and lead to a brittle fracture. For this reason, a maximum value was also defined, and the limits were established symmetrically; the 50th percentile was designed as the optimal stability.
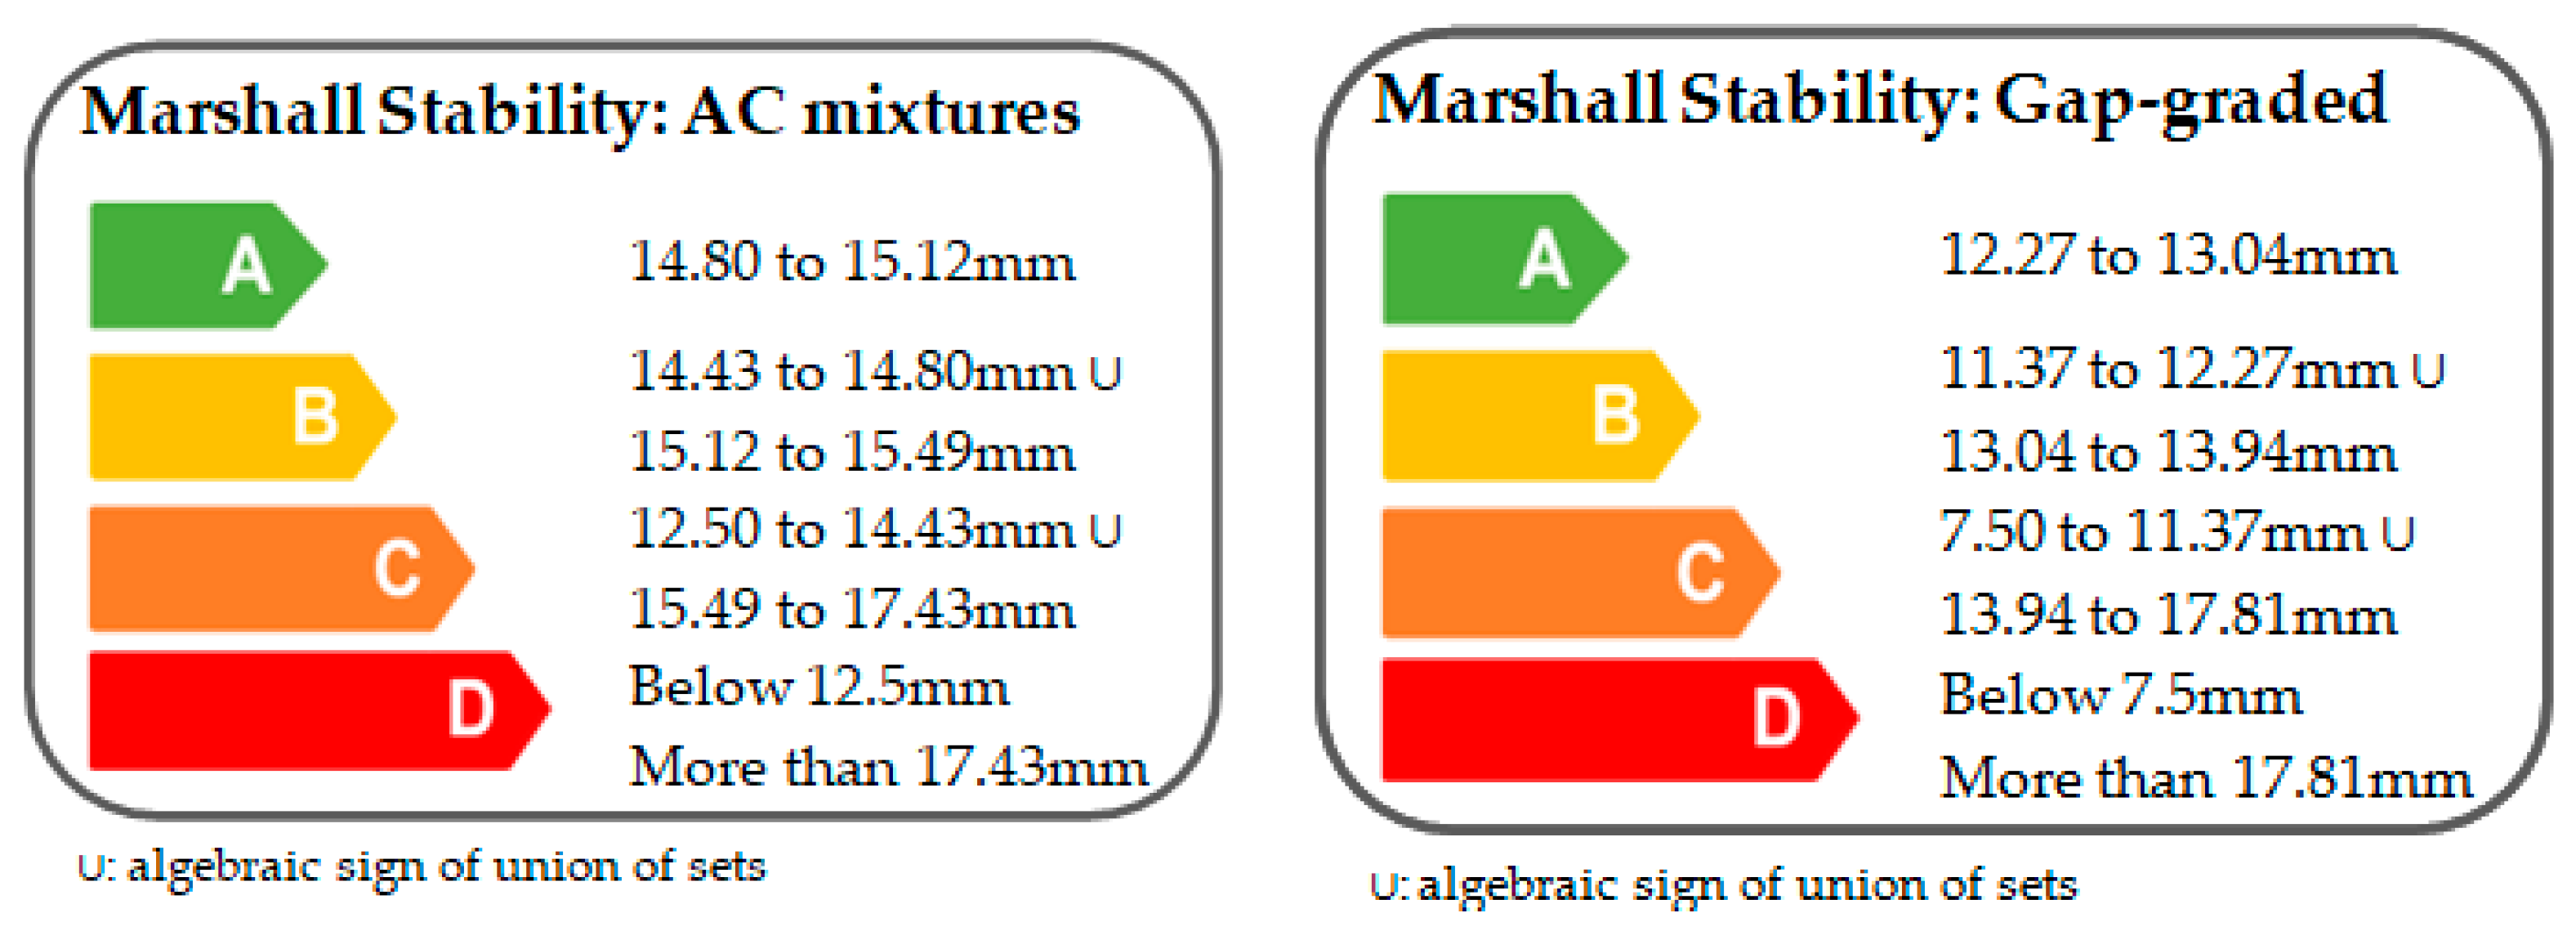
Indeed, the standard establishes different minimum values based on the type of mixture: dense and semi-dense mixtures, also known as asphalt–concrete (AC) mixtures, and gap-graded mixtures [33]. Hence, different labels were developed depending on the type of mixture (see Figure 11).
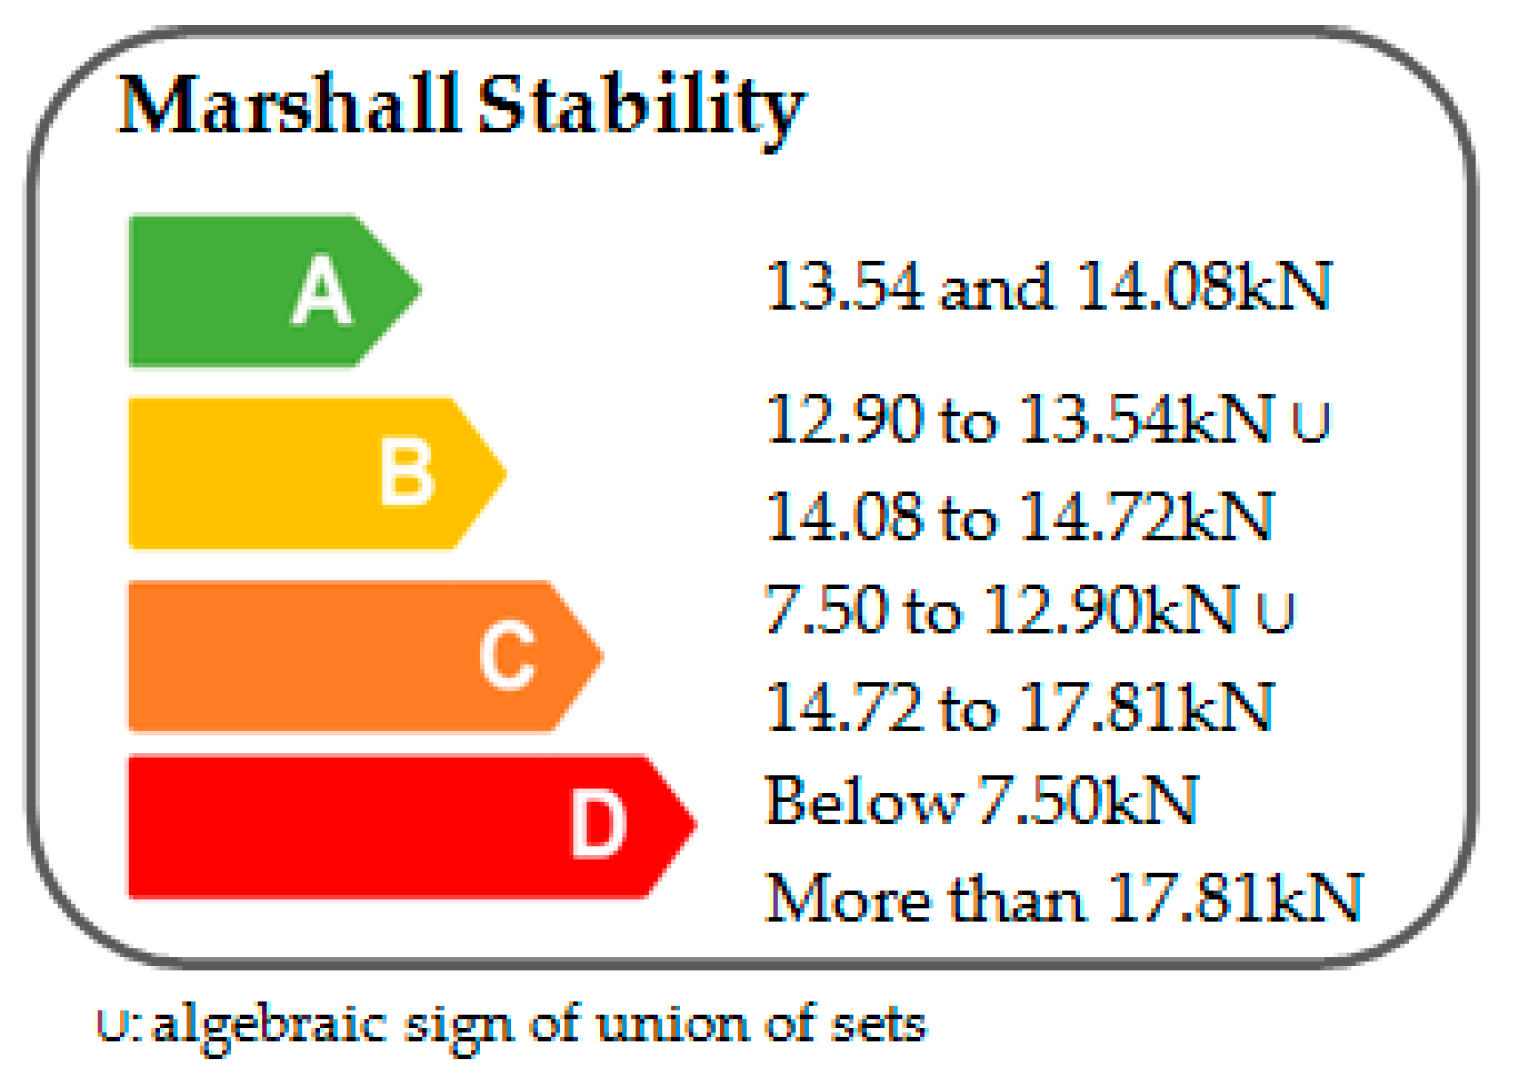
A global label was also defined for cases where the nature of the mixture was unknown, and the chosen minimum and maximum values corresponded to the less restrictive mixture type to avoid penalizing mixtures that may comply with the standard (see Figure 12). In any case, it is recommended to verify the type of mixture.
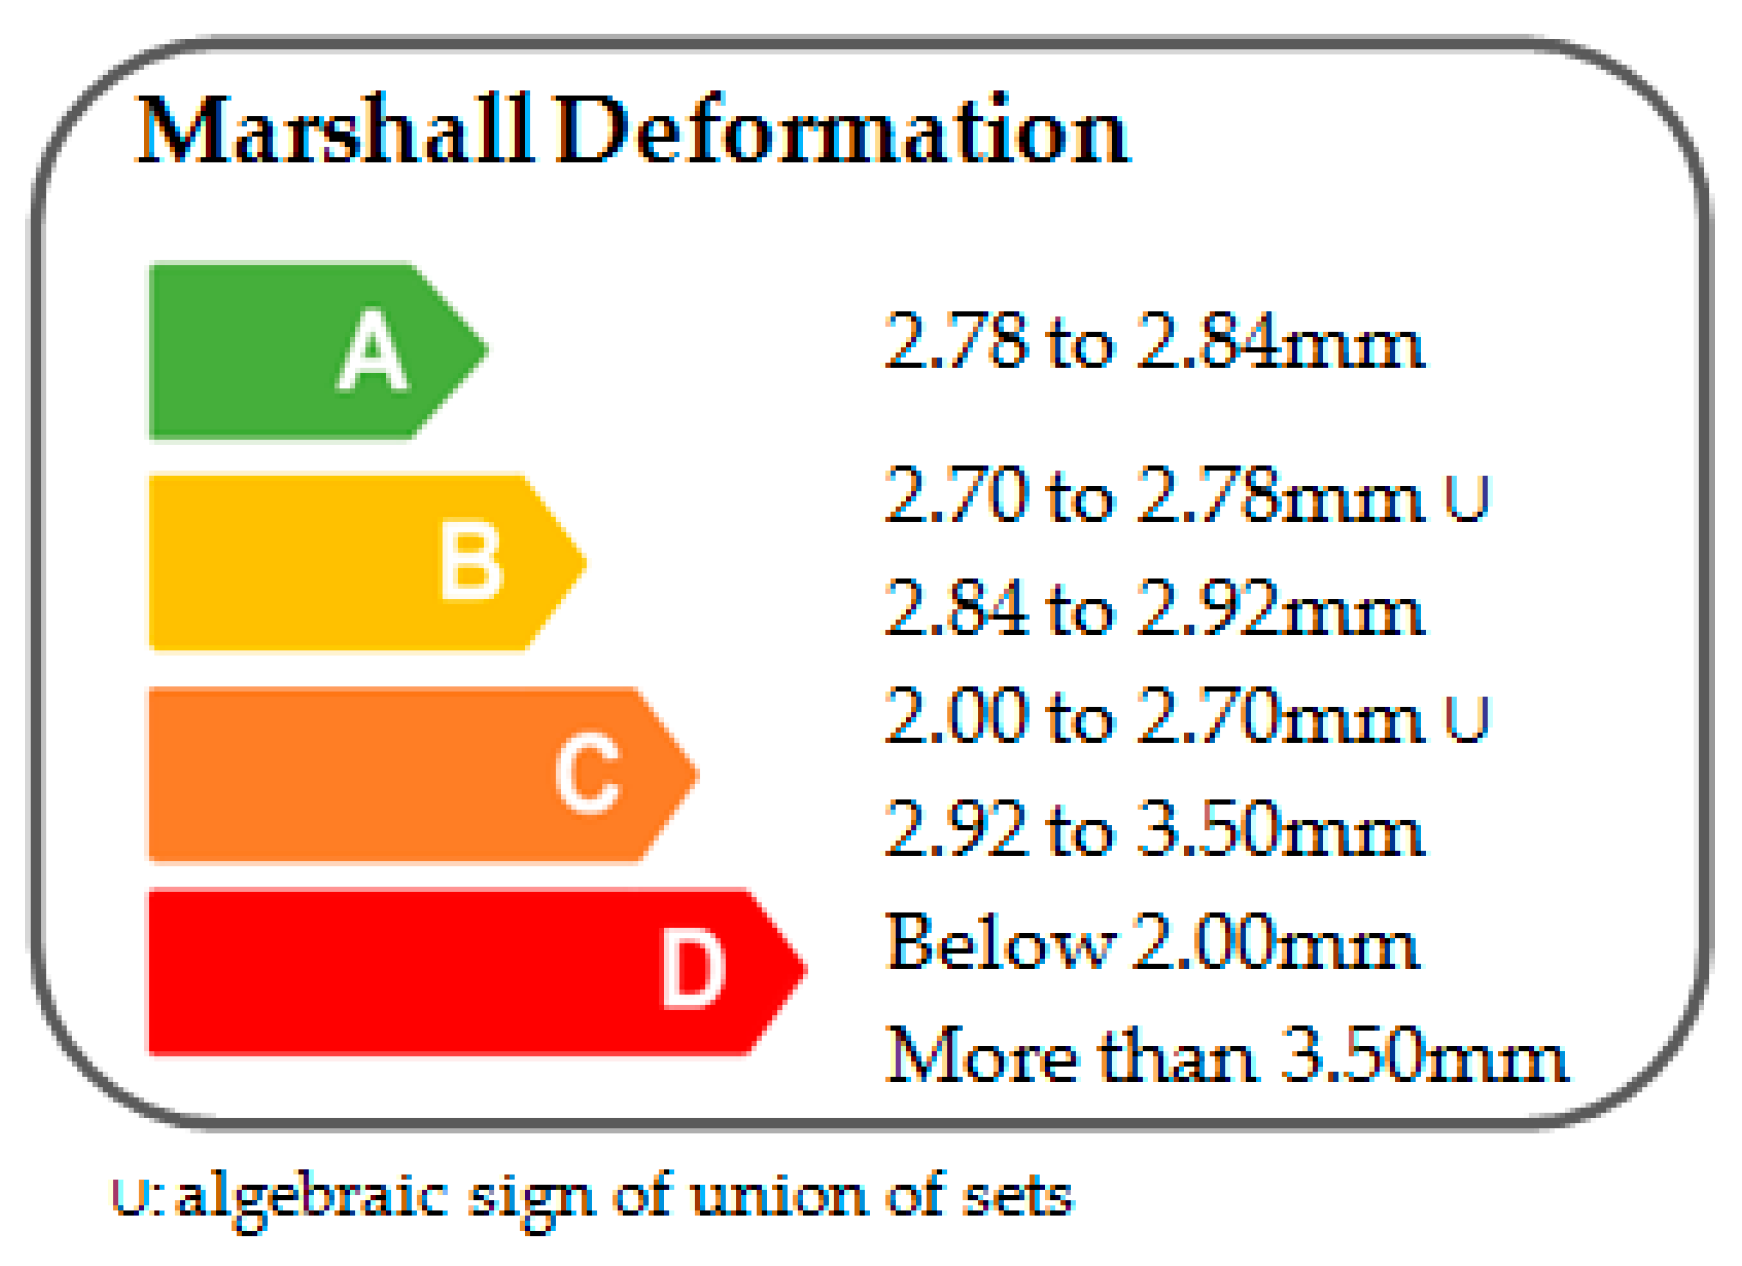
In the case of Marshall deformation, it only applied to AC mixtures, and the technical standard defines a value range (see Figure 13); thus, the limits were also defined symmetrically [33].
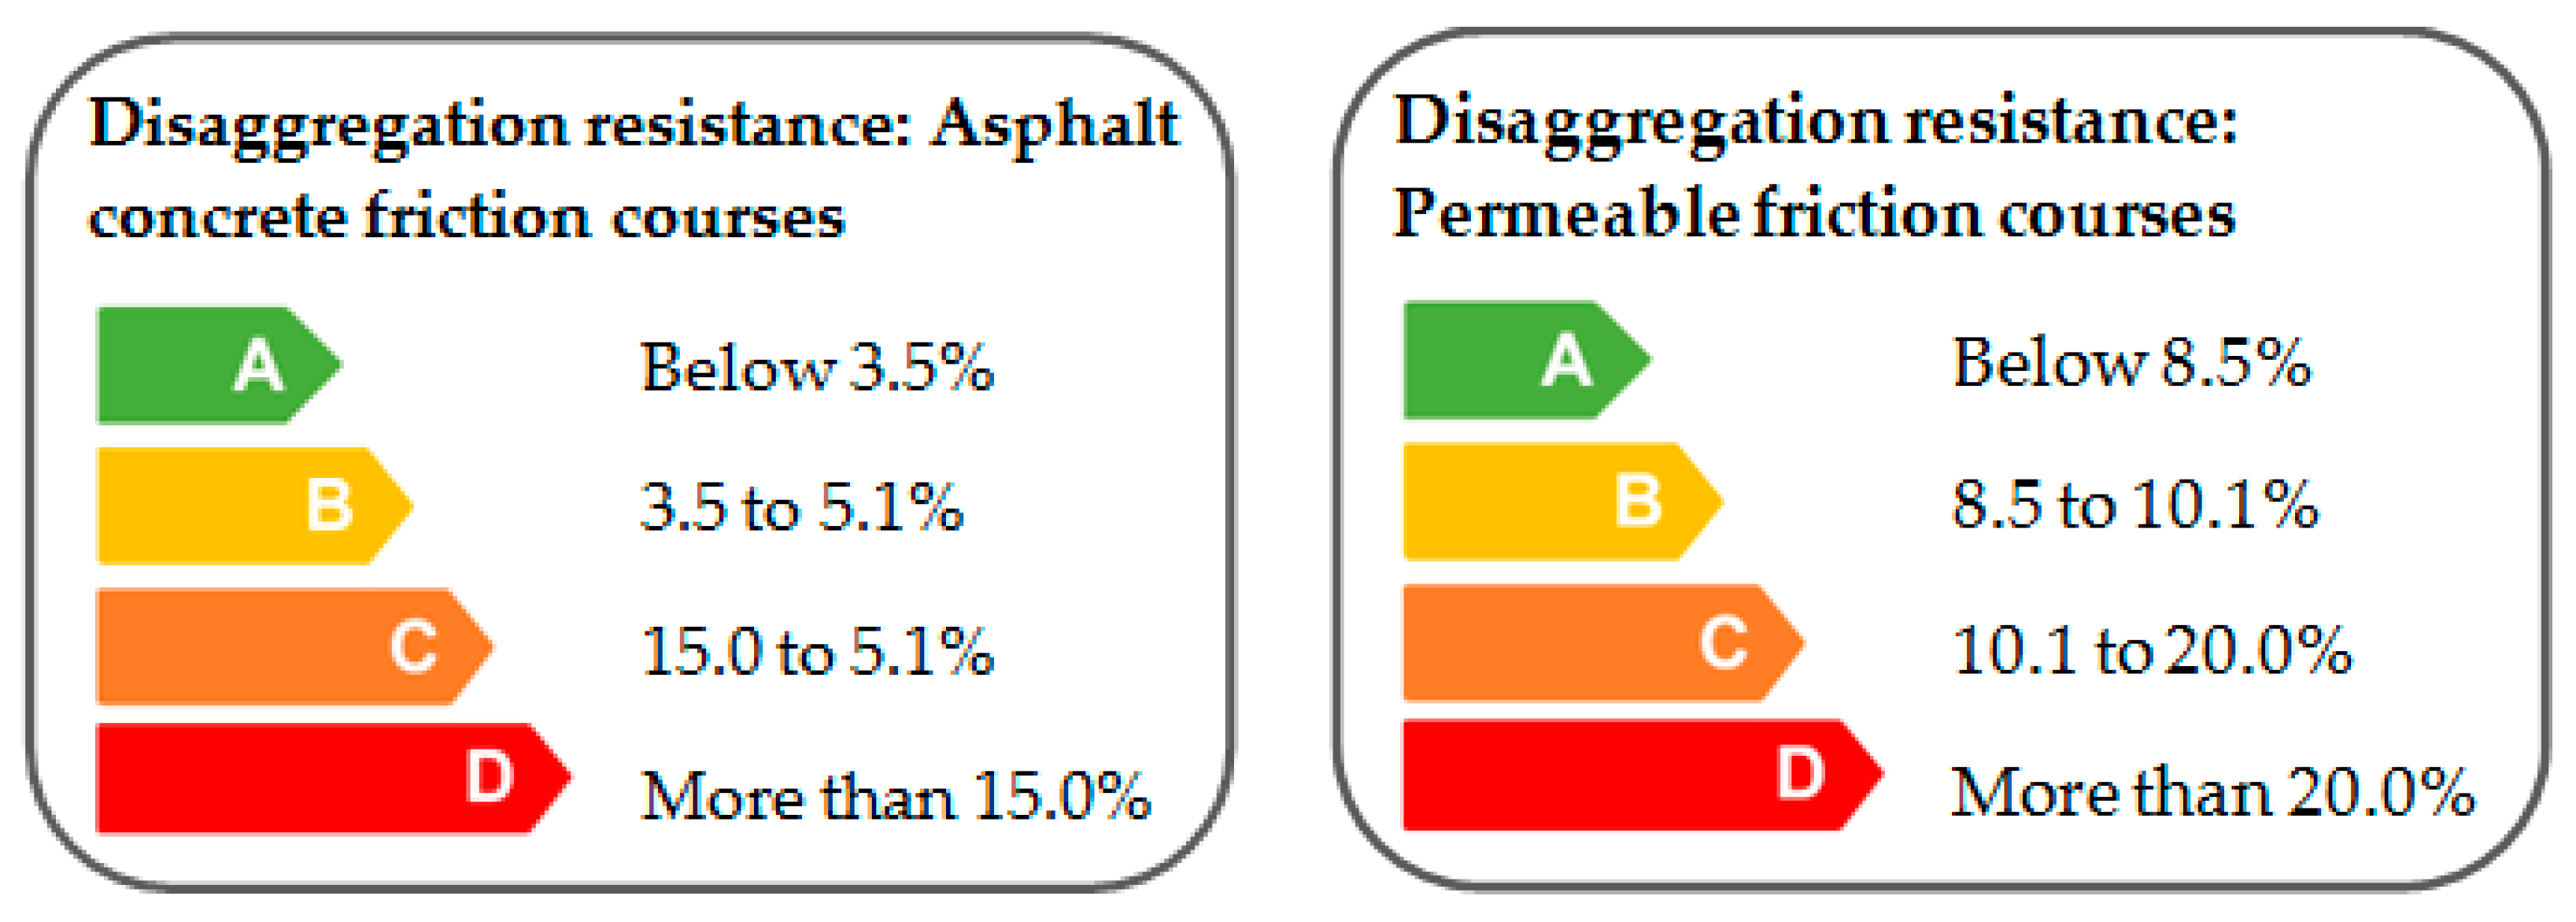
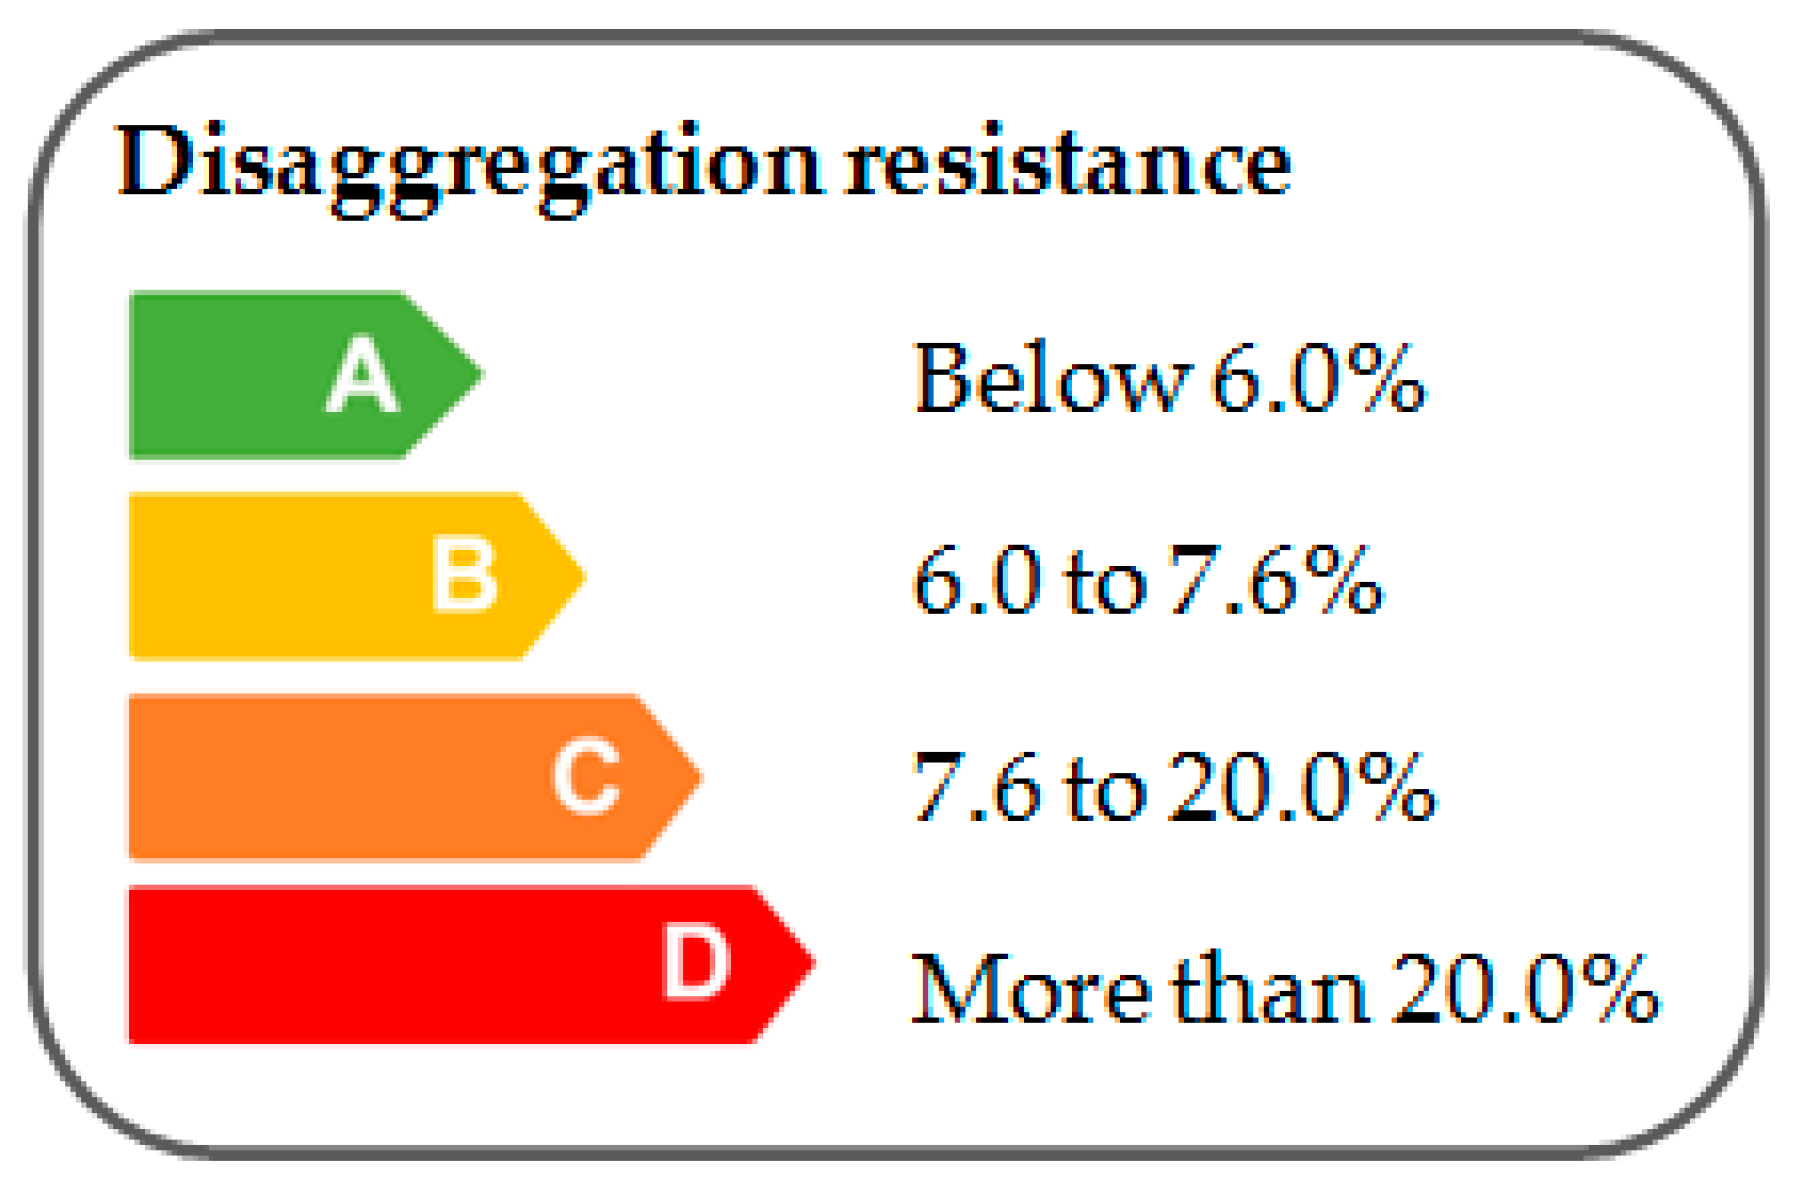
For open graded friction courses, dosage criteria were based on the resistance to disaggregation or the loss of particles of the mixtures, and the performance test was the dry Cantabro losses (%) test [20,33]. The obtained values for this indicator were well fitted by a log-normal distribution, and the technical standard established a maximum of particle loss depending on the mixture type (see Figure 14 and Figure 15).
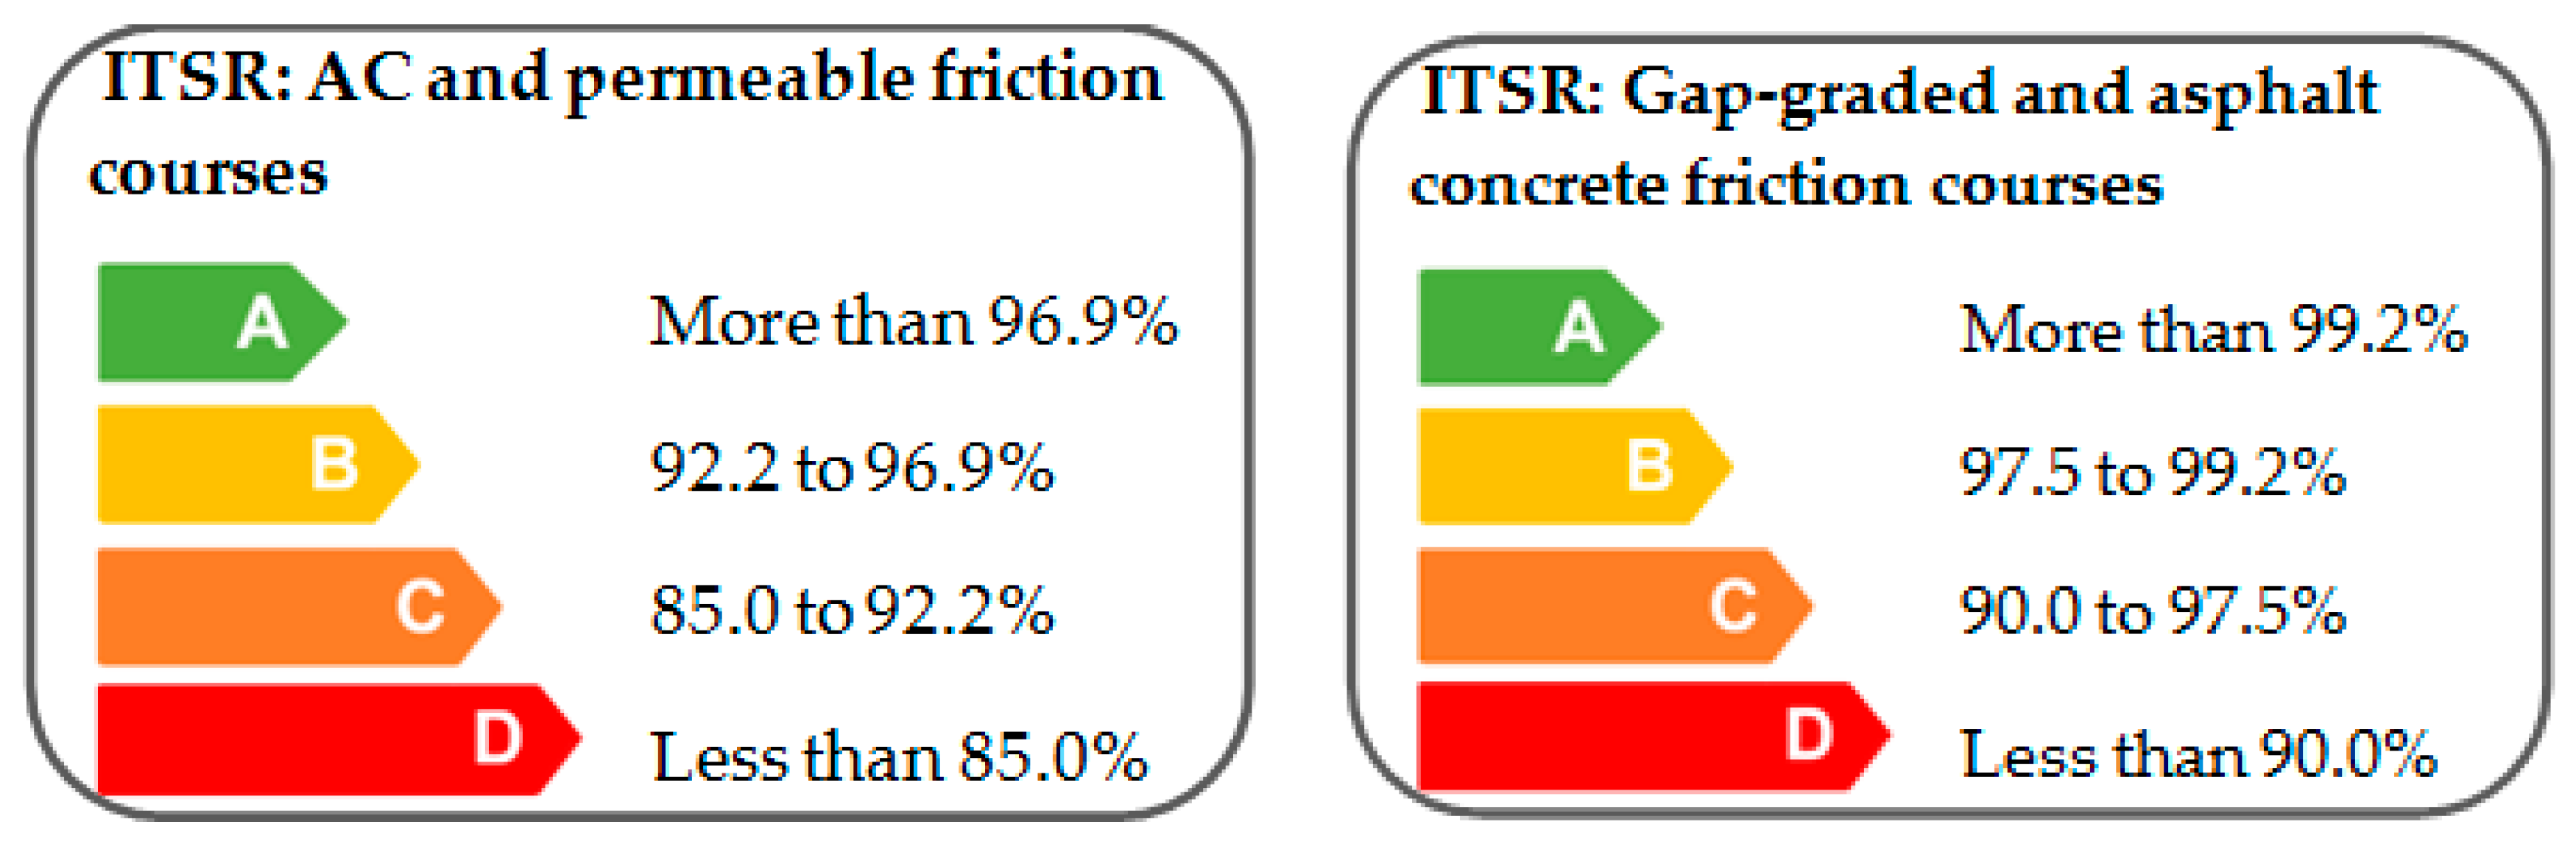
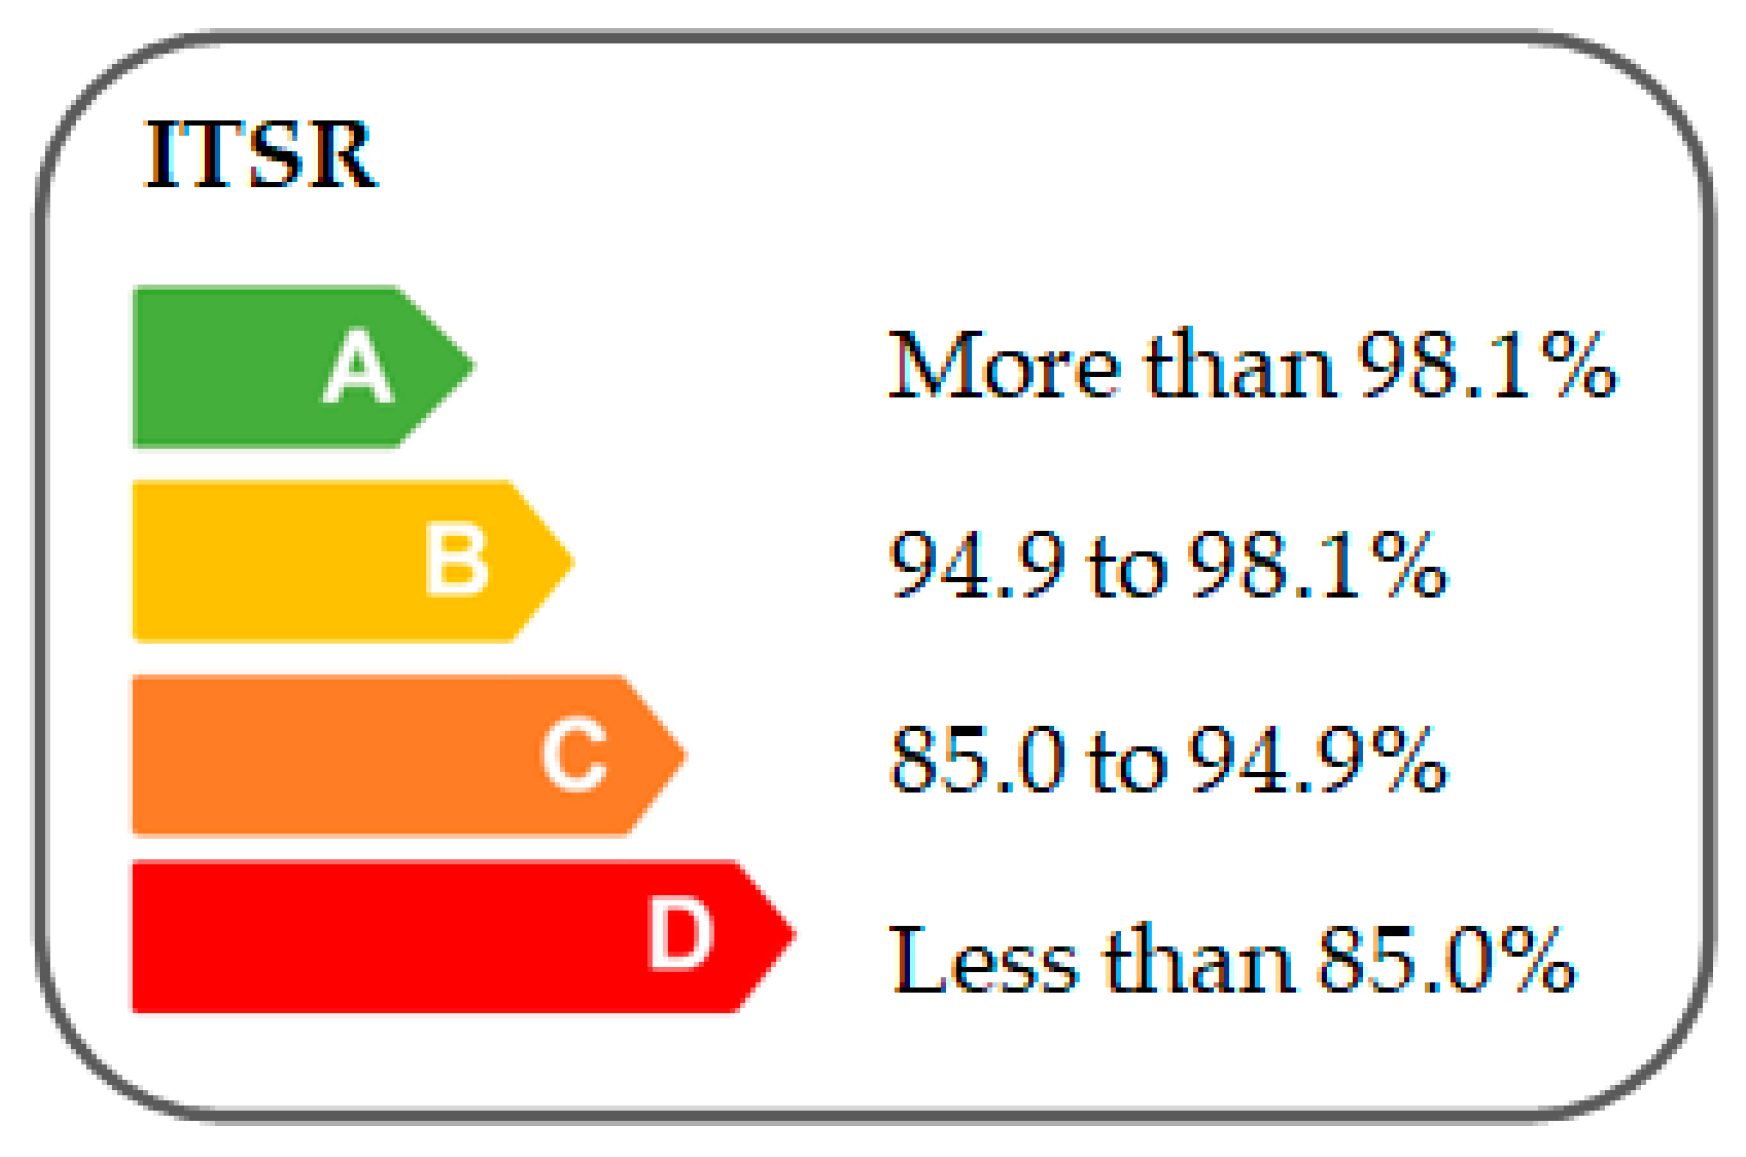
Concerning water sensibility, the current test to evaluate binder–aggregate tackiness is the indirect tensile strength ratio (ITSR) test. The Spanish technical standard defines different minimum values for conserved indirect tensile strength after water immersion depending on the mixture type [20]. Indeed, it distinguishes two groups: (1) AC mixtures and permeable friction courses, and (2) gap-graded and asphalt concrete friction courses. The first group followed a normal distribution pattern, while the second one could not be represented either by a normal or a log-normal distribution; thus, the limits of the labels were directly applied to the sorted values (see Figure 16 and Figure 17).
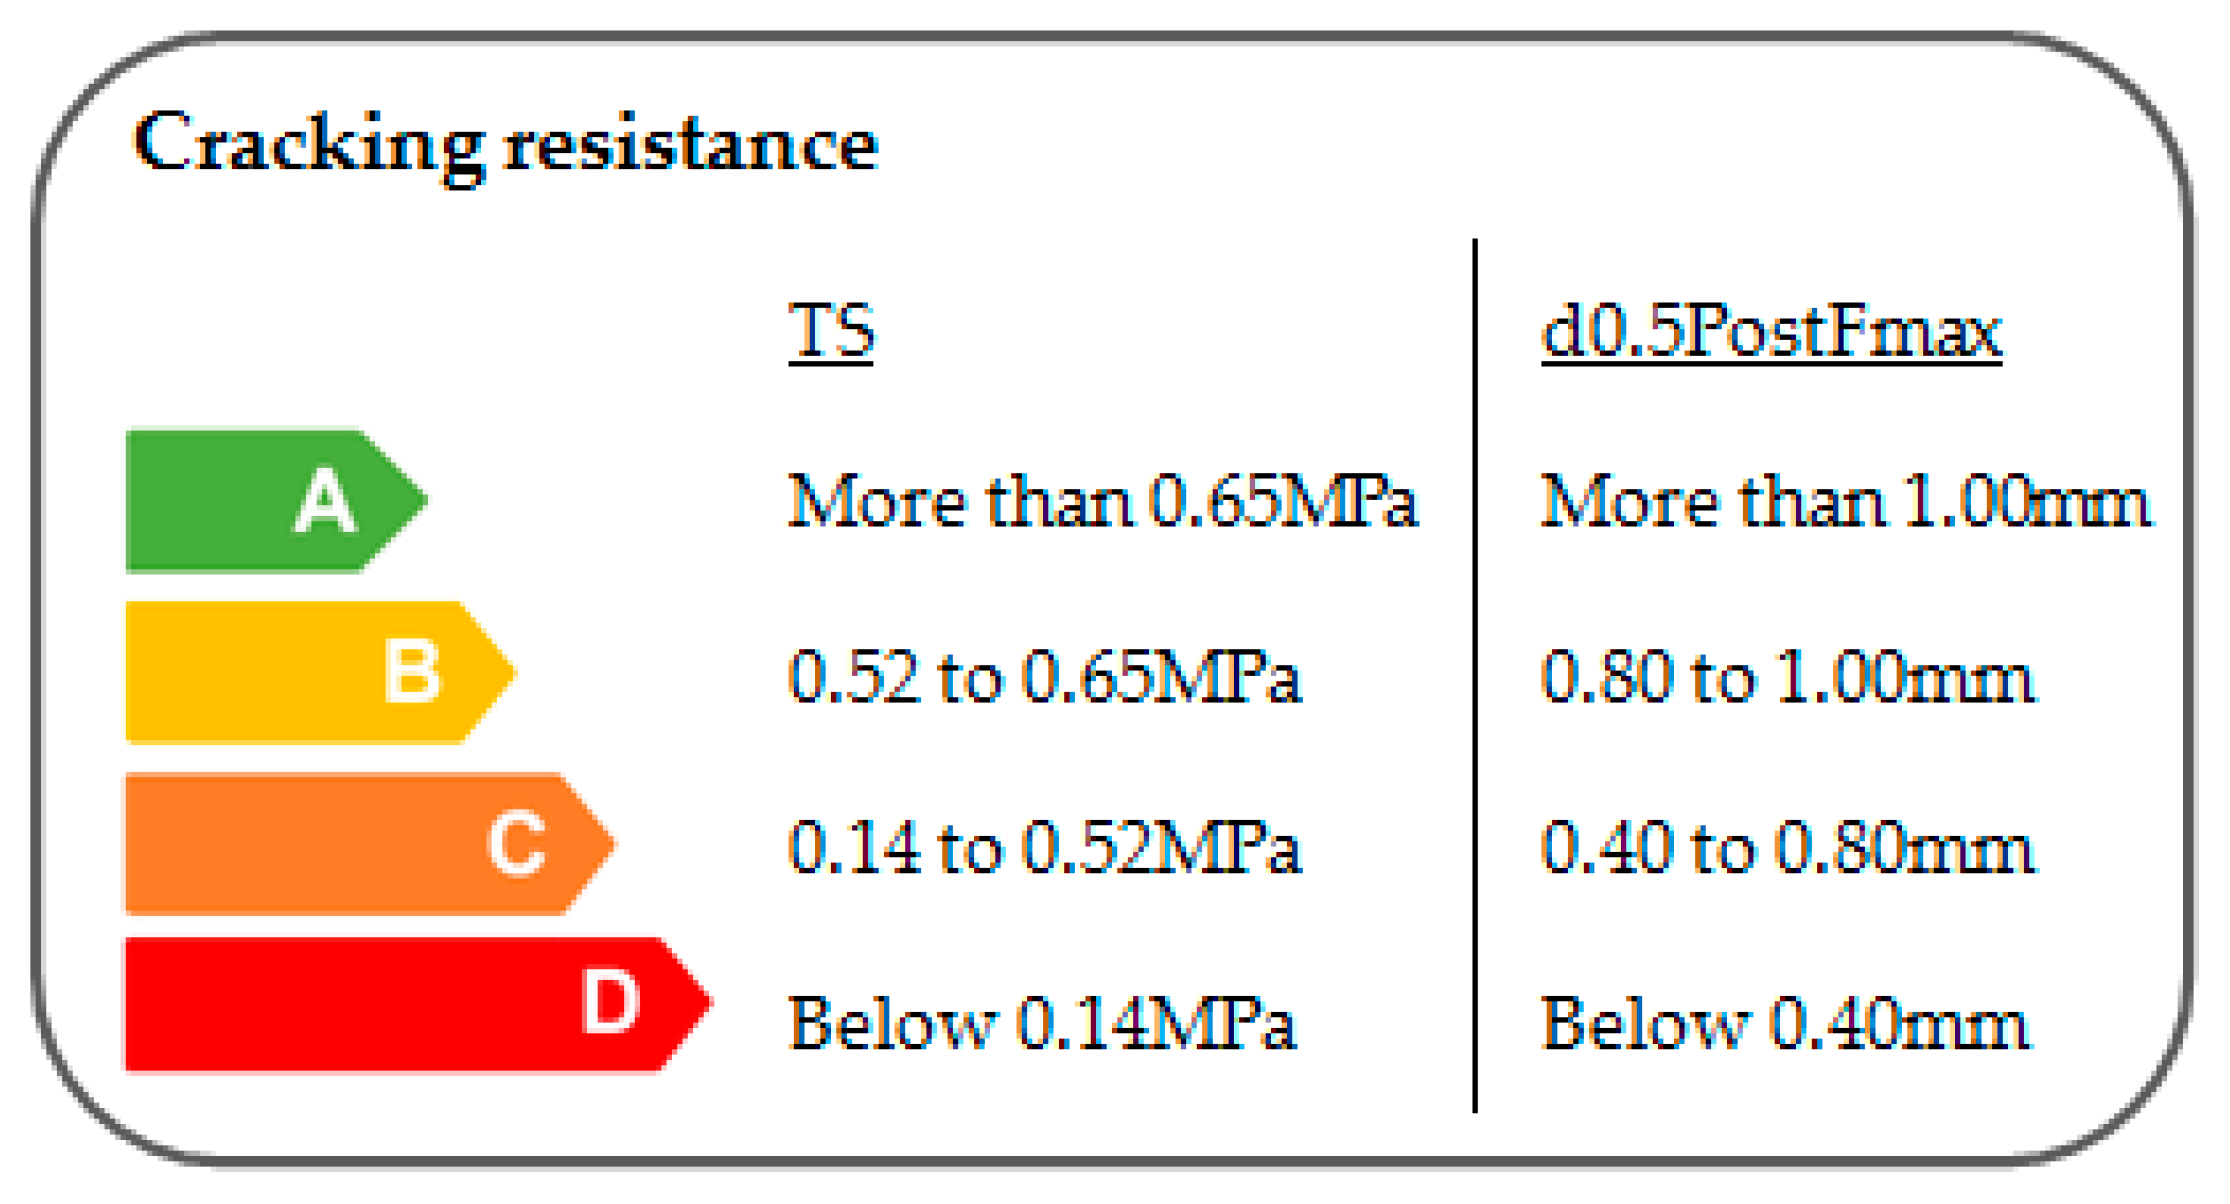
Finally, all results related to the cracking resistance of the mixture were obtained during the laboratory stage. In this case, two opposite indicators are used to explain this property. On one hand, the tensile strength (TS) represents the cohesion provided by the asphalt mastic and, on the other hand, the displacement at 50% post-peak load (d0.5PostFmax) is directly related to the ductility of the mixture. Both indicators must be satisfied at the same time. For this reason, the boundaries were not established through the cumulative distribution curve, but through a TS–d0.5PostFmax graphic; the admissible limits were mapped, resulting in different performance areas (see Figure 18) [34].
In the case that both indicators are not satisfied at the same time, the resulting label class will be the most restrictive one.
3.2. Functional Performance
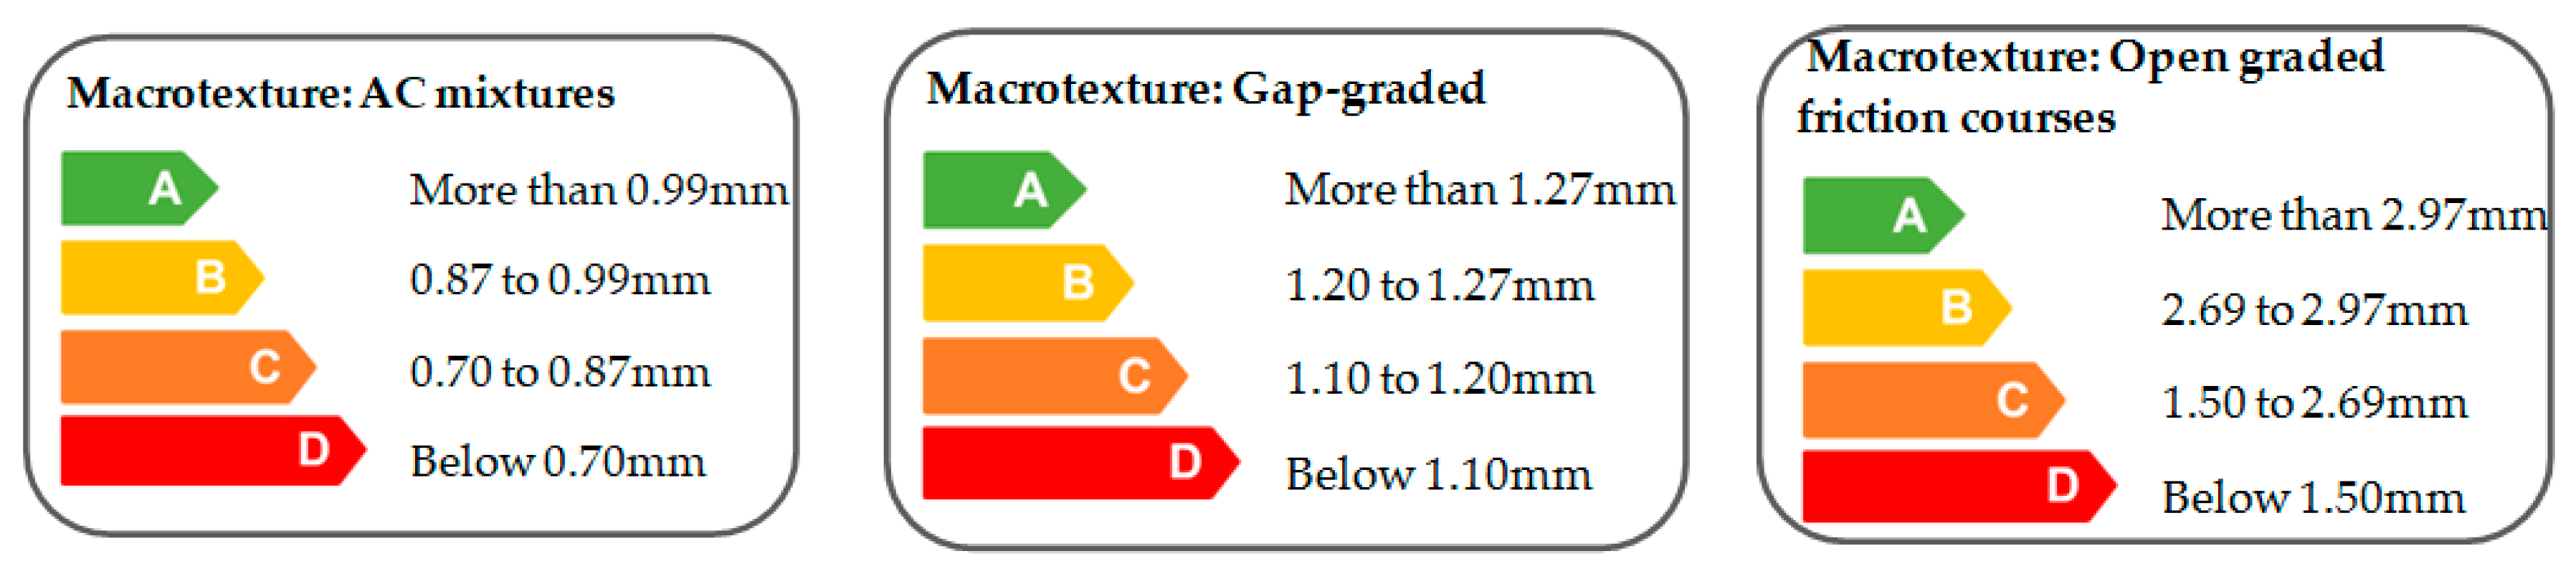
In terms of functional properties, the Spanish technical standard establishes different limits based on the type of mixture (see Table 2) [20].
AC mixtures and open graded friction courses presented a log-normal distribution, while gap-graded mixtures were well fitted by a normal distribution. Following the explained criteria and the minimum requirements established by the technical standard, the boundaries of the labels were clearly defined for each family of mixtures (see Figure 19).
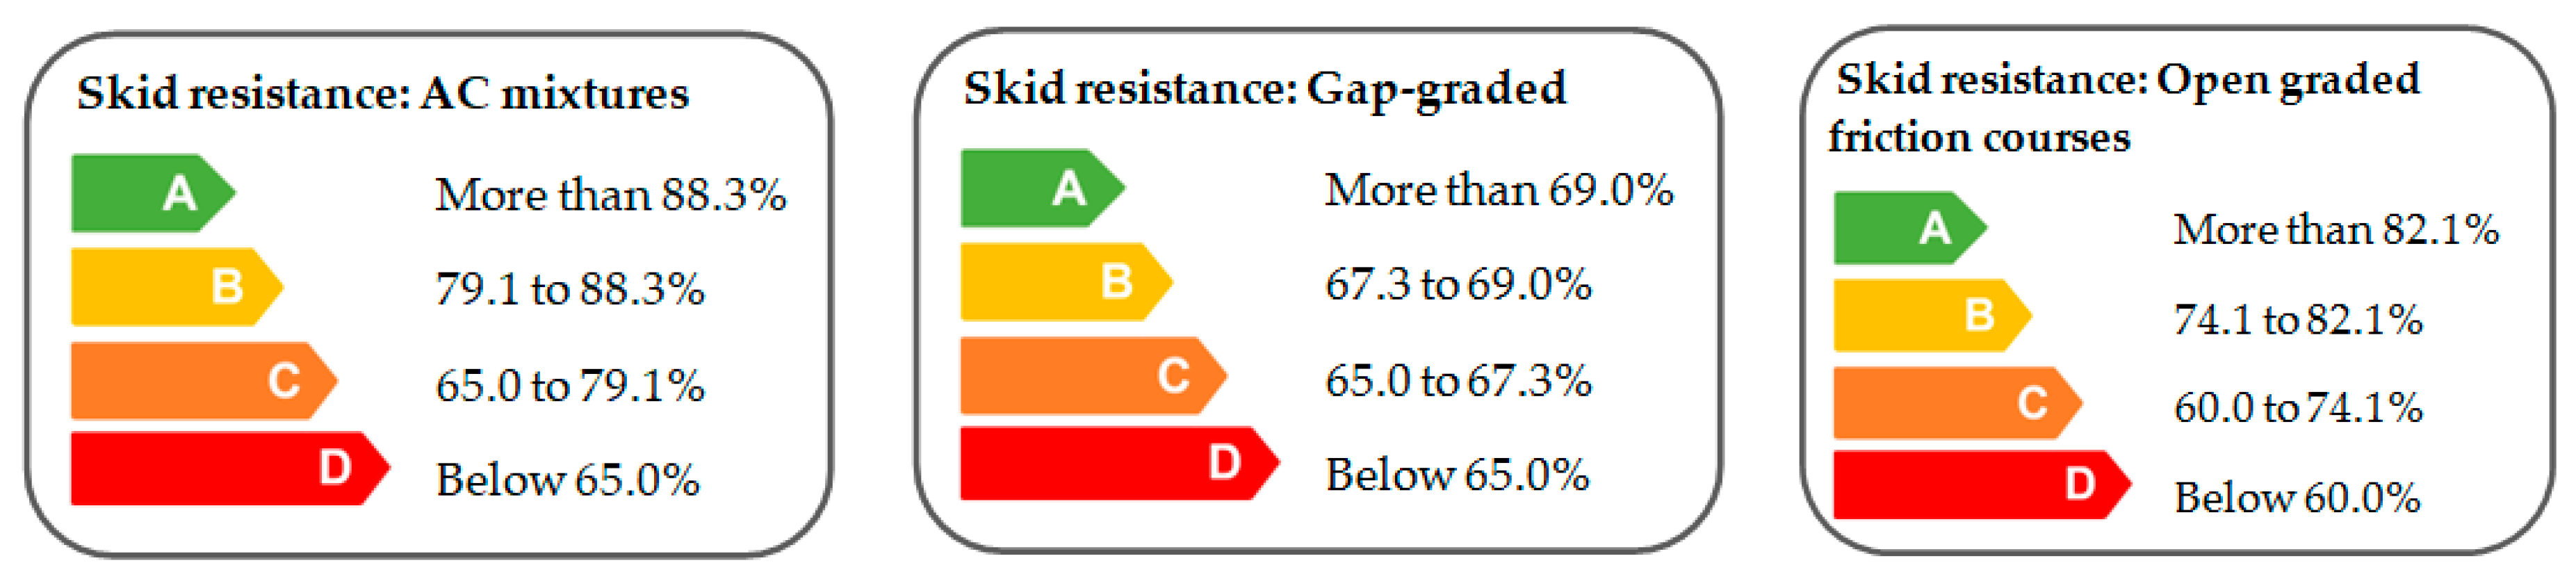
Sideway force coefficients were measured with the SCRIM device, one of the most commonly used methods in Europe. In this case, AC and open graded friction courses mixtures approached a log-normal distribution, while gap-graded mixtures followed a normal distribution pattern (see Figure 20).
The label scale for skid resistance was based on the skid resistance value obtained after 3–6 months of traffic, after the initial fluctuations and at the beginning of long-term skid resistance due to polishing.
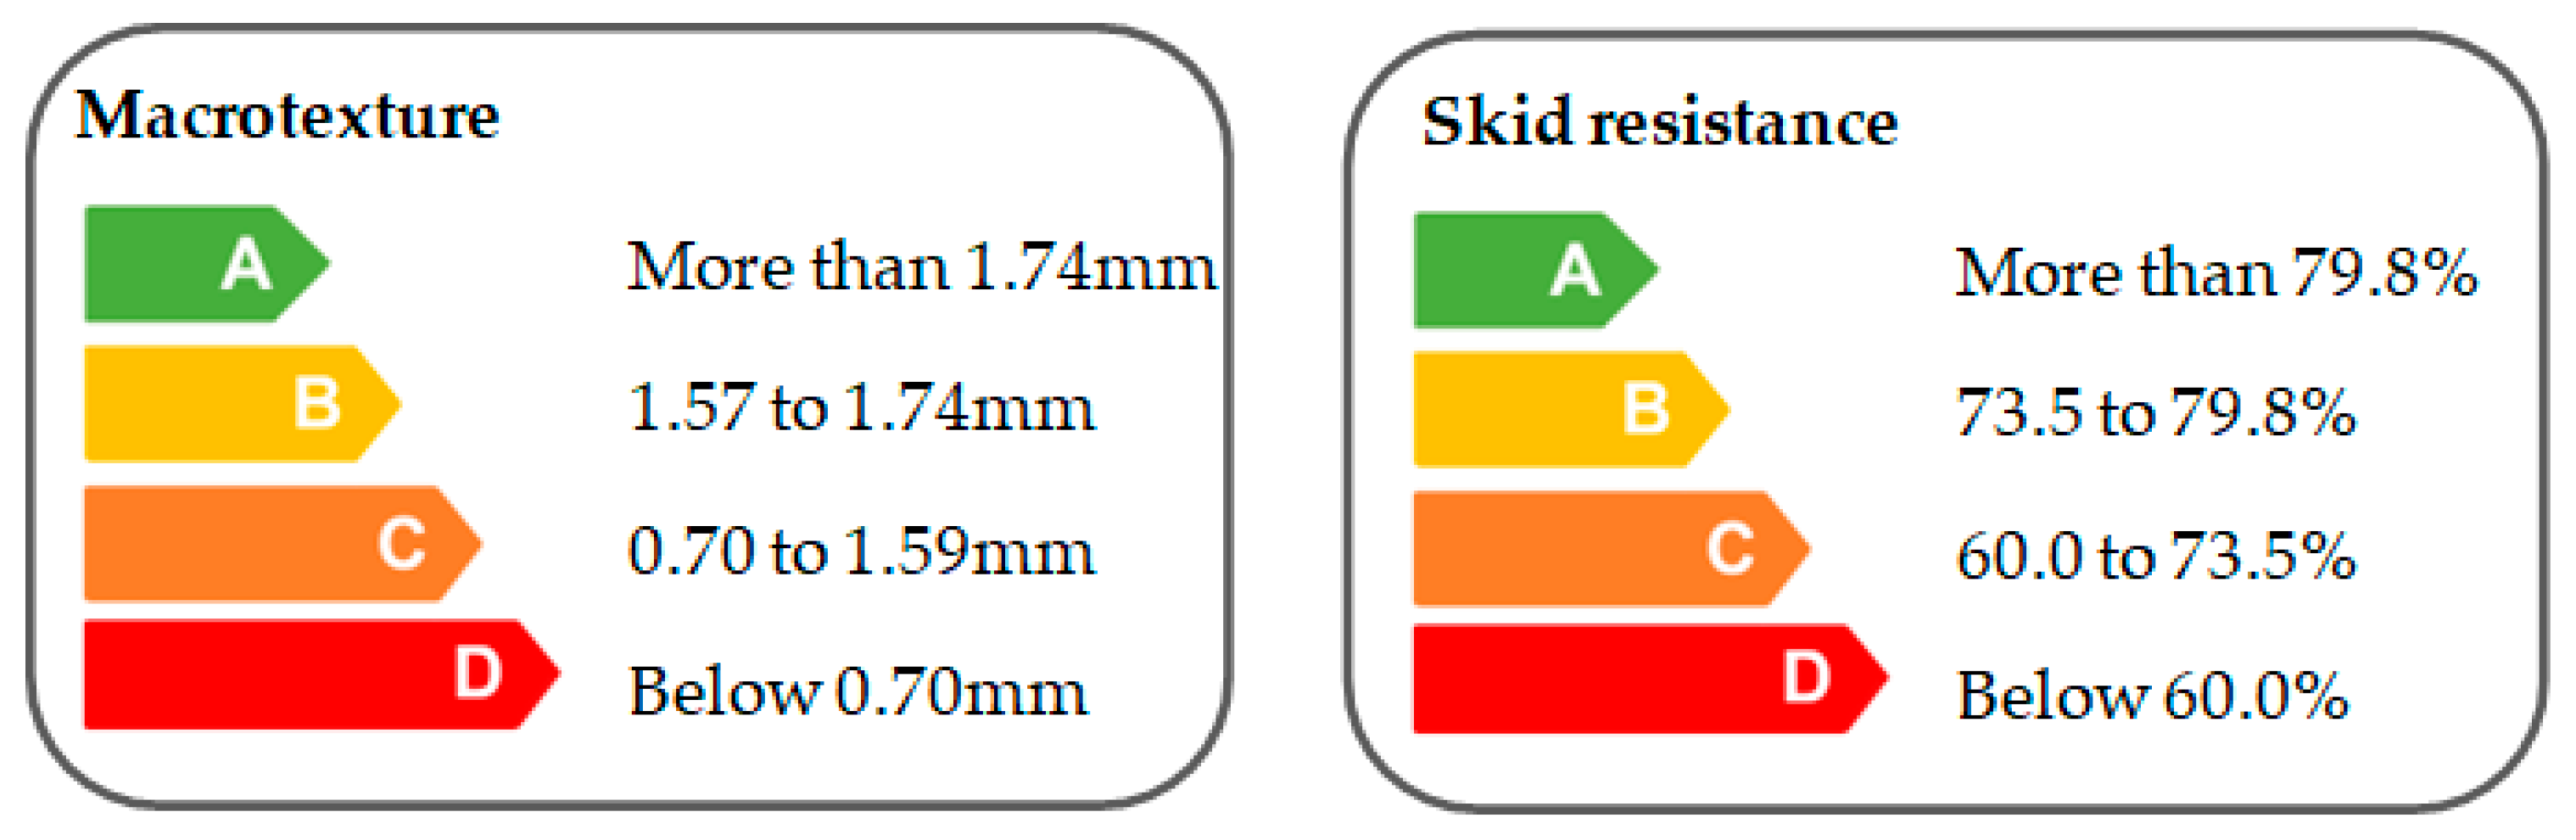
In case the type of the mixture is unknown, a global label that covers all the families was defined both for macrotexture and skid resistance (see Figure 21).
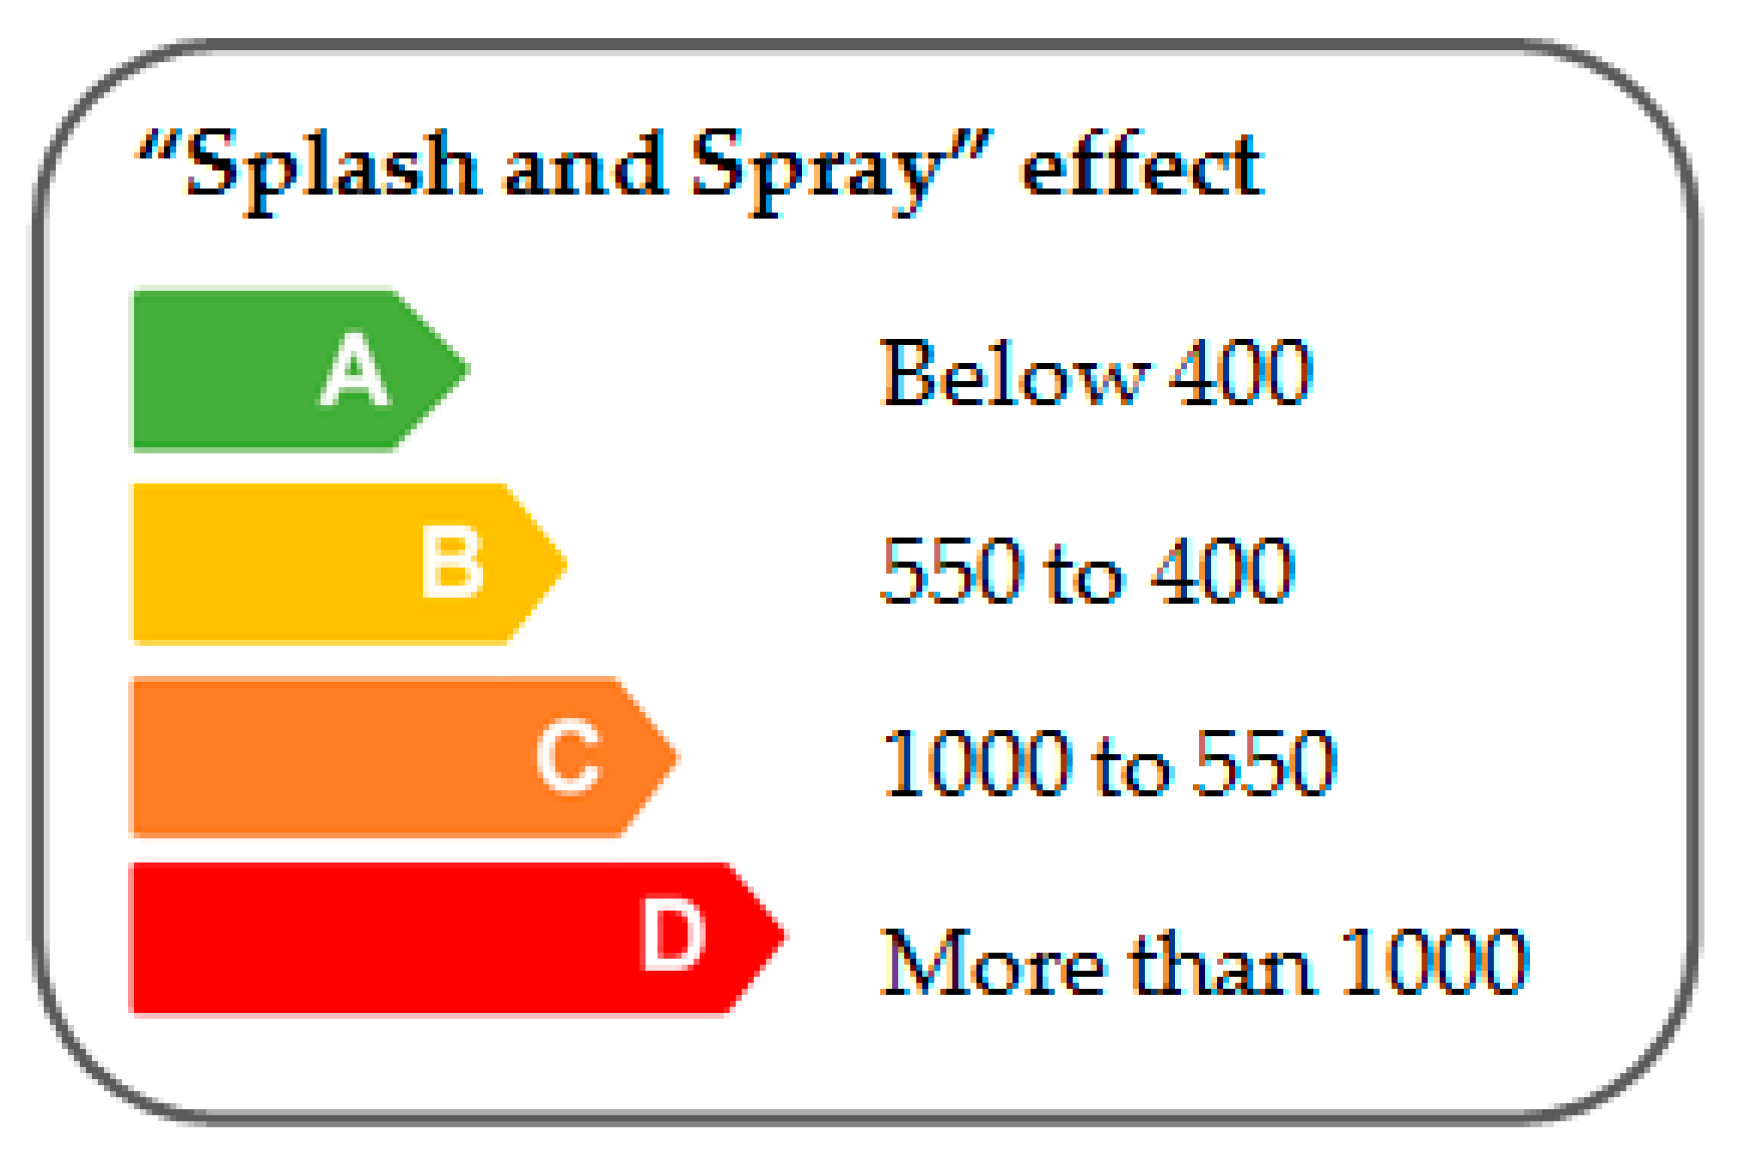
Concerning the “splash and spray” effect, all the values were obtained during the monitoring stage. The test trailer measured the number and distribution of drops that crossed a reference plane at a given time. Even though it is well known that this effect is directly related to the loss of visibility, it is not considered in the European technical standards. Hence, the upper limit was established based on the monitoring experience [24]. As the obtained results did not follow a normal or log-normal distribution, the boundary criterion was directly applied to the sorted values (see Figure 22).
3.3. Environmental Performance
The current Spanish technical standard envisages the use of some sustainable technologies, but it does not clearly establish practical recommendations or limits because, unfortunately, there is not an extended use of such technologies to date. Thus, in this case, in order to define the limits, research investigations and industry recommendations were used.
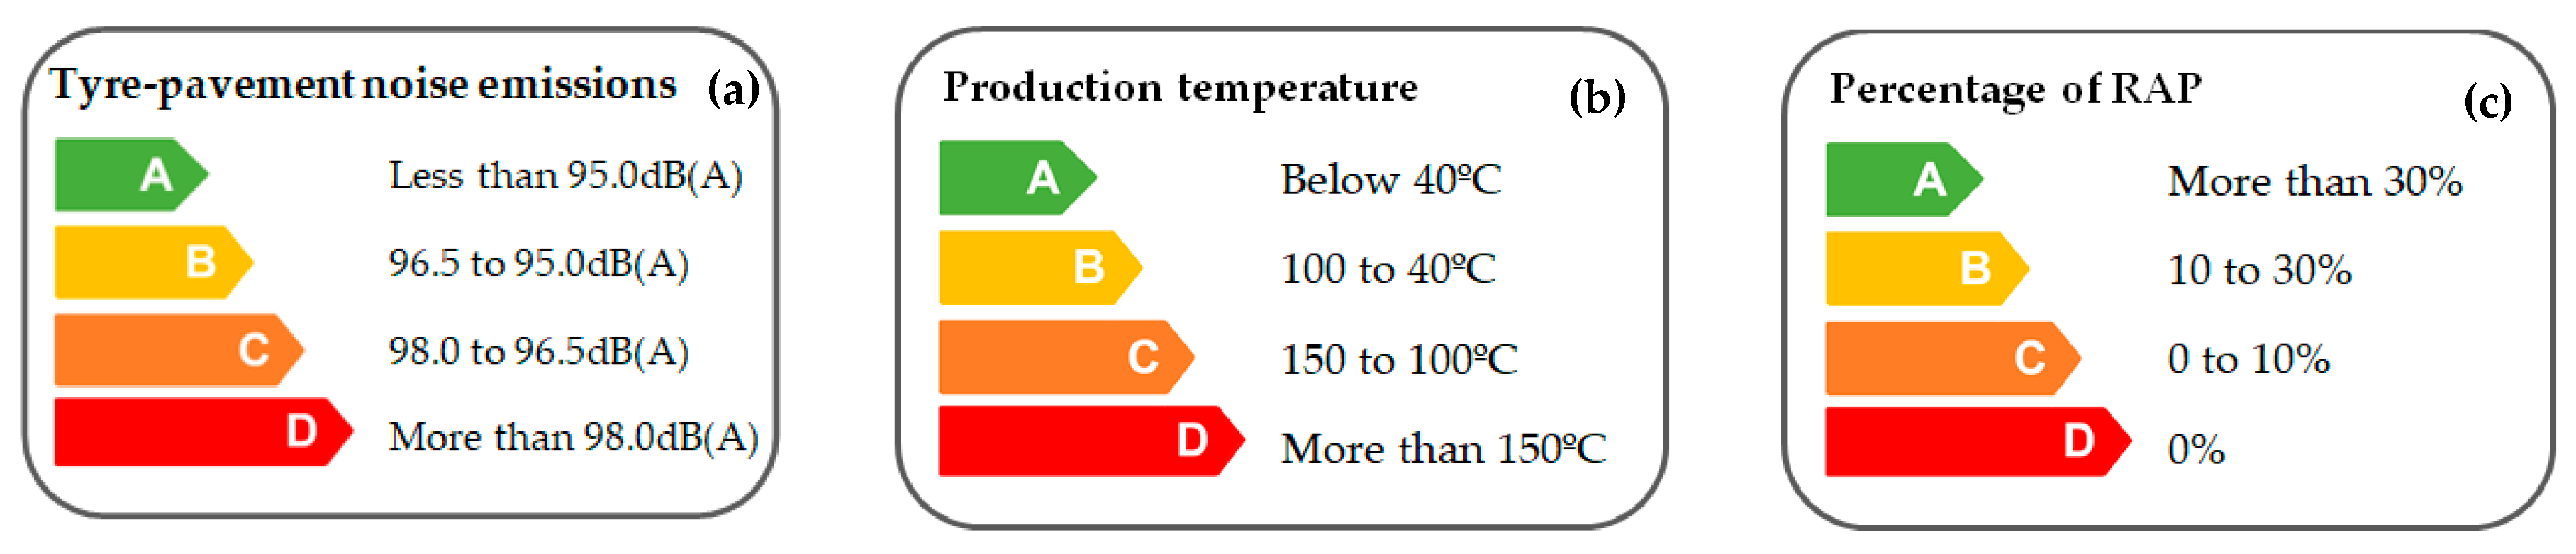
Tire–pavement noise measures determine the tire–pavement noise emission in dB (A) at a traffic speed of 80 km/h. In this case, the Acoustics Laboratory of the University of Castilla La Mancha already proposed a performance classification based on the reached noise reduction; therefore, the label boundaries were established according to their previous work (see Figure 23a) [25].
Asphalt–concrete mixtures may obtain the lowest label classification, while open graded friction courses should present a better performance in terms of noise reduction due to their higher air void content. It should be kept in mind that this label scale is based on initial values (a few months after construction), and, at the end of road surface lifespan, the noise reduction may be lower.
In the case of the production temperature of the mixtures, the limits were established according to the technological developments achieved by the industry. In terms of energy consumption per ton of asphalt, four different technologies are distinguished: hot mix asphalt, warm mix asphalt, half warm asphalt, and cold asphalt, and the temperature limits between them are already well defined by the industry (see Figure 23b).
Finally, the Spanish technical standard recently included the use of recycled asphalt pavement (RAP) to replace virgin aggregates at intermediate and base layers, but it does not consider their use for wearing courses even though they were successfully tested on various pilot sections [20]. Thus, according to the technical standard recommendations and the results of some investigations, the boundaries were set (see Figure 23c) [35].
3.4. Global Performance Labels
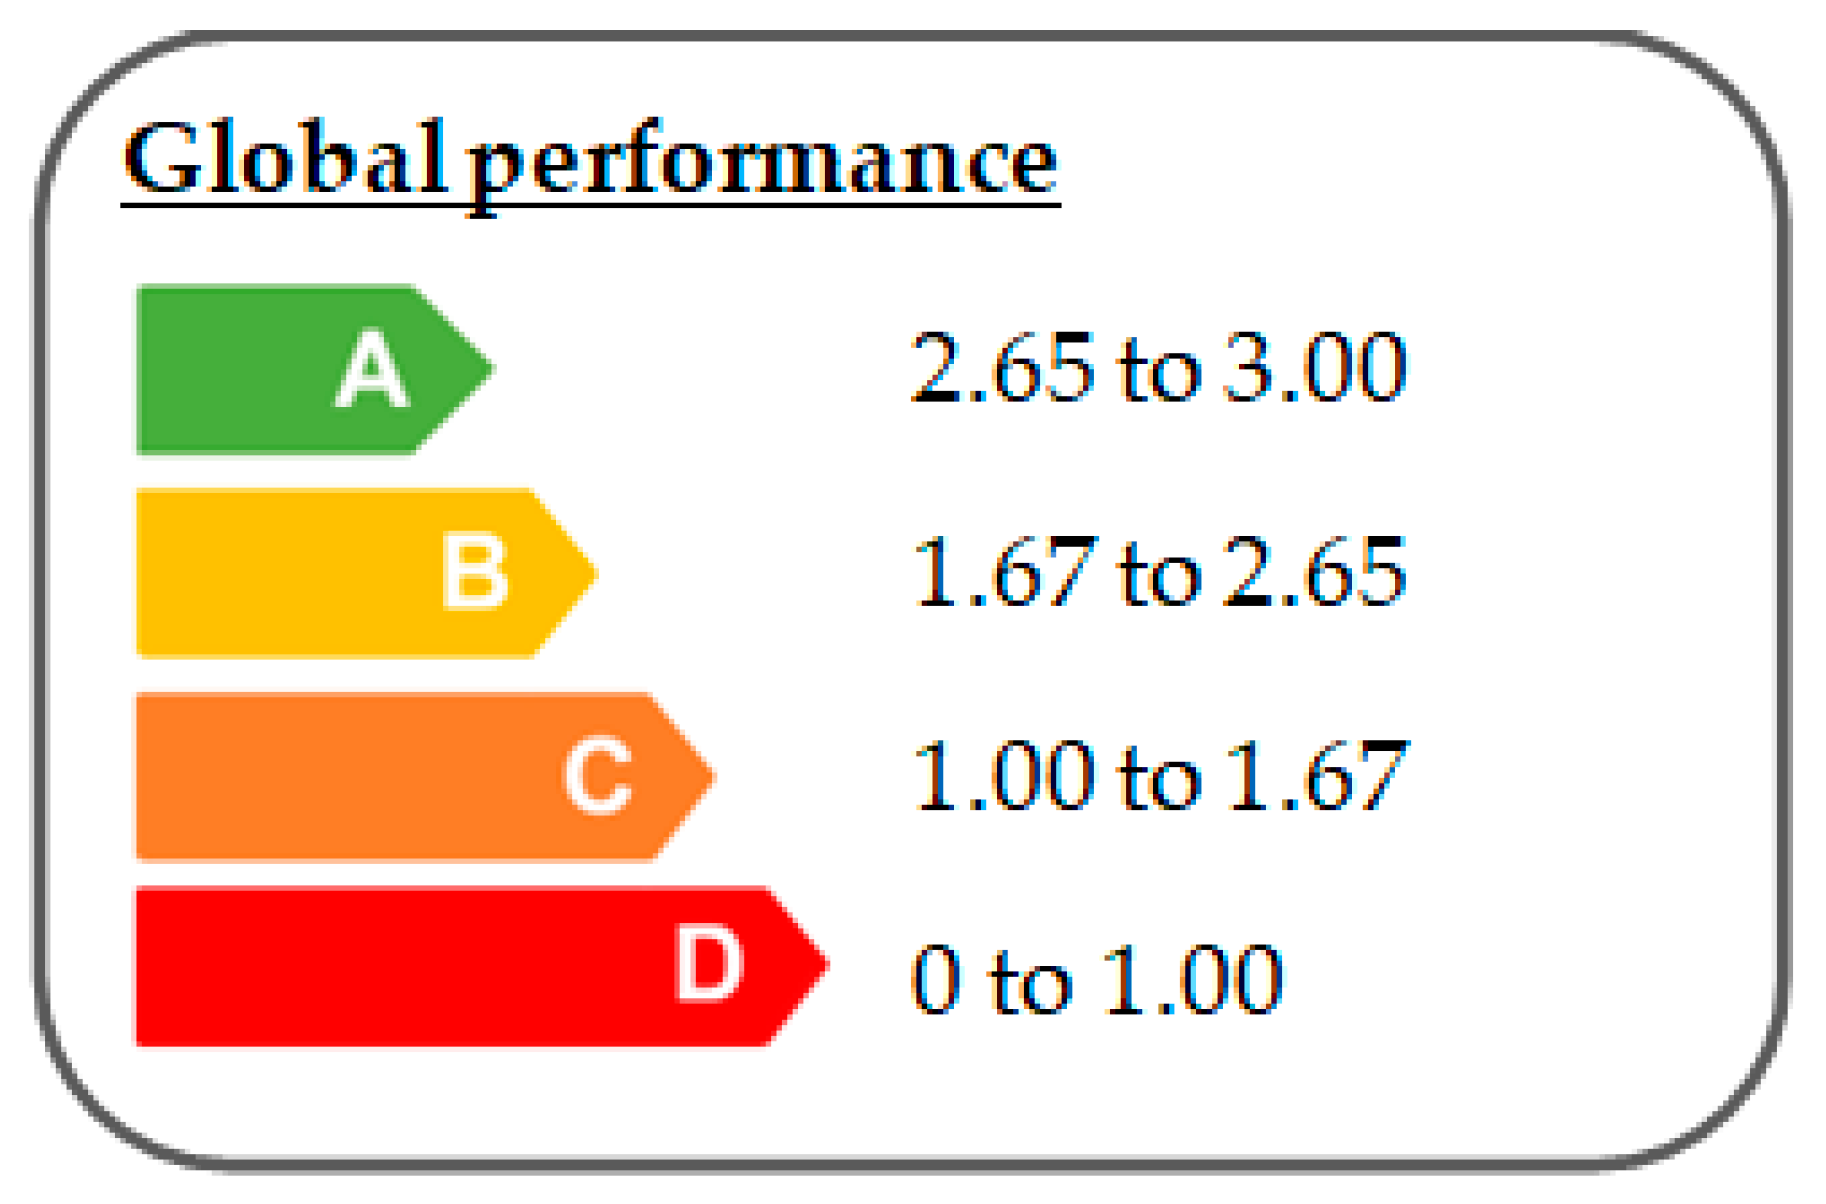
In order to define the boundaries for each global performance label, combinatory techniques (i.e., combinations with repetitions) were applied to determine all possible situations and establish the limits for each label class (see Figure 24). These limits are the same for each category.
The geometric mean will penalize the global value if one of the properties does not meet the technical requirements, because it will be rated as zero, and it will only take into account the number of available properties.
As already mentioned in Section 2.2, the environmental performance category includes some non-quantifiable properties. In this case, if the result is positive, a class label will be directly added to the obtained environmental label from the geometric mean.
Again, it should be noted that the attainment of a D grade in terms of mechanical and functional performance means that the mixture does not comply with the technical standard; thus, its use must be refused. However, in the case of environmental performance, this label has merely informative character and it only pretends to encourage the use of more sustainable technologies.
3.5. Example Case
For a greater understanding of the labeling methodology, two examples of quality control results of different wearing courses from different local roads are shown below (see Table 3 and Table 4).
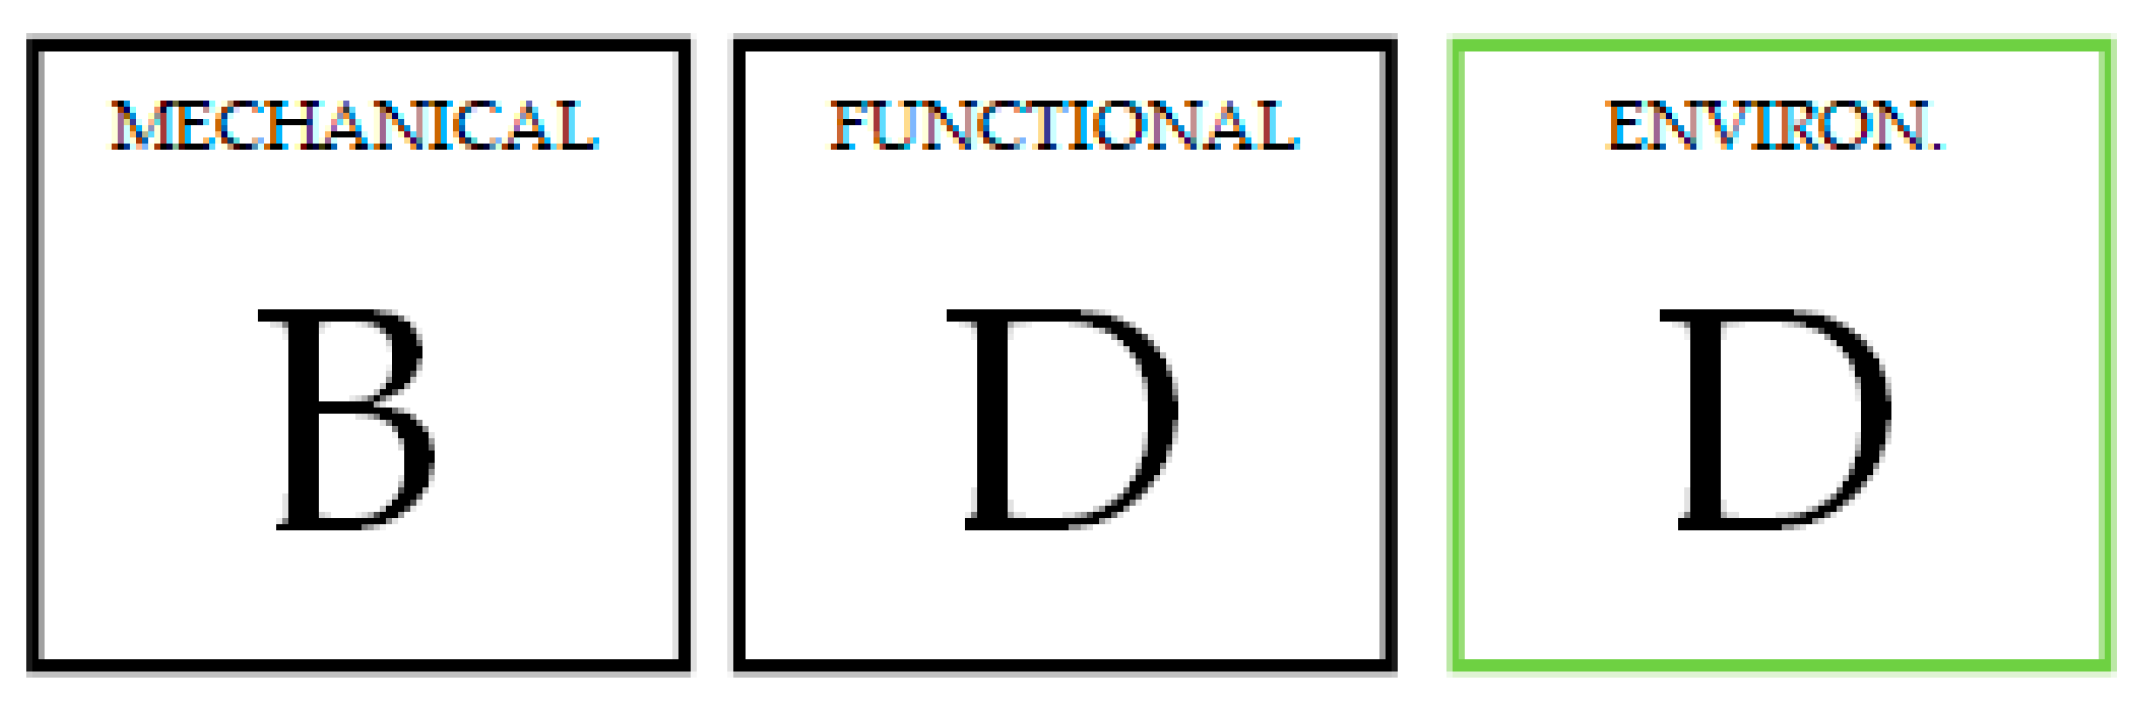
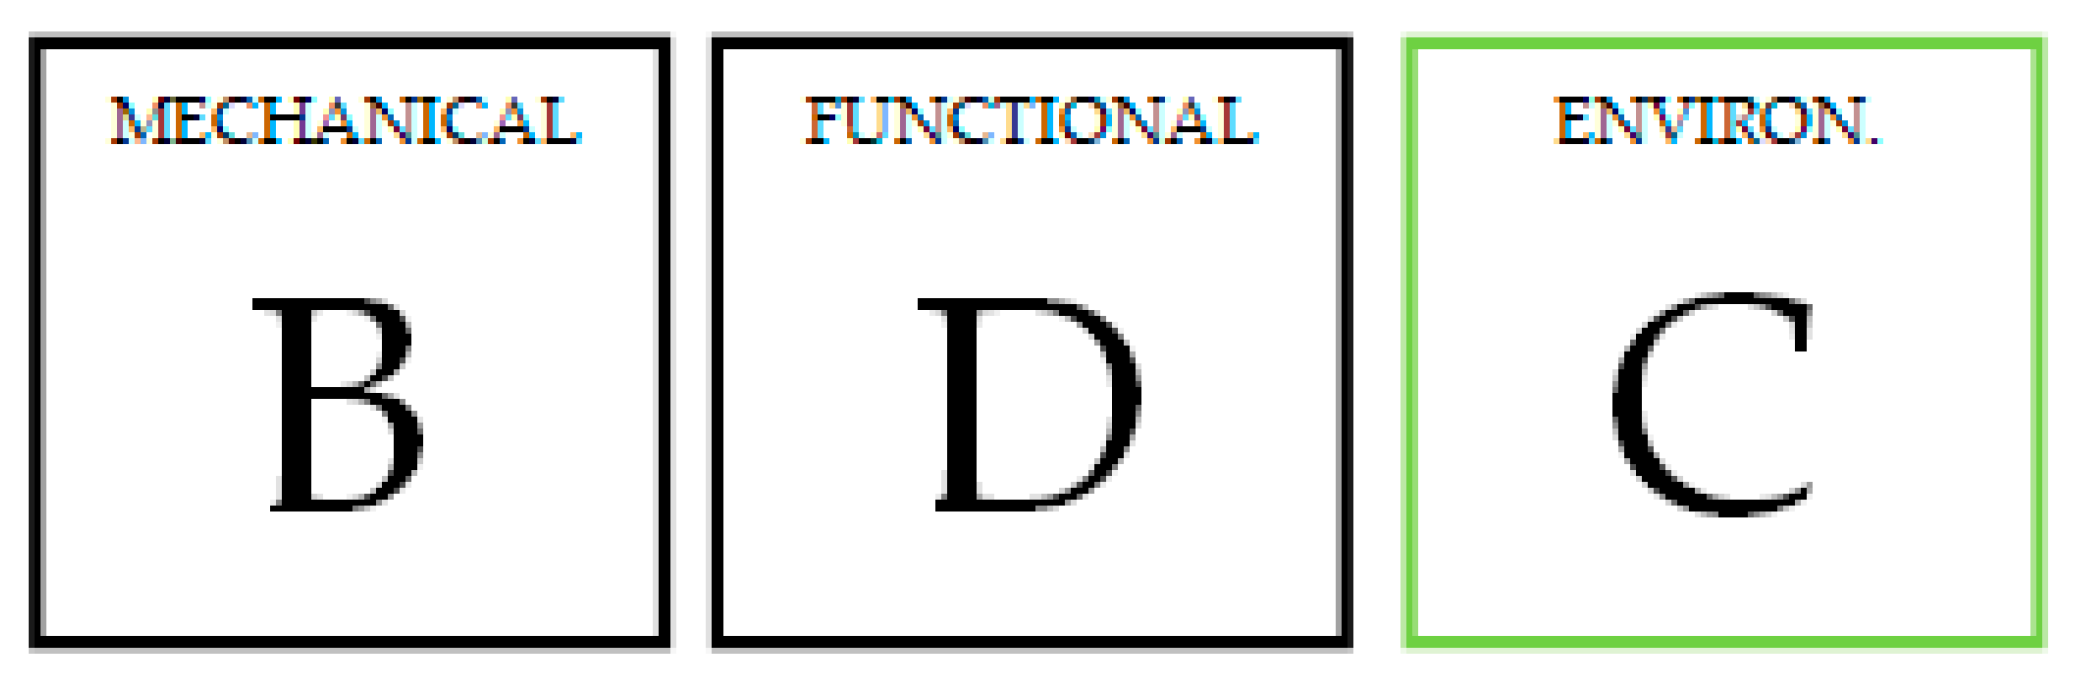
Based on the obtained geometric mean for each category and the defined limits for global labels (see Figure 24), both mixtures were labeled (see Figure 25 and Figure 26).
According to the obtained labels, none of the mixtures should be accepted, because neither of them comply with the functional minimum requirements (label D). In terms of environmental performance, mixture 1 included the use of a by-product (i.e., crumb rubber) and this solution added a class label to the obtained label from the geometric mean (i.e., from a D label to a C label).
4. Conclusions, Limitations and Future Work
Traditional design procedures of asphalt mixtures are based on volumetric parameters and the compliance with the mechanical performance, while functional properties receive less attention. Additionally, even though the potential of sustainable technologies is proven, this is not sufficiently reflected in the technical specifications and their use is not widely spread. In order to overcome these barriers, the development of a useful tool that allows IMs an easy evaluation of the mechanical, functional, and environmental attributes of the designed mixtures, as well as seek the balance between properties, will encourage the optimization of road surfaces.
In addition, in the last few years, public administrations are willing to reward those road works whose quality is beyond the thresholds required by the specifications, and recognize this added value in the road construction tendering process. In this sense, a labeling system would smooth the introduction of award criteria into the contracting process.
This article is a first attempt to multi-labeling scheme for asphalt mixtures for thin wearing courses according to their mechanical, functional, and environmental performance. The developed labeling system allows the comparison and benchmarking of different designed asphalt mixtures, providing the chance to choose the most safe and environmentally demanding option for each specific situation; therefore, it should function as a potential driver for behavioral change.
The aim of this research was to propose a methodology to develop a multi-labeling scheme for asphalt mixtures and to show the potential of this tool to stimulate better road surface practices. The approached methodology is flexible enough to be adjusted to the sample size or to be tailored to suit countries’ specific requirements.
In this case, the study focused on the Spanish case because different Spanish IMs were involved and all the collected data belonged to the Spanish road network; however, the described methodology can be easily applied to any other study case.
This guideline proposes four label classes (A–D) based on the sample size, but the range of characterization can be scaled up as data arise. The limits of the non-acceptable performance were defined according to the requirements established by the road administration and the boundaries of the acceptable labels were established according to the defined percentiles of the statistical distribution. It must be noted that the obtained values of the boundaries only apply for this study case because they are based on the obtained database and the Spanish technical requirements. The values of the class limits must be adjusted to each particular case because construction techniques, used materials, traffic, weather conditions, age of the pavement, preservation techniques, etc. differ from one country to another; however, the methodology and criteria for setting the class limits were designed to be applicable to any situation.
The use of the geometric mean to obtain the global label for each category allows a performance penalty when one of the properties does not meet the technical requirements. Indeed, it must be underlined that the attainment of a D grade in terms of mechanical and functional performance means that the mixtures do not comply with the technical requirements; however, in terms of environmental performance, this label has a merely informative character and it only pretends to encourage the use of more sustainable technologies.
The findings in this research clearly demonstrate that the developed labeling scheme shows promise; it allows not only the assignation of performance labels to any asphalt mixture based on its properties, but also the comparison of features between different asphalt mixtures for thin wearing courses.
However, this research has its limitations, despite the efforts collected, data remained limited and there were challenges associated with setting the number of label classes and their boundaries. For this reason, the design of any label should involve the participation of multiple stakeholders in order to design a system that meets IMs’ needs, raises compliance and acceptance, and overcomes the limitations found in this first attempt.
In any case, the development of this labeling scheme is an appropriate tool to encourage the road construction industry to develop, build, and manage safe, durable, sustainable, and economic pavements; it is also flexible enough to be tailored to suit countries’ specific requirements to ensure its use.
In order to increase the potential of this tool, an attempt to develop performance curves of the different properties based on the collected data will be made in future works. Therefore, regression relationships that fit the design parameters of the mixture to performance variables (i.e., cracking resistance, disaggregation resistance, skid resistance, etc.) will be established for further performance label assignment.
Author Contributions
Data curation, L.G.-G.; formal analysis, L.G.-G.; investigation, L.G.-G.; methodology, R.M.; project administration, R.M.; supervision, R.M.; validation, R.M.; visualization, L.G.-G.; writing—original draft, L.G.-G.; writing—review and editing, R.M.
Funding
This research was co-funded by the Spanish Ministry of Economy and Competitiveness, through the call RETOS-COLABORACIÓN 2015 of the National Program of Research, Development, and Innovation to face the challenges of society (RTC-2015-4025-4), within the National Scientific and Technical Research and Innovation Plan for the 2013–2016 period, and the European Union, through FEDER funds, which have the main objective of promoting technological development, innovation, and quality research. It also received funding from the Agency for Management of University and Research Grants of the Catalonia Government through the Industrial Doctorates Plan.
Conflicts of Interest
The authors declare no conflicts of interest. The funders had no role in the design of the study; in the collection, analyses, or interpretation of data; in the writing of the manuscript, or in the decision to publish the results.
References
- McGovern, C.; Rusch, P.; Noyce, D. State Practices to Reduce Wet Weather Skidding Crashes; Federal Highway Administration U.S. FHWA-SA-11-21: Washington, DC, USA, 2011.
- Rungruangvirojn, P.; Kanitpong, K. Measurement of visibility loss due to splash&spray: Porous, SMA and conventional asphalt pavements. Int. J. Pavement Eng. 2010, 11, 499–510. [Google Scholar]
- White, T.D. Marshall procedures for design and quality control of asphalt mixtures. In Proceedings of the Association of Asphalt Paving Technologists, San Antonio, TX, USA, 11–13 February 1985. [Google Scholar]
- Vallerga, B.A.; Lovering, W.R. Evolution of the Hveem Stabilometer Method of Designing Asphalt Paving Mixtures. In Proceedings of the Association of Asphalt Paving Technologists, San Antonio, TX, USA, 11–13 February 1985. [Google Scholar]
- Cominsky, R. The Superpave Mix Design Manual for New Construction and Overlays; Strategic Highway Research Program: Washington, DC, USA, 1994. [Google Scholar]
- Ministerio de Obras Públicas y Transportes, Normas NLT. Ensayos de carreteras; Dirección General de Carreteras: Madrid, Spain, 2002.
- Zhang, H.; Lepech, M.D.; Keoleian, G.A.; Qian, S.; Li, V.C. Dynamic life-cycle modeling of pavement overlay systems: Capturing the impacts of users, construcction and roadway deterioration. J. Infrastruct. Syst. 2010, 16, 299–309. [Google Scholar] [CrossRef]
- Moretti, L.; Mandrone, V.; D’Andrea, A.; Caro, S. Evaluation of the environmental and human health impact of road construction activities. J. Clean. Prod. 2018, 172, 1004–1013. [Google Scholar] [CrossRef]
- Balaguera, A.; Carvajal, G.; Albertí, J.; Fullana-i-Palmer, P. Life cycle assessment of road construction alternative materials: A literature review. Resour. Conserv. Recycl. 2018, 132, 37–48. [Google Scholar] [CrossRef]
- Dinis-Almeida, M.; Afonso, M.L. Warm Mix Recycled Asphalt—A sustainable solution. J. Clean. Prod. 2015, 107, 310–316. [Google Scholar] [CrossRef]
- Vaitkus, A.; Andriejauskas, T.; Vorobjovas, V.; Jagniatinskis, A.; Fiks, B.; Zofka, E. Asphalt wearing course optimization for road traffic noise reduction. Constr. Build. Mater. 2017, 152, 345–356. [Google Scholar] [CrossRef]
- Ball, J. Can ISO 14000 and eco-labelling turn the construction industry green? Build. Environ. 2002, 37. [Google Scholar] [CrossRef]
- Gallastegui, I. The use of eco-labels: A review of the literature. Eur. Environ. 2002, 12, 316–331. [Google Scholar] [CrossRef]
- Buckley, R. Tourism ecolabels. Ann. Tour. Res. 2002, 29, 183–208. [Google Scholar] [CrossRef]
- Bratt, C.; Hallstedt, S.; Robert, K.; Broman, G.; Oldmark, J. Assessment of eco-labelling criteria development from a stategic sustainability perspective. J. Clean. Prod. 2011, 19, 1631–1638. [Google Scholar] [CrossRef]
- Majumdar, M. LEED: Leadership in Energy and Environmetal Design: A LEED Rating system: A global tool to assess sustainability in buildings, communities and cities. In Reference Module in Materials Science and Materials Engineering; Elsevier: Amsterdam, The Netherlands, 2019. [Google Scholar]
- Baumeister, S.; Onkila, T. An eco-label for the airline industry? J. Clean. Prod. 2017, 142, 1368–1876. [Google Scholar] [CrossRef]
- Sliggers, J.; Stoffels, T.; Bobbink, B.; Hermsen, R.; Kersten, H.; Schipper, D.; Bijleveld, F.; van Oostenrijk, C.; van Koeverden, M.; Groenendijk, J. Road Surface Labelling; United Nations Economic Commission for Europe—GRB: The Netherlands, 2017. [Google Scholar]
- Martinez, J.B.; Rodriguez, R.E. Performance-based indicators as a tool to manage energy efficiency in transprot. Case study in Spain. Procedia Comput. Sci. 2016, 83, 847–854. [Google Scholar] [CrossRef]
- Ministerio de Fomento, ORDEN FOM/2523/2014; Dirección General de Carreteras: Madrid, Spain, 2014.
- Garcia-Gil, L.; Miró, R.; Pérez-Jiménez, F. New approach to characterize cracking resistance of asphalt binders. Constr. Build. Mater. 2018, 166, 50–58. [Google Scholar] [CrossRef]
- Garcia-Gil, L.; Miró, R.; Pérez-Jiménez, F. Evaluating the role of aggregate gradation on cracking performance of asphalt concrete for thin overlays. Appl. Sci. 2019, 9, 628. [Google Scholar] [CrossRef]
- Pérez-Jiménez, F.; Valdés, R.; Miró, R.; Martínez, A.; Botella, R. Fénix test: Development of a new test procedure for evaluating cracking resistance in bituminous mixtures. Transp. Res. Rec. J. Transp. Res. Board 2010, 2181, 36–43. [Google Scholar] [CrossRef]
- Pérez-Jiménez, F.; Martínez, A.; Sánchez-Domínguez, F.; Ramos-García, J. System for measuring splash on wet pavements. Transp. Res. Rec. J. Transp. Res. Board 2011, 2227, 171–179. [Google Scholar] [CrossRef]
- Paje, S. Innovación Para el Control del Ruido Ambiental; Editorial Universidad de Castilla-La Mancha: Cuenca, Spain, 2013; ISSN 978-84-9044-050-6. [Google Scholar]
- UNE-EN 12697-34:13, Bituminous Mixtures—Test Methods for Hot Mix Asphalt—Part 34: Marshall Test; AENOR. Asociación Española de Normalización y Certificación: Madrid, Spain, 2013.
- UNE-EN 12697-17:18, Bituminous Mixtures—Test Methods—Part 17: Particle Loss of Porous Asphalt Specimens; AENOR. Asociación Española de Normalización y Certificación: Madrid, Spain, 2018.
- UNE-EN 12697-12:09, Bituminous Mixtures—Test Methods for Hot Mix Asphalt—Part 12: Determination of the Water Sensitivity of Bituminous Specimens; AENOR. Asociación Española de Normalización y Certificación: Madrid, Spain, 2009.
- UNE-EN 13036-1:10, Road and Airfield Surface Characteristics—Test Methods—Part 1: Measurement of Pavement Surface Macrotexture Depth Using a Volumetric Patch Technique; AENOR. Asociación Española de Normalización y Certificación: Madrid, Spain, 2010.
- UNE 41201:2010 IN, Road and Airfield Surface Characteristics. Procedure for Determining the Skid Resistance of a Pavement Surface by Measurement of the Sideway Force Coefficient (SFCS): SCRIM(r); AENOR. Asociación Española de Normalización y Certificación: Madrid, Spain, 2010.
- UNE-EN ISO 10534-1:02, Acoustics—Determination of Sound Absorption Coefficient and Impedance in Impedances Tubes—Part 1: Method Using Standing Wave Ratio; AENOR. Asociación Esañola de Normalización y Certificación: Madrid, Spain, 2002.
- UNE-EN 13108-21:07, Bituminous Mixtures—Material Specifications—Part 21: Factory Production Control; AENOR. Asociación Española de Normalización y Certificación: Madrid, Spain, 2007.
- Ministerio de Fomento, ORDEN FOM/891/2004; Dirección General de Carreteras: Madrid, Spain, 2004.
- Pérez-Jiménez, F.; Valdés, G.; Muñoz, M.; Miró, R.; Martínez, A.; Botella, R.; Amorós, J. Criterios y especificaciones para el uso del ensayo Fénix en el diseño de mezclas bituminosas tipo AC. Rev. Carret. 2014, 185, 6–19. [Google Scholar]
- Miró, R.; Valdés, G.; Martínez, A.; Segura, P.; Carrero, M.; Rodríguez, C. Evaluación de las propiedades mecánicas de mezclas bituminosas discontinuas para capas de rodadura fabricadas con altas tasas de RAP. In Proceedings of the XVI Congreso Ibero-Latinoamericano del Asfalto, Rio de Janerio, Brazil, November 2011. [Google Scholar]
Figure 1.
Fénix test set-up and stress–displacement output curve.

Figure 2.
Splash and spray trailer and measuring details.

Figure 3.
Tiresonic Mk4-LA2IC for acoustics characterization of road surfaces and detail of the microphone positions.
Figure 3.
Tiresonic Mk4-LA2IC for acoustics characterization of road surfaces and detail of the microphone positions.

Figure 4.
Label classes for the properties.

Figure 5.
Normality tests applied on the stability property.

Figure 6.
Probability density function of skid resistance.

Figure 7.
Probability density function of Marshall deformation.

Figure 8.
Label limits for indirect tensile strength ratio (ITSR; gap-graded and asphalt concrete friction courses).
Figure 8.
Label limits for indirect tensile strength ratio (ITSR; gap-graded and asphalt concrete friction courses).

Figure 9.
Flowchart of the global labeling scheme.

Figure 10.
Histogram and normal distribution curve of stability indicators.

Figure 11.
Marshall stability labels based on the type of mixture.

Figure 12.
Marshall stability global label.

Figure 13.
Marshall deformation global label.

Figure 14.
Disaggregation resistance labels based on the type of mixture.

Figure 15.
Disaggregation resistance global label.

Figure 16.
ITSR labels based on the type of mixture.

Figure 17.
ITSR global label.

Figure 18.
Cracking resistance label.

Figure 19.
Macrotexture labels based on the type of mixture.

Figure 20.
Skid resistance labels based on the type of mixture.

Figure 21.
Macrotexture and skid resistance global label.

Figure 22.
“Splash and spray” effect label.

Figure 23.
Tire–pavement noise emissions (a), production temperature (b), and percentage of recycled asphalt pavement (RAP) labels (c).
Figure 23.
Tire–pavement noise emissions (a), production temperature (b), and percentage of recycled asphalt pavement (RAP) labels (c).

Figure 24.
Global performance label.

Figure 25.
Global label performance for mixture 1.

Figure 26.
Global label performance for mixture 2.


Table 1.
List of considered properties for each category.
| Category | Property | Indicator | Standard |
|---|---|---|---|
| Mechanical performance | Stability | Marshall stability Marshall deformation | EN 12697-34 [26] |
| Disaggregation resistance | Dry Cantabro Loses (%) | EN 12697-17 [27] | |
| Water sensibility | Indirect tensile strength ratio | EN 12697-12 [28] | |
| Cracking resistance | Tensile strength displacement at 50% post-peak load | Fénix test [23] | |
| Functional performance | Macrotexture | Surface mean texture depth (mm) | EN 13036-1 [29] |
| Skid resistance | Sideway force coefficient | UNE 41201 IN [30] | |
| Splash and spray | Number of drops | - | |
| Environmental performance | Tire–pavement noise | Sound absorption coefficient | EN 10534-1 [31] |
| Production temperature | Production temperature (°C) | EN 13108-21 [32] | |
| Recycled asphalt pavement (RAP) | Percentage of RAP out of the total mass of the mixture (%) | - | |
| Reuse of by-products | Yes/no | - |
Table 2.
Minimum requirements in terms of texture and skid resistance according to the Spanish technical standard [20]. AC—asphalt–concrete.
Table 2.
Minimum requirements in terms of texture and skid resistance according to the Spanish technical standard [20]. AC—asphalt–concrete.
| Mean Depth (mm) | Sideway Force Coefficient (%) | |
|---|---|---|
| AC mixtures | 0.7 | 65 |
| Gap-graded mixtures | 1.1 | 65 |
| Open graded friction courses | 1.5 | 60 |
Table 3.
Design parameters of the mixtures.
| Mixture | Bitumen Type | Bitumen Content (%) (with Aggregate) | Density (g/cm3) | Air Voids (%) (with Mix) | Aggregation Gradation |
|---|---|---|---|---|---|
| Mix 1 | Polymer modified binder | 5.28% | 2.120 | 16.20% | Asphalt concrete friction course |
| Mix 2 | Crumb rubber modified binder | 5.25% | 2.185 | 14.20% | Asphalt concrete friction course |
Table 4.
Mechanical, functional, and environmental properties of the mixtures. ITSR—indirect tensile strength ratio.
Table 4.
Mechanical, functional, and environmental properties of the mixtures. ITSR—indirect tensile strength ratio.
| Indicators | Labels | Rated Label | Geometric Mean | |||||
|---|---|---|---|---|---|---|---|---|
| Category | Mix 1 | Mix 2 | Mix 1 | Mix 2 | Mix 1 | Mix 2 | Mix 1 | Mix 2 |
| Mechanical performance | ||||||||
| Dry Cantabro losses (%) | 4.2 | 4.9 | A | A | 3 | 3 | 1.73 | 1.73 |
| ITSR (%) | 92.7 | 93.4 | C | C | 1 | 1 | ||
| Functional performance | ||||||||
| Macrotexture (mm) | 1.06 | 1.08 | D | D | 0 | 0 | 0 | 0 |
| Sideway force coefficient (%) | 56.8 | 53.7 | D | D | 0 | 0 | ||
| Environmental performance | ||||||||
| Tire–pavement noise (dB(A)) | 85.55 | 86.96 | A | A | 3 | 3 | 0 | 0+ |
| Production temperature (°C) | >150 | >150 | D | D | 0 | 0 | ||
| Reuse of by-products | NO | YES | + | + | ||||
© 2019 by the authors. Licensee MDPI, Basel, Switzerland. This article is an open access article distributed under the terms and conditions of the Creative Commons Attribution (CC BY) license (http://creativecommons.org/licenses/by/4.0/).
Share and Cite
MDPI and ACS Style
Garcia-Gil, L.; Miró, R. Labeling Strategy for Evaluating the Performance of Thin Asphalt Wearing Courses. Appl. Sci. 2019, 9, 1694. https://doi.org/10.3390/app9081694
AMA Style
Garcia-Gil L, Miró R. Labeling Strategy for Evaluating the Performance of Thin Asphalt Wearing Courses. Applied Sciences. 2019; 9(8):1694. https://doi.org/10.3390/app9081694
Chicago/Turabian StyleGarcia-Gil, Lívia, and Rodrigo Miró. 2019. "Labeling Strategy for Evaluating the Performance of Thin Asphalt Wearing Courses" Applied Sciences 9, no. 8: 1694. https://doi.org/10.3390/app9081694
Note that from the first issue of 2016, this journal uses article numbers instead of page numbers. See further details here.