Article

Experimental and DEM Analysis on Secondary Crack Types of Rock-Like Material Containing Multiple Flaws Under Uniaxial Compression

1
School of Qilu Transportation, Shandong University, Jinan 250061, China
2
Geotechnical & Structural Engineering Research Center, Shandong University, Jinan 250061, China
3
School of Civil Engineering, Shandong Jianzhu University, Jinan 250101, China
4
State Key Laboratory of Water Resources and Hydropower Engineering Science, Wuhan University, Wuhan 430072, China
*
Authors to whom correspondence should be addressed.
Appl. Sci. 2019, 9(9), 1749; https://doi.org/10.3390/app9091749
Submission received: 8 March 2019 / Revised: 17 April 2019 / Accepted: 23 April 2019 / Published: 27 April 2019
(This article belongs to the Special Issue Fatigue and Fracture of Non-metallic Materials and Structures)

Abstract

:
To better understand the evolution of crack propagation in brittle rock mass, the particle velocity field evolution on both sides of secondary crack in rock-like materials (cement mortar specimens) with pre-existing parallel double flaws under uniaxial compression is analyzed based on the discrete element theory. By bringing in strain rate tensor, a new technique is proposed for quantifying the failure mechanism of cracks to distinguish the types and mechanical behaviors of secondary cracks between pre-existing parallel flaws. The research results show that the types and mechanical behaviors of secondary cracks are distinct at different axial loading stages and can be directly identified and captured through the presented approach. The relative motion trend between particles determines the types and mechanical behaviors of secondary cracks. Based on particles movement on both sides of secondary cracks between cracks, the velocity fields of particles can be divided into four types to further analyze the causes of different types of cracks. In different axial loading stages, the velocity field types of particles on both sides of cracks are continuously evolving. According to the particle velocity field analysis and the proposed novel way, the types of macroscopic cracks are not directly determined by the types of dominated micro-cracks. Under uniaxial compression, the particles between secondary cracks and pre-existing parallel flaws form a confined compressive member. Under the confinement of lateral particles, secondary cracks appear as shear cracks between pre-existing parallel flaws at the beginning stage of crack initiation.

1. Introduction

Fractured rock mass is one of the most significant construction objects encountered in geotechnical engineering. Under high in-situ stress, crack propagation, and coalescence in fractured rock mass could result in local damage or even failure, which could eventually threaten the stability and safety of rock engineering projects [1,2,3,4,5]. Therefore, a thorough understanding of cracking propagation emanating from existing flaws in fractured rock mass can benefit geotechnical engineering design and implementation, and relevant research has had widespread attention.
A large number of experimental works are available on crack propagation and failure mode from pre-cracked brittle rock-like materials under uniaxial compression [6,7,8,9,10]. It is generally accepted and confirmed that wing cracks in brittle rock materials under compression are mostly tensile cracks [11,12,13,14]. The initiation of secondary cracks is often related to the stress field at or near the tips of the pre-existing flaws, but the propagation direction is distinct from the wing crack. Bobet [15] observed in the laboratory that two initiation directions are possible: one coplanar or quasi-coplanar to the flaw, and the other one parallel to the wing cracks but in the opposite direction. Cao et al. [16] found that the wing cracks propagate to a certain length and then stop through prefabricating the cracks in the cement mortar material. Then, as the load is increased, the secondary cracks begin to initiate in large amount. Compared with wing cracks, secondary cracks often initiate with a large quantity, appearing to be a rather complicated process, which are often difficult to distinguish in the laboratory without advanced technology. Numerous studies [17,18,19,20] have confirmed that the relative shear results in the initiation of secondary cracks, suggesting that the secondary cracks are shear in essence. However, Wong and Einstein [21,22] conducted a series of laboratory experiments to find that not only is the secondary crack made up with shear cracks, but also contains tensile cracks. Wong et al. [23] also found that shear bands contain a large number of tensile micro-cracks in the rock bridge area, indicating that previous understanding of secondary cracks is not profound. In addition, the propagation direction of these micro-cracks is almost parallel to the most compressive direction, which demonstrates that the current description of the crack nature is not accurate. Consequently, the urgent demanding for identifying secondary crack is of strong interest to scholars.
Due to the rapidity and convenience of numerical methods, numerical simulation has become a widely used method to study the deformation and failure mechanism of materials. The discrete element method proposed by Cundall [24] is very effective for analyzing the crack propagation process and explaining the types of cracks observed in the previous physical experiments. The parallel bond model based on the discrete element theory has been widely used in rock damage analysis for decades [25,26,27,28,29], and the numerical simulation results are generally in good agreement with the laboratory results. However, due to the lack of effective approaches, the current numerical model based on parallel bonding is not proficient in distinguishing the mechanical behaviors and types of cracked shear bands in the process of crack propagation and coalescence for several years. Hazzard [30] presented a technique which is described for quantifying the seismic source mechanisms of the modelled events to investigate the failure mechanism in rock, providing insight into understanding of crack nature. Based on the moment tensor inversion analysis, Zhang et al. [31] found that a large number of tensile micro-cracks appeared in the rock bridge area at the initial loading stage, and an obvious shear band formed due to the relative slip between the particles, indicating that the macroscopic shear fracture is not completely composed of shear micro-cracks. Strain rate tensor and velocity field analysis have been widely performed in the analysis of the deformation mechanism of earthquake fault [32,33]. Ge et al. [34] employed tiny blocks to reveal the crustal movement deformation mode by analyzing the velocity field and strain rate field in the region. Kostrov et al. [35] proposed that the average strain rate tensor caused is equal to the sum of the moment tensors of all earthquakes occurring in a unit volume. Compared to the moment tensor analysis, the strain rate tensor is more suitable for distinguishing the mechanical behaviors and types of secondary cracks since strain rate tensor can comprehensively characterize the source evolution mechanism of faults within a given volume without further analysis of the moment tensors one by one. Additionally, the moment tensor analysis is required to compile complex codes with time consuming. However, based on the discrete element theory, we can easily obtain the strain rate tensor by arranging the measurement circle between pre-existing parallel flaws, and accurately define two variables to quantify the crack failure mechanism, providing a more efficient method to distinguish secondary crack types.
To further gain insight into the mechanism of secondary crack propagation, we proposed a technique to quantify the failure mechanism of secondary crack at different loading stages by means of adopting strain rate tensor analysis. Furthermore, according to the relative motion trend between particles at various stress levels, the velocity fields of both sides of secondary cracks are classified for better explanation of crack types. Combined with particle velocity field analysis and values of variable R, it is convenient for us to distinguish crack types and reveal essential crack characteristics.

2. Mesoscopic Parameter Calibration and Basic Theory

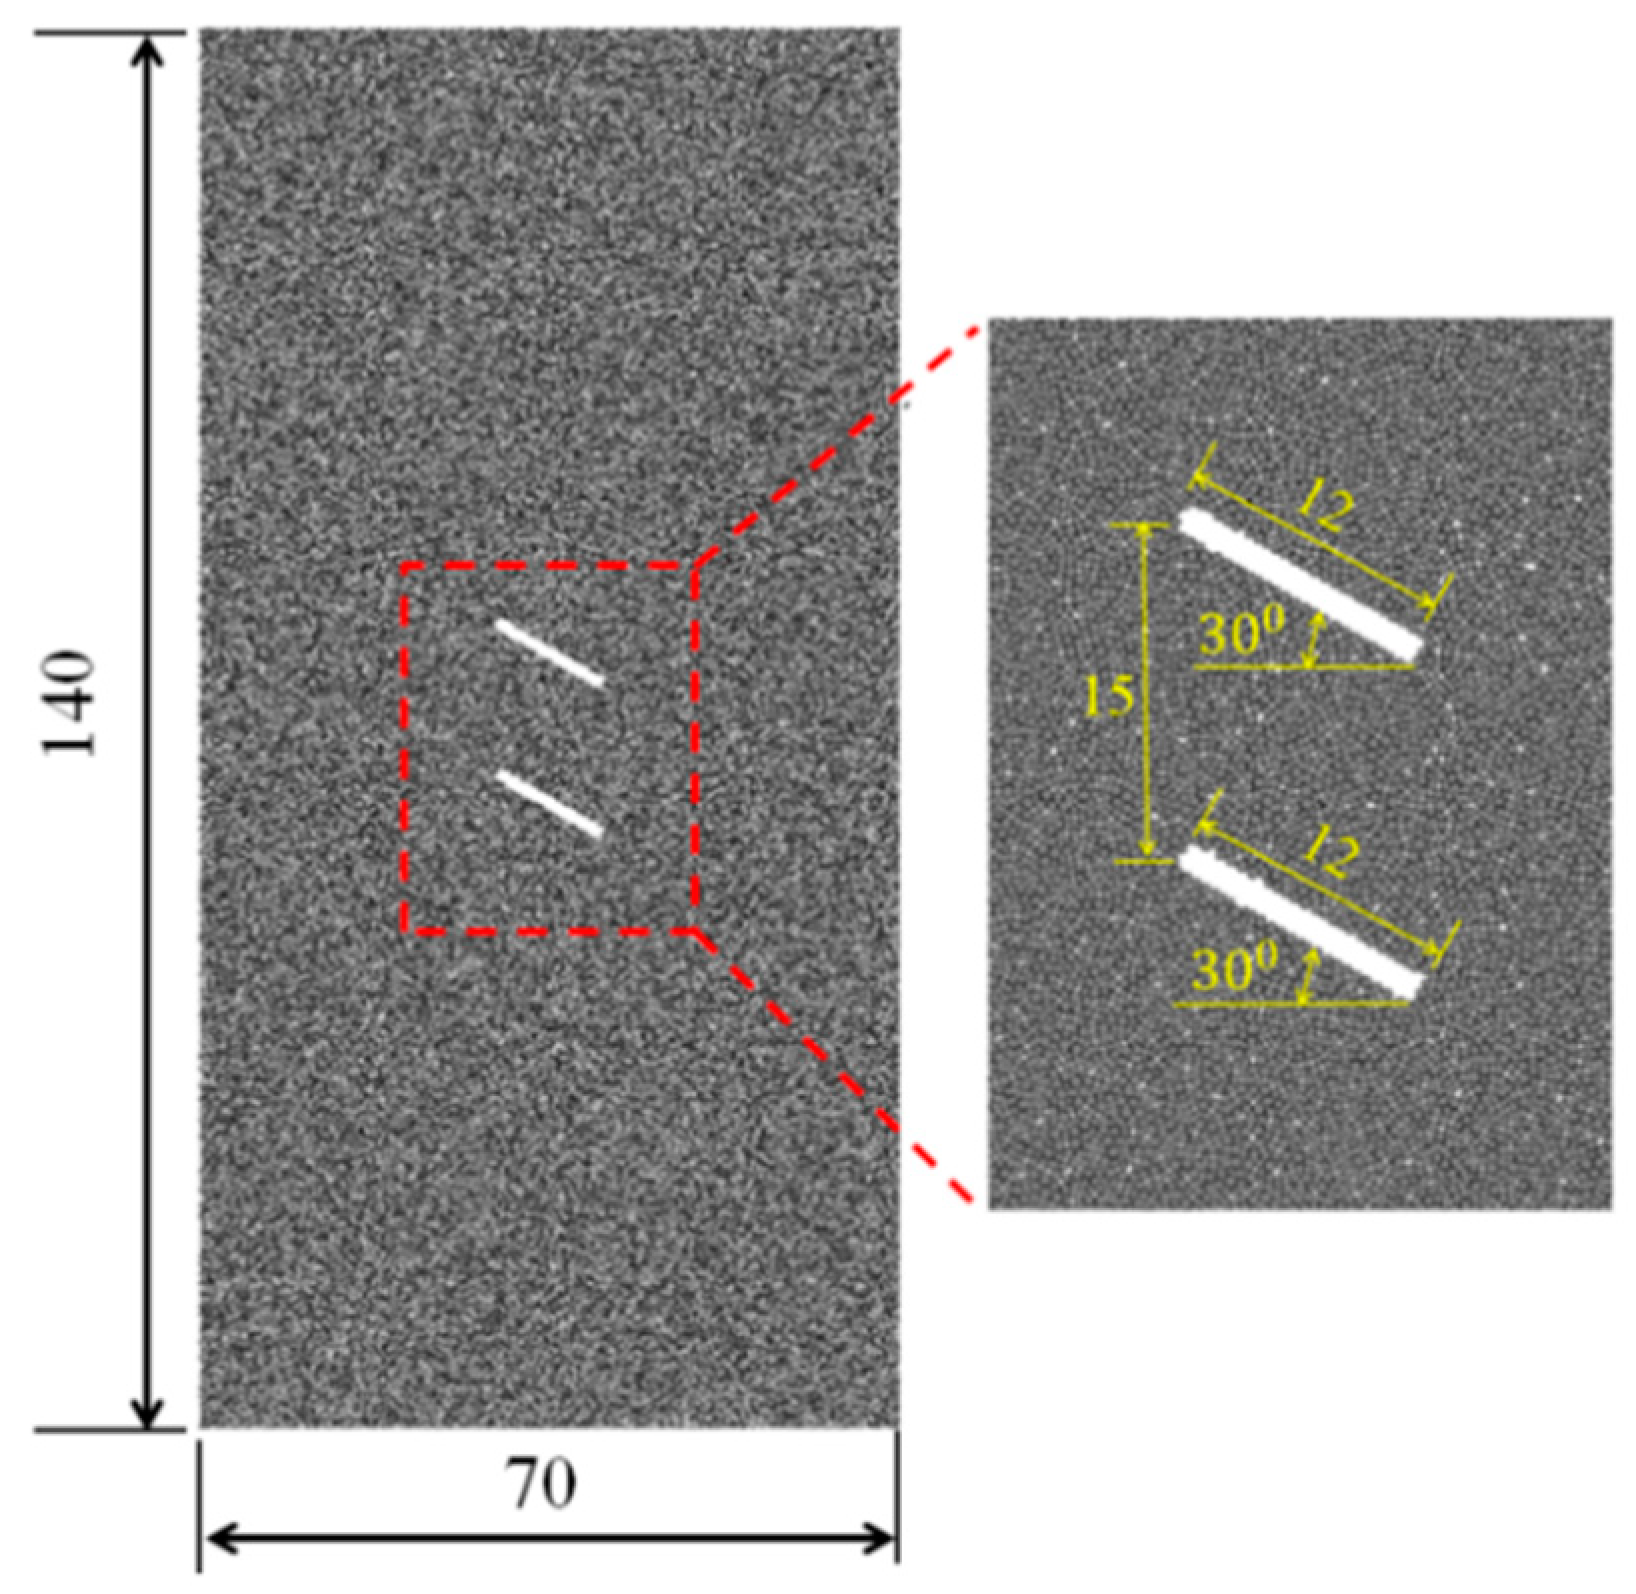
2.1. Specimen Preparation and Mesoscopic Parameter Calibration

The cement mortar, as a typical rock-like material for laboratory uniaxial compression tests, is made from a mixture of 42.5R ordinary Portland cement, quartz sand, and water, with a mass ratio of 1:2.34:1.35, respectively. In order to promote the fluidity of cement mortar, a small amount of water reducing agent was added during the preparation of specimens. The physico-mechanical parameters of this rock-like material are listed in Table 1. The physico-mechanical properties are similar to those of typical rock materials such as sandstone, and the ratio of tensile strength to compressive strength is close to 1:10, indicating that it is a comparatively ideal rock-like material with high brittleness. Therefore, it can be used as a rock-like material to study the evolution of secondary crack propagation in brittle rocks.
The specimens used in uniaxial test series are cuboid blocks with dimensions of 140 mm in height, 70 mm in width, and 40 mm in thickness. Prior to casting the cement mortar specimens, the iron piece, fixed in the mold, is smeared with a little epoxy resin on the surface. After meticulous maintenance in the mold for 24 h, two flaws, created by pulling out the thin iron pieces, are formed through the thickness of the specimens during casting in such a way that the plane of the flaws is perpendicular to the faces of the specimens. Prefabricated cracks are open cracks with a certain degree of openness, so the internal faces do not touch each other during fabrication and loading. Two flaws are always parallel to each other, and have a constant length of 12 mm. The thickness of the flaws is 1.2 mm approximately. To study the influence of the crack inclination angle on the mechanical properties and failure process of the rock mass, three flaw inclination angles of 30°, 45°, and 60° are used, and the spacing of pre-existing parallel flaws is 15 mm. Two flaws are located at the center of the specimen. Six cement mortar specimens (a total of 18 specimens) were prepared with the same flaw inclination angle, and the average values of the test data are used for analysis.
The calculations performed in PFC2D (Particle Flow Code in 2 dimensions) is based on Newton’s second law and a force-displacement law at the contacts. Newton’s second law is used to determine the motion of each particle arising from the contact and body forces acting upon it, while the force-displacement law is used to update the contact forces arising from the relative motion at each contact [36]. Particle Flow Code (PFC) has great advantage in simulating the micro-mechanical behavior and investigating the mechanism of crack propagation in brittle materials. However, the straightforward adoption of circular (or spherical) particles cannot fully capture the behavior of complex shaped and highly interlocked grain structures [37]. Further, PFC fails to simulate the mechanical properties of brittle rock with higher internal friction angle. A parallel bond model is adopted as the numerical model of specimens, and the model size and crack layout are shown in Figure 1.
The loading stops when the axial stress drops to 50% of the peak strength. Zhang et al. [38] studied the effect of loading rate on the crack propagation and failure modes of the specimen under uniaxial loading. To ensure that the numerical model maintains static equilibrium during the loading process, the displacement loading rate of the numerical model is taken as 0.08 m/s. In PFC, it is a crucial step to calibrate the mesoscopic parameters by performing a laboratory compression test on the standard specimens. The macroscopic mechanical properties of specimens are determined by the values of the mesoscopic parameters between the particles. A few references [39,40] reveal that the value of the compressive strength ( σ c ¯ ) and the tensile strength ( τ c ¯ ) will affect the failure mode and the type of micro-crack, as such the friction coefficient between the particles has less influence on the significant parameters such as initiation stress, peak strength, and elastic modulus of specimens. According to the characteristics of cement mortar material, the parameters obtained by numerical simulation are consistent with the physical experimental parameters of the complete standard specimen by adjusting the mesoscopic parameters. The specific parameters are listed in Table 2. Since cement mortar is a brittle material inducing complex crack types under compressive loads, so it is essential to control the type of micro-crack by continuously adjusting the values of σ c ¯ / τ c ¯ , to make sure that the failure modes of the specimens obtained by numerical simulation are in a good agreement with the laboratory test results. The specific failure modes are shown in Figure 2, and the final mesoscopic calibration parameters are given in Table 3.

2.2. Strain Rate Tensor

Based on acoustic emission technology, the moment tensor inversion analysis [41,42,43] has been widely used to distinguish rock fracture types. Ming et al. [44] proposed a criterion for judging rock rupture through reasonably decomposing the variability tensor. The strain rate tensor can be calculated through the moment tensor inversion, but it is still inadequate to adopt strain rate tensor to judge the crack type and analyze the crack propagation law. The PFC software developed based on discrete element theory can not only simulate the propagation and evolution of micro-cracks in rock masses, but also consistently monitor the strain rate tensor changes in specific regions through the measurement circle. The schematic diagram of the main strain rate tensor when micro-cracks appear is shown in Figure 3. When the contact between the particles breaks, the velocity of the particles will instantly change, triggering the variation of the magnitude and direction of the strain rate tensor in the monitored region. Therefore, the evolution law of crack propagation can be accurately reflected by strain rate tensor.
In PFC, when the absolute value of the difference between the actual velocity of the particles in the measurement circle and the calculated velocity is minimized, the strain rate tensor in the measurement circle can be obtained by establishing a system of equations [36].
Assuming that there are N particles in the measurement circle, the particle translation speed and the centroid position are V i and x i respectively, and the average velocity V ¯ i and average position x ¯ i can be expressed as:
V ¯ i = N V i N
x ¯ i = N x i N
The actual relative velocity V ˜ i and relative position of the particles x ˜ i are:
V ˜ i = V i V ¯ i
x ˜ i = x i x ¯ i
Assuming that the particles move from point x i to point x j during infinitesimal time, the average speed difference between the two points is:
d v i = α i j ˙ d x j
If the velocity gradient tensor α ˙ i j is known, the relative velocity can be calculated as:
v ¯ i = α i j ˙ x ¯ j
Then the square of the absolute value of the difference between the relative velocity calculated in the circle and the actual relative velocity is:
z = N | v ¯ i V ˜ i | 2
When z takes the minimum value, namely
z α i j ˙ = 0
Here, the velocity gradient tensor can be solved by the following equation
[ N x ˜ 1 x ˜ 1 N x ˜ 2 x ˜ 1 N x ˜ 1 x ˜ 2 N x ˜ 2 x ˜ 2 ] ( α i 1 ˙ α i 2 ˙ ) = ( N V ˜ i x ˜ 1 N V ˜ i x ˜ 2 )
In PFC, the velocity gradient tensor can characterize the strain rate tensor, and the principal strain rate tensor calculated by the strain rate tensor can reflect the crack propagation processes and distinguish the crack types. If the value of the strain rate in the measurement circle is zero, it means no micro cracks appear in this area. Once the secondary crack starts to initiate, the velocity field of the fracture region of the particle will vary, which consequently results in the changes of strain rate magnitudes and directions. The magnitudes and directions of the principal strain rate represent the number of micro-cracks and deformation characteristics of the crack, respectively. To better understand on the variation law of the strain rate tensor of secondary crack between parallel pre-existing flaws, the layout of the measurement circle is shown in Figure 4.

3. Analysis of Numerical Simulation Results

In this paper, the cracks initiate between parallel pre-existing flaws before the axial stress peak strength are defined as secondary cracks. In PFC numerical simulation, the red, green, and blue micro-cracks represent tensile micro-cracks, tensile-shear micro-cracks, and compressive-shear micro-cracks, respectively.

3.1. Research on Crack Propagation Mechanism

Feignier et al. [45] suggested that the ratio of isotropic and deviatoric components of the moment tensor can be effectively used to quantify the failure mechanisms of events and distinguish the types of cracks. The average strain rate tensor caused by crack propagation is equal to the sum of the moment tensors in a unit area. Therefore, we define the variable R based on the strain rate tensor to analyze the crack initiation mechanism and judge the crack types. The variable R is given as:
R = t r ( α i j ˙ ) 100 | t r ( α i j ˙ ) | + | m i * |
where tr( α ˙ i j ) is the trace of the moment tensor, which can be expressed as α ˙ i j = m 1 + m 2 + m 3 and m i (i = 1, 2, 3) are the eigenvalues of the moment tensor obtained by the calculation described in Equation (10). m i * is the deviatoric eigenvalue, which can be expressed as m i * = m i − tr( α ˙ i j )/3. The ratio (R) ranges between 100 and −100.
In the breakage process of parallel bond contact, the propagation law, and types of cracks are determined to some extent by the velocity and movement tendency of the adjacent particles, indicating that the continuous evolution process of the crack is essentially the evolution process of the particle velocity. Therefore, according to the velocity and relative motion trend of the particles on both sides of the crack, the velocity field of the particles can be obviously divided into four types, namely Types I, II, III, and IV, as shown in Figure 5. The definitions of the four types of cracks are described as below.
(1)
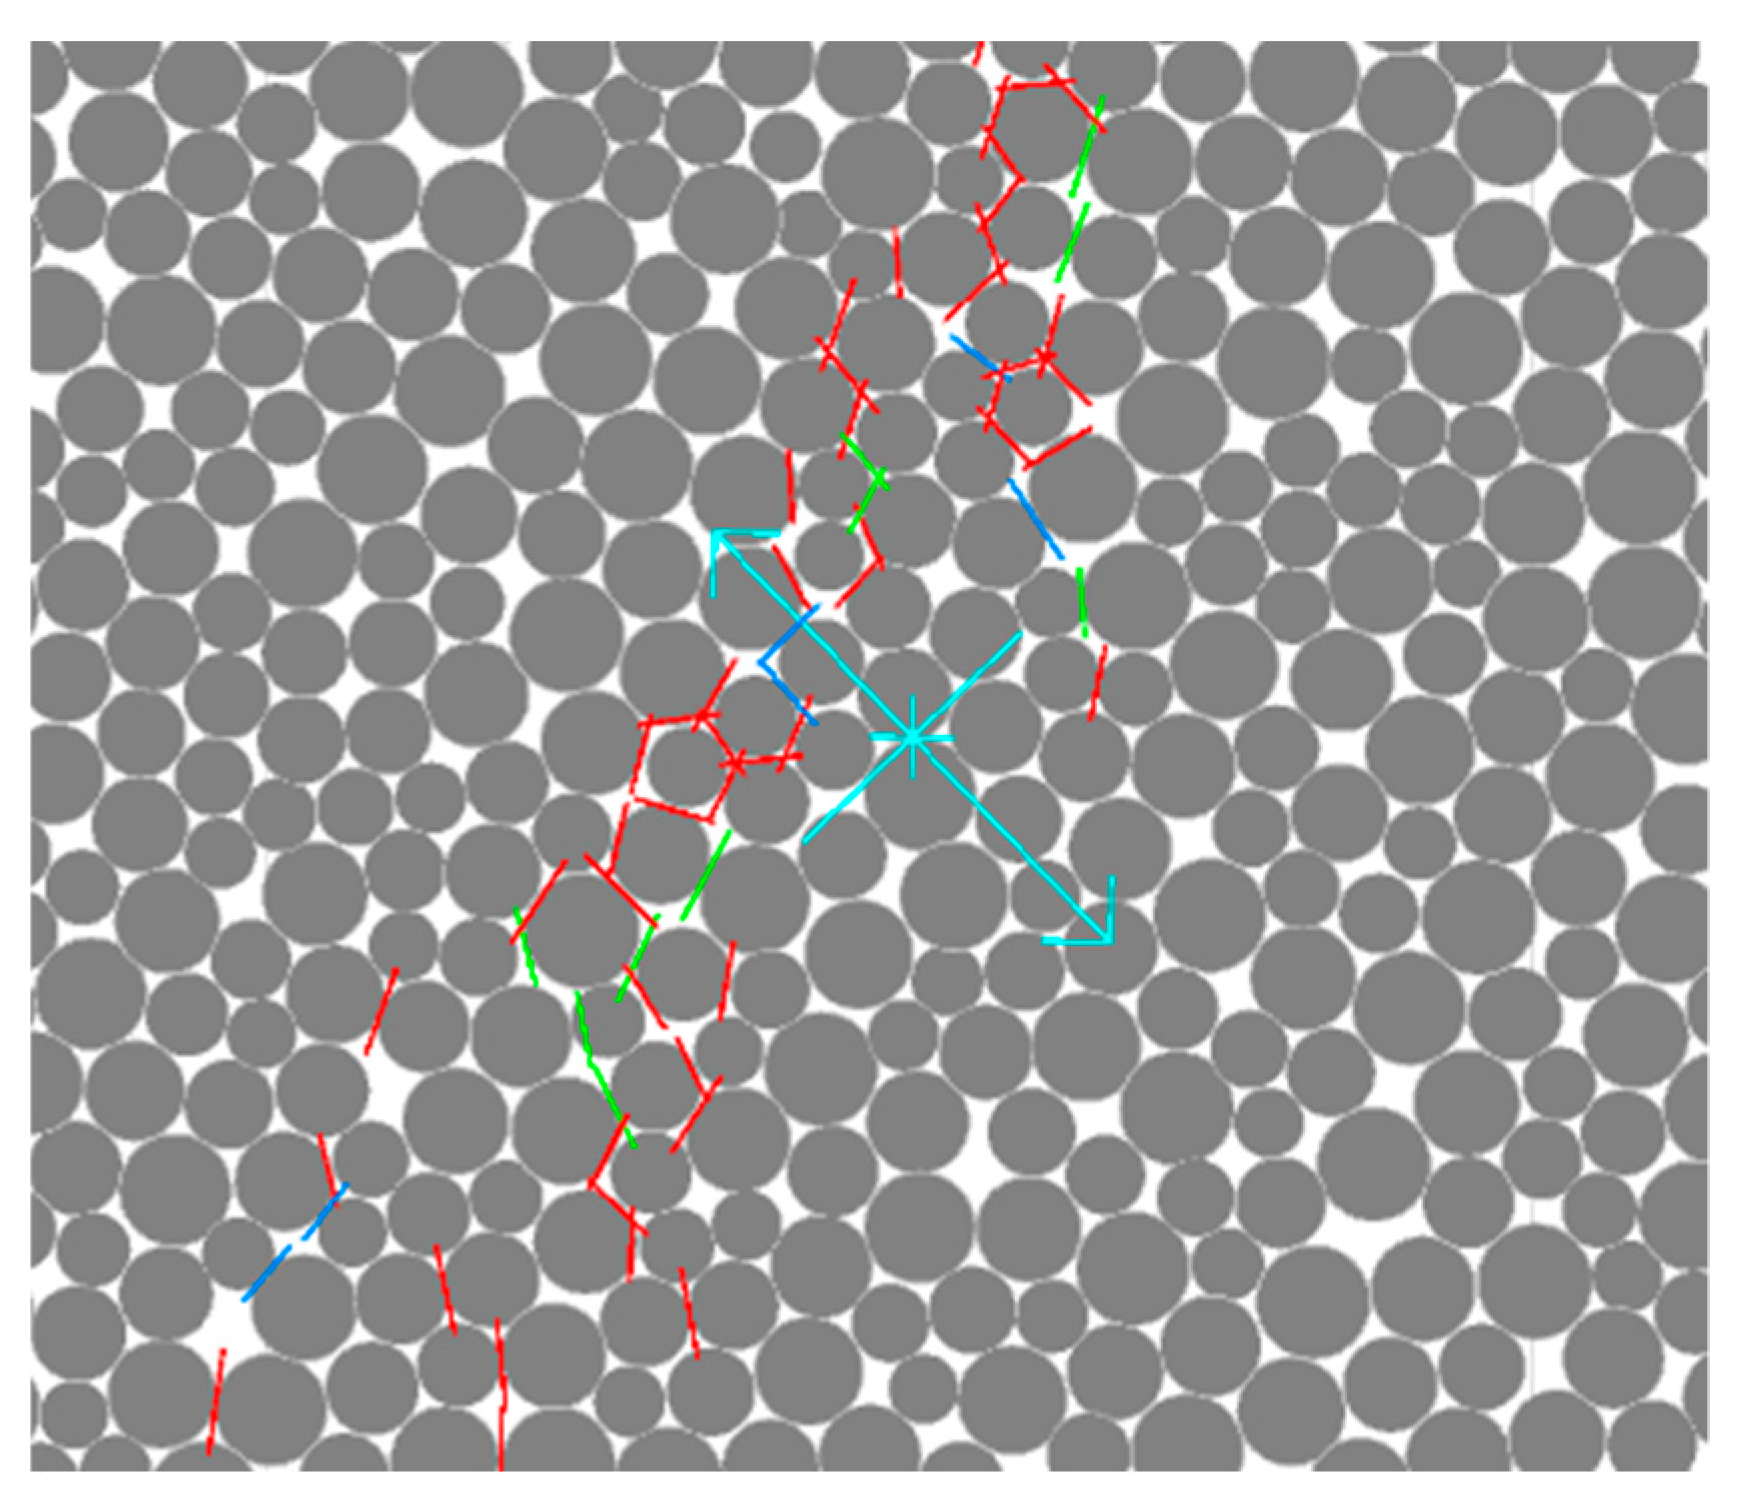
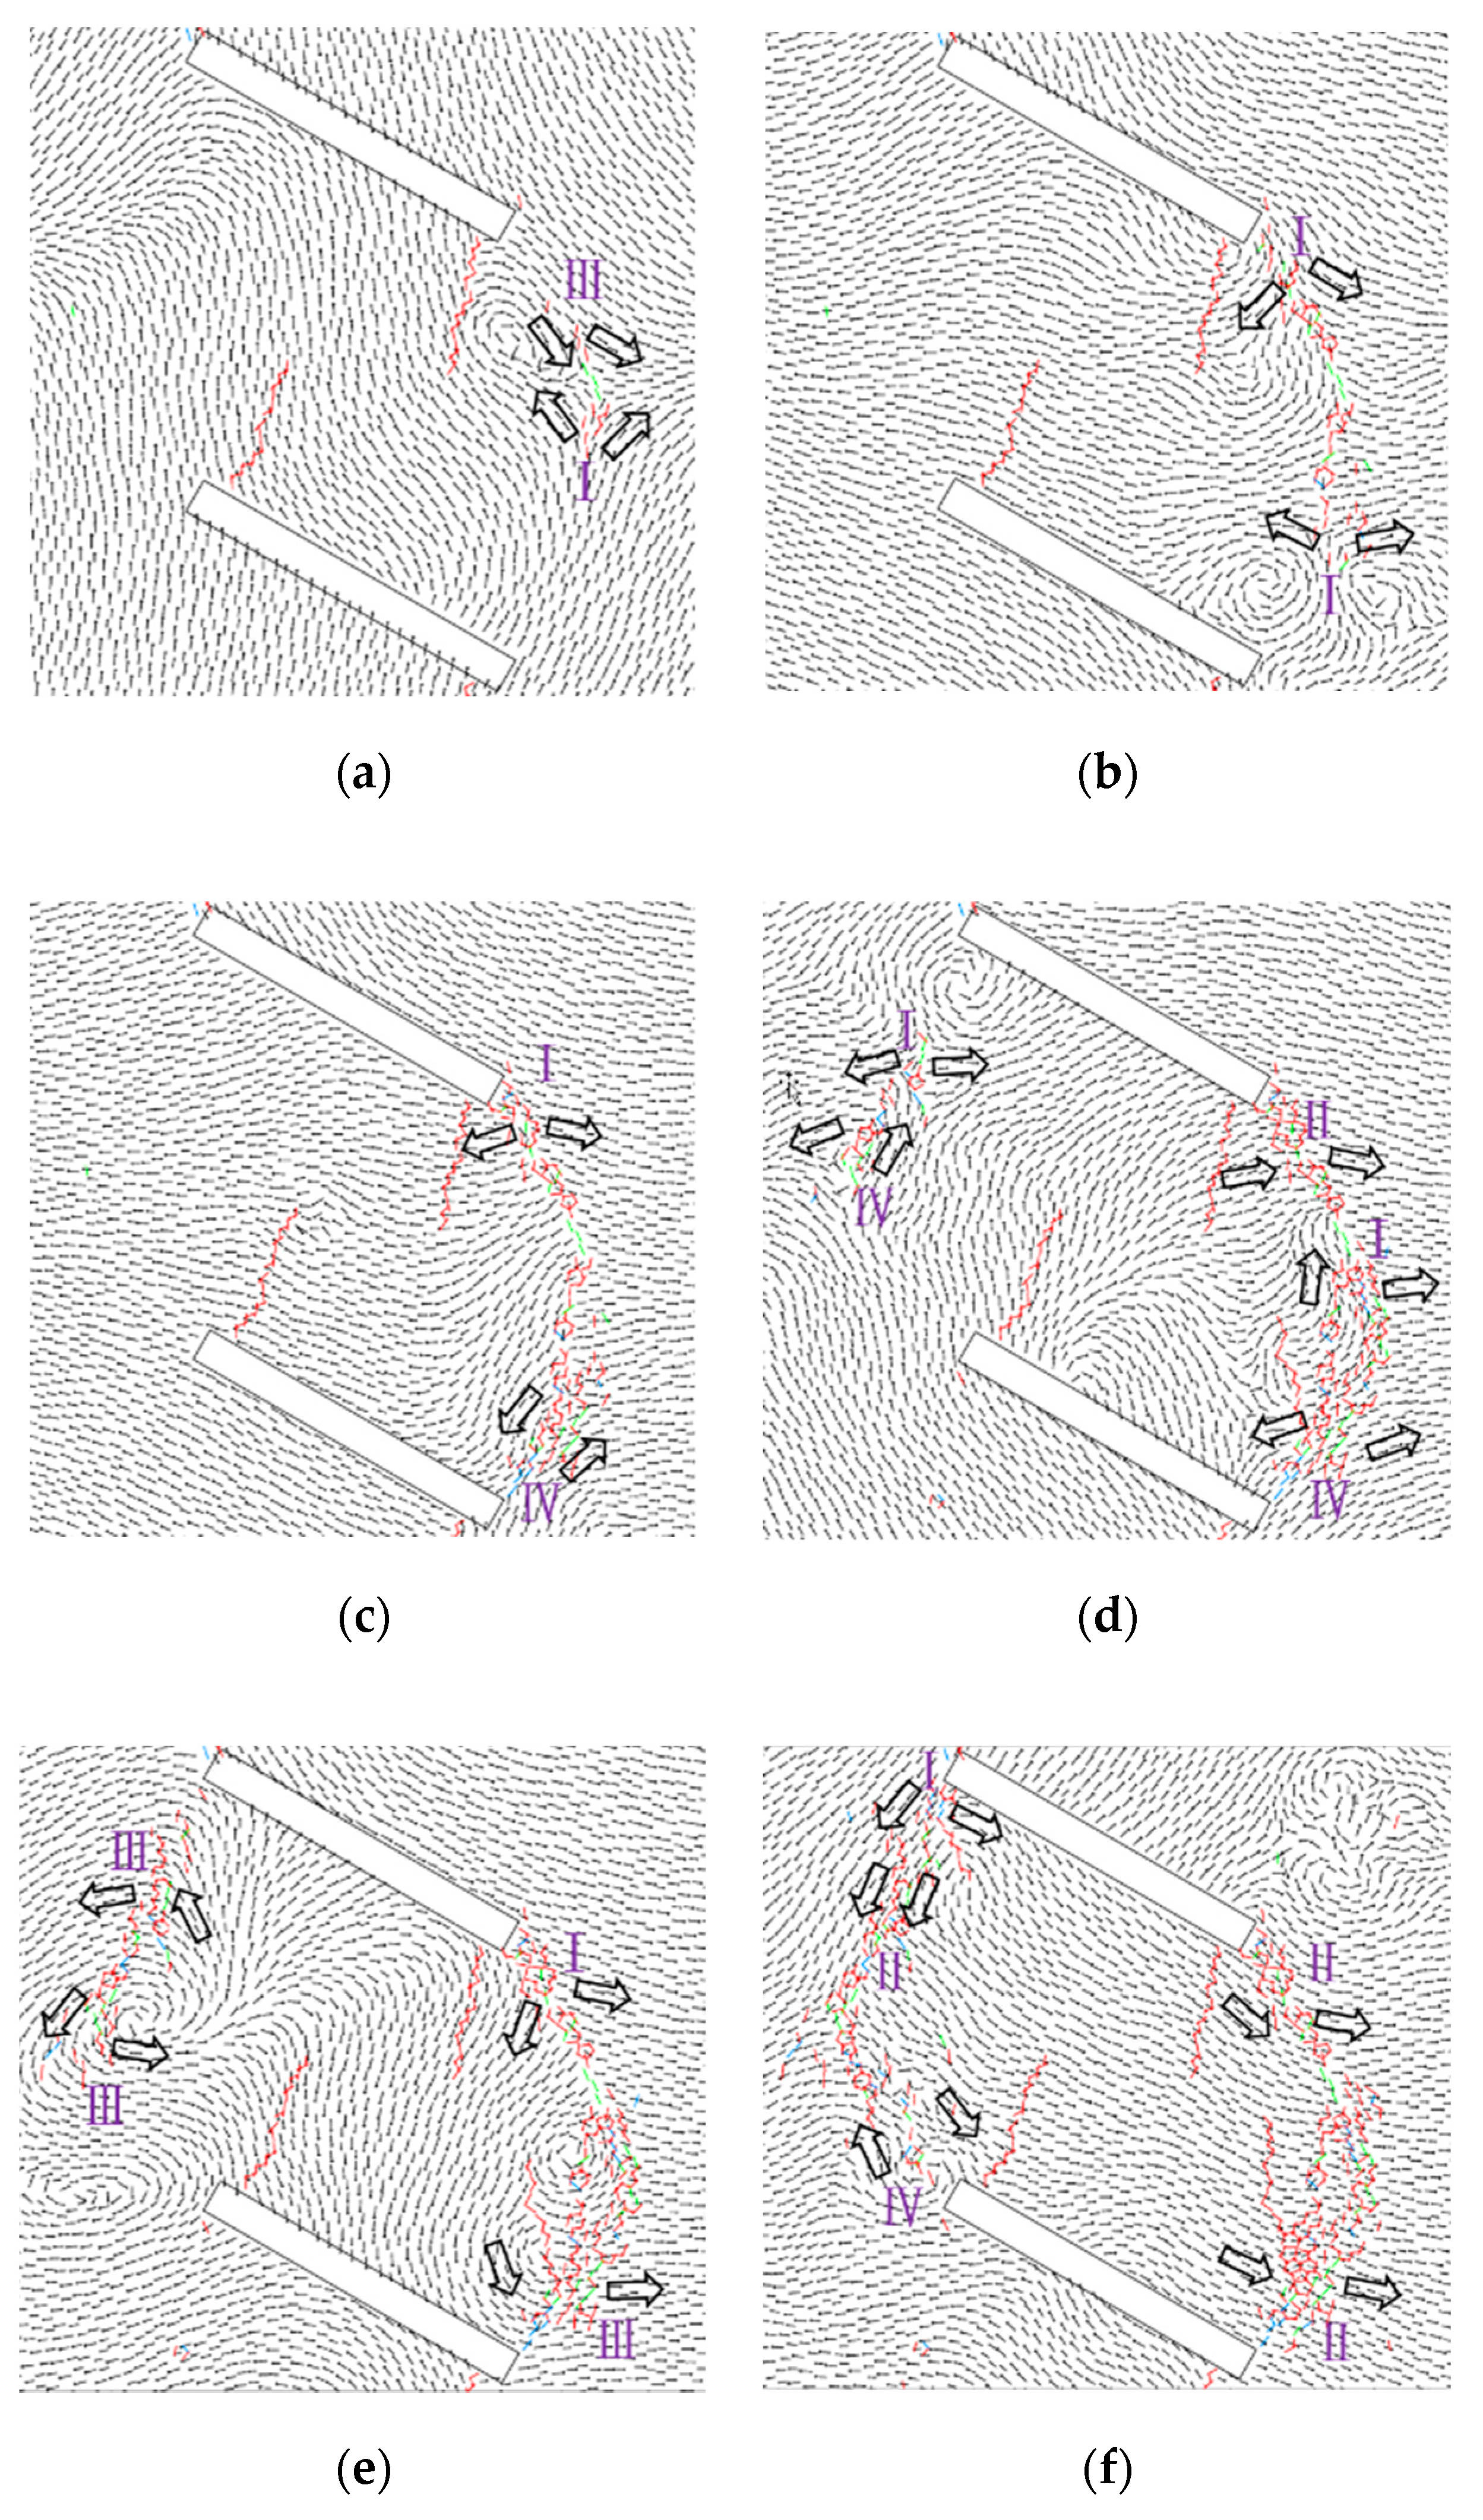
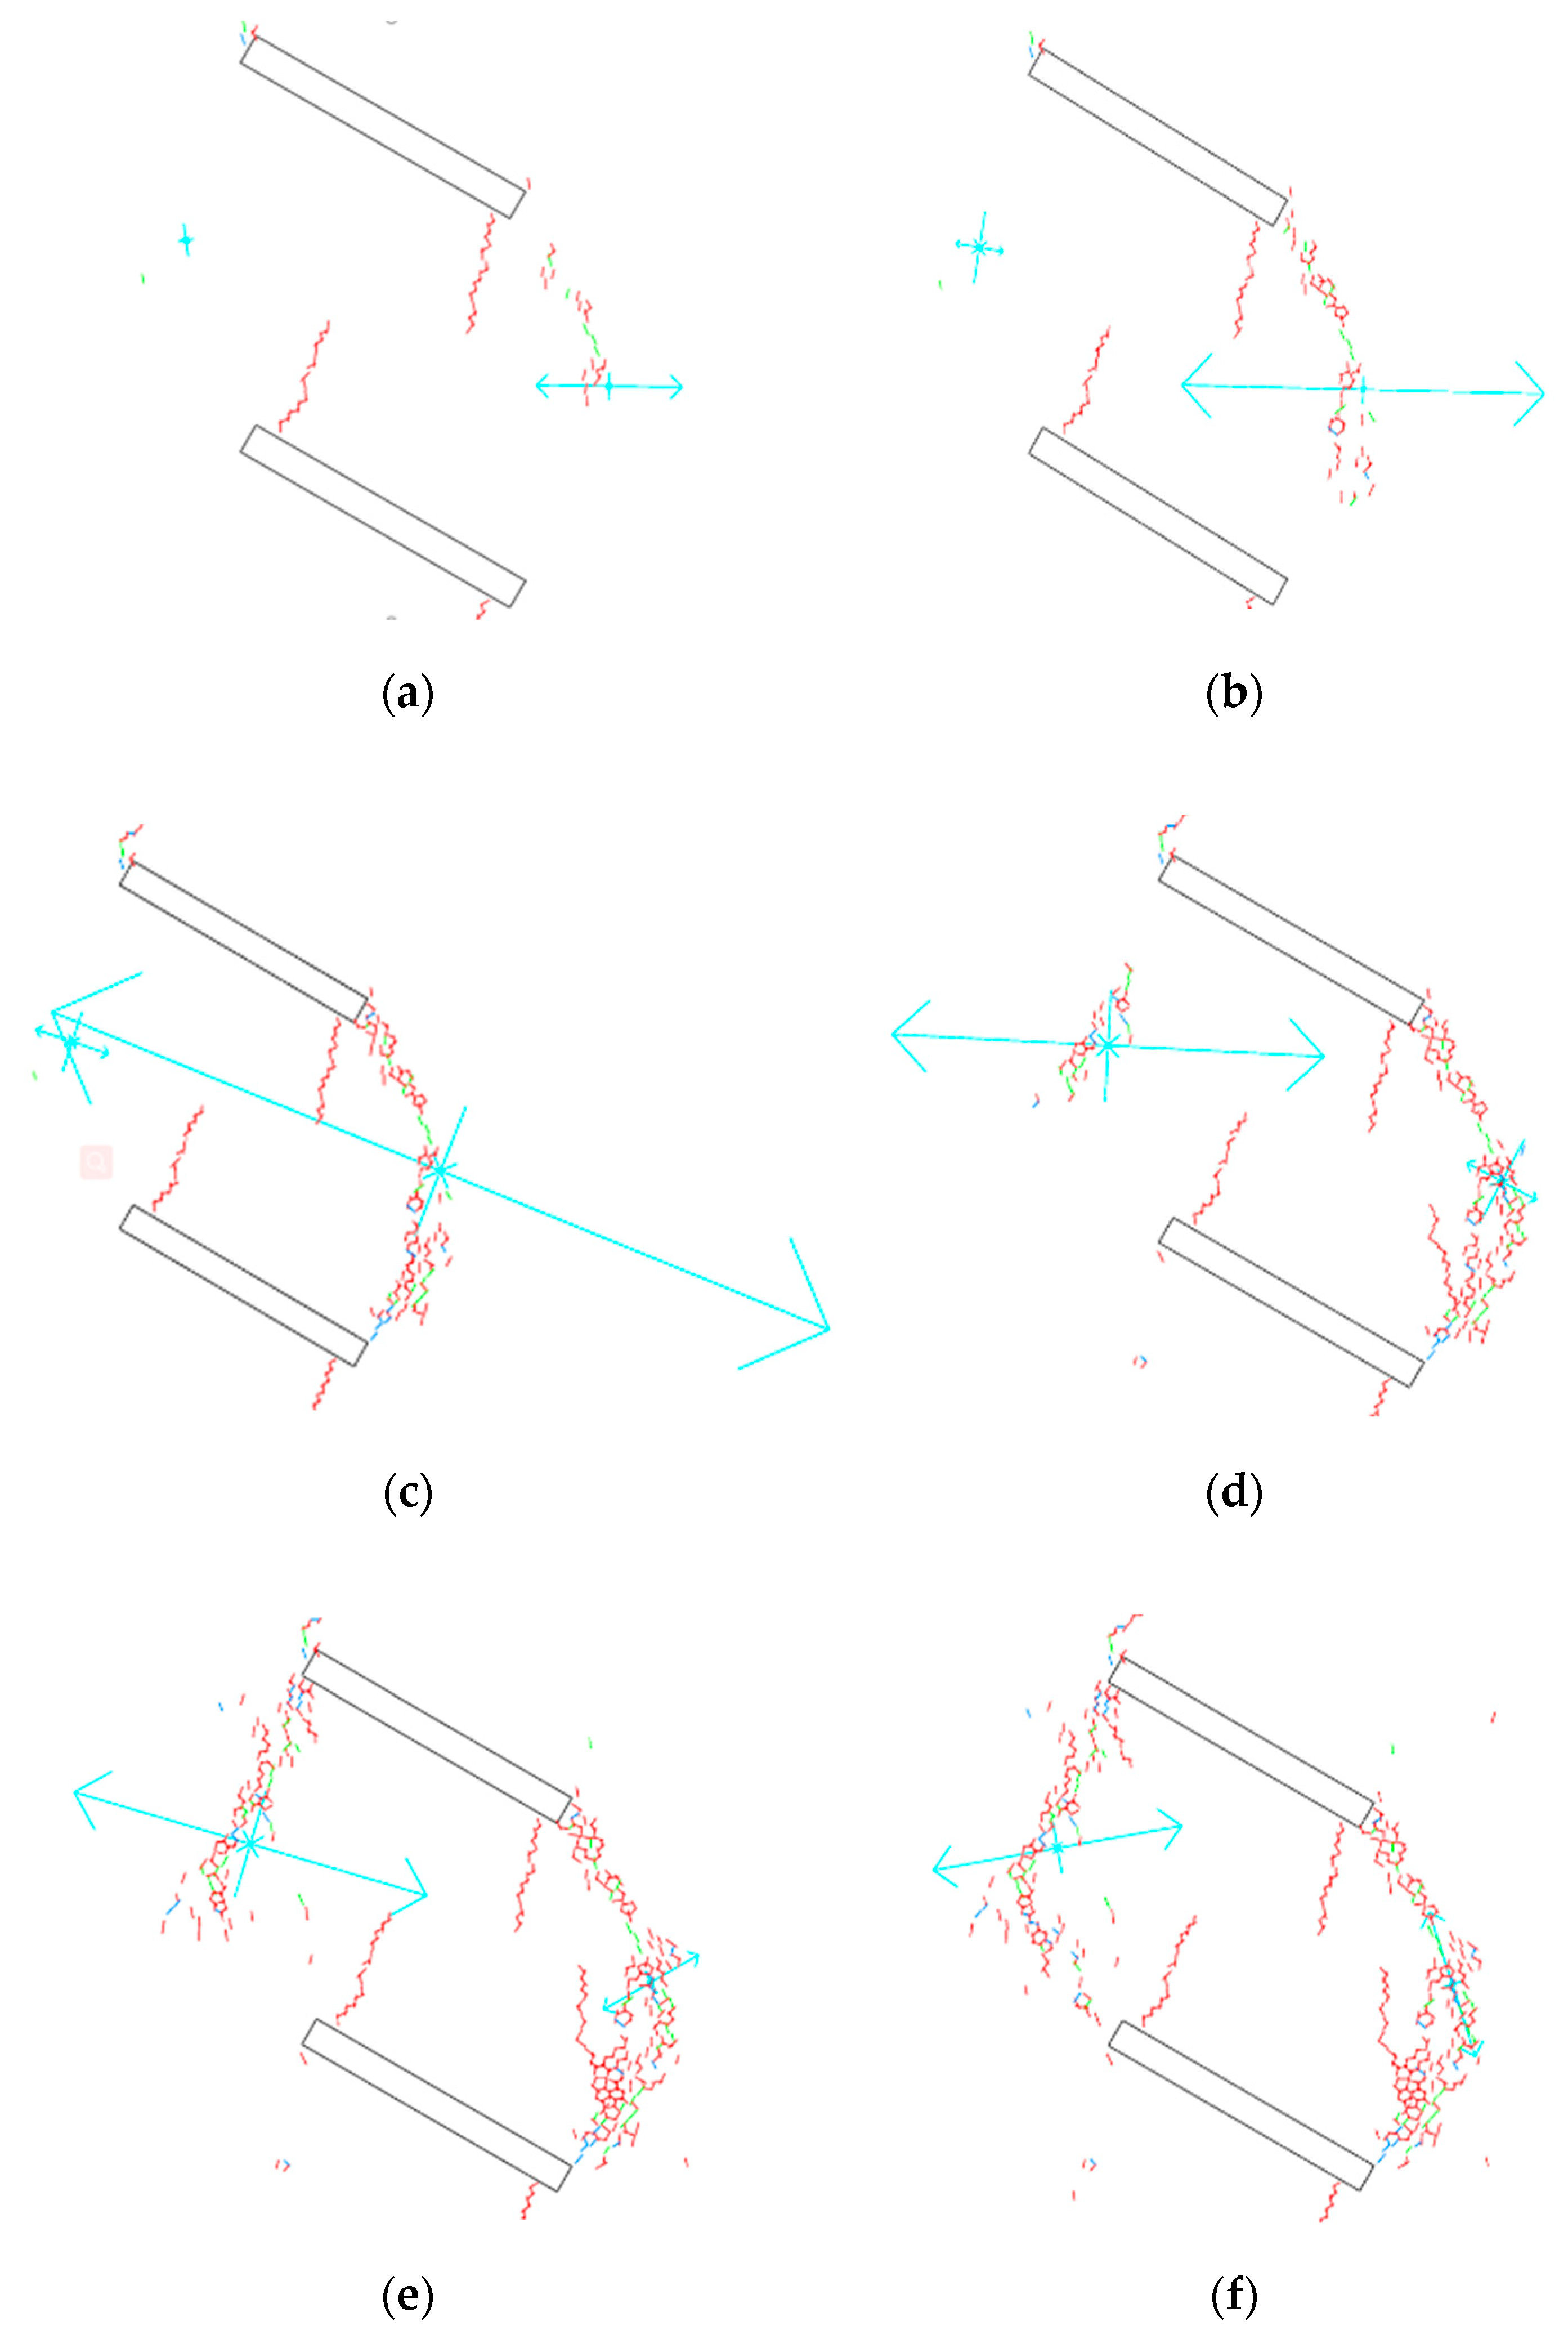
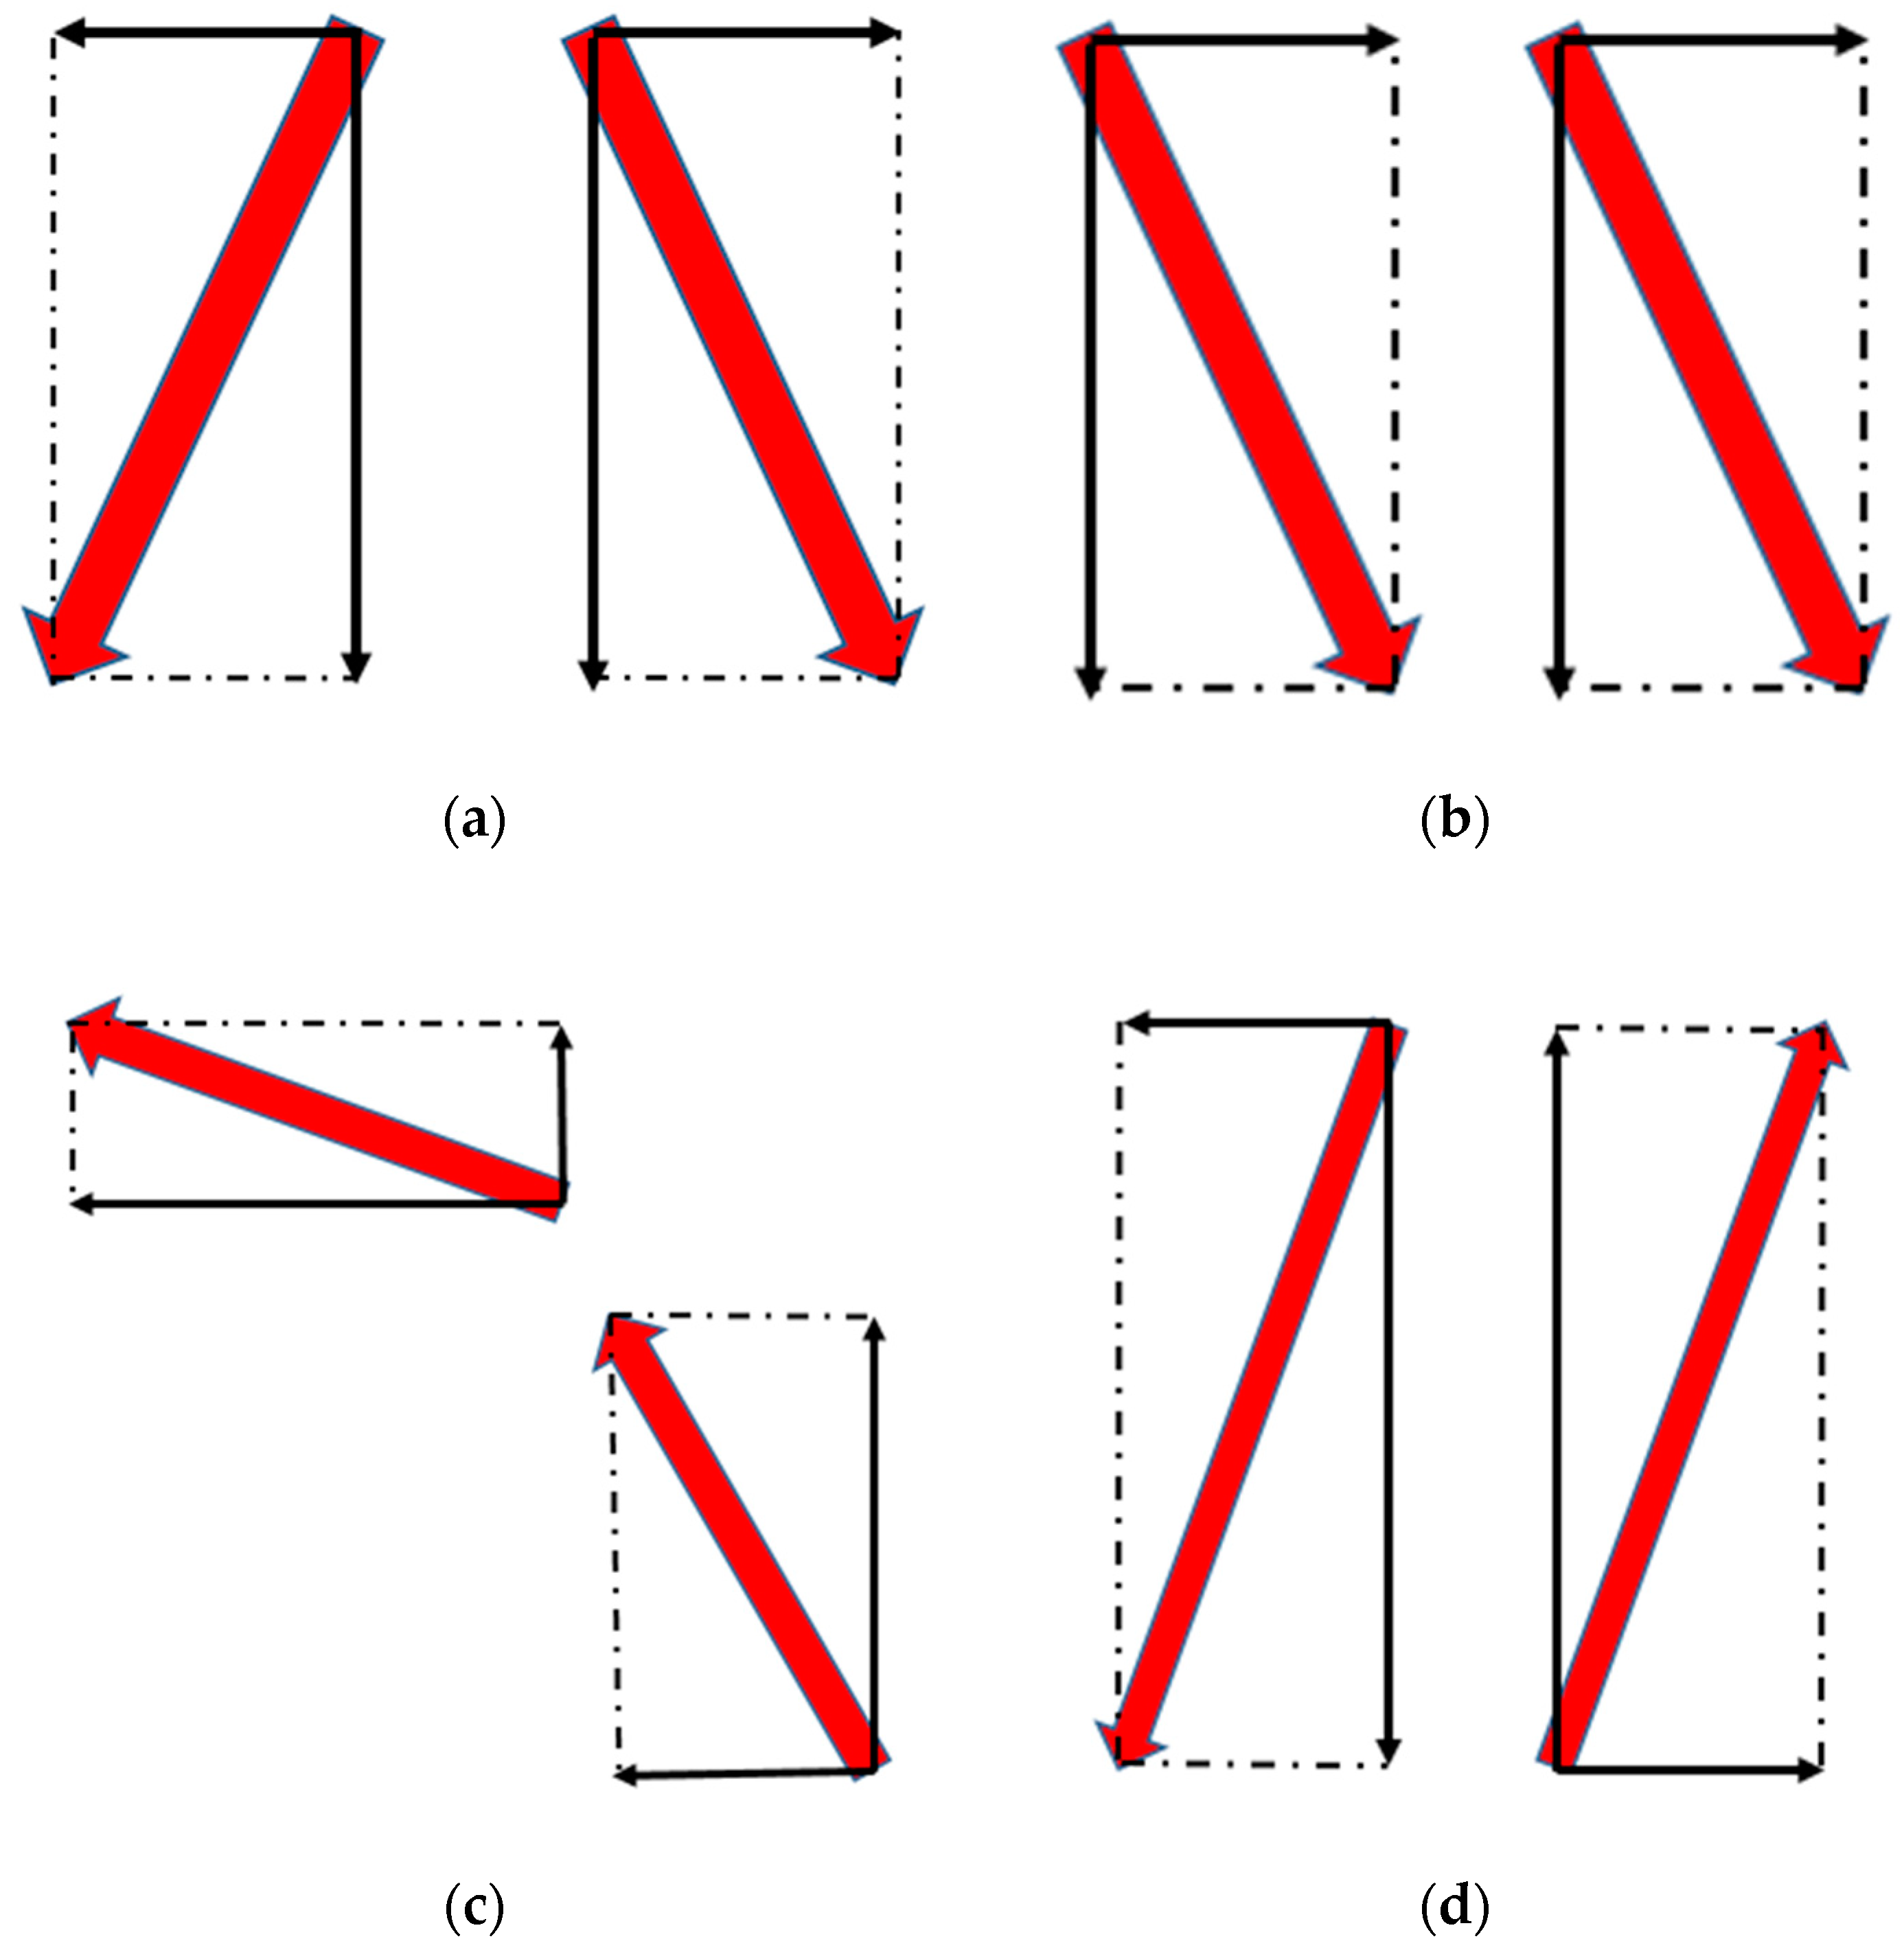
The typical characteristics of Type I are described as follows. The directions of horizontal component of particle velocity on both sides of the crack are opposite, the vertical component is in the same direction and the vertical component of the velocity is almost no different or zero. It can be obviously seen that the relative motion tendency of the particle is mainly controlled by the horizontal velocity component.
(2)
For Type II, the directions of particle velocity on both sides of the crack are almost the same, and the values have no difference. In this case, the motion trend between the particles has certain inhibitory effects on the crack initiation and propagation.
(3)
For Type III, the horizontal and vertical components of the particle velocity on both sides of the crack are the same, but the values are different.
(4)
For Type IV, the directions of particle velocity on both sides of the crack are opposite.
For the convenience, the case of the dip angle of 30° is taken as an example to intensively study the evolution law of secondary crack propagation between parallel pre-existing double flaws. Since secondary cracks are characterized by a large quantity and instant with complicated initiation and coalescence mechanism, which include various kinds of micro-cracks, such as tensile micro-cracks, tensile-shear micro-cracks, and compressive-shear micro-cracks. For a better understanding of this phenomenon, different loading stages (a, b, c, d, e, and f) are selected for the main strain rate tensor analysis, as shown in Figure 6, and the axial stresses corresponding to each loading stage are 35.12, 36.96, 37.24, 43.40, 43.51, and 45.61 MPa, respectively.
The velocity fields and the strain rate tensors in the measurement circle at the different loading stages are shown in Figure 7 and Figure 8. The velocity of the particles in Figure 7 is denoted by the black line with arrows and the thick black arrow represents the relative motion of the particles near the crack. The main strain rate tensor in Figure 8 is denoted by two sets of light green lines with arrows, with the direction and length of the arrows indicating the direction and relative size of the main strain rate, respectively. Table 4 shows the values of variable R in the measurement circle at different loading stages. The corresponding R values in the measurement circle ① and ② are recorded as R 1 and R 2 , and the short dash line in Table 4 represents no secondary cracks at different loading stages.
When the secondary cracks between parallel pre-existing flaws instantaneously appear in large quantities, the values of the variable R can directly discriminate the types of newly generated cracks. ‘Shear’ is considered to occur for R varying between −30 and 30. ‘Tensile’ is considered to occur for an event with an R larger than 30. ‘Compressive-shear’ is considered to occur for an event with R smaller than −30. Therefore, the failure mechanisms of events can be exactly determined according to the values of variable R. Here, it should be noted that the time step adopted by PFC is not infinitely small. Even in the region where no crack initiates, the value of the strain rate tensor still exists, leading to the existence of the value of the variable R without no crack initiating. Consequently, we only need to pay more attentions to the strain rate tensor and the value of variable R at the time of secondary crack initiation.
For better analyzing crack propagation, the secondary cracks in the measurement circle ① and ② are named as SC-1 and SC-2 respectively. It can be seen from the analysis of Figure 7 and Figure 8 that when the axial stress is increased to 35.12 MPa, SC-1 initiates near the tip T2 of the flaw, and the velocity fields of the upper and lower half of the newly generated cracks are Types III and I, which represent composite tensile-shear crack and tensile crack, respectively. At this time, the direction of the maximum principal strain rate is close to the horizontal direction. The ratio ( R 1 = 22.52) indicates that the newly generated cracks are shear cracks in essence, where the relative motion of the particles are consistent with the direction of the maximum principal strain rate. As the axial stress is continuously increased to 36.96 MPa, one end of SC-1 extends to the tip T2 of the flaw, and the other end extends toward the tip T4 of the flaw. The velocity field on both sides of the newly generated cracks is Type I, and the value of R 1 is 37.77, indicating that the newly generated cracks are essentially tensile cracks. When the axial stress is increased to 37.24 MPa, SC-1 continues to extend to the crack tip T4, which finally generates an obvious crack zone to connect the flaw tip T2 with T4. Here the particle velocity field on both sides of the newly generated cracks near the flaw tip T4 are Type IV. Since relative shearing trend appears between the particles, the particle velocity field on both sides of the newly generated cracks near the flaw tip T2 are Type I. However, the variable ( R 1 = 45.61) indicates that the newly generated crack are essentially tensile cracks.
As the strain increases and the axial stress is slowly increased up to 43.40 MPa, SC-2 suddenly initiates between the crack tip T1 and T3. The particle velocity fields on both sides of the upper and lower part of the newly generated cracks are Types I and IV, which represents that the corresponding newly generated cracks are tensile and shear crack, respectively. Here, the variable ( R 2 = 27.53) indicates that that the newly generated cracks are shear cracks. As the axial stress is slightly increased up to 43.61 MPa, one end of SC-2 extends to the tip T1 of the flaw, and the other end extends toward the tip T3 of the flaw. The velocity fields on both sides of the newly initiated cracks are Type III and the variable ( R 2 = 41.69) indicates that the newly generated cracks are tensile cracks. When the axial stress is increased up to 43.61 MPa, the axial stress approaches to the peak strength at this time and SC-2 continues to extend to the crack tip T3. Eventually an obvious crack zone is generated between the flaw tip T1 and T3. Since the relative shearing tendency appears between the particles, the particle velocity fields on both sides of the newly generated cracks near the crack tip T3 are Type IV, while those near the flaw tip T2 are mixed Types I and II. The variable ( R 2 = 23.02) indicates that the newly generated cracks are shear cracks. Meanwhile, SC-1 continues to propagate, and eventually the particle velocity fields on both sides of the new crack turn into Type II. The variable ( R 2 = −45.60) indicates that the newly generated cracks that continue to propagate on a basis of SC-1 are essentially composite compressive-shear cracks.

3.2. Analysis and Discussions

It can be seen from the above simulation results that SC-1 and SC-2 appear as shear cracks between pre-existing parallel flaws at the beginning stage of secondary crack initiation. However, from the velocity fields analysis of the particles, the upper part of the SC-1 are composite tensile-shear cracks and the lower part are tensile cracks; the upper part of the SC-2 are tensile cracks, and the lower part are shear cracks. In addition, the newly generated cracks contain tensile micro-cracks and tensile-shear micro-cracks, in which the number of tensile micro-cracks is dominant. As the axial stress is increased, SC-1 continues to extend to the tip of T4, and the newly generated cracks are tensile cracks. When SC-2 continues to extend to the tip of T3, the newly generated cracks are shear cracks. However, based on the velocity field analysis, it can be seen that the newly generated cracks near the flaws T3 and T4 tips are shear cracks, indicating that the types of macro-cracks are not totally determined by the types of partial cracks. Meanwhile, the type of macro-crack does not depend on the dominant type of micro-cracks. Since the tensile strength of the particles is much smaller than the shear strength, when the tensile micro-cracks initiate, a shear band is gradually formed under the action of the shearing force. Similarly, after the particles suffer the shear failure in the compressive zone, the stress concentration effect promotes the initiation of tensile cracks. Therefore, it can be concluded that macro tensile cracks and shear cracks partially contain shear cracks and tensile cracks respectively. SC-1 and SC-2 appear as shear cracks between pre-existing parallel flaws at the beginning stage of secondary crack initiation, and then extend up and down toward the tip of the flaw, and finally T2 and T4, as well as T1 and T3, are connected in the form of arcs. The particles between the pre-existing flaws form a confined compressive member under uniaxial compression. The type of particle velocity on both sides of the secondary crack between the fractures is most complicated, so the velocity field types of the particles are distinctive at different stress loading stages. For example, the velocity fields of the particles near the crack on the T4 tip of the flaw evolve from the initial Type IV into Type III, and finally remain in Type II. Thereafter, the cracks will not propagate any more, indicating that the type of newly generated cracks near the flaw T4 gradually evolves from shear cracks into composite tensile-shear cracks. Finally, because the velocity fields of the particles on both sides of the crack are Type II, the velocity direction and value of the particles are not much different, which can suppress the crack propagation to some extent.

4. Conclusions

In this study, the analysis of strain rate tensors and particle velocity fields are utilized to distinguish crack types and study the mechanical behaviors in the region between pre-existing flaws under uniaxial compression. The following conclusions have been drawn.
(1)
By defining a variable R to quantify the crack failure mechanism, the types and mechanical behaviors of the secondary cracks between the flaws can be effectively distinguished. The initiation mechanism of secondary cracks between flaws is most complicated, and the types and mechanical behaviors of newly generated cracks are distinctive in different stress loading stages. According to the value of variable R, we can directly understand the types mechanical behaviors of secondary cracks.
(2)
According to the velocity and relative motion trend of the particles on both sides of the crack, the velocity field of the particles can be obviously divided into four types. The type of particle velocity field on both sides of the newly generated cracks determines the type of crack in the measurement region. At different stress loading stages, the velocity field types of the particles on both sides of the crack are constantly evolving and complicated.
(3)
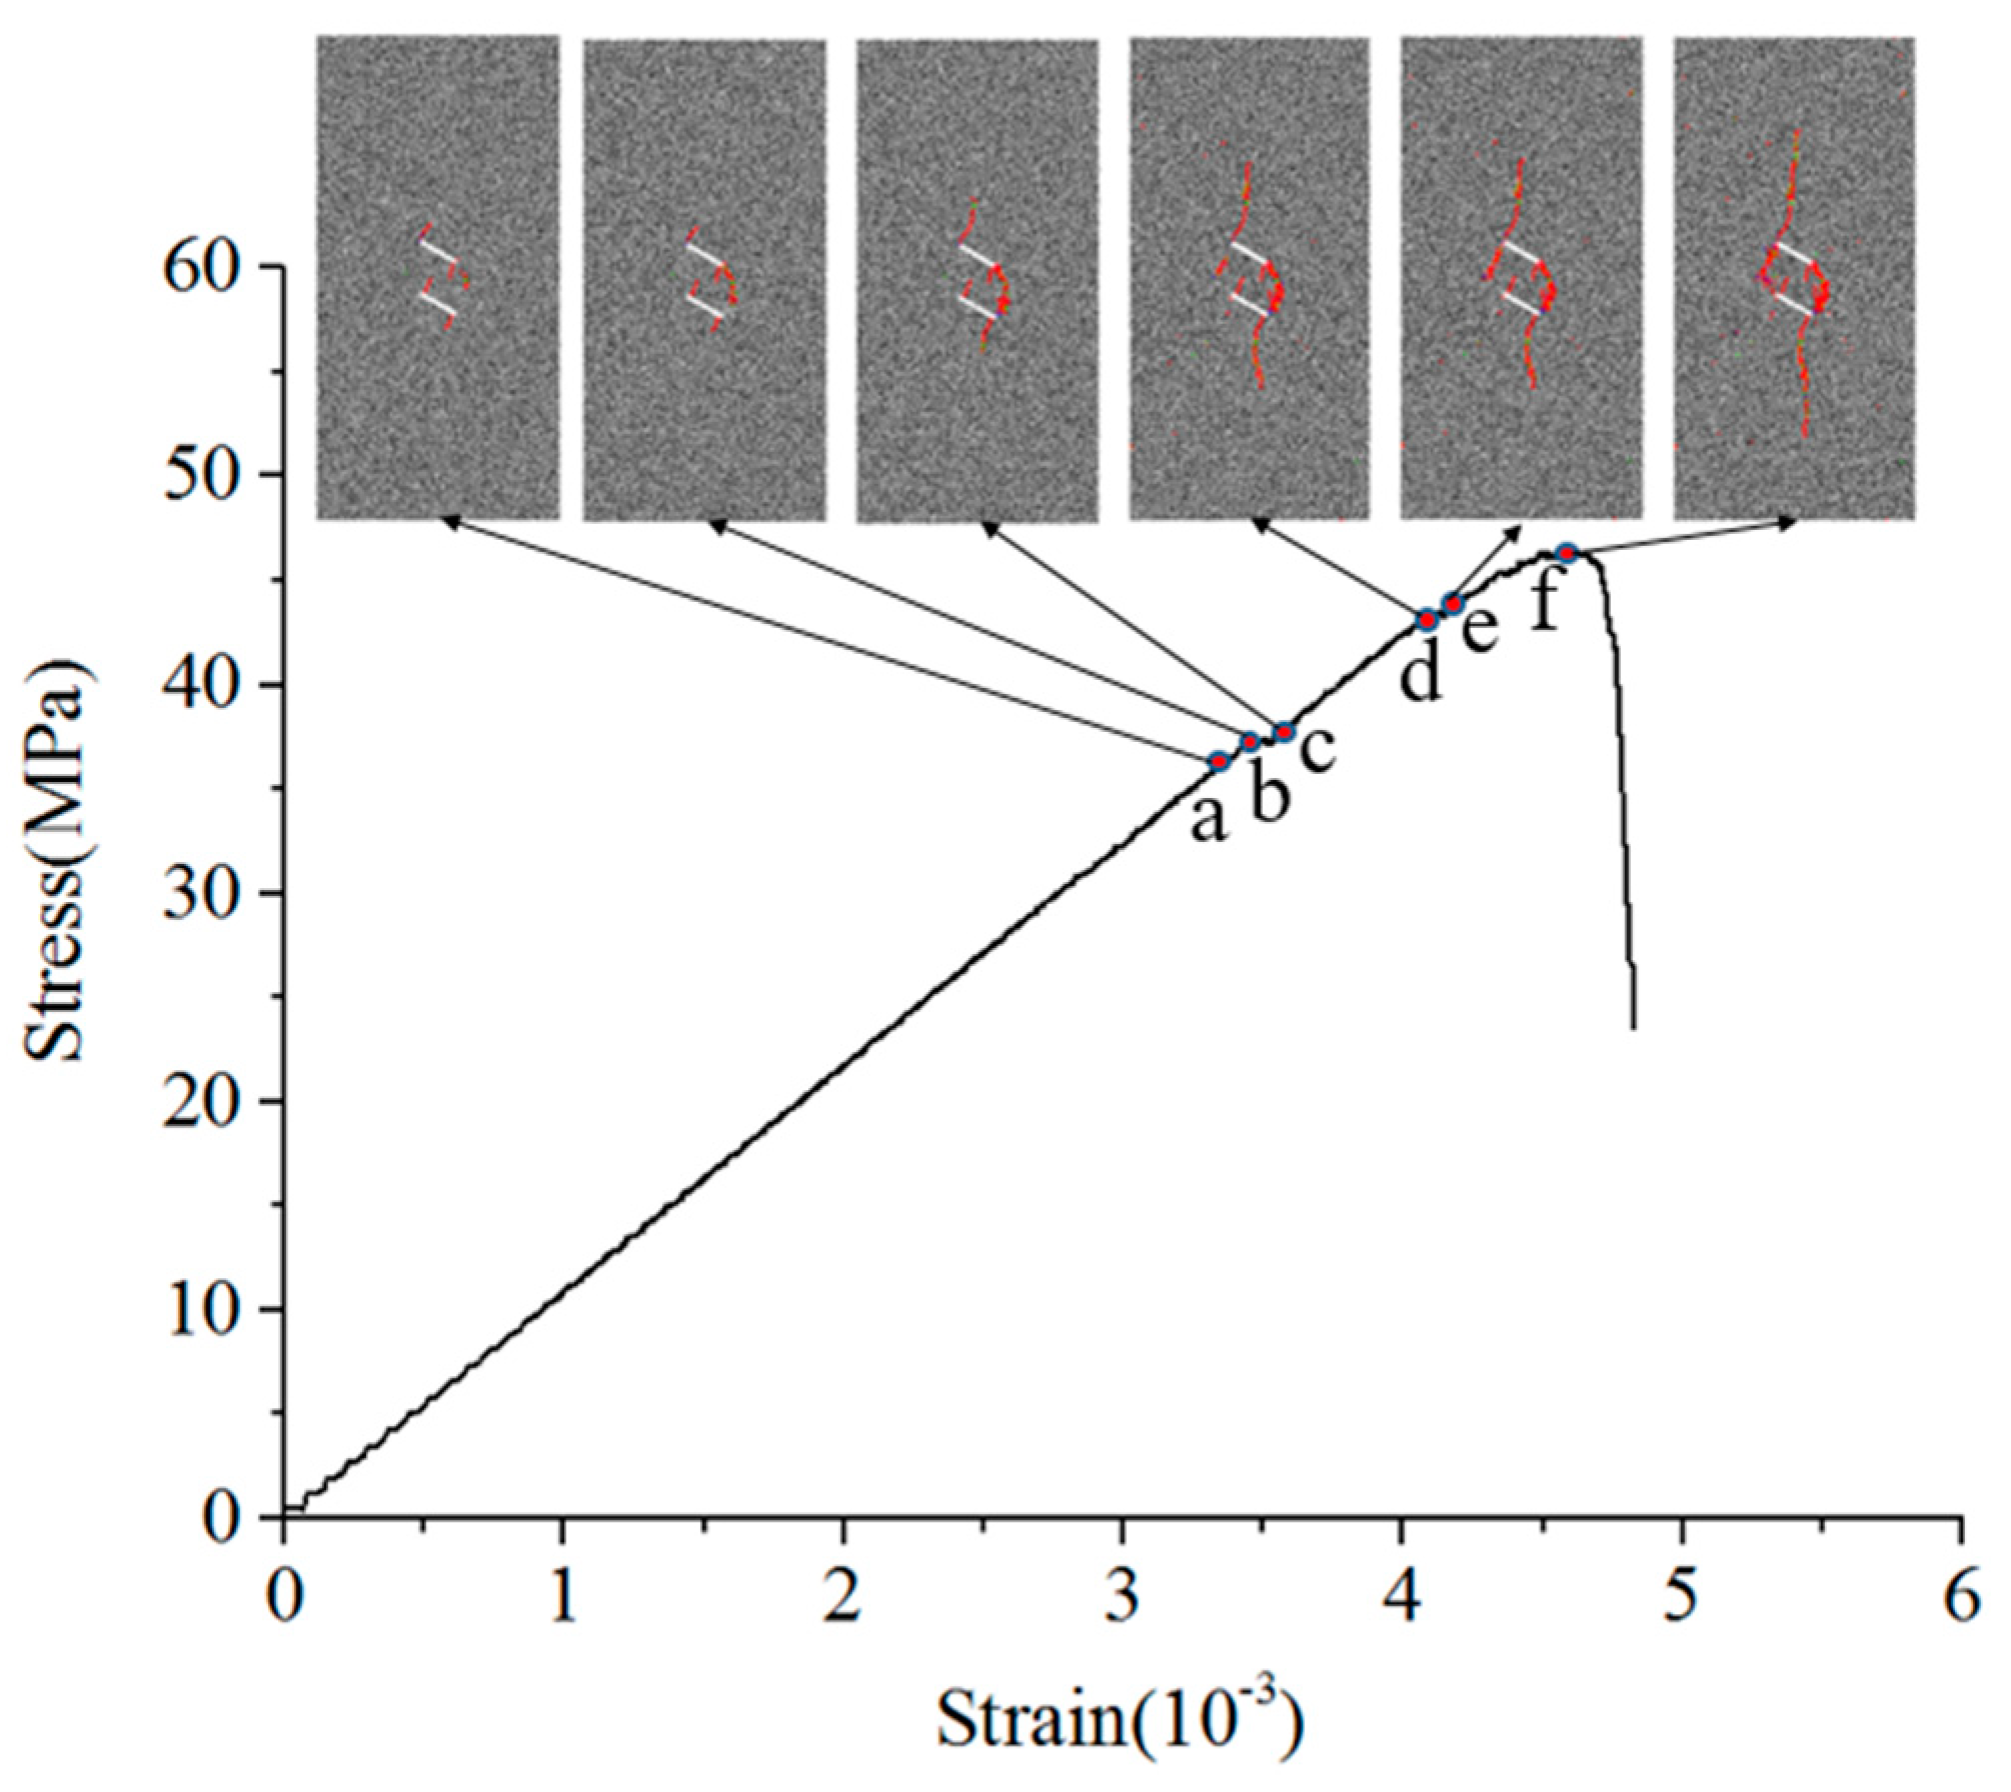
Combined with the particle velocity field analysis and the value of the variable R, it can be seen that the macro tensile crack contains partial shear cracks, and the macro shear crack contains partial tensile cracks, indicating that the type of macro crack is not totally determined by the type of partial cracks. The secondary cracks contain tensile micro-cracks, shear micro-cracks, and compressive-shear micro-cracks, and the number of tensile micro-cracks is the largest. However, when the axial stress is reached to 35.12 MPa, the ratio ( R 1 = 22.52) indicates that the newly generated cracks are shear cracks in essence. Therefore, we can see that the type of macro-crack does not depend on the dominant type of micro-cracks.
(4)
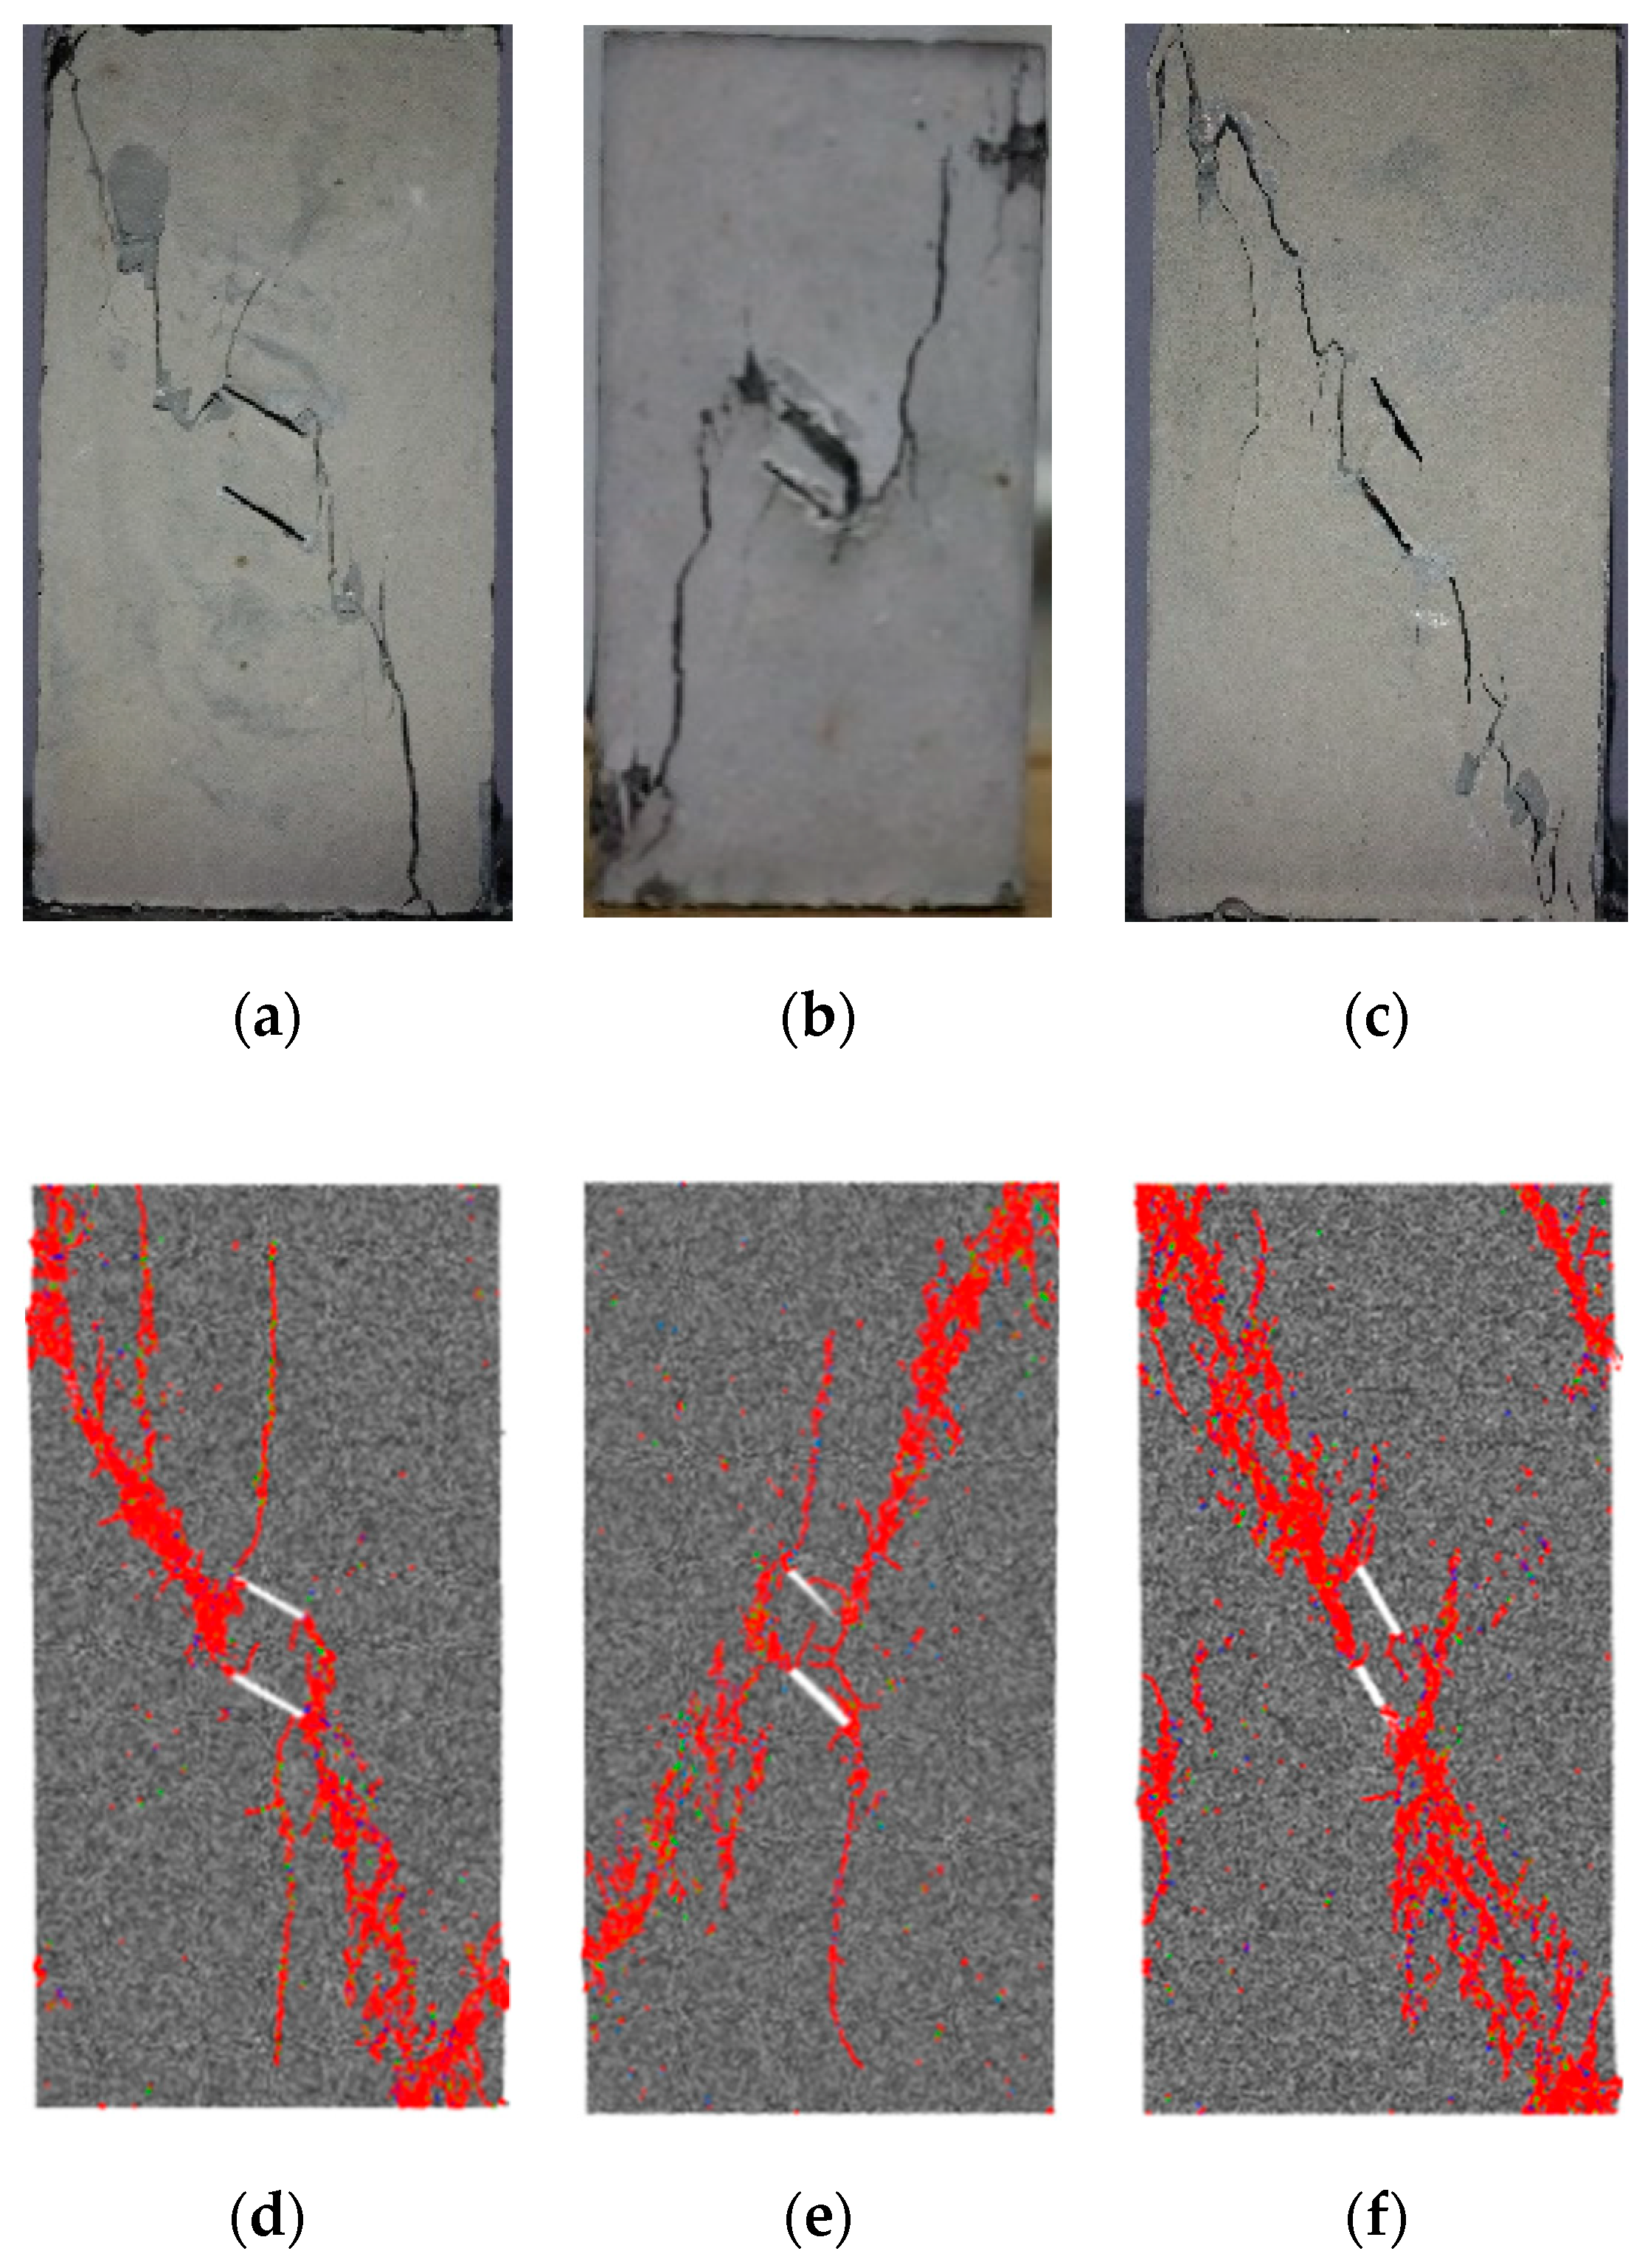
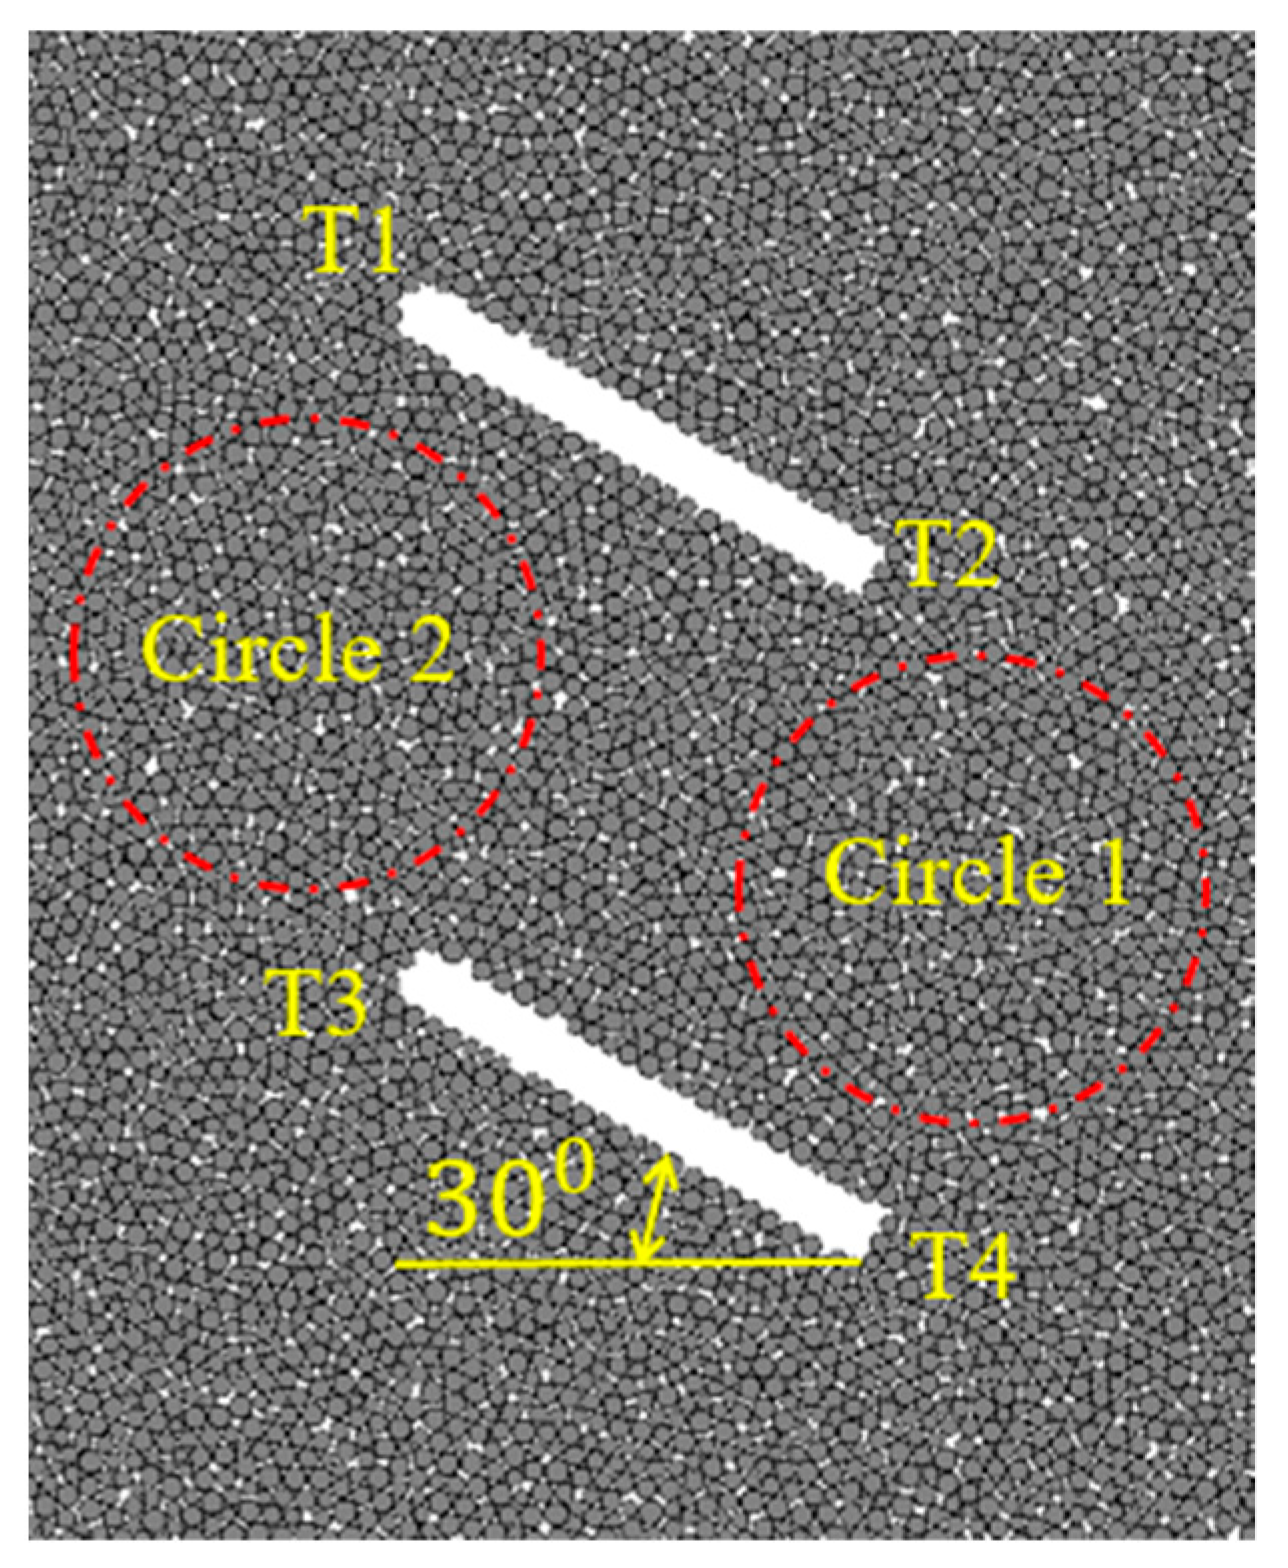
At the beginning stage of secondary crack initiation, SC-1 and SC-2 appear as shear cracks between pre-existing parallel flaws, then extend up and down toward the tip of the flaws, and finally connect the tips of T2 and T4, as well as T1 and T3, in the form of arcs. The particles between pre-existing parallel flaws form a confined compressive member under uniaxial compression. Under the confinement of lateral particles, the contacts between particles are broken owing to the combined compressive and shear actions, and eventually the shear cracks are successively formed.

Author Contributions

Conceptualization, Y.L. and X.L.; Methodology, W.C.; Software, W.C.; Validation, Y.L. and Q.Z.; Formal analysis; Writing—review and editing, W.Z. and Y.L.; Supervision, S.W. and W.C.

Funding

This research was funded by National Natural Science Foundation of China (Grant Nos. 51879149, 51779134 and 51579142), Taishan Scholars Project of Shandong Province and Open Research Fund Program of State Key Laboratory of Water Resources and Hydropower Engineering Science (Grant No. 2018SGG01).

Acknowledgments

The authors would like to thank the anonymous reviewers for their constructive suggestions to improve the quality of the paper.

Conflicts of Interest

The authors declare no conflict of interest.

References

  1. Zhu, W.; Li, Y.; Li, S.; Wang, S.; Zhang, Q. Quasi-three-dimensional physical model tests on a cavern complex under high in-situ stresses. Int. J. Rock Mech. Min. 2011, 48, 199–209. [Google Scholar]
  2. Li, Y.; Zhu, W.; Fu, J.; Guo, Y.; Qi, Y. A damage rheology model applied to analysis of splitting failure in underground caverns of Jinping I hydropower station. Int. J. Rock Mech. Min. 2014, 71, 224–234. [Google Scholar] [CrossRef]
  3. Li, Y.; Zhou, H.; Zhang, L.; Zhu, W.; Li, S.; Liu, J. Experimental and numerical investigations on mechanical property and reinforcement effect of bolted jointed rock mass. Constr. Build. Mater. 2016, 126, 843–856. [Google Scholar] [CrossRef]
  4. Li, Y.; Li, C.; Zhang, L.; Zhu, W.; Li, S.; Liu, J. An experimental investigation on mechanical property and anchorage effect of bolted jointed rock mass. Geosci. J. 2017, 21, 253–265. [Google Scholar]
  5. Li, Y.; Zhou, H.; Dong, Z.; Zhu, W.; Li, S.; Wang, S. Numerical investigations on stability evaluation of a jointed rock slope during excavation using an optimized DDARF method. Geomech. Eng. 2018, 14, 271–281. [Google Scholar]
  6. Zhou, X.; Wang, Y.; Zhang, J.; Liu, F. Fracturing behavior study of Three-Flawed specimens by uniaxial compression and 3D digital image correlation: Sensitivity to brittleness. Rock Mech. Rock Eng. 2019, 52, 691–718. [Google Scholar] [CrossRef]
  7. Ma, G.W.; Dong, Q.Q.; Fan, L.F.; Gao, J.W. An investigation of non-straight fissures cracking under uniaxial compression. Eng. Fract. Mech. 2018, 191, 300–310. [Google Scholar] [CrossRef]
  8. Tang, C.A.; Kou, S.Q. Crack propagation and coalescence in brittle materials under compression. Eng. Fract. Mech. 1998, 61, 311–324. [Google Scholar] [CrossRef]
  9. Park, C.H.; Bobet, A. Crack initiation, propagation and coalescence from frictional flaws in uniaxial compression. Eng. Fract. Mech. 2010, 77, 2727–2748. [Google Scholar] [CrossRef]
  10. Yang, S.Q.; Huang, Y.H.; Tian, W.L.; Zhu, J.B. Erratum to: An experimental investigation on strength, deformation and crack evolution behavior of sandstone containing two oval flaws under uniaxial compression. Eng. Geol. 2017, 217, 35–48. [Google Scholar] [CrossRef]
  11. Yang, S.Q.; Ranjith, P.G.; Jing, H.W.; Tian, W.L.; Ju, Y. An experimental investigation on thermal damage and failure mechanical behavior of granite after exposure to different high temperature treatments. Geothermics 2017, 65, 180–197. [Google Scholar] [CrossRef]
  12. Zhou, X.P.; Bi, J.; Qian, Q.H. Numerical simulation of crack growth and coalescence in Rock-Like materials containing multiple pre-existing flaws. Rock Mech. Rock Eng. 2015, 48, 1097–1114. [Google Scholar] [CrossRef]
  13. Chen, W.; Li, S.; Zhu, W.; Qiu, X. Experimental and numerical research on crack propagation in rock under compression. Chin. J. Rock Mech. Eng. 2003, 22, 18–23. [Google Scholar]
  14. Wu, Z.; Wong, L.N.Y. Frictional crack initiation and propagation analysis using the numerical manifold method. Comput. Geotech. 2012, 39, 38–53. [Google Scholar] [CrossRef]
  15. Bobet, A. The initiation of secondary cracks in compression. Eng. Fract. Mech. 2000, 66, 187–219. [Google Scholar] [CrossRef]
  16. Cao, P.; Liu, T.; Pu, C.; Lin, H. Crack propagation and coalescence of brittle rock-like specimens with pre-existing cracks in compression. Eng. Geol. 2015, 187, 113–121. [Google Scholar] [CrossRef]
  17. Shen, B.; Stephansson, O.; Einstein, H.H.; Ghahreman, B. Coalescence of fractures under shear stress experiment. J. Geophys. Res. 1995, 100, 5975–5990. [Google Scholar] [CrossRef]
  18. Wong, R.H.C.; Chau, K.T. Crack coalescence in a rock-like material containing two cracks. Int. J. Rock Mech. Min. 1998, 35, 147–164. [Google Scholar] [CrossRef]
  19. Cheng, H.; Zhou, X.; Zhu, J.; Qian, Q. The effects of crack openings on crack initiation, propagation and coalescence behavior in Rock-Like materials under uniaxial compression. Rock Mech. Rock Eng. 2016, 49, 3481–3494. [Google Scholar] [CrossRef]
  20. Bobet, A.; Einstein, H.H. Fracture coalescence in rock-type materials under uniaxial and biaxial compression. Int. J. Rock Mech. Min. 1998, 35, 863–888. [Google Scholar] [CrossRef]
  21. Wong, L.N.Y.; Einstein, H.H. Crack coalescence in molded gypsum and carrara marble: Part 1. Macroscopic observations and interpretation. Rock Mech. Rock Eng. 2009, 42, 475–511. [Google Scholar] [CrossRef]
  22. Wong, L.N.Y.; Einstein, H.H. Crack coalescence in molded gypsum and carrara marble: Part 2-Microscopic observations and interpretation. Rock Mech. Rock Eng. 2009, 42, 513–545. [Google Scholar] [CrossRef]
  23. Wong, L.N.Y.; Einstein, H.H. Systematic evaluation of cracking behavior in specimens containing single flaws under uniaxial compression. Int. J. Rock Mech. Min. 2009, 46, 239–249. [Google Scholar] [CrossRef]
  24. Cundall, P.A.; Strack, O. Discrete numerical-model for granular assemblies. Geotechnique 1979, 29, 47–65. [Google Scholar] [CrossRef]
  25. Liu, J.; Wang, J.; Wan, W. Numerical study of crack propagation in an indented rock specimen. Comput. Geotech. 2018, 96, 1–11. [Google Scholar] [CrossRef]
  26. Cao, R.H.; Cao, P.; Lin, H.; Ma, G.W.; Zhang, C.Y.; Jiang, C. Failure characteristics of jointed rock-like material containing multi-joints under a compressive-shear test: Experimental and numerical analyses. Arch. Civ. Mech. Eng. 2018, 18, 784–798. [Google Scholar] [CrossRef]
  27. Park, B.; Min, K.; Thompson, N.; Horsrud, P. Three-dimensional bonded-particle discrete element modeling of mechanical behavior of transversely isotropic rock. Int. J. Rock Mech. Min. 2018, 110, 120–132. [Google Scholar] [CrossRef]
  28. Cao, R.H.; Cao, P.; Lin, H.; Ma, G.W.; Fan, X.; Xiong, X.G. Mechanical behavior of an opening in a jointed rock-like specimen under uniaxial loading: Experimental studies and particle mechanics approach. Arch. Civ. Mech. Eng. 2018, 18, 198–214. [Google Scholar] [CrossRef]
  29. Cao, R.; Lin, H.; Cao, P. Strength and failure characteristics of brittle jointed rock-like specimens under uniaxial compression: Digital speckle technology and a particle mechanics approach. Int. J. Min. Sci. Technol. 2018, 28, 669–677. [Google Scholar] [CrossRef]
  30. Hazzard, J.F.; Young, R.P. Moment tensors and micromechanical models. Tectonophysics 2002, 356, 181–197. [Google Scholar] [CrossRef]
  31. Zhang, X.; Zhang, Q. Distinction of crack nature in brittle Rock-Like materials: A numerical study based on moment tensors. Rock Mech. Rock Eng. 2017, 50, 2837–2845. [Google Scholar] [CrossRef]
  32. Boyd, O.S.; Dreger, D.S.; Gritto, R.; Garcia, J. Analysis of seismic moment tensors and in situ stress during Enhanced Geothermal System development at the Geysers geothermal field, California. Geophys. J. Int. 2018, 215, 1483–1500. [Google Scholar] [CrossRef]
  33. Stroujkova, A. Relative moment tensor inversion with application to shallow underground explosions and earthquakes. Bull. Seismol. Soc. Am. 2018, 108, 2724–2738. [Google Scholar] [CrossRef]
  34. Ge, W.; Wang, M.; Shen, Z.; Yuan, D.; Zheng, W. Intersiesmic kinematics and defromation patterns on the upper crust of Qaidam-Qilianshan block. Chin. J. Geophys. Chin. 2013, 56, 2994–3010. [Google Scholar]
  35. Kostrov, B.V.; Das, S. Structural Earthquake Source Mechanics; Science Press: Beijing, China, 1994. [Google Scholar]
  36. Itasca Consulting Group Inc. Users’ Manual for Particle Flow Code (PFC); Version 5.0; Itasca Consulting Group Inc.: Minneapolis, MN, USA, 2014. [Google Scholar]
  37. Lisjak, A.; Grasselli, G. A review of discrete modeling techniques for fracturing processes in discontinuous rock masses. J. Rock Mech. Geotec. Eng. 2014, 6, 301–314. [Google Scholar] [CrossRef] [Green Version]
  38. Zhang, X.; Wong, L.N.Y. Loading rate effects on cracking behavior of flaw-contained specimens under uniaxial compression. Int. J. Fracture 2013, 180, 93–110. [Google Scholar] [CrossRef]
  39. Yoon, J. Application of experimental design and optimization to PFC model calibration in uniaxial compression simulation. Int. J. Rock Mech. Min. 2007, 44, 871–889. [Google Scholar] [CrossRef]
  40. Cho, N.; Martin, C.D.; Sego, D.C. A clumped particle model for rock. Int. J. Rock Mech. Min. 2007, 44, 997–1010. [Google Scholar] [CrossRef]
  41. Ghazvinian, A.; Sarfarazi, V.; Schubert, W.; Blumel, M. A study of the failure mechanism of planar Non-Persistent open joints using PFC2D. Rock Mech. Rock Eng. 2012, 45, 677–693. [Google Scholar] [CrossRef]
  42. Baker, C.; Young, R.P. Evidence for extensile crack initiation in point source time-dependent moment tensor solutions. Bull. Seismol. Soc. Am. 1997, 87, 1442–1453. [Google Scholar]
  43. Martin, C.D.; Chandler, N.A. The progressive fracture of lac du bonnet granite. Int. J. Rock Mech. Min. Sci. Geomech. Abstr. 1994, 31, 643–659. [Google Scholar] [CrossRef]
  44. Ming, H.J.; Feng, X.T.; Chen, B.R.; Zhang, C.Q. Analysis of rockburst mechanism for deep tunnel based on moment tensor. Rock Soil Mech. 2013, 34, 163–172. [Google Scholar]
  45. Feignier, B.; Young, R.P. Moment tensor inversion of induced microseisnmic events: Evidence of non-shear failures in the −4 < m < −2 moment magnitude range. Geophys. Res. Lett. 1992, 19, 1503–1506. [Google Scholar]
Figure 1. Numerical model for pre-existing parallel flaws layout ( α = 30°, Unit: mm).
Applsci 09 01749 g001
Figure 2. Comparison of failure modes between laboratory experiment and numerical simulation. (a) α = 30°; (b) α = 45°; (c) α = 60°; (d) α = 30°; (e) α = 45°; (f) α = 60°. (Pictures a, b and c are experimental results, and pictures d, e and f are numerical results).
Applsci 09 01749 g002
Figure 3. Schematic diagram of the principal strain rate tensor. (The red, green and blue micro-cracks represent tensile micro-cracks, tensile-shear micro-cracks, and compressive-shear micro-cracks, respectively, and the principal strain tensor is denoted by two sets of light blue lines with arrows).
Applsci 09 01749 g003
Figure 4. Layout of measuring circles 1 and 2. (T1, T2, T3 and T4 denote the four crack tips.).
Applsci 09 01749 g004
Figure 5. Schematic diagram of velocity fields for different types of particles. (a) Type I; (b) Type II; (c) Type III; (d) Type IV.
Applsci 09 01749 g005
Figure 6. The stress-strain curve of a specimen under uniaxial compression. (Here, the dip angle of the flaws is α = 30°. The points a, b, c, d, e and f correspond to different loading stages respectively.).
Applsci 09 01749 g006
Figure 7. Particle velocity fields at different loading stages. (Pictures a, b, c, d, e and f respectively show particle velocity fields corresponding to different loading stages in Figure 6 when secondary cracks propagate.).
Applsci 09 01749 g007
Figure 8. Principal strain rate tensors at different loading stages. (Pictures a, b, c, d, e, and f respectively show principal strain rate tensors in the two measurement circles corresponding to different loading stages in Figure 6 when secondary cracks propagate.).
Applsci 09 01749 g008
Table 1. Physico-mechanical parameters of cement mortar and Sandstone.
MaterialCompressive Strength σ c (MPa)Tensile Strength σ t (MPa)Young’s Modulus E (GPa)Poisson’s Ratio ν Density ρ (g/cm3)
Cement mortar58.255.6211.630.202.38
Sandstone20~1704~253~350.02~0.252.10~2.40
Table 2. Physico-mechanical parameters of intact cement mortar specimens for laboratory tests and numerical simulations.
PropertiesSpecimens for Laboratory TestsSpecimens for Numerical Simulation
Density ρ ( g / c m 3 )2.382.38
Young’s modulus E (GPa)11.6311.95
Poisson’s ratio ν 0.200.21
Uniaxial compressive strength σ c (MPa)58.2557.30
Table 3. Microscopic parameters used in the numerical model.
Particle ParametersValues
Minimum radius R m i n (mm)0.18
Particle radius ratio R m a x / R m i n 1.66
Density ρ ( g / c m 3 )2.38
Friction μ 0.55
Effective modulus E c (GPa)5.5
Normal/shear stiffness ratio k n / k s 2.0
Tensile strength σ c ¯ (MPa)22.5 ± 2.0
Cohesion c ¯ (MPa)19.5 ± 2.0
Angle of internal friction φ ¯ (0)35
Bond effective modulus E c ¯ (GPa)5.5
Bond normal/shear stiffness ratio k n ¯ / k s ¯ 2.0
Table 4. The values of variable R in the two measurement circles at different loading stages.
Loading StagesLoading Stresses (MPa) R 1 R 2
a35.1223.52-
b36.9637.77-
c37.2435.75-
d43.40-27.53
e43.61-41.69
f45.61−45.6023.02

