Triaxial Loading and Unloading Tests on Dry and Saturated Sandstone Specimens


1
School of Resources and Safety Engineering, Central South University, Changsha 410083, China
2
State Key Laboratory of Coal Mine Disaster Dynamics and Control, Chongqing University, Chongqing 400044, China
3
College of Resources and Environmental Science, Chongqing University, Chongqing 400044, China
*
Author to whom correspondence should be addressed.
Appl. Sci. 2019, 9(8), 1689; https://doi.org/10.3390/app9081689
Submission received: 16 February 2019
/
Revised: 26 March 2019
/
Accepted: 10 April 2019
/
Published: 24 April 2019
(This article belongs to the Special Issue Fatigue and Fracture of Non-metallic Materials and Structures)
Abstract
:Featured Application
The specific application or a potential application of the work is related to deep mining and tunneling engineering.
Abstract
The brittle failure of hard rock due to the excavation unloading in deep rock engineering often causes serious problems in mining and tunneling engineering, and the failure process is always affected by groundwater. In order to investigate the effects of stress paths and water conditions on the mechanical properties and failure behavior of rocks, a series of triaxial compression tests were conducted on dry and saturated sandstones under various loading and unloading paths. It was found that when the sandstone rock samples are saturated by water, the cohesion, the internal friction angle and the Young’s modulus will decrease but the Poisson′s ratio will increase. The fracturing characteristics of the sandstone specimens are related to the initial confining pressure, the stress paths and the water conditions from both macroscopic and microscopic viewpoints. The failure of sandstone in unloading test is more severe than that under loading test, particularly for dry sandstone samples. In unloading test, the energy is mainly consumed for the circumferential deformation and converted into kinetic energy for the rock bursts. The sandstone is more prone to produce internal cracks under the effect of water, and the absorbed energy mainly contributes to the damage of rock. It indicates that the possibility of rockburst in saturated rock is lower than the samples in dry condition. It is important to mention that water injection in rock is an effective way to prevent rockburst in deep rock engineering.
1. Introduction
The excavation of underground rock engineering is often affected by groundwater [1,2]. Under high geo-stress, high groundwater pressure is prone to cause engineering geological disasters, such as water inrush. It seriously affects the construction progress and personnel safety for underground rock engineering [3]. The excavation of underground engineering, in fact, is the triaxial loading and unloading processes of the surrounding rock masses. It is therefore important to carry out the triaxial loading and unloading tests with different water contents of the rocks in laboratory.
Considerable efforts have been devoted to the effects of water on rock failure. For the influence of water on the mechanical properties of rocks, it has been found that a small increase in the water content may significantly lower the strength and stiffness of the rocks [4,5,6,7,8,9]. The statistical and numerical analysis on 14 kinds of the rocks with different water contents were also carried out, and it was found a negative exponential relationship between rock strength and moisture content [10]. Meanwhile, Li et al., [11] conducted the triaxial compression tests and found that the internal friction angle decreases while the cohesion increases when the meta-sedimentary rocks was saturated by water. Most of previous related studies were focused on the influence of water on the uniaxial or conventional triaxial strength of rocks [5,6,7,10]. However, few experimental and numerical studies are reported to discuss the effect of water content on the strength and deformability of the rocks under triaxial stress conditions [12,13,14]. In the practical engineering, the existence of groundwater not only affects the mechanical properties of rock, but also influences the damage degree and even the failure mode of the rock [15]. Zhou et al. [16] investigated the effects of water and joints on the properties of rock masses using the data from the Shirengou iron mine. Their numerical simulation results indicated that water is the critical factor for rock damage pattern. Several scholars also conducted experiments on deep rock and successfully showed a layered failure for saturated rock in tensile tests [17]. Spalling behaviors were studied in ture-triaxial unloading conditions and scanning electron microscope (SEM) observations revealed the distribution of microcracks in the fragments [18]. Besides, there are many studies related to rock uniaxial compression and tensile failure affected by water [19,20,21,22]. The deformation and failure of rock are energy-driven processes which include energy absorption, evolution, dissipation, and release [23,24,25,26]. Based on uniaxial and triaxial compression tests, Hua and You [27] studied the characteristics of rock energy evolution during unloading failure and concluded that the strain energy stored in rock material is sufficiently large to cause failure when it is released. Furthermore, water injection to reduce rockburst occurrences has also been discussed mainly on numerical simulation [28,29,30], and partially for experiments [2,31]. The numerical modeling showed that the peak stress can be reduced as water injection, which causes a significant reduction of internal energy stored within the rock, and the possibility of a rockburst occurrence may be reduced [28]. Moreover, the effects of water on rock energy evolution have also been studied [32,33,34,35,36,37], though it mainly concerns on uniaxial compression [34,35] and axial loading-unloading experiments [32,33,36,37]. Undoubtedly, the above study enriches our knowledge of the effect of water on rock failure and energy evolution. However, there are a few studies concern on the effect of water on rocks under triaxial tests, especially for the influence of unloading high confining pressure conditions, which represents a more realistic site environment.
Therefore, based on deep underground engineering such as mining and tunnel engineering under high geo-stress and water-rich conditions, this study is tried to investigate the combining effects of water content and high stress on the mechanical properties, failure and energy evolution of rocks in different stress paths. It is benefited the exploitation of deep resources and construction of deep rock engineering. Moreover, this study will be helpful to understand the effect of water on rock failure in high stress.
2. Materials and Methods
2.1. Specimen Preparation
Red sandstone samples which were obtained from a quarry in Yunnan Province, were used to test in the present study. A thin section analysis was carried out to examine the microstructure of the sandstone. It was identified as fine-grained sandstone by petrographic microscopy (Leica DM2700P, Leica Microsystems Inc., Wetzlar, German). The microstructure of the sandstone under plane polarization light (PPL) and cross polarization light (CPL) are illustrated in Figure 1. The mineral composition and grain size distribution of the sandstone specimen are listed in Table 1.
Both oven-dried and water-saturated specimens were prepared to study the influence of water on triaxial failure of the sandstone samples. In drying process, the sandstone specimens were placed in an oven at 105 °C for 24 h, and then they were removed to a desiccator and weighed after cooling to room temperature. In saturation process, the specimens were placed in water and allowed to absorb water for 48 h under atmospheric pressure, and then specimens were taken out and weighed after removing surface moisture of the rock. These specimens were considered as saturated samples in this study. The natural water content of specimen was about 2.5% and the saturated water content was about 3.3%. The diameter (D) of the cylindrical specimens was 50 mm and the specimen height (H) was 100 mm. The density and the P-wave velocity of each testing specimen are provided in Table 2.
2.2. Test Scheme
The triaxial tests including conventional triaxial compression tests (abbreviate to loading test) and unloading confining pressure tests (abbreviate to unloading test), were conducted by a servo-controlled material testing machine (MTS 815) (MTS Systems Corporation, Minnesota, USA) at laboratory of Central South University. Both of axial and circumferential strains can be recorded by extensometers.
Each test includes two experimental groups of dry and saturated sandstones respectively. Thus, the specimens are divided into four groups of dry and saturated sandstones in different loading and unloading tests (see in Table 2). The initial confining pressures () were set as 10, 20, 30, and 40 MPa, respectively. Meanwhile, the unloading point for the confining pressure in unloading tests was set as the axial stress reaching 80% of the corresponding triaxial compression strength (such as 0.8σ(10) and so on). Then, the axial loading method was changed from displacement control (0.1 mm/min) to loading control (1.5 MPa/min) at unloading point. In general, four sets of specimens were prepared, i.e., TC-D, TC-S, TU-D, TU-S. Specimens of set TC-D and TC-S, with the dry and saturated state respectively, were used in the conventional triaxial compression test. Specimens of set TU-D and TU-S, with the dry and saturated state respectively, were used in the unloading confining pressure test. And the number of specimen set represents for the corresponding confining pressure. For example, as shown in Table 2, TU-D-10 represents the unloading confining pressure test of dry specimen under the confining pressure of 10 MPa.
The detailed test procedures of the triaxial unloading test are listed as follows:
Step 1: Apply hydrostatic pressure on the specimen to an initial confining pressure ().
Step 2: Keep , and increase axial stress to 80% of the corresponding triaxial compression strength by a displacement control method at 0.1 mm/min.
Step 3: Reach the unloading point, change the axial stress loading method from displacement control to load control at the unloading point.
Step 4: Increase the axial stress at 1.5 MPa/min and also reduce the confining pressure simultaneously by load control method at a specified unloading rate (3.0 MPa/min) until the failure of the rock specimen.
3. Results
3.1. Mechanical Properties
Figure 2 shows the variation of the peak strength with the initial confining pressure of dry and saturated sandstone specimens. It can be seen that the peak strength of sandstone specimen increases as the initial confining pressure increases, but the increase rate slows down with the increase of the initial confining pressure. The difference of the peak strength between dry and saturated sandstones grows with the increasing of initial confining pressure. It means that the effect of water on rock strength is more remarkable under high confining pressure.
Figure 3 illustrates the strength parameters of different groups of specimens under triaxial loading and unloading tests. The strength parameters of sandstone specimens are differed in different stress paths. The strength parameters of C (cohesion) and φ (internal friction angle) under loading conditions are higher than those of unloading tests with the same water condition. Meanwhile, both C and φ values of saturated sandstones are lower than those of dry sandstones, which indicate that water has a deep impact in decreasing strength parameters (C and φ) of sandstone samples. When the sandstone samples are saturated by water, their shear strength parameters are reduced, where changes in results of φ are more remarkable. The weakening of strength parameters further affects the ultimate bearing capacity of sandstone.
The values of the axial strain (, ), circumferential strain (, ), and volumetric strain (, ) at the unloading point () and the critical failure point () are listed in Table 3. It can be seen that the absolute value of volumetric strain for rock in unloading test is greater than that of rock samples in conventional triaxial compression test, particularly for saturated samples. It means that the characteristics of volume expansion of rock under unloading conditions are more pronounced than the rock samples in loading tests. In addition, the incremental rates of circumferential strain are several times larger than those of axial strain from unloading point to critical failure point. The rock failure occurs mainly for the circumferential expansion under unloading conditions. Furthermore, except for the initial confining pressure of 20 MPa, the confining pressures of saturated sandstones at failure point () are higher than that for dry sandstones which indicate that saturated sandstones fail earlier than dry sandstones. This is due to the fact that the structures of rock samples are weaker when they are saturated by water as compared to structures of dry rock samples.
The relationship between the deformation parameters (i.e., the Young’s modulus, E, and the Poisson’s ratio, μ) and the initial confining pressure () is shown in Figure 4. As shown in Figure 4a, E values of sandstone firstly increase and then decrease as the initial confining pressure increases. Meanwhile, E values of dry sandstones are significantly higher than that of saturated sandstones in both loading and unloading tests. In Figure 4b, μ values of sandstone increase with the increase of initial confining pressure. Because the sandstone specimens are more prone to produce cracks paralleling to axial loading direction with the release of circumferential constraint in unloading test, the Poisson’s ratio of the sandstone in unloading test is higher than those values in loading test. Meanwhile, the Poisson′s ratio of the saturated specimen is higher than that of dry specimen under the same stress path. The bearing capacity decreases, and the Young’s modulus of the sandstone decreases while the Poisson′s ratio increases.
3.2. Fracturing Characteristics
Figure 5 shows the failure modes of dry and saturated sandstones in conventional triaxial compression tests. It is found from Figure 5a,b that the spalling and tensile cracks are visible under uniaxial compression. When the initial confining pressure increases to 10 MPa, axial or radial tensile cracks are often produced along the shear plane, and then tensile cracks develop and form a macroscopic failure surface, which even breaks earlier than the main shear fracture, as shown in Figure 5d. It indicates that the failure mode of rock specimens shows a combined tension and shear failure under low initial confining pressure condition ( ≤ 10 MPa). However, under high initial confining pressures ( > 10 MPa), a main shear fracture passes through the entire specimen usually extend to the end of specimen. The specimens are cut into two triangular vertebral bodies by the main fracture, and the main failure surface of sandstone develops from the end of specimen to the side surface as the increase of initial confining pressure. Shear failure occurs under high initial confining pressures (> 10 MPa), and a single shear fracture dominates the failure processes. Besides, all dry sandstone specimens show structural failure while some saturated sandstone specimens fail partly, as shown in Figure 5, implying that the failure characteristics of dry sandstones are more severe than those of saturated sandstones.
Figure 6 shows the failure modes of dry and saturated sandstones in unloading confining pressure tests. When the initial confining pressure is 10 MPa, the rock tends to produce longitudinal tensile cracks approximately parallel to the loading direction, as the reduction of circumferential constraints in unloading test. Tensile cracks propagate and coalesce with the shear crack, leading to the final failure of rock specimens. When the initial confining pressure is 20 MPa, there are numerous rock fragments caused by shear friction on the rock failure plane, implying that the rock specimen undergoes shear failure and forms a macroscopic shear surface. Meanwhile, longitudinal (Figure 6c) and radial (Figure 6d) tensile cracks are often produced at the lower part of the triangular vertebral body. Combined shear and tension failure occurs for the rock specimen. Under high initial confining pressures ( > 20 MPa), shear failure dominates the failure process in unloading tests, which is the same as the conventional triaxial compression test. The shear friction of the rock is severe, and a lot of rock fragments are observed on the failure surface. Besides, by comparing failed rock fragments, it can be found that the failure characteristics of dry sandstones are more violent than those of saturated sandstones under unloading test.
The phenomenon of volume expansion occurs significantly in the triaxial tests, particularly for the saturated rock in unloading confining pressure test. The failure characteristics of sandstone in unloading test are more violent than those under triaxial loading test.
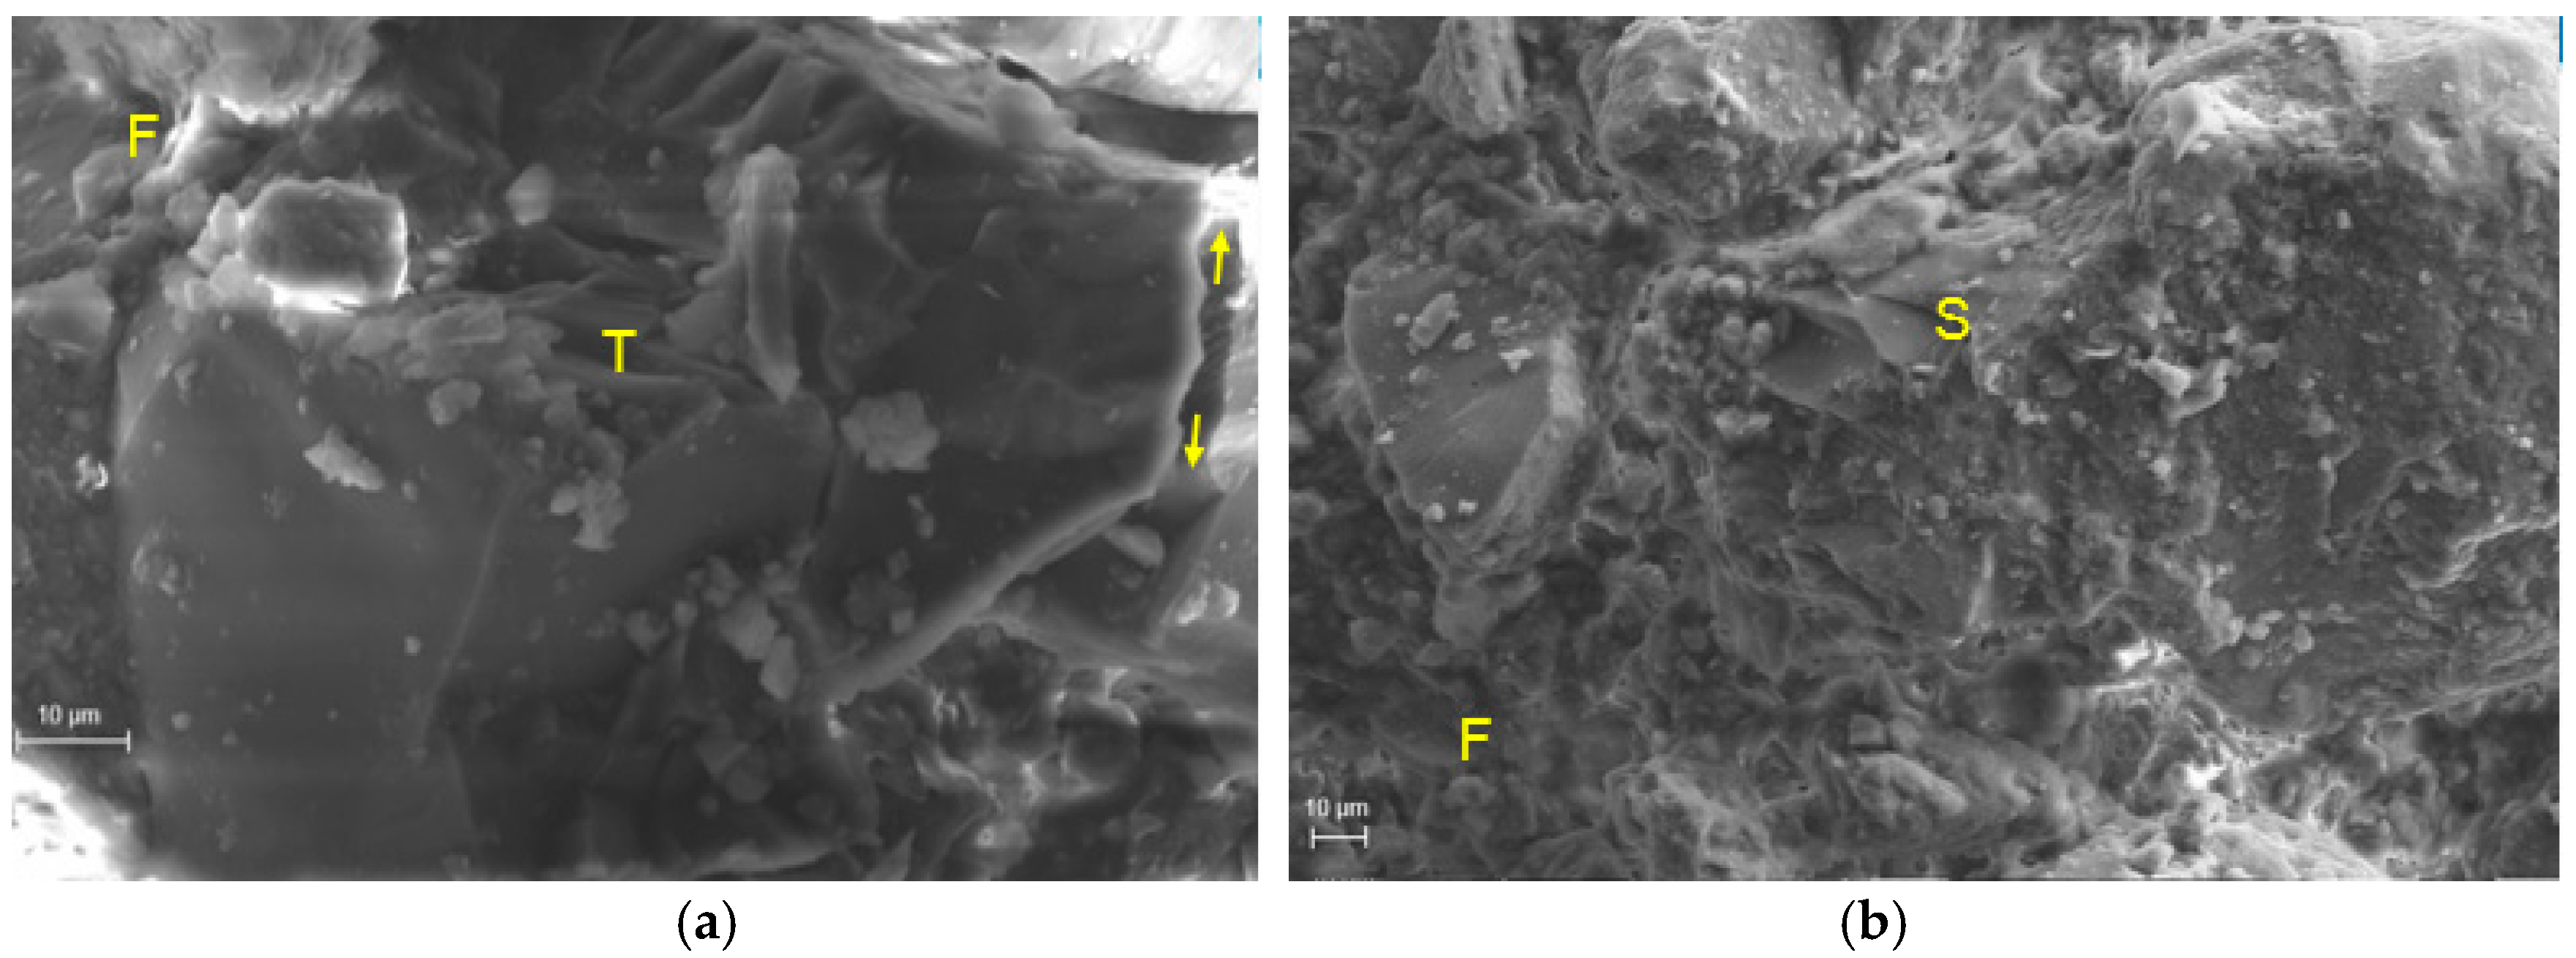
In order to compare and analyze the microscopic and macroscopic failure characteristics of the rocks under different confining pressures, stress paths and water contents, the microscopic analysis of dry and saturated sandstones with an initial confining pressure of 10 and 40 MPa were carried out using the scanning electron microscopy (SEM) method. Figure 7 shows the SEM photos of sandstone fractures with the initial confining pressure 10 and 40 MPa in conventional triaxial compression test. In Figure 7a,c, the spalling fractures occurs in microscopic view under the initial confining pressure of 10 MPa, which is similar to the macroscopic spalling failure of rock specimen. The microscopic fractures retain sharp and smooth crystal surfaces. Meanwhile, the tearing traces (left arrows) are formed in Figure 7b, which are the typical microscopic characteristics of tensile failure [25,38]. Besides, there are tiny rock fragments (as shown at two sides of Figure 7a,d) and slip scratches (as shown in Figure 7d) left behind by shear friction [39]. It means that the micro-cracks of sandstone are shown as a combined tension and shear failure under low initial confining pressures ( = 10 MPa represents low initial confining pressure). It is consistent with the macroscopic failure characteristics of sandstone. However, under high initial confining pressures ( = 40 MPa), the microscopic fractures of the rock are stepped and serrated as shear effect [40]. In addition, there are lots of rock fragments left in the low-lying area, as illustrated in Figure 7e–h. Furthermore, the slip scratches along the crystal are also existed in Figure 7e. The rock crystals were cut off and angular edges were flattened in Figure 7h. The fractures almost have no traces of tension failure on the microscopic section of sandstone. Under high initial confining pressure conditions, the microscopic failure of sandstone is dominated by shear, which is consistent with the macroscopic failure characteristics of sandstone in the conventional triaxial compression test.
Figure 8 shows the SEM photos of sandstone fractures with the initial confining pressure 10 and 40 MPa in unloading confining pressure tests. It can be seen clearly from Figure 8 that there are visible tensile cracks in dry and saturated sandstones under different confining pressures. In Figure 8a,c,e,g,h, the microscopic section shows sharp angular edges and smooth crystal surfaces. Moreover, there are evident traces of tension and spalling fractures in microscopic view. The microscopic section exhibit a typical tensile failure. In addition, as shown in Figure 8b,d,f, there are a large number of rock fragments left behind on the roughly microscopic section. The scratches caused by shear friction appear on the right part of Figure 8h. The microscopic failure section also shows shear failure characteristics. Thus, the microscopic failure of sandstone mainly shows a combined tension and shear failure in unloading test. It is consistent with macroscopic failure of sandstone under low initial confining pressure, but it is different from macroscopic failure of sandstone under high initial confining pressure, where the specimen only shows shear failure in macroscopic view.
3.3. Energy Evolution of Rock Failure
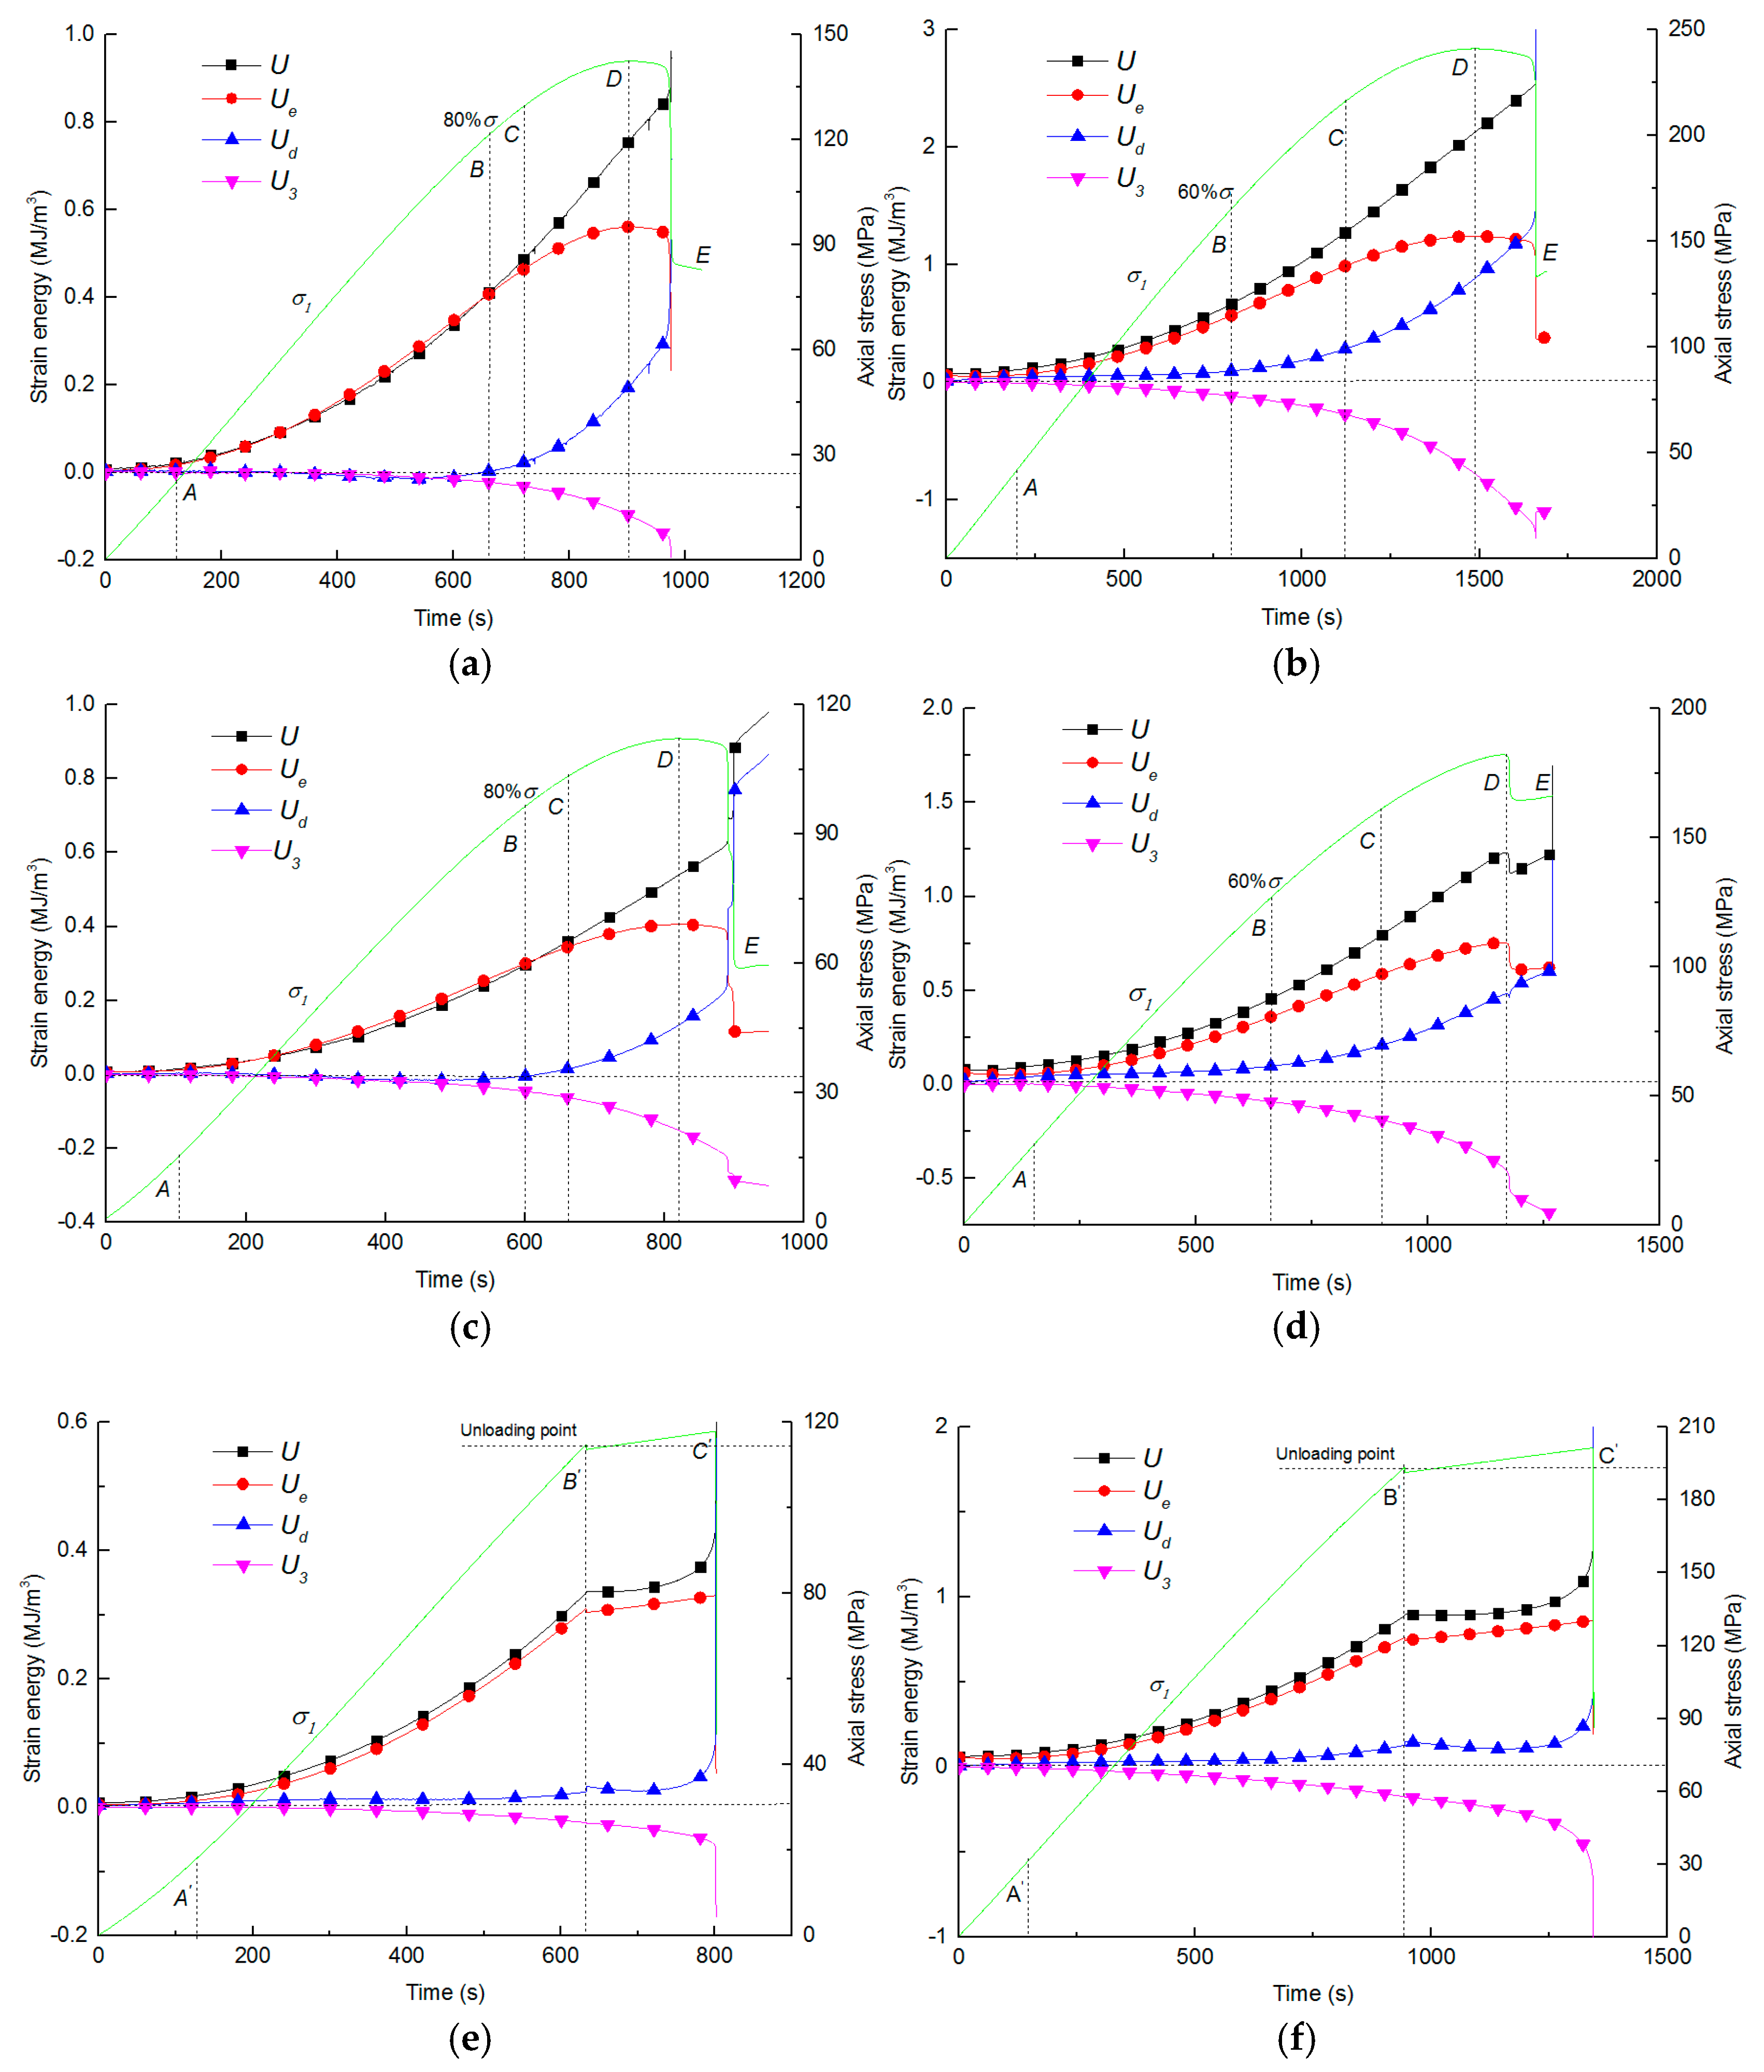
Based on the relevant strain energy calculation formula and the experimental data, the strain energy evolution curves can be obtained with loading time [41,42]. The typical time history curves of strain energy for dry and saturated sandstone specimens under different initial confining pressures are shown in Figure 9. The initial confining pressures of 10 MPa and 40 MPa represent low and high confining pressures respectively. The strain energy curves for other specimens under low or high confining pressures are similar to these curves in each testing group.
For conventional triaxial compression tests, as shown in Figure 9a–d, several typical stages can be divided corresponding to the points in the stress-time curves. When the rock specimen is under low initial confining pressure ( = 10 MPa), as shown in Figure 9a,c, the curves of total strain energy (U) and elastic strain energy (Ue) almost overlap, and the dissipative strain energy (Ud) is relatively low in the micro-cracks compaction stage (OA) and the elastic deformation stage (AB). It indicates that the energy absorbed from the test machine is basically converted into Ue. However, while the rock specimen is under high initial confining pressure ( = 40 MPa), particularly for the saturated sandstone as shown in Figure 9d, the curves of U and Ue begin to separate gradually and there are few increases of Ud in the elastic deformation stage (AB). In the crack initiation and expansion stage (BC), when the rock is under low initial confining pressure, the curves of U and Ue separate gradually at point B. Meanwhile, Ud starts to increase from this point, owing to the development of plastic deformation and propagation of micro-cracks of the specimens. When the rock is under high initial confining pressure, U, Ue, and Ud increase steadily where the increase rate of Ud is the minimum among them. During the unstable crack development up to the failure stage (CD), the increase rate of Ue slows down, and Ue reaches the elastic energy storage limit at the peak strength point D. Ud increases rapidly in this stage, illustrating accelerated growth of micro-cracks, and the failure approaches. In the post-failure stage (DE), Ue releases quickly to a small value, and Ud increases rapidly to a large value. The absorbed strain energy is basically transformed into Ud, which contributes to the development of internal cracks and a large shear deformation along the fracture surface. However, U still increases rapidly as the large axial deformation at this stage. Finally, the specimen shows a brittle failure.
For the unloading confining pressure tests, the strain energy time curves of sandstone specimens are shown in Figure 9e–h. The characteristics of strain energy curves in unloading tests are quite different from conventional triaxial compression tests, especially from the unloading point. Before the unloading point, in the micro-cracks compaction stage and the elastic stage (OB′), the curves of U and Ue almost overlap with a low initial confining pressure (10MPa), while the curves of U and Ue begin to separate under a high initial confining pressure (40MPa). The variation trend is similar with the loading test. However, after unloading point (B′C′), U and Ud increase steadily while Ue shows a slow rate of increase. Meanwhile, since the rock is still under the effect of axial loading in this stage, the energy is still absorbed from the test machine. The absorbed energy is mainly converted into Ud, which is used for the development and expansion of micro-cracks within the rock. When reaching the failure point (C′), Ud and circumferential strain energy (U3) grow rapidly, and the stress-time curve falls down immediately. At this moment, Ue releases rapidly because of the propagation of rock cracks. Following the point C′, almost all of the releasable strain energy is released. Meanwhile, Ud and U3 increase to the maximum value. Finally, the rock specimen fails violently due to the unloading of confining pressure.
Undoubtedly, there are some differences in the energy evolution laws of the rocks under different confining pressure conditions, particularly in the elastic deformation stage in triaxial loading and unloading process. During the elastic deformation stage, the curves of U and Ue almost overlap when the rock specimen is under low initial confining pressure, and almost all of the absorbed energy is converted into Ue. However, when the rock is under high initial confining pressure, the curves of U and Ue begin to separate, and the absorbed energy is basically stored as Ue, and partially converted as Ud. It is manifested that the internal damage has occurred earlier under the high initial confining pressure conditions, and the internal micro-cracks of rock begin to develop and propagate during the elastic deformation stage. Especially for the saturated sandstone under high initial confining pressures, the curves of U and Ue separate significantly in Figure 9h, which signifies that the water effect on rock energy evolution are nonnegligible, and it has a significant influence on the deformation and failure process of rock under high initial confining pressures. In addition, the curves separate at the point where the axial stress is about 80% of the peak strength for low initial confining pressure condition, while the curves separate at the point where the axial stress is about 60% of the peak strength under high initial confining pressure. It also indicates that the internal damage and micro-cracks develop earlier under high initial confining pressure than that under low confining pressure conditions.
The dissipation of energy leads to the development and propagation of internal cracks, which is the main reason of rock failure. It has been proved that the use of Ud/U is more favorable to analyze rock deformation and failure process instead of dissipative strain energy (Ud) [25,43]. The variation curves of Ud/U with the loading time under different confining pressures are shown in Figure 10.
The Ud/U exhibits some typical evolution stages as shown in Figure 10. In the conventional triaxial compression test, it increases initially, then decreases, and then increases slowly; finally, it increases rapidly at the failure stage of the rock. However, the curve increases initially, and then it decreases to a nearly smooth platform; finally, it increases sharply in unloading tests. During the failure stage, the elastic strain energy accumulated within the rock releases instantaneously, prompting rock fractures and damages. Meanwhile, it has been testified that the faster dissipation of rock energy causes the crack to propagate and penetrate faster, and then the failure of the rock occurs more suddenly [42,44]. In the conventional triaxial compression test, the energy dissipation curve increases along a skew line, showing a gradual increase trend. In contrast, the energy dissipation curve shows a nearly vertical increase for the triaxial unloading test, indicating a sudden and violent brittle failure of rock specimens.
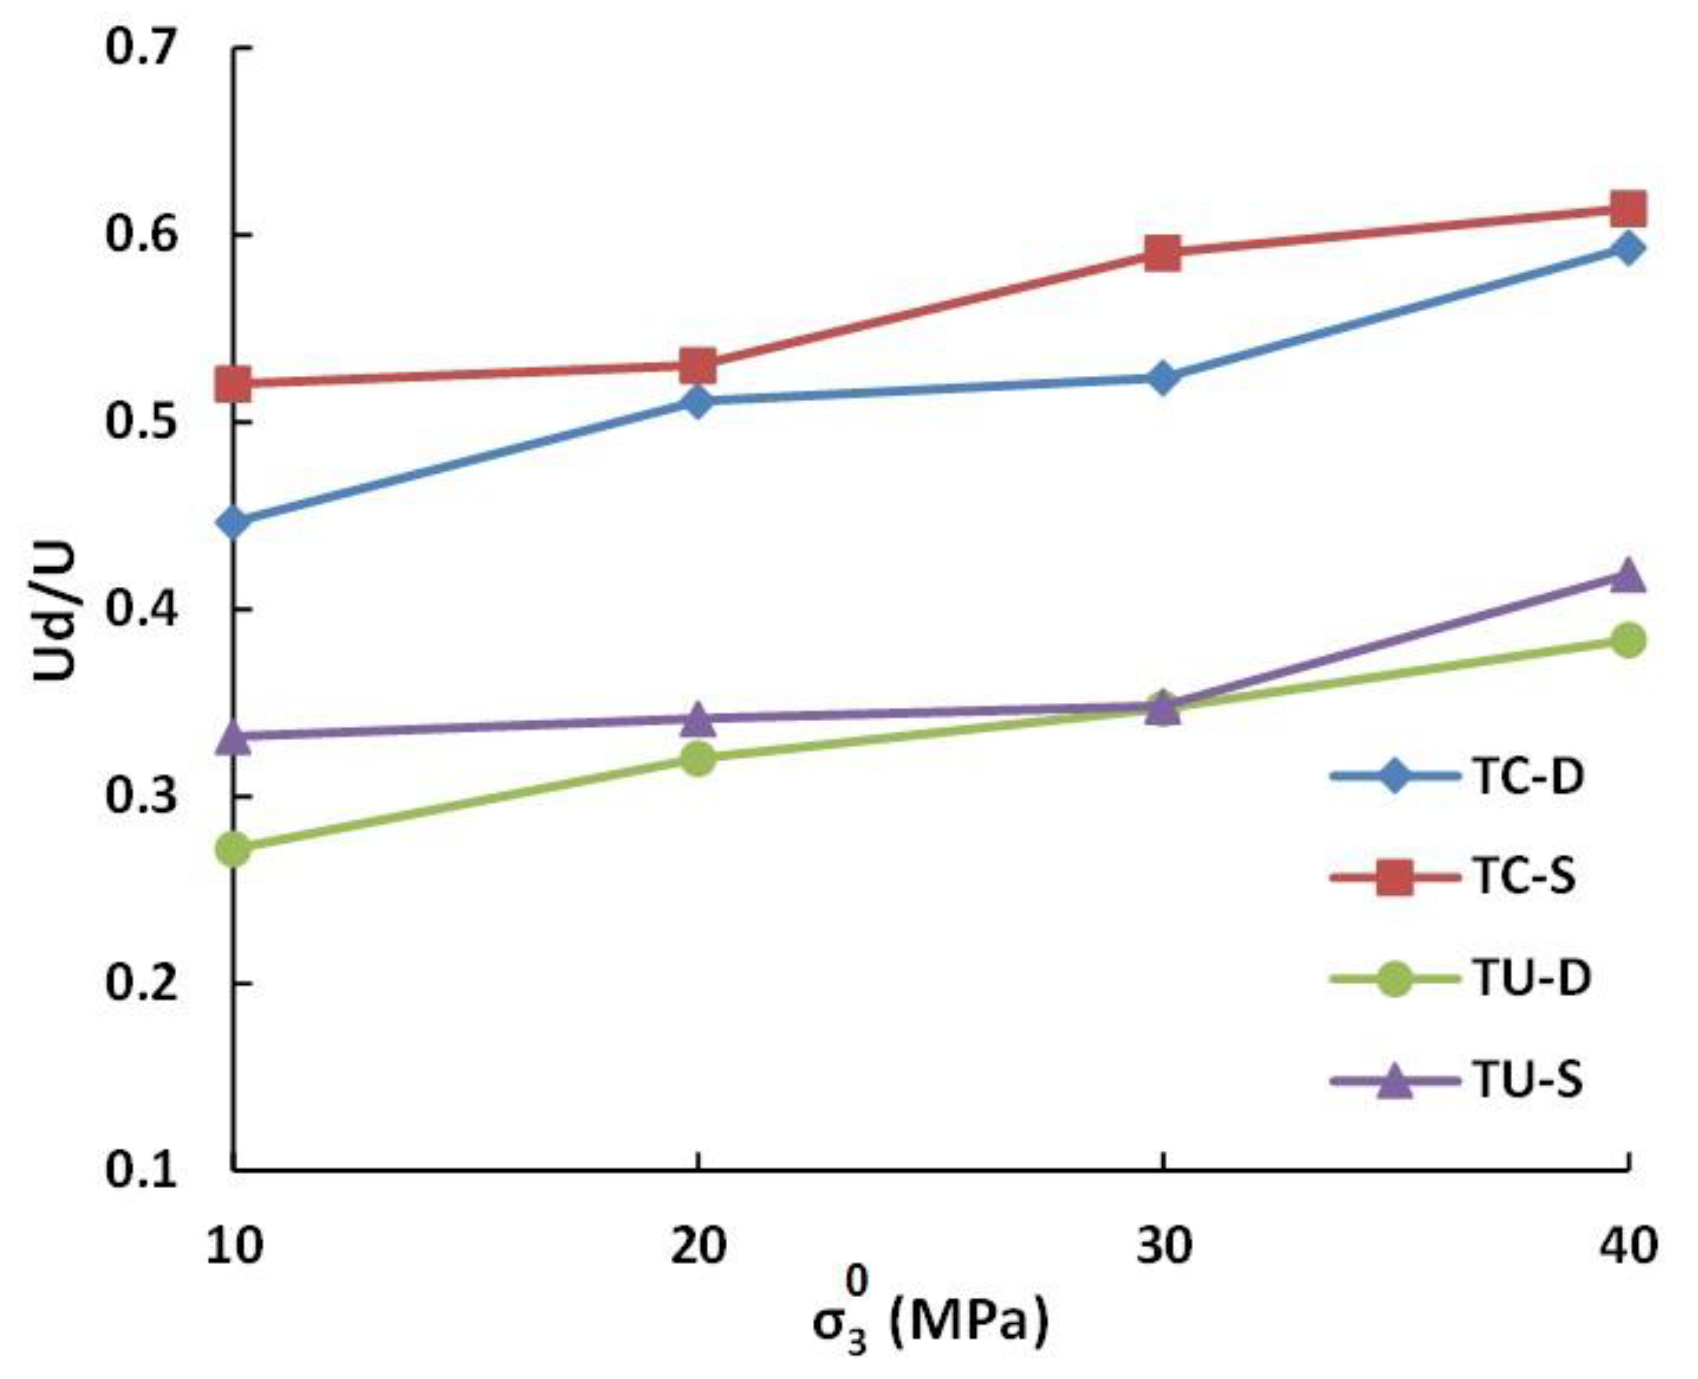
The relationship between the Ud/U and initial confining pressure at the corresponding critical failure point is plotted in Figure 11. The Ud/U values increase as increases. When the rock specimen is under high initial confining pressures, it has more time for specimen deformation and damage. Thus the dissipative strain energy takes a large proportion of the total absorption energy in the rock. The deformation and failure process of rock in loading tests includes the micro-cracks compaction stage (OA), the elastic deformation stage (AB), the crack initiation and propagation stage (BC), the unstable crack development up to the failure stage (CD), the post-failure stage (DE) and so on. However, the rock in unloading tests enters the failure stage almost directly from the elastic deformation stage. Thus, relatively fewer cracks develop inside the rock, resulting in less dissipation of rock energy and the energy is mainly consumed for the circumferential deformation and converted into kinetic energy for the failure of rock, such as rockbursts. The Ud/U of rock in unloading test is significantly lower than that of conventional triaxial compression test, as shown in Figure 11. Furthermore, the Ud/U of saturated rock is greater than dry rocks in the deformation and failure process of triaxial tests. Saturated by water, the internal friction strength of the rock is weakened as the water immersion, which results the rocks more prone to be deformed and damaged. With the accumulated damage within the rock, the energy account for the dissipation increases and the energy release decreases, leading to a relatively moderate failure of saturated rock, and there are less possibilities for rockbursts. It is also one of the basic theoretical foundations for the rockburst prevention through water injection in engineering. In addition, comparing the influence of stress paths and water conditions of the rock in Figure 11, it can be found that the effect of stress paths on energy evolution is more pronounced than the water conditions of the rock.
4. Discussion
When a rock specimen approaches the failure point, Ue can be quickly released and it may be transformed into Ud. In the conventional triaxial compression test, the internal cracks develop completely within the rock specimen. However, the unloading failure usually occurs abruptly, and the rock specimens fail violently with loud fracturing noise, which has the characteristics of rockburst as observed in deep rock excavation engineering.
Table 4 lists the average strain energy values of sandstone specimens at the unloading point and the critical failure point in present triaxial tests. In the conventional triaxial compression test, Ud is larger than U3 at critical failure point of the rock, implying that the energy consumption is mainly used for the micro-crack initiation and internal damage of the rock. In contrast, under unloading tests, the energy consumption during the failure process of rock specimens mainly contributes to the circumferential strain (ε3) as the reduction of confining pressure, and thus U3 is larger than Ud as shown in Table 4. Moreover, the following energy incremental value can be calculated based on the data in Table 4.
It can be inferred that , in unloading tests, and Ue converts into Ud for the development and propagation of internal cracks from the unloading point to the failure point. Meanwhile, the present study discovered that . The dissipative energy includes not only the energy converted from Ue, but also the newly absorbed energy from the test machine. In unloading test, there is the following relationship between the dry and saturated rock:
It implies that the failure of dry specimens is more severe than the saturated specimen. Furthermore, at the critical failure point also exists in unloading test. The energy absorbed by the rock from test machine is mainly consumed for the development of internal fractures, axial deformation, and circumferential deformation, while partly remained. The residual energy () may account for the kinetic energy due to rockbursts, which may occur in the unloading process such as rock excavation with high in-situ stresses in hard rock. Besides, it can be obtained that:
There is more residual energy for dry rock than saturated rock. It implies that the rock burst is more likely to occur in dry rock, and water infusion is effective to reduce the possibility of rockbursts in the excavation of deep underground rock engineering.
5. Conclusions
- (1)
- The peak strength difference between dry and saturated sandstones grows with the increasing of initial confining pressure, and the effect of water on rock strength is more remarkable under high initial confining pressures. As a result, when the sandstone specimens are saturated by water, the values of cohesion, internal friction angle and Young’s modulus are decreased whereas the Poisson’s ratio is increased.
- (2)
- In the conventional triaxial compression test, both macroscopic and microscopic failure of the rocks show a combined tension and shear fracture under low initial confining pressure ( ≤ 10 MPa), but it shows shear fracture under high initial confining pressure ( > 10 MPa). The microscopic failure of the rock in unloading test mainly shows a combined tension and shear fracture, which is consistent with the macroscopic failure of sandstone under low initial confining pressure ( ≤ 20 MPa). However, under high initial confining pressure conditions ( > 20 MPa), it mainly shows shear fracture in macroscopic view. The failure of sandstone in unloading test is more violent than that the failure under triaxial loading test, particularly for dry sandstones.
- (3)
- The energy evolution processes confirm that there are some differences for rock specimens under different confining pressures, particularly for the elastic deformation stage. During this stage, the total energy (U) and elastic strain energy (Ue) curves are almost overlapped when the rock specimen is under low initial confining pressures. However, when the rock is under high initial confining pressures, U and Ue begin to separate, and the absorbed energy is basically stored as Ue, partially as the dissipative strain energy (Ud). The internal damage has occurred and the internal cracks of the rock develop earlier under the high initial confining pressure conditions.
- (3)
- The energy consumption during the failure process mainly contributes to crack initiation and internal damage in loading tests. In unloading test, the energy is mainly consumed for the circumferential deformation and converted into kinetic energy for rock failure. The failure of the saturated rock is relatively moderate because the absorbed energy is mainly used for internal damage and only a part of energy is used for release. Rockburst phenomenon is tended to occur for dry rocks, especially under triaxial unloading conditions. It also indicates that the water injection of the rock may be effective to prevent rockbursts under high in-situ stresses conditions.
Author Contributions
Conceptualization, D.L. and Z.S.; methodology, Z.S.; software, Z.S. and Q.Z.; validation, D.L., Z.S. and K.P.; formal analysis, Z.S.; investigation, Z.S. and Q.Z.; resources, D.L.; data curation, Z.S.; writing—original draft preparation, Z.S.; writing—review and editing, D.L.; visualization, Z.S.; supervision, D.L.; project administration, D.L. and K.P.; funding acquisition, D.L. and K.P.
Funding
This research was funded by the National Natural Science Foundation of China (51474250, 51774058) and Chongqing Basic Research and Frontier Exploration Project (cstc2018jcyjA3320, cstc2016jcyjA1861).
Conflicts of Interest
The authors declare no conflict of interest.
References
- Al-Shalabi, E.W.; Sepehrnoori, K. A comprehensive review of low salinity/engineered water injections and their applications in sandstone and carbonate rocks. J. Pet. Sci. Eng. 2016, 139, 137–161. [Google Scholar] [CrossRef]
- Zhou, Z.; Cai, X.; Cao, W.; Li, X.; Xiong, C. Influence of Water Content on Mechanical Properties of Rock in Both Saturation and Drying Processes. Rock Mech. Rock Eng. 2016, 49, 3009–3025. [Google Scholar] [CrossRef]
- Wang, Y.; Meng, F.; Geng, F.; Jing, H.; Zhao, N. Investigating Water Permeation through the Soil-Rock Mixture in Underground Engineering. Pol. J. Environ. Stud. 2017, 26, 1777–1788. [Google Scholar] [CrossRef] [Green Version]
- Vasarhelyi, B. Statistical analysis of the influence of water content on the strength of the miocene limestone. Rock Mech. Rock Eng. 2005, 38, 69–76. [Google Scholar] [CrossRef]
- Talesnick, M.; Shehadeh, S. The effect of water content on the mechanical response of a high-porosity chalk. Int. J. Rock Mech. Min. Sci. 2007, 44, 584–600. [Google Scholar] [CrossRef]
- Erguler, Z.A.; Ulusay, R. Water-induced variations in mechanical properties of clay-bearing rocks. Int. J. Rock Mech. Min. Sci. 2009, 46, 355–370. [Google Scholar] [CrossRef]
- Török, Á.; Vásárhelyi, B. The influence of fabric and water content on selected rock mechanical parameters of travertine, examples from Hungary. Eng. Geol. 2010, 115, 237–245. [Google Scholar] [CrossRef]
- Yilmaz, I. Influence of water content on the strength and deformability of gypsum. Int. J. Rock Mech. Min. Sci. 2010, 47, 342–347. [Google Scholar] [CrossRef]
- Çelik, M.Y.; Ergül, A. The influence of the water saturation on the strength of volcanic tuffs used as building stones. Environ. Earth Sci. 2015, 74, 3223–3239. [Google Scholar] [CrossRef]
- Shi, X.; Cai, W.; Meng, Y.; Li, G.; Wen, K.; Zhang, Y. Weakening laws of rock uniaxial compressive strength with consideration of water content and rock porosity. Arab. J. Geosci. 2016, 9, 369. [Google Scholar] [CrossRef]
- Li, D.; Wong, L.N.Y.; Liu, G.; Zhang, X. Influence of water content and anisotropy on the strength and deformability of low porosity meta-sedimentary rocks under triaxial compression. Eng. Geol. 2012, 126, 46–66. [Google Scholar] [CrossRef]
- Rathnaweera, T.; Ranjith, P.; Perera, M.; De Silva, V. Development of a laboratory-scale numerical model to simulate the mechanical behaviour of deep saline reservoir rocks under varying salinity conditions in uniaxial and triaxial test environments. Measurement 2017, 101, 126–137. [Google Scholar] [CrossRef]
- Bejarbaneh, B.Y.; Armaghani, D.J.; Amin, M.F.M. Strength characterisation of shale using Mohr–Coulomb and Hoek–Brown criteria. Measurement 2015, 63, 269–281. [Google Scholar] [CrossRef] [Green Version]
- Mckean, S.H.; Priest, J.A.; Priest, J. Multiple failure state triaxial testing of the Montney Formation. J. Pet. Sci. Eng. 2019, 173, 122–135. [Google Scholar] [CrossRef]
- Zhu, W.; Wong, T.-F.; Baud, P.; Wong, T. Failure mode and weakening effect of water on sandstone. J. Geophys. Res. Biogeosci. 2000, 105, 16371–16389. [Google Scholar] [Green Version]
- Zhou, J.; Wei, J.; Yang, T.; Zhu, W.; Li, L.; Zhang, P. Damage analysis of rock mass coupling joints, water and microseismicity. Tunn. Undergr. Space Technol. 2018, 71, 366–381. [Google Scholar] [CrossRef]
- Duan, H.F.; Jiang, Z.Q.; Zhu, S.Y.; Xiao, W.G.; Li, D.L. Micro-mechanism of water stability and characteristics of strength softening of rock in deep mines. Chin. J. Geotech. Eng. 2012, 34, 1636–1645. [Google Scholar]
- Zhao, X.G.; Wang, J.; Cai, M.; Cheng, C.; Ma, L.K.; Su, R.; Zhao, F.; Li, D.J. Influence of Unloading Rate on the Strainburst Characteristics of Beishan Granite Under True-Triaxial Unloading Conditions. Rock Mech. Rock Eng. 2014, 47, 467–483. [Google Scholar] [CrossRef]
- Kundu, J.; Mahanta, B.; Sarkar, K.; Singh, T.N. The Effect of Lineation on Anisotropy in Dry and Saturated Himalayan Schistose Rock Under Brazilian Test Conditions. Rock Mech. Rock Eng. 2018, 51, 5–21. [Google Scholar] [CrossRef]
- Liu, D.; Wang, Z.; Zhang, X.; Wang, Y.; Zhang, X.; Li, D. Experimental investigation on the mechanical and acoustic emission characteristics of shale softened by water absorption. J. Nat. Gas Sci. Eng. 2018, 50, 301–308. [Google Scholar] [CrossRef]
- Lyu, Q.; Long, X.; Ranjith, P.; Tan, J.; Kang, Y. Experimental investigation on the mechanical behaviours of a low-clay shale under water-based fluids. Eng. Geol. 2018, 233, 124–138. [Google Scholar] [CrossRef]
- Xiao, T.L.; Li, X.P.; Lu, Y.I. Structural plane of rock mass strength characteristics and its impact on Groundwater, in Trends in Civil Engineering. Adv. Mater. Res. 2012, 446–449, 476–479. [Google Scholar] [CrossRef]
- Wasantha, P.; Ranjith, P.; Shao, S. Energy monitoring and analysis during deformation of bedded-sandstone: Use of acoustic emission. Ultrasonics 2014, 54, 217–226. [Google Scholar] [CrossRef]
- Peng, K.; Liu, Z.P.; Zou, Q.L.; Zhang, Z.Y.; Zhou, J.Q. Static and dynamic mechanical properties of granite from various burial depths. Rock Mech. Rock Eng. 2019. [Google Scholar] [CrossRef]
- Li, D.; Sun, Z.; Xie, T.; Li, X.; Ranjith, P.G. Energy evolution characteristics of hard rock during triaxial failure with different loading and unloading paths. Eng. Geol. 2017, 228, 270–281. [Google Scholar] [CrossRef]
- Zhang, D.; Li, S.; Bai, X.; Yang, Y.; Chu, Y. Experimental Study on Mechanical Properties, Energy Dissipation Characteristics and Acoustic Emission Parameters of Compression Failure of Sandstone Specimens Containing En Echelon Flaws. Appl. Sci. 2019, 9, 596. [Google Scholar] [CrossRef]
- Hua, A.Z.; You, M.Q. Rock failure due to energy release during unloading and application to underground rock burst control. Tunn. Undergr. Space Technol. 2001, 16, 241–246. [Google Scholar] [CrossRef]
- Lu, T.K.; Zhao, Z.J.; Hu, H.F. Improving the gate road development rate and reducing outburst occurrences using the waterjet technique in high gas content outburst-prone soft coal seam. Int. J. Rock Mech. Min. Sci. 2011, 48, 1271–1282. [Google Scholar] [CrossRef]
- Song, D.; Wang, E.; Liu, Z.; Liu, X.; Shen, R. Numerical simulation of rock-burst relief and prevention by water-jet cutting. Int. J. Rock Mech. Min. Sci. 2014, 70, 318–331. [Google Scholar] [CrossRef]
- Bautista, J.; Taleghani, A.D. Prediction of formation damage at water injection wells due to channelization in unconsolidated formations. J. Pet. Sci. Eng. 2018, 164, 1–10. [Google Scholar] [CrossRef]
- Guo, W.Y.; Tan, Y.L.; Yang, Z.L.; Zhao, T.B.; Hu, S.C. Effect of Saturation Time on the Coal Burst Liability Indexes and Its Application for Rock Burst Mitigation. Geotech. Geol. Eng. 2018, 36, 589–597. [Google Scholar] [CrossRef]
- Zhang, Z.Z.; Feng, G. Experimental investigation on the energy evolution of dry and water-saturated red sandstones. Int. J. Min. Sci. Technol. 2015, 25, 383–388. [Google Scholar] [CrossRef]
- Hong-qing, Z.; Min-bo, Z.; Shuai-hu, Z.; Bei-fang, G.; Xiang, S. Effect of triaxial compression on damage deformation of coal rock under pulsed pore water pressure. Rock Soil Mech. 2015, 36, 2137–2143. [Google Scholar]
- Cai, C.; Gao, F.; Li, G.; Huang, Z.; Hou, P. Evaluation of coal damage and cracking characteristics due to liquid nitrogen cooling on the basis of the energy evolution laws. J. Nat. Gas Sci. Eng. 2016, 29, 30–36. [Google Scholar] [CrossRef]
- Zhu, Q.; Li, D.; Han, Z.; Li, X.; Zhou, Z. Mechanical properties and fracture evolution of sandstone specimens containing different inclusions under uniaxial compression. Int. J. Rock Mech. Min. Sci. 2019, 115, 33–47. [Google Scholar] [CrossRef]
- Zhuang, D.; Tang, C.; Liang, Z.; Ma, K.; Wang, S.; Liang, J. Effects of excavation unloading on the energy-release patterns and stability of underground water-sealed oil storage caverns. Tunn. Undergr. Space Technol. 2017, 61, 122–133. [Google Scholar] [CrossRef]
- Wang, S.; Hagan, P.; Zhao, Y.; Chang, X.; Song, K.I.; Zou, Z. The Effect of Confining Pressure and Water Content on Energy Evolution Characteristics of Sandstone under Stepwise Loading and Unloading. Adv. Civ. Eng. 2018, 2018. [Google Scholar] [CrossRef]
- He, Z.; Li, G.; Tian, S.; Wang, H.; Shen, Z.; Li, J. SEM analysis on rock failure mechanism by supercritical CO2 jet impingement. J. Pet. Sci. Eng. 2016, 146, 111–120. [Google Scholar] [CrossRef]
- Mancktelow, N.S.; Pennacchioni, G. The influence of grain boundary fluids on the microstructure of quartz-feldspar mylonites. J. Struct. Geol. 2004, 26, 47–69. [Google Scholar] [CrossRef]
- Storti, F.; Billi, A.; Salvini, F. Particle size distributions in natural carbonate fault rocks: Insights for non-self-similar cataclasis. Earth Planet. Sci. Lett. 2003, 206, 173–186. [Google Scholar] [CrossRef]
- Xie, H.; Li, L.; Peng, R.; Ju, Y. Energy analysis and criteria for structural failure of rocks. J. Rock Mech. Geotech. Eng. 2009, 1, 11–20. [Google Scholar] [CrossRef] [Green Version]
- Li, Y.; Huang, D.; Li, X. Strain Rate Dependency of Coarse Crystal Marble under Uniaxial Compression: Strength, Deformation and Strain Energy. Rock Mech. Rock Eng. 2014, 47, 1153–1164. [Google Scholar] [CrossRef]
- Ning, J.; Wang, J.; Jiang, J.; Hu, S.; Jiang, L.; Liu, X. Estimation of Crack Initiation and Propagation Thresholds of Confined Brittle Coal Specimens Based on Energy Dissipation Theory. Rock Mech. Rock Eng. 2018, 51, 119–134. [Google Scholar] [CrossRef]
- Peng, R.; Ju, Y.; Wang, J.G.; Xie, H.; Gao, F.; Mao, L. Energy Dissipation and Release during Coal Failure under Conventional Triaxial Compression. Rock Mech. Rock Eng. 2015, 48, 509–526. [Google Scholar] [CrossRef]
Figure 1.
Polarized light micrographs of sandstone specimen: (a) plane polarization light (PPL); (b) cross polarization light (CPL). (Note: The letters Qz, Kfs and Cc represent quartz, potassium feldspar and calcite, respectively).
Figure 1.
Polarized light micrographs of sandstone specimen: (a) plane polarization light (PPL); (b) cross polarization light (CPL). (Note: The letters Qz, Kfs and Cc represent quartz, potassium feldspar and calcite, respectively).

Figure 2.
Peak strength of sandstone specimens.

Figure 3.
Strength parameters of sandstone specimens.

Figure 4.
Variation of the deformation parameters of sandstone with the initial confining pressure (a) Young’s modulus; and (b) Poisson′s ratio.
Figure 4.
Variation of the deformation parameters of sandstone with the initial confining pressure (a) Young’s modulus; and (b) Poisson′s ratio.

Figure 5.
Failure modes of dry and saturated sandstones in conventional triaxial compression tests: (a) TC-D-0; (b) TC-S-0; (c) TC-D-10; (d) TC-S-10; (e) TC-D-20; (f) TC-S-20; (g) TC-D-30; (h) TC-S-30; (i) TC-D-40; (j) TC-S-40.
Figure 5.
Failure modes of dry and saturated sandstones in conventional triaxial compression tests: (a) TC-D-0; (b) TC-S-0; (c) TC-D-10; (d) TC-S-10; (e) TC-D-20; (f) TC-S-20; (g) TC-D-30; (h) TC-S-30; (i) TC-D-40; (j) TC-S-40.

Figure 6.
Failure modes of dry and saturated sandstones in unloading confining pressure tests: (a) TU-D-10; (b) TU-S-10; (c) TU-D-20; (d) TU-S-20; (e) TU-D-30; (f) TU-S-30; (g) TU-D-40; (h) TU-S-40.
Figure 6.
Failure modes of dry and saturated sandstones in unloading confining pressure tests: (a) TU-D-10; (b) TU-S-10; (c) TU-D-20; (d) TU-S-20; (e) TU-D-30; (f) TU-S-30; (g) TU-D-40; (h) TU-S-40.

Figure 7.
Typical scanning electron microscopy (SEM) images of sandstone fractures with the initial confining pressure 10 and 40 MPa in conventional triaxial compression tests: (a,b) TC-D-10; (c,d) TC-S-10; (e,f) TC-D-40; (g,h) TC-S-40 (Note: Opposite arrows and inverse arrows represent slip trace and tensile trace respectively; and the letters F, S and T represent fragments, shear crack and tensile crack, respectively).


Figure 8.
Typical SEM images of sandstone fractures with the initial confining pressure 10 and 40 MPa in unloading confining pressure tests: (a,b) TC-D-10; (c,d) TC-S-10; (e,f) TC-D-40; (g,h) TC-S-40 (Opposite arrows and inverse arrows represent slip trace and tensile trace respectively; and the letters F, S and T represent fragments, shear crack and tensile crack, respectively).


Figure 9.
Typical strain energy and axial stress time curves: (a) TC-D-10; (b) TC-D-40; (c) TC-S-10; (d) TC-S-40; (e) TU-D-10; (f) TU-D-40; (g) TU-S-10; (h) TU-S-40.
Figure 9.
Typical strain energy and axial stress time curves: (a) TC-D-10; (b) TC-D-40; (c) TC-S-10; (d) TC-S-40; (e) TU-D-10; (f) TU-D-40; (g) TU-S-10; (h) TU-S-40.


Figure 10.
Evolution of Ud/U with loading time under triaxial loading and unloading tests for dry and saturated sandstone specimens (a) TC-D; (b) TC-S; (c) TU-D; (d) TU-S.
Figure 10.
Evolution of Ud/U with loading time under triaxial loading and unloading tests for dry and saturated sandstone specimens (a) TC-D; (b) TC-S; (c) TU-D; (d) TU-S.

Figure 11.
Variation of the Ud/U values with the initial confining pressure for dry and saturated sandstone specimens at the critical failure point.
Figure 11.
Variation of the Ud/U values with the initial confining pressure for dry and saturated sandstone specimens at the critical failure point.


Table 1.
Mineral composition and grain size distribution of sandstone specimen.
| Rock Composition | Grain Size (mm) | Mineral Content (%) |
|---|---|---|
| Quartz | 0.03 ~ 0.2 | 77 |
| Potassium feldspar | 0.05 ~ 0.2 | 10 |
| Calcite | 0.01 ~ 0.08 | 7 |
| Sericite | 0.01 ~ 0.02 | 4 |
| Others | 0.01 ~ 0.1 | 2 |
Table 2.
Test scheme and physical parameters of sandstone specimens.
| Group | Specimen No. | Density (kg/m3) | P-Wave Velocity (m/s) | Initial Confining Pressure (MPa) | Unloading Point (MPa) | Loading Rate | Unloading Rate (MPa/min) |
|---|---|---|---|---|---|---|---|
| TC-D | TC-D-0 | 2387.3 | 2951 | 0 | 0.1 mm/min | ||
| TC-D-10 | 2380.4 | 2979 | 10 | 0.1 mm/min | |||
| TC-D-20 | 2387.5 | 2916 | 20 | 0.1 mm/min | |||
| TC-D-30 | 2398.3 | 3063 | 30 | 0.1 mm/min | |||
| TC-D-40 | 2382.1 | 3077 | 40 | 0.1 mm/min | |||
| TC-S | TC-S-0 | 2456.8 | 3381 | 0 | 0.1 mm/min | ||
| TC-S-10 | 2459.8 | 3363 | 10 | 0.1 mm/min | |||
| TC-S-20 | 2464.1 | 3362 | 20 | 0.1 mm/min | |||
| TC-S-30 | 2459.7 | 3393 | 30 | 0.1 mm/min | |||
| TC-S-40 | 2450.0 | 3392 | 40 | 0.1 mm/min | |||
| TU-D | TU-D-10 | 2380.7 | 3299 | 10 | 0.8σ(10) | 0.1 mm/min-1.5 MPa/min | 3 |
| TU-D-20 | 2391.3 | 3292 | 20 | 0.8σ(20) | 0.1 mm/min-1.5 MPa/min | 3 | |
| TU-D-30 | 2387.8 | 3315 | 30 | 0.8σ(30) | 0.1 mm/min-1.5 MPa/min | 3 | |
| TU-D-40 | 2391.3 | 3313 | 40 | 0.8σ(40) | 0.1 mm/min-1.5 MPa/min | 3 | |
| TU-S | TU-S-10 | 2454.7 | 3396 | 10 | 0.8σ(10) | 0.1mm/min-1.5 MPa/min | 3 |
| TU-S-20 | 2457.7 | 3347 | 20 | 0.8σ(20) | 0.1 mm/min-1.5 MPa/min | 3 | |
| TU-S-30 | 2457.8 | 3349 | 30 | 0.8σ(30) | 0.1 mm/min-1.5 MPa/min | 3 | |
| TU-S-40 | 2457.7 | 3399 | 40 | 0.8σ(40) | 0.1 mm/min-1.5 MPa/min | 3 |
Table 3.
Critical strain values of sandstone specimens at the unloading point and the critical failure point of sandstone specimens.
Table 3.
Critical strain values of sandstone specimens at the unloading point and the critical failure point of sandstone specimens.
| Group | Specimen Number | Unloading Point | Critical Failure Point | ||||||
|---|---|---|---|---|---|---|---|---|---|
| TC-D | TC-D-10 | 10 | - | - | - | 10 | 0.0110 | −0.0084 | −0.0058 |
| TC-D-20 | 20 | - | - | - | 20 | 0.0136 | −0.0085 | −0.0034 | |
| TC-D-30 | 30 | - | - | - | 30 | 0.0156 | −0.0118 | −0.008 | |
| TC-D-40 | 40 | - | - | - | 40 | 0.0218 | −0.0166 | −0.0114 | |
| TC-S | TC-S-10 | 10 | - | - | - | 10 | 0.0118 | −0.0124 | −0.013 |
| TC-S-20 | 20 | - | - | - | 20 | 0.0137 | −0.0122 | −0.0107 | |
| TC-S-30 | 30 | - | - | - | 30 | 0.0180 | −0.0104 | −0.0028 | |
| TC-S-40 | 40 | - | - | - | 40 | 0.0185 | −0.0100 | −0.0015 | |
| TU-D | TU-D-10 | 10 | 0.0063 | −0.0012 | 0.0039 | 1.52 | 0.0077 | −0.0080 | −0.0083 |
| TU-D-20 | 20 | 0.0082 | −0.0025 | 0.0032 | 14.82 | 0.0137 | −0.0116 | −0.0095 | |
| TU-D-30 | 30 | 0.0088 | −0.0019 | 0.005 | 15.51 | 0.0123 | −0.0104 | −0.0085 | |
| TU-D-40 | 40 | 0.0096 | −0.0022 | 0.0052 | 20.01 | 0.0145 | −0.0135 | −0.0125 | |
| TU-S | TU-S-10 | 10 | 0.0063 | −0.0017 | 0.0029 | 4.56 | 0.0085 | −0.0095 | −0.0105 |
| TU-S-20 | 20 | 0.0086 | −0.0020 | 0.0046 | 10.56 | 0.0103 | −0.0134 | −0.0165 | |
| TU-S-30 | 30 | 0.0082 | −0.0025 | 0.0032 | 19.73 | 0.0118 | −0.0100 | −0.0082 | |
| TU-S-40 | 40 | 0.0082 | −0.0018 | 0.0046 | 21.61 | 0.0137 | −0.0136 | −0.0135 | |
Table 4.
Strain energy of sandstone specimens at the unloading point and the critical failure point in triaxial test.
Table 4.
Strain energy of sandstone specimens at the unloading point and the critical failure point in triaxial test.
| Group | (MPa) | Unloading Point | Critical Failure Point | ||||||||
|---|---|---|---|---|---|---|---|---|---|---|---|
| U(MJ/m3) | U1(MJ/m3) | Ue(MJ/m3) | Ud(MJ/m3) | U3(MJ/m3) | U’(MJ/m3) | U1’(MJ/m3) | Ue’(MJ/m3) | Ud’(MJ/m3) | U3’(MJ/m3) | ||
| TC-D | 10 | - | - | - | - | - | 0.85 | 1.01 | 0.41 | 0.43 | −0.17 |
| 20 | - | - | - | - | - | 1.31 | 1.62 | 0.73 | 0.59 | −0.33 | |
| 40 | - | - | - | - | - | 1.80 | 2.54 | 0.84 | 0.95 | −0.79 | |
| 60 | - | - | - | - | - | 2.52 | 3.75 | 1.02 | 1.50 | −1.30 | |
| TC-S | 10 | - | - | - | - | - | 0.66 | 0.90 | 0.32 | 0.34 | −0.25 |
| 20 | - | - | - | - | - | 0.95 | 1.40 | 0.44 | 0.50 | −0.48 | |
| 40 | - | - | - | - | - | 1.60 | 1.98 | 0.56 | 0.94 | −0.82 | |
| 60 | - | - | - | - | - | 1.62 | 2.40 | 0.62 | 0.99 | −0.85 | |
| TU-D | 10 | 0.33 | 0.35 | 0.31 | 0.02 | −0.02 | 0.45 | 0.50 | 0.33 | 0.12 | −0.06 |
| 20 | 0.59 | 0.66 | 0.53 | 0.06 | −0.10 | 0.83 | 1.13 | 0.55 | 0.27 | −0.36 | |
| 40 | 0.75 | 0.82 | 0.61 | 0.13 | −0.11 | 1.01 | 1.34 | 0.66 | 0.35 | −0.37 | |
| 60 | 0.89 | 1.01 | 0.74 | 0.15 | −0.17 | 1.35 | 1.98 | 0.83 | 0.52 | −0.69 | |
| TU-S | 10 | 0.26 | 0.28 | 0.24 | 0.02 | −0.03 | 0.36 | 0.48 | 0.24 | 0.12 | −0.12 |
| 20 | 0.38 | 0.43 | 0.32 | 0.06 | −0.08 | 0.52 | 0.85 | 0.34 | 0.18 | −0.35 | |
| 40 | 0.54 | 0.64 | 0.41 | 0.10 | −0.15 | 0.71 | 1.15 | 0.46 | 0.25 | −0.48 | |
| 60 | 0.59 | 0.66 | 0.42 | 0.17 | −0.15 | 0.85 | 1.48 | 0.50 | 0.36 | −0.70 | |
© 2019 by the authors. Licensee MDPI, Basel, Switzerland. This article is an open access article distributed under the terms and conditions of the Creative Commons Attribution (CC BY) license (http://creativecommons.org/licenses/by/4.0/).
Share and Cite
MDPI and ACS Style
Li, D.; Sun, Z.; Zhu, Q.; Peng, K. Triaxial Loading and Unloading Tests on Dry and Saturated Sandstone Specimens. Appl. Sci. 2019, 9, 1689. https://doi.org/10.3390/app9081689
AMA Style
Li D, Sun Z, Zhu Q, Peng K. Triaxial Loading and Unloading Tests on Dry and Saturated Sandstone Specimens. Applied Sciences. 2019; 9(8):1689. https://doi.org/10.3390/app9081689
Chicago/Turabian StyleLi, Diyuan, Zhi Sun, Quanqi Zhu, and Kang Peng. 2019. "Triaxial Loading and Unloading Tests on Dry and Saturated Sandstone Specimens" Applied Sciences 9, no. 8: 1689. https://doi.org/10.3390/app9081689
Note that from the first issue of 2016, this journal uses article numbers instead of page numbers. See further details here.