Grid Trading System Robot (GTSbot): A Novel Mathematical Algorithm for Trading FX Market


1
ADG Central R&D Group, STMicroelectronics S.r.l., 95121 Catania, Italy
2
IPLAB, Department of Mathematics and Computer Science, University of Catania, 95121 Catania, Italy
3
GIURIMATICA Lab, Department of Applied Mathematics and LawTech, 97100 Ragusa, Italy
*
Author to whom correspondence should be addressed.
Appl. Sci. 2019, 9(9), 1796; https://doi.org/10.3390/app9091796
Submission received: 7 March 2019
/
Revised: 23 April 2019
/
Accepted: 27 April 2019
/
Published: 29 April 2019
(This article belongs to the Special Issue Advanced Bio-Inspired Mathematical Modeling and Machine Learning Algorithms for Quantitative Finance Applications)
Abstract
:Grid algorithmic trading has become quite popular among traders because it shows several advantages with respect to similar approaches. Basically, a grid trading strategy is a method that seeks to make profit on the market movements of the underlying financial instrument by positioning buy and sell orders properly time-spaced (grid distance). The main advantage of the grid trading strategy is the financial sustainability of the algorithm because it provides a robust way to mediate losses in financial transactions even though this also means very complicated trades management algorithm. For these reasons, grid trading is certainly one of the best approaches to be used in high frequency trading (HFT) strategies. Due to the high level of unpredictability of the financial markets, many investment funds and institutional traders are opting for the HFT (high frequency trading) systems, which allow them to obtain high performance due to the large number of financial transactions executed in the short-term timeframe. The combination of HFT strategies with the use of machine learning methods for the financial time series forecast, has significantly improved the capability and overall performance of the modern automated trading systems. Taking this into account, the authors propose an automatic HFT grid trading system that operates in the FOREX (foreign exchange) market. The performance of the proposed algorithm together with the reduced drawdown confirmed the effectiveness and robustness of the proposed approach.
1. Introduction
Algorithmic trading is a novel operating mode that involves the use of powerful automated algorithms, known as trading robots or expert advisors, which help traders on monitoring the specific market conditions in order to identify the best opportunities for buying or short selling the traded instruments. According to the specific rules properly processed by the aforementioned trading robots, an order may be opened or not. In particular, the trading robot may suggest to define specific stop loss and/or a certain take profit level in order to maximize the performance and minimize the losses or the overall drawdown. At the same time, the adopted algorithmic trading could decide to close an operation or to manage the grid of trading operations in case this type of approach is adopted. In this context, the aim of this work is to show an innovative grid trading algorithm able to negotiate on the complex OTC (over the counter) market. Basically a grid trading strategy is a financial technique for which market operations of the same sign are opened (all long or all short) appropriately spaced from each other (grid orders) until the overall balance of the whole operations (including all opened trades) reaches the desired gain. The distance between one trade and the next characterizes the radius of the grid, which can be defined statically or dynamically. The main advantage of the grid trading systems is the financial sustainability because if the trading system incorrectly determines the direction of the trend, the opening of other positions at the same direction (grid orders) will serve to average the loss while, conversely, if the trend prediction system correctly determines the trend direction, opening more positions will allow to quickly reach the desired profit target. Obviously, a direct consequence of this strategy is linked to the need to get sufficient funds in the securities account that are able to cover the total financial exposure due to several transactions opened simultaneously in counter-trend. Therefore the aforementioned financial sustainability of the grid trading approach had to be related to the funds available in the trading account. As reported the introduced grid approach will be used in the OTC financial instruments. In the OTC market, especially if the CFD (contract for differences) instruments are traded, the transactions are not carried out on the official market because the provider broker became your trading counterpart [1]. One of the most traded instruments in the OTC market is the so-called FOREX (foreign exchange)—also known as FX market—showing the dynamic occurring in the decentralized international financial market in which investors and speculators provide for the conversion of one currency to another [1].
Until a few years ago, before the explosion of the online trading, FOREX trading was the exclusive domain of large financial institutions. Nowadays, online trading platforms have opened up the market to all small investors who would like to buy or short sell currencies, especially the CFD instrument that follow the real market exchanged currency [1].
The main advantage of the FOREX OTC market is mainly related to its high liquidity as well as to its practically uninterrupted worldwide trading activity as it starts, for each week, on the late night of Sunday and it will be closed on Friday late night of the same week. According to current GMT fixing, forex trading hours is performed around the major financial exchanges in the world such as the New York Stock Exchange between 01:00 pm–10:00 pm GMT while at 10:00 pm GMT Sydney Exchange comes online; Tokyo opens at 00:00 am and closes at 09:00 am GMT; and to complete the loop, London opens at 08:00 am and closes at 05:00 pm GMT. Consequently, the FOREX market has no central location for the trading operations and currency traders make predictions based on global economic indicators and each FOREX broker proposes a quotation strictly based on current market value.
Despite that the foreign exchange market is highly efficient, it offers significantly reduced profit opportunities with respect to other financial markets because of high volatility and unpredictability of the underlying currency. In fact, currency markets are strongly affected by monetary policies and central bank interventions, which leads such market inefficiencies difficult to model by means of mathematical approaches so it is difficult to properly forecast. For the reasons expressed up to now, the authors have designed a proper algorithm for addressing the mentioned FOREX market inefficiencies in order to increase the overall performance of the trading system rather, taking advantage of the strengths of the forex market, which as mentioned are to be found in the high liquidity of the market.
In Section 2 we introduce the prior art about the automatic trading systems especially related to FX market. An overview about our proposed pipeline will be discussed in Section 3. Section 4 will present the results, validation and benchmark comparison of the proposed approach. Finally, in Section 5 we present the conclusions and future works.
2. Related Works
Many approaches have been developed in the scientific literature in order to forecast stock market behavior. In particular heuristic science that takes the name of technical analysis has been widely applied for addressing financial problems and for making effective trading strategies [2]. However, the results of applying technical analysis to financial markets are quite weak in terms of both performance and drawdown so that recently this approach has been significantly improved by means of advanced financial mathematical modeling as well as by means of innovative and powerful machine learning algorithms [2].
In recent years, neural networks have become popular in the technical analysis field in order to predict the financial market. Specifically, their ability to extract complex nonlinear and interactive effects makes them very powerful for modeling nonlinear economic relationships. According to this, there are many recent works about the usage of neural networks in addressing financial issues that are worth considering in relation to the interesting results to which they came. One of the most recent papers is [3] in which Rundo et al have carefully investigated the usage of an advanced machine learning platform for a financial time-series forecast. Specifically, they combined a multi Long Short Term Memory (LSTM) framework with an ad-hoc adaptive trading strategy for building efficient investment algorithm. The results seems very promising in the mid-term timeframe. In [4] the authors implemented an agent-based approach to provide a robust forecast of the trading behavior in high-frequency markets. The described method has been tested mainly on EUR/USD currency with intraday trading timeframe. The authors in [4] showed very promising results in terms of FX dynamic financial market forecast easily applicable in such automatic trading systems. In [5] the authors proposed an interesting method of a high frequency trading system based on the usage of neural networks trained via recurrent reinforcement learning (RRL). In general, the trading systems with deep neural networks trained via RRL reached very interesting results, even though the performance varies widely according to the traded currency markets. A very interesting approach was proposed in [6] in which the authors presented such strategies based on the usage of common technical indicators used for defining heuristic rules to make profitable the developed trading strategies. They considered reinforcement learning and genetic programming (GP) trading strategies as well as computational learning approaches, providing an interesting comparison benchmark of the analyzed approaches.
3. GTSbot: The Proposed Pipeline
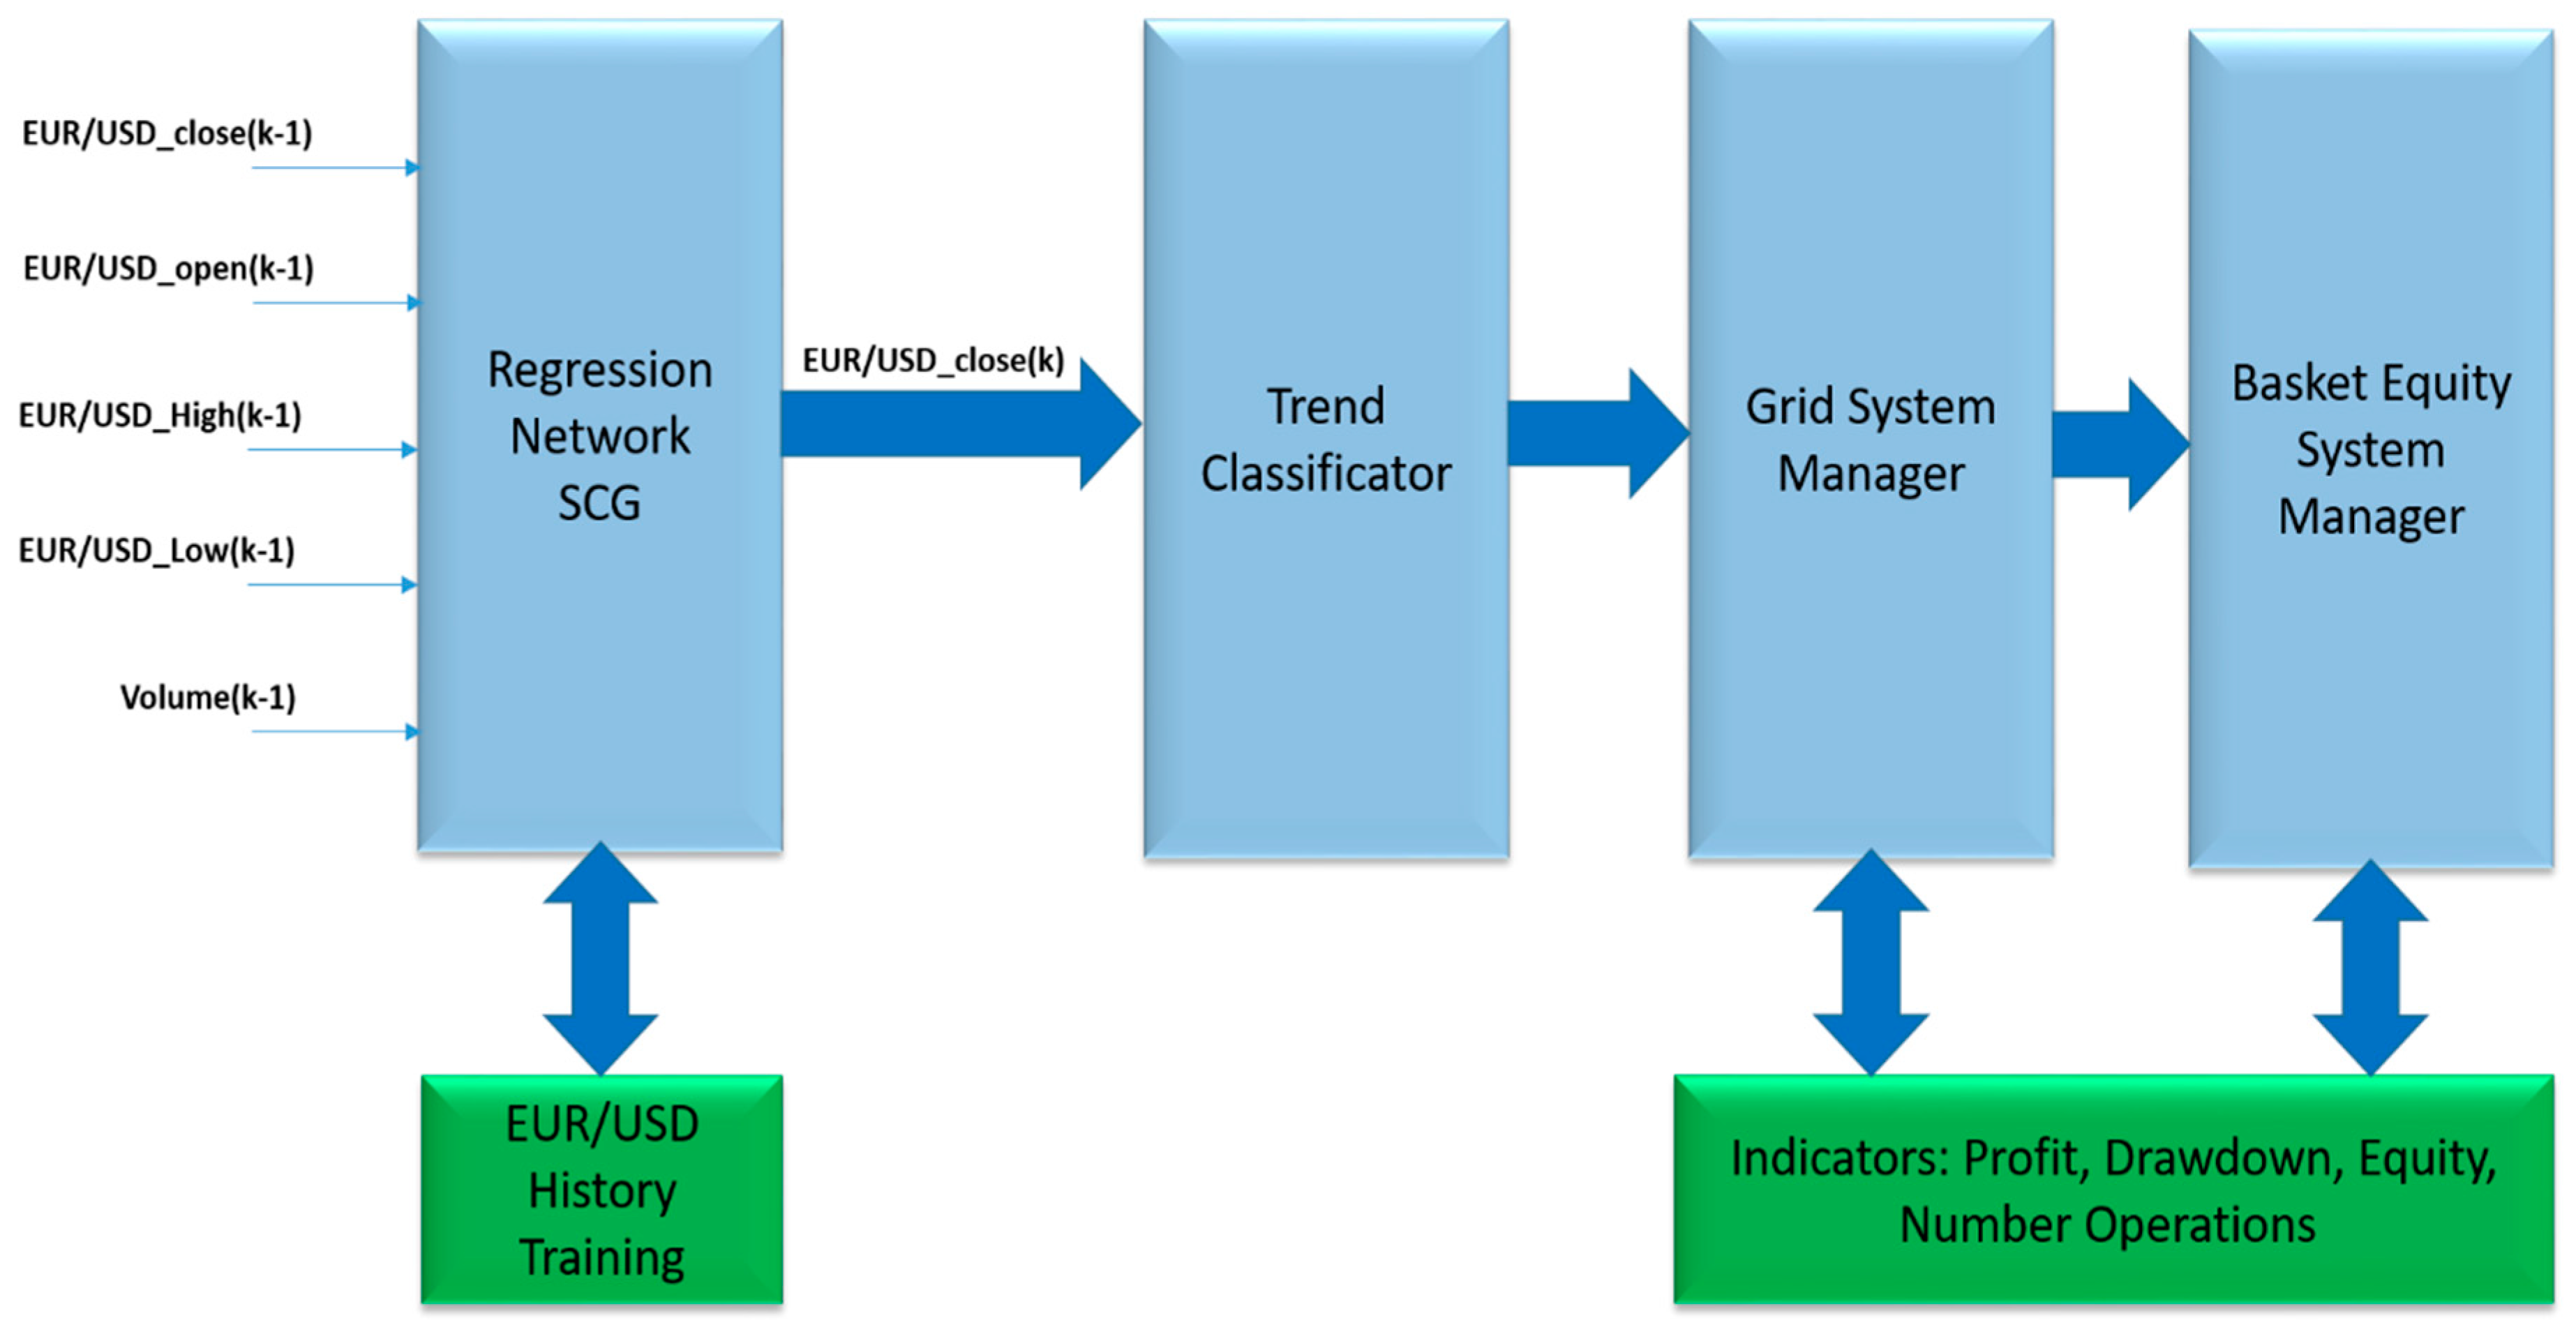
As described in the previous section, in this paper the authors proposed an innovative profitable grid trading system for the FOREX market, which, therefore, bring all together the advantages of each part of the described pipeline, i.e., the performance and efficiency of the grid algorithms, the capability of recent machine learning tools and the high liquidity of the FOREX market. In Figure 1, the authors reported an overall representation of the proposed pipeline.
As previously introduced, the target of the pipeline showed in Figure 1 was to propose an innovative trading algorithm that exploits the capability of the grid methodology together with the HFT approaches. A brief introduction of the pipeline scheme highlighted in Figure 1 was reported. Preliminarily, like any trading system, it appears propaedeutic to determine the trend of the instrument to be traded so as to define the direction of the financial transaction (long or short or null operation in the case of no well-defined trend). For this task, the authors proposed the use of a non-linear “Regression Network” for instrument close price forecast, together with a “Trend Classifier” block that on the basis of analytical predictions performed by the regression network, estimates the most probable short-term financial trend. At this point, the proposed system will take care of autonomously organizing the trading grid by evaluating the current state of trading such as the opened transactions of the same sign as the opposite sign, the current drawdown, balance of the trading account, opening constraints, etc. These evaluations will be performed by the “Grid System Manager” block illustrated in Figure 1. For the correct evaluation of the performance of the trading system, the authors suggested the use of a block called “Basket Equity System Manager” that will deal with evaluating and monitoring the financial exposure of the trading grid, therefore, to close all positions as soon as the system reaches a pre-established target profit.
The proposed approach was implemented and designed for high frequency trading (HFT). Particularly, we performed trading strategies on the FX market considering 1 min (one minute) timeframe EUR/USD currency cross. We collected the EUR/USD currency data from the Tickstory Database [7], which exports historical data with 99.9% accuracy. Specifically, we have collected the following currency prices EUR/USD data: Open, close, high and low as well as the volume in a 1 min timeframe. In order to validate the proposed method, the training and testing data were selected from latest five years of EUR/USD quotations. Each of the referred blocks in Figure 1 will be detailed in the following sections.
3.1. GTSbot: Regression Network SCG
The purpose of the regression network scaled conjugate gradient block (SCG) is to forecast EUR/USD currency close price using previous pricing data such as open, close, low, high and the volume of exchanged currency shares. As described in the previous section, machine learning and deep learning are widely used in the field of automatic trading systems development as well as for addressing a lot of financial issues including time-series forecast [3]. As it is well known in literature, the financial time-series are highly unpredictable in the mid-long-term timeframe while they showed a fair predictability in the short-term [3]. Considering that, the proposed approach has been designed to be integrated into a high frequency trading (HFT) system in order to improve the overall predictability of the financial trend. In the method herein described, the authors proposed a classical feed-forward regression neural network in combination with a modified back-propagation (BP) method known as scaled conjugate gradient (SCG) BP algorithm. The core idea of the SCG algorithm is included on the classical conjugate gradient methods (CGM), i.e., a class of optimization techniques that allow for minimizing the second derivative of the used learning goal function [8]. From a general point of view, the neural network learning procedure is equivalent to minimizing a well-defined performance error function, which is basically a function that depends on the weights of the network. For these reasons, the neural network learning phase often involves the adjustment of several thousands of weights so that optimization methods are relevant to reduce the overall learning complexity.
Most of the mentioned optimization methods are based on the same strategy. They try to minimize the performance error function by means of a local iterative process in which an approximation (usually trough a first order Taylor series expansion of the performance error function) in a neighborhood of the current point (in the weight space) is applied in order to search a minimum of the performance error function. Basically, for each interaction “k”, the learning algorithm determines a search direction for which the global performance error function, at interaction “k”, is lower with respect to the previous value at interaction “k-1”. Once the search direction has been found we have to decide how far to go in the specified search direction, i.e., a step size has to be determined. Some algorithms propose to set the search direction to the negative gradient direction (the so called “gradient descent algorithm”) as they usually occur in most of the back-propagation learning algorithms described in the literature [8].
The recalled conjugate gradient methods are also based on the above general strategy with the only exception being the choice of the search direction and step size are performed by using information from the second order Taylor expansion approximation of the performance error (the so called Hessian matrix). This means that performance error is basically a quadratic function. Well, by means of specific mathematical proprieties of the quadratic functions [8], the CGM algorithms assures that the global minimum is detected in a reduced number of iterations with respect to a classical gradient descent-BP algorithm. Anyway, for each learning iteration, the Hessian matrix has to be computed considerably increasing the computational complexity of the algorithm. In the SCG algorithm this complexity is reduced by means of an estimation and approximation of the Hessian matrix for which it will no longer be necessary to calculate each matrix coefficients at each iteration but rather it will be possible to proceed with an estimation, evaluating in any case the goodness of this approximation by means of some heuristic parameters and checks. This result can be obtained by applying the Levenberg-Marquardt approach to the conjugate gradient methods [8]. Obviously, for these reasons the SCG algorithm requires only O(N) memory usage and O(NlogN) of learning complexity (against O(N2) and O(N2logN) of classical BP algorithm, respectively) where N is the number of used neural weights in the network [8]. According to this, we implemented a SCG BP neural network composed by five neurons in the input layer, 500 neurons in the hidden layer and one neuron in the output layer. The output is the predicted currency cross close price. As reported in [8], the SCG BP neural network achieves effective results in terms of fast convergence even if it shows some drawbacks in terms of regression performance [8]. Anyway, the purpose of our pipeline consisted in predicting the trend in the short-term timeframe and not the exact close price. In Figure 2, an instance of the EUR/USD forecasted close prices for a subset of days on January 2018 is reported.
In Figure 2 and Figure 3 represented the regression performance showed by the used SCG BP neural network, which was not optimal while on the other hand it was evident the ability of the used neural network to predict the trend of the traded currency.
Future works aims of improving the performance of the SCG BP regression block in forecasting the currency close price. We are analyzing the application of ad-hoc cross currencies correlation analysis [9] or by replacing the SCG BP neural network with recent deep neural network architectures such as Stacked AutoEncoders, Convolutional Neural Networks (CNNs) or Long Short Term Memory neural networks (LSTMs) [10].
3.2. GTSbot: Trend Classification Block
The output of the regression network SCG block (the predicted currency close price) was used to estimate the most probable trend of the traded financial currency cross. In a classical 1 min (one minute) intraday trading timeframe, there are n close price quotations so that if we denote the close price to be the predicted at k-time (by the SCG BP neural network), then we define the following relationship (1):
We denoted as the regression map function of the SCG regression network block. At the next step, the trend classification block (TCB) provided an estimation of the current financial trend performing the following check:
Basically, the TCB performs ad-hoc fast mathematical analysis of the financial currency time-series acquired from the broker quotations. More in detail, the TCB system performs careful analysis of the first and second derivative of the collected FX cross time-series and the predicted close price at (k+1)-time. It can be noted that, if the first derivative is greater than an empirically defined threshold (defined equal to the broker spread), then the trend increases over time (long trend). To confirm this we needed to check whether the sign of the second derivative, which is a robust measure of the concavity of the acquired time-series curve. If both conditions were true, the TCB confirmed the long trend or short trend, otherwise. If at least one of the above check failed (i.e., the first and second derivative did not show same mathematical behavior), it was enough to indicate that the trend was not well determined, therefore, no operation was suggested. For the mathematical computation of the first and the second derivative, we used the Equations (3) and (4), respectively.
In Figure 4 an instance of the trend prediction made by TCB is reported, both for the long trend as well as for the short ones.
We tested the described trend forecast algorithm over EUR/USD currency historical data (as said: Latest five years (2014–2018)) at 1 min timeframe. From our experimental results, the TCB was able to forecast the trend with an accuracy of 73.2%.
3.3. GTSbot: Grid System Manager Block
The aim of this block was to open a grid-trading scheme according to the predicted trend as per the algorithm inside the previously described TCB. As already stated, if the trend predicted was null, the system would not perform any operations. The grid system manager (GSM) block performed a long operation if the TCB estimated the long trend while it performed a short operation if the TCB estimated a short trend. In the first case, we bought the FX cross, while in the second case we decided to perform a short selling of the FX currency. The FX market price at which the GSM performed the operation was the available open currency price. Anyway the GSM block performed the specified operation if and only if the grid condition was also verified. The grid condition represented the additional constraint in the GSM block we had designed to build a robust and effective trading framework for the proposed pipeline. According to the trend estimation from TCB, the GSM block performed a careful check of the current status of the trading acitivities. Figure 5 shows the workflow followed by the GSM block. The first target of the GSM block was a further deep analysis of the estimated trend made by TCB. If TCB returned the null trend, the GSM block workflow jumped to “No Operations” waiting for the next prediction made by the GSM block. Otherwise, if the long or short trend was detected by TCB, the GSM algorithm checked the overall number of opened operations in the current grid trading system. During the trading activities, a maximum number of operations (long and short) was defined, according to the available investment fund in our trading account. Consequently, the GSM block checked if the maximum number of operations was reached and it proceeded with the next check on the workflow, i.e., the grid distance. Obviously, if the system had already opened all the allowed operations, the GSM algorithm jumped to “No operations”. Instead, in case the maximum number of operations had not been reached in both the long and short trades, the GSM workflow checked the grid distance constraint, i.e., the minimum distance in number of samples (abscissa axis of the Figure 3) and in the currency price with respect to all opened trades with the same direction. Basically, the GSM block will open a trade (long or short) if and only if the x-distance and y-distance between the current FX cross price at which we want to open the trade and all the corresponding x-values and y-values we still had for each opened trades (with the same direction) was greater than the x-threshold and y-threshold we had defined in our GSM block. Figure 6 reports the described pipeline.
From the representation shown in Figure 6 we can better understand the working flow of the GSM block. In the detail of the financial time-series explored in Figure 6, the already opened operation was identified by the green circle. During the normal trading activity, the proposed algorithm proposed the opening of another long position represented by the red circle reported in Figure 6. However, the GSM block discarded this proposal as they were not respecting the grid conditions both in reference to the abscissa axis (distance x1) and in relation to the price value (distance y1) as they were both considerably below the pre-set thresholds. On the other hand, the subsequent proposal to open another long position (blue circle) was granted by the GSM block because it respected both the conditions relative to the grid distance with respect to the position already open (distance x2) and the condition relating to the distance of the price value (distance y2). Therefore, in the hypothesis that was in the example shown in Figure 6, the maximum number of operations had not been reached, the GSM block would confirm and execute the opening of the second long order proposal, characterized by the blue circle in detail in Figure 6. In this way, the GSM block would be able to open such trades in grid schemes and operations appropriately spaced from each other in order to average any wrong trades open against the real trend. The heuristically defined x-thresholds and y-thresholds allowed the prevention of several wrong trades very close to each other being opened by the GSM block. To confirm what has been said, we had tried the proposed approach disabling the checks performed by means of the mentioned x-thresholds and y-thresholds. Specifically, we had tried the grid trading system robot (GTSbot) system without the x-threshold based check. The so modified algorithm had performed lower with respect to the same with the x-threshold check enabled. More in detail, we noticed a considerable increase in the drawdown (on average +25%) accompanied by a reduction in profit (−10% of daily profit in average). Similarly, with the y-threshold control disabled, we found a considerable increase in the drawdown (+18.3%) along with a reduction in daily profit (−11.25%). The above tests (performed in the scenarios reported in Table 1 and Table 2) confirmed the key role played by the x-thresholds and y-thresholds based checks in the proposed system.
This approach provides a simple and effective method to compensate any drawdown drifts due to wrong opened trades. We performed several tests in order to select a robust values of x-threshold and y-threshold as well as the maximum number of allowed operations with an intraday investment perspective. According to our experimental results, we decided to use the following values:
- x-threshold = 15 (candlestick, i.e., 15 min in a 1 min timeframe);
- y-threshold = 0.00020 (two pips according to FX 5-digits quotations);
- Maximum number of operations = 13.
The x-threshold set to 15 indicated that the GSM block did not open any operation if we have at least 15 samples (or candlesticks) of distance between each opened operation and new ones. Similarly, GSM block did not open any operations (long or short) if the FX cross quotation value at which we want to open a new trade was greater or lower (according to the type of operation if it was long or short, respectively) than the y-threshold with respect to all the prices at which previous trades (in the same directions) had been opened.
The used distance metric was the absolute distance. The FX cross quotation value was measured in pips, which was the standard unit for FX markets. The maximum number of allowed operations had been defined as an odd number because we want to avoid a perfect hedging condition in which we had a number of long trades exactly equal to short ones as the trading system became market neutral. Formerly, the GSM block would proceed opening a trade if (in the hypothesis of the defined trend detected by TCB):
Long trade:
Short trade:
where we have defined and as the x-threshold, y-threshold and maximum number of trades respectively while represents the current currency price at which we want to open a trade and represents the price at which we have already opened previous trades.
3.4. GTSbot: Basket Equity System Manager
The basket equity system manager (BESM) block is able to monitor the econometric balance of the trading account. This block performs at each quotation (according to the timeframe we have selected) the current monitoring of the overall balance indicators of the FX broker account we were using. It checks the drawdown, the account fund availability, net account availability, which is basically the total balance account deducted, the current drawdown and the operative margin amount the broker incoming for each opened trade (this value is strictly correlated to the adopted leverage, i.e., for a leverage 1:30 for each LOT FX trade, i.e., an investment of 100,000 US dollars; an amount of about 3000 US dollars is required as a margin withheld from the broker). By means of BESM block the proposed pipeline monitors the current status of the trading account according to the prefixed take profit and stop loss. In the proposed grid strategy, we avoided to use stop loss as the grid algorithm, as explained in the previous sections, was able to compensate for the drawdown, resulting in the opening of incorrect trades. Instead, we had defined a take profit as the amount of gain at which the BSEM block will close the basket trades (i.e., the set of all opened trades).
4. Results and Future Works
As already stated, we trained and tested our pipeline by using the EUR/USD FX spot currency cross quoted in the latest five years (2014–2018). Moreover, in order to provide a comparison with similar approaches applied to the FX market, we have downloaded 99.9% accuracy historical data of EUR/USD in the years 2004–2018. We used a 1 min timeframe quotation as we were interested in the HFT strategy consisting of the execution of several operations with intraday perspective. We downloaded historical currency data from the Tickstory database with 99.9% accuracy. We supposed a broker account with 30,000 US dollars as an initial balance and two pips of spread bid/ask (the spread is the average gain commission cashed by the broker). As said, we performed the described learning of the proposed machine learning framework (regression network SCG block) by means of 1 min FX EUR/USD time-series of day t1 to perform EUR/USD close pricing forecast for the next day t1+1. We supposed an account leverage of 1:400 (the broker requires about 300 US dollars as a margin for each LOT FX trade) and a LOT size for each single FX trade order.
We validated our proposed pipeline over all available years (from 2004 to 2018), performing several tests in which we have selected each time a different day, a different daily time-window, which means a different stock exchange. We collected the validation results providing a comparison with the following works made on the FX spot markets (from 2004 to 2011) [11]:
If we increased the risk (reducing the x-threshold and y-threshold to 5 and 0.00005, respectively) we obtained the following performance applying the proposed approach to the same historical data:
We have defined the financial performance indicators (return of investment ROI and maximum absolute value of drawdown MD) according the following Equations (7) and (8) [11]:
In order to validate the performance of the overall proposed system, we compared our method with a similar one [11]. As showed in Table 1 and Table 2, the ROI indicator we obtained was on average lower than the best performance of the method [11] if we increased the financial risk (MD) but on the other hand, our approach showed a good performance (ROI) if we maintained a reduced financial risk (MD). We have further extended the benchmark comparison of the proposed approach as reported in Table 3 and Table 4:
In Table 3 we reported an interesting comparison between the proposed approach with respect to similar ones applied in the FX markets. In [12] the authors reported the performance of an algorithm that uses classic technical analysis indicators to define an efficient trading strategy. Specifically, the authors in [12] proposed the use of a classic approach based on the analysis of the supports and resistances levels computed from the financial charts together with the trading signals provided by the “Ichimoku” indicator. Once again, it was evident that our approach, although not always able to outperform the method proposed in [12], was sustainable as the overall DrawDown (DD) did not exceed 9% and also does not use any technical indicators information that was often closely related to broker quotes, therefore, not always reliable.
Finally, in Table 4, the authors compared their proposed approach with another HFT pipeline [13]. In the following table, the best performance results reported in [13] are highlighted:
In [13] the authors propose a trading approach based on the computation of the so-called “Direction Changes” applied to the HFT context. Once again, from a comparison of the results shown in Table 4 it was clear that the method we had proposed determines an efficient trade-off between profitability and the sustainability level, highlighting a drawdown that was still limited against an acceptable performance comparable to that of that shown by the approach proposed in [13].
As explained in the previous sections, we were interested in developing a trading system that was financially sustainable as well as profitable which means, in few words, that we were more interested in a trading system that performed less than others but that did so by minimizing the financial risks. Figure 7 reports the GUI mask of the proposed algorithm (developed in MATLAB rel. 2018a running in a PC Intel Core i5 with a 32 Gb RAM and without GPU):
Future works will aim to integrate a cross-correlation method as implemented in [14] as well as getting the grid-scheme dynamically regulated through a common financial indicator such as the Sharpe ratio [15]. Moreover, we are investigating about the replacement of the used SCG regression neural network with a more efficient deeper LSTMs framework combined with ad-hoc hand-crafted signal features as some recent studies confirmed their capability on financial time-series forecasting.
5. Conclusions
In this paper, the authors showed the capability of an innovative trading algorithm based on a grid strategy and applied in the FOREX market. The stated objective of the proposed pipeline was to provide a methodology to combine the advantages of the FOREX market (high liquidity) with the grid strategy (financial sustainability) and artificial intelligence based methods. So, the desired target was to provide a trading algorithm that performed properly but with a contained financial risk (in terms of drawdown). The results reported in the previous section confirmed beyond any reasonable doubt that the proposed pipeline was able to achieve the proposed objectives, demonstrating excellent performance with limited financial risks. The validation of the proposed system with respect to similar algorithms confirmed what we had just been asserted. In the near future the authors intend to better analyze the recent machine learning techniques to improve trend forecast of the traded financial instrument. Furthermore, financial indicators are being evaluated to be used for the dynamic definition of the grid radius in order to optimize the algorithm’s performance.
Currently, the authors are investigating innovative machine learning based approaches that make the proposed system fully automated with specific reference to the choice of the maximum number of operations that can be performed in the grid, in the (adaptive) choice of x-thresholds and y-thresholds, in the choice of take profit as well as in the addition of an ad-hoc feedback mechanism coming from the BESM block in order to improve the robustness of the overall trading system.
Author Contributions
Conceptualization & Investigation, F.R.; Validation, F.T.; Writing-Review & Editing, S.B. and A.L.D.S.
Funding
This research received no external funding.
Conflicts of Interest
The authors declare no conflict of interest the results.
References
- Business Knowledge for IT in Prime Brokerage: A Complete Handbook for IT Professionals, 1st ed.; Essvale Corporation Limited: London, UK, 2008; p. 89.
- Lo, A.W.; Hasanhodzic, J. The Evolution of Technical Analysis: Financial Prediction from Babylonian Tablets to Bloomberg Terminals, 1st ed.; Bloomberg Press: Princeton, NJ, USA, 2011; p. 150. [Google Scholar]
- Rundo, F.; Trenta, F.; Di Stallo, A.L.; Battiato, S. Advanced Markov-Based Machine Learning Framework for Making Adaptive Trading System. Computation 2019, 7, 4. [Google Scholar] [CrossRef]
- Aloud, M.; Tsang, E. Modelling the trading behaviour in high-frequency markets. In Proceedings of the 2011 3rd Computer Science and Electronic Engineering Conference (CEEC), Colchester, UK, 13–14 July 2011. [Google Scholar] [CrossRef]
- Gold, C. FX trading via recurrent reinforcement learning. In Proceedings of the 2003 IEEE International Conference on Computational Intelligence for Financial Engineering, Hong Kong, China, 20–23 March 2003. [Google Scholar] [CrossRef]
- Dempster, M.A.H.; Payne, T.W.; Romahi, Y.; Thompson, G.W.P. Computational learning techniques for intraday FX trading using popular technical indicators. Trans. Neural Netw. 2001, 12, 744–754. [Google Scholar] [CrossRef] [PubMed]
- Tickstory—Historical Data & Resources for Traders. Available online: https://tickstory.com/ (accessed on 6 March 2019).
- Moller, M.F. A Scaled Conjugate Gradient Algorithm for Fast Supervised Learning. Neural Netw. 1993, 6, 525–533. [Google Scholar] [CrossRef]
- Ortis, A.; Rundo, F.; Di Giore, G.; Battiato, S. Adaptive Compression of Stereoscopic Images. In Image Analysis and Processing—ICIAP 2013. Lecture Notes in Computer Science; Petrosino, A., Ed.; Springer: Berlin, Germany, 2013; Volume 8156, pp. 391–399. [Google Scholar]
- Conoci, S.; Rundo, F.; Petralia, S.; Battiato, S. Advanced skin lesion discrimination pipeline for early melanoma cancer diagnosis towards PoC devices. In Proceedings of the 2017 European Conference on Circuit Theory and Design (ECCTD), Catania, Italy, 4–6 September 2017. [Google Scholar] [CrossRef]
- De Brito, R.F.B.; Oliveira, A.L.I. A foreign exchange market trading system by combining GHSOM and SVR. In Proceedings of the WCCI 2012 IEEE World Congress on Computational Intelligence, Brisbane, Australia, 10–15 June 2012. [Google Scholar] [CrossRef]
- Deng, S.; Sakurai, A. Short-term foreign exchange rate trading based on the support/resistance level of Ichimoku Kinkohyo. In Proceedings of the IEEE International Conference on Information Science, Electronics and Electrical Engineering, Sapporo, Japan, 26–28 April 2014; pp. 337–340. [Google Scholar]
- Ye, A.; Chinthalapati, V.L.R.; Serguieva, A.; Tsang, E. Developing sustainable trading strategies using directional changes with high frequency data. In Proceedings of the IEEE International Conference on Big Data (Big Data), Boston, MA, USA, 11–14 December 2017; pp. 4265–4271. [Google Scholar]
- Vinciguerra, V.; Ambra, E.; Maddiona, L.; Oliveri, S.; Romeo, M.F.; Mazzillo, M.; Rundo, F.; Fallica, G. Progresses towards a processing pipeline in photoplethysmogram (PPG) based on SiPMs. In Proceedings of the 2017 European Conference on Circuit Theory and Design (ECCTD, Catania, Italy, 4–6 September 2017. [Google Scholar] [CrossRef]
- Moody, J.; Wu, L. Optimization of trading systems and portfolios. In Proceedings of the IEEE/IAFE 1997 Computational Intelligence for Financial Engineering (CIFEr), New York, NY, USA, 24–25 March 1997; pp. 300–307. [Google Scholar] [CrossRef]
Figure 1.
The proposed grid trading system robot (GTSbot) pipeline: Overall scheme.

Figure 2.
The EUR/USD prices time-series (January 2018).

Figure 3.
(a) The EUR/USD real close time-series (red) vs EUR/USD forecasted close prices (black). (b,c) A detail of the forecasted close pricing (by the proposed scaled conjugate gradient back-propagation (SCG BP) neural network).
Figure 3.
(a) The EUR/USD real close time-series (red) vs EUR/USD forecasted close prices (black). (b,c) A detail of the forecasted close pricing (by the proposed scaled conjugate gradient back-propagation (SCG BP) neural network).


Figure 4.
The trend classification block: An instance of trend prediction (EUR/USD, January 2018).

Figure 5.
The grid system manager (GSM) block: The workflow.

Figure 6.
The GSM block: An instance of workflow (long trades).

Figure 7.
The GTSBot GUI interface. The first graphic on the top showed the dynamic real drawdown of the financial account. The second diagram showed the total profit being obtained. The third diagram showed a financial indicator known as the Sharpe ratio [12] that we used for monitoring financial dynamic of the trend.


Table 1.
Trading Performance Comparison.
| Experiment [11] | FX Currency Cross | ROI [11] | MD [11] | ROI (Proposed) | MD (Proposed) |
|---|---|---|---|---|---|
| Nr. 01 | EUR/USD | 60.77 | 21 | 94.11 | 11.25 |
Table 2.
Trading Performance Comparison.
| Experiment [11] | FX Currency Cross | ROI [11] | MD [11] | ROI (Proposed) | MD (Proposed) |
|---|---|---|---|---|---|
| Nr.01(10 Lots) | EUR/USD | 607.75 | 64.86 | 350.62 | 38.75 |
| Nr.01(10 Lots) | EUR/USD | 607.75 | 64.86 | 500.73 | 65.11 |
© 2019 by the authors. Licensee MDPI, Basel, Switzerland. This article is an open access article distributed under the terms and conditions of the Creative Commons Attribution (CC BY) license (http://creativecommons.org/licenses/by/4.0/).
Share and Cite
MDPI and ACS Style
Rundo, F.; Trenta, F.; di Stallo, A.L.; Battiato, S. Grid Trading System Robot (GTSbot): A Novel Mathematical Algorithm for Trading FX Market. Appl. Sci. 2019, 9, 1796. https://doi.org/10.3390/app9091796
AMA Style
Rundo F, Trenta F, di Stallo AL, Battiato S. Grid Trading System Robot (GTSbot): A Novel Mathematical Algorithm for Trading FX Market. Applied Sciences. 2019; 9(9):1796. https://doi.org/10.3390/app9091796
Chicago/Turabian StyleRundo, Francesco, Francesca Trenta, Agatino Luigi di Stallo, and Sebastiano Battiato. 2019. "Grid Trading System Robot (GTSbot): A Novel Mathematical Algorithm for Trading FX Market" Applied Sciences 9, no. 9: 1796. https://doi.org/10.3390/app9091796
Note that from the first issue of 2016, this journal uses article numbers instead of page numbers. See further details here.