Dynamic Response of Copper Plates Subjected to Underwater Impulsive Loading


1
State Key Laboratory of Explosion Science and Technology, Beijing Institute of Technology, Beijing 100081, China
2
Beijing Institute of Structure and Environment Engineering, Beijing 100076, China
3
School of Aerospace Engineering, Beijing Institute of Technology, Beijing 100081, China
*
Authors to whom correspondence should be addressed.
Appl. Sci. 2019, 9(9), 1927; https://doi.org/10.3390/app9091927
Submission received: 26 March 2019
/
Revised: 21 April 2019
/
Accepted: 6 May 2019
/
Published: 10 May 2019
(This article belongs to the Special Issue Advances in Digital Image Correlation (DIC))
Abstract
:Understanding the mechanical response and failure behaviors of thin plates under impact loading is helpful for the design and improvement of thin plate structures in practical applications. The response of a copper plate subjected to underwater impulsive loading has been studied in fluid-structure interaction (FSI) experiments. Three typical copper plates, (a) without a pre-notch, (b) with a cross-shaped pre-notch (+), and (c) with a ring-shaped pre-notch (○) were selected. A high-speed photography system recorded the full-field shape and displacement profiles of the specimens in real time. The 3D transient deformation fields’ measurements were obtained using a 3D digital image correlation (DIC) technique. Strain results from DIC and the strain gauges technique were in good agreement. A dimensionless deflection was used to analyze the effect of plate thickness and loading intensity on the deformation of the copper plates. The typical failure modes of different copper plates were identified. The test plates exhibited large ductile deformation (mode ) for copper plates without a pre-notch, and large ductile deformation with local necking (mode ), splitting (mode ), splitting and tearing (mode ), and fragment (mode ) for the copper plate with a pre-notch.
1. Introduction
Flat-panel structures that are widely used in naval assets and warships are sometimes affected by underwater explosions (UNDEX) because of, for example, torpedo attacks [1]. In the design and application of ships, small curvature hull panels with welded stiffeners can be considered flat-panels [2]. Currently, experimental and computational methods have been used to investigate the dynamic response of plate structures with different geometric dimensions and materials. However, the response of these structures to dynamic loading is not well understood. Due to high deformation rates and their corresponding short loading times and material nonlinearity, the structural dynamic response caused by an UNDEX is complex. Hence, it is difficult to accurately measure deformation fields in the dynamic response process of a metal plate subjected to underwater impulsive loading.
The material response to different loading rates has been examined through shock loading experiments. Ahmed et al. experimentally studied the large deformation behavior of hull panels subjected to an UNDEX [3]. Ramajeyathilagam et al. investigated the deformation and failure modes of thin rectangular plates and cylindrical shell panels through experimental and numerical methods [4,5,6]. The results showed that the pressure on the plate is approximated by Cole’s empirical formula and Taylor’s plate theory [7,8]. Hung et al. carried out studies on aluminum alloy plate underwater blast loading, and further measured the underwater pressure, acceleration, and strain histories on the plate [9].
Experimental measurements are affected by some uncertainties (pressure reflections, vibrations, etc.) because of the complex and hazardous nature of UNDEX, and therefore many experimental apparatuses incorporating fluid-structure interaction (FSI) effects have been developed. In recent years, a cylinder-shaped underwater shock simulator, in lieu of explosive detonation, was utilized by Espinosa et al. to produce shock loading on stainless steel similar to the loading generated in an UNDEX [10]. According to the study, the shock loading pressure generated in the water chamber can be independently controlled by changing the velocity and mass of the flyer plate. A combination of the shadow moiré technique and high speed photography was used to record the full deformation fields of steel plates. Mori et al. used this experiment setup to study the deformation and energy absorption performance of I Core sandwich structures [11]. Avachat et al. presented a similar experimental setup to investigate the effect of panel thickness on the dynamic response of composite sandwich plates [12]. A similar equivalent device was also designed by McShane et al. to load polymer-metal bilayer plates. They analyzed the influence of polymer coating and found four typical failure models [13].
With the current rapid development of the digital image correlation (DIC) method, the measurement of complex and inhomogeneous deformation fields has become relatively easy [14]. Pan et al. experimentally investigated the deformation and failure mechanisms of an aluminum panel and a stationary carbon fiber reinforced polymer (CFRP) panel under transient ballistic impact. Full-field 3D deformation has been measured by a single-camera high-speed stereo-DIC technique [15]. The development of high-speed photography technology has allowed 3D full-field deformation measurements using two high-speed digital cameras. Spranghers et al. applied a 3D DIC technique to measure the dynamic response of aluminum plates subjected to free air blast loading conditions and an explosively driven shock tube (EDST) [16,17]. These studies showed a different structural response, a linear elastic-plastic deformation, and elastic vibration for the free air blast loading and the EDST loading, respectively. Chen et al. studied the dynamic response of thin metal plates under confined air blasting loading, and measured 3D full deformation fields using the 3D DIC technique [18]. Aune et al. reported the structural response of thin steel and aluminum plates with different stand-off distances under air blasting [19]. These experimental investigations showed that thin plates experienced larger plastic deformation and the failure of supports. Tiwari et al. investigated full-field transient plate deformation measurements during buried blasting loading using the 3D DIC method. They well-defined yield boundaries on the plate surface were based on the Cowper-Symonds constitutive relation, with full-field strain and strain rate measurements [20]. Gagliardi et al. obtained blast-driven displacement measurements of an aluminum 6061-T6 plate as one side of an aquarium-like structures using a DIC system [21]. Arora et al. used high-speed photography and the DIC method to monitor the deformation and reveal the failure mechanism of glass-fiber reinforced polymer (GFRP) sandwich panels and laminate tubes during underwater shocks [22]. LeBlanc and Shukla carried out experimental and numerical investigations on the transient response of e-glass/vinyl ester curved composite panels subjected to underwater explosive loading using a 3D DIC system, along with high-speed photography [23,24]. Similar investigations on aluminum honeycomb sandwich panels in FSI experiments were reported by Xiang et al. [25]. Huang et al. performed an experimental study on dynamic deformation and failure modes of circular composite laminates, based on the processing of the 3D DIC method, and observed how the impulse intensity, thickness, and failure of panels clearly ly affect the response of laminate plates [26]. Shukla et al. presented a comprehensive summary review of recent underwater implosion studies on metallic cylindrical structures. These studies demonstrated that the 3D DIC technique can be used for accurate dynamic deformation measurements during underwater implosions [27]. Recently, there is increasing interest in the dynamic response and failure at the supports of materials subject to shock loading, but only limited studies have reported on metal panel and composite materials’ response to underwater impulses generated by FSI equipment. The microscopic damage mechanism of these materials under impact loading conditions is not well understood. The quantification of the response of these materials as a function of loading intensity has not yet been fully investigated. Studies on the effect of initial damage on failure modes of these materials to underwater impulses have been rarely reported.
This paper presents the transient responses and failure modes of clamped copper plates subjected to underwater shock loading. The shock pressure histories generated in FSI apparatus’ are well monitored. Two typical pre-notches are selected to evaluate the effect of pre-notches on the failure modes. A high-speed photography system with two cameras is applied to record real-time images of the copper plate. The time-resolved 3D full-field deformations are measured using the DIC technique. Visual observations and scanning electron microscope are carried out to identify the failure modes. A dimensionless deflection is performed to explain the effects of experimental conditions on the dynamic responses of circular plates subjected to underwater impulsive loading.
2. Experimental Configuration
2.1. DIC Method
The principle of DIC is based on the corresponding relationship between the speckled gray values in a rectangular area (subset) on an undeformed image (reference image) and a deformed image (target image) [28]. The deformation field of the subsets can be calculated by comparing a subset from a reference image with another subset from a target image [29,30]. The 3D DIC technique is based on the principles of stereo triangulation, whereby two imaging sensors can be used to reconstruct the stereo profile of a specimen, see Figure 1.
The principle diagram of the 3D stereo matching and displacement field is shown in Figure 1. Camera calibration is necessary to determine the relative position and internal distortion of two cameras before testing [21,31]. On the basis of the calibration results of both cameras, the left and right images are stereos matched to reconstruct the three-dimensional surface contour. Then, the deformed image is correlated to match with the corresponding reference image to obtain the 3D full-field displacement profile of the sample. Schmidt et al. believe that the sub-pixel accuracy of the out-of-plane measurement is approximately 0.03 pixels [32], while the in-plane measurement is more accurate, with a 0.01 pixel accuracy.
2.2. Experimental Details
A simplified FSI experimental setup was developed in a laboratory setting for resembling underwater explosive loading conditions by Xiang and Chen based on Espionosa’s work [10,24,33]. Figure 2 shows the schematic diagram of the FSI experimental setup. In the FSI setup, a steel water chamber is incorporated into a gas gun apparatus. The test copper plate and a steel piston are installed at the rear (left) end and the front end with an O-ring, respectively. A gas gun is used to drive a 5 mm thick flyer plate, to prompt the piston to produce the exponentially decaying pressure history. The impulsive pressure histories at A and B positions (the center and end) are measured by dynamic high-pressure transducers.
The material used in this study is ASTM C11000 copper. The mechanical properties of the material are obtained through open literature [34]. The density is 8930 kg/m3and the static tensile yield stress is 205 MPa.
The circular specimen plates with a diameter of 200 mm, as shown in Figure 3a, were clamped at the end of the anvil tube by a steel ring and 12 bolts. The plate is only restricted by a steel ring because the bolts do not pass through the plate. The diameter (D) of the specimen exposed to the water shock loading is 152.4 mm. The strain gauge is used to measure the in-plane components of strain, and is placed at a location 30 mm from the center O, as shown in Figure 3b. The three different thicknesses (T) of the copper plates are 1 mm, 2 mm, and 3 mm. In order to study the effect of initial damage of the plate on failure modes, except on a copper plate without pre-notch, two kinds of shapes of pre-notches, include cross (+) and ring (○), are prepared in the center of the specimens, see Figure 3c,d. The width (W) of the pre-notch is 1 mm, the lengths (L) of the cross-shaped pre-notches are 30 mm and 50 mm, the depths (H) are 0.5 mm and 1.5 mm, the depth and diameter (Dc) of ring-shaped pre-notches are 0.5 mm and 30 mm.
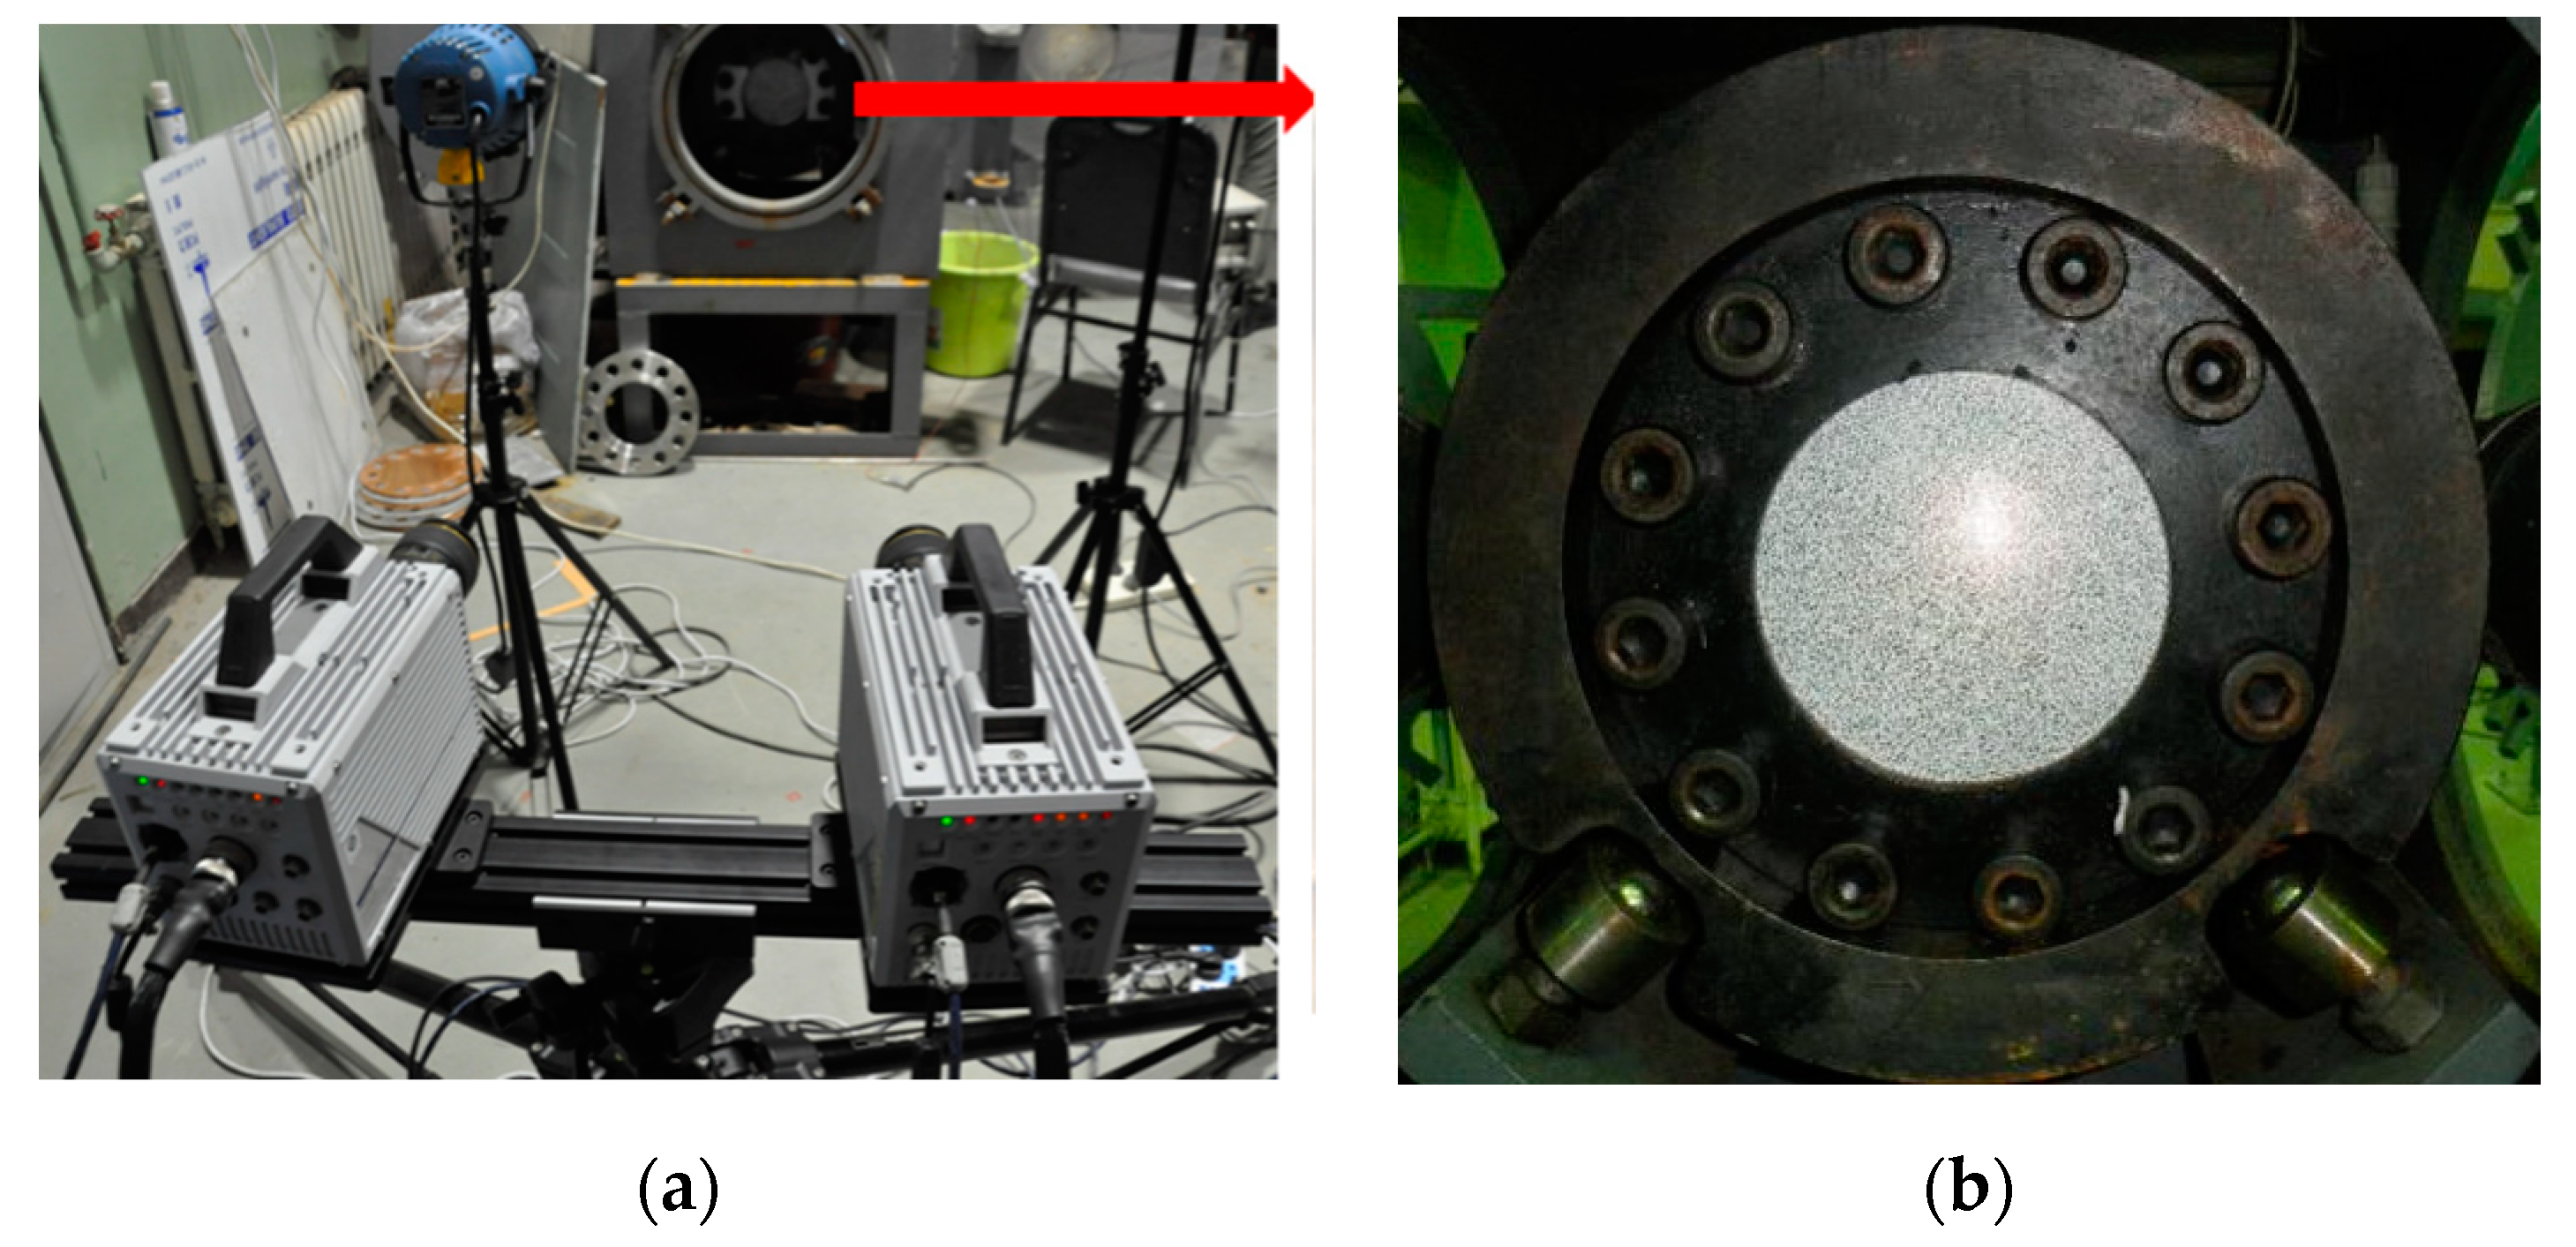
In the present study, a 3D DIC technique is used to capture the dynamic response of materials under shock loading. The deformation process of the outside surface of the copper plates was measured by 3D DIC measuring system, see Figure 2. Figure 4a shows the pictures of a 3D DIC measurement system consisting of two halogen lamps and two synchronized high-speed cameras in a stereoscopic setup. Two Photron Fastcam SA5 high-speed digital cameras (Photron Inc., Tokyo, Japan) were positioned behind the water chamber to record the speckles on the outside surface of the copper plate. The safety distance was about 0.8 m and each camera was angled at approximately 10° with respect to the symmetry plane. The power of the two halogen lamps as the lighting source is 1 kilowatt. The photography system is synchronically triggered by a laser trigger while the flyer impacting the piston. A framing rate of 50,000 frames per second (fps) is chosen in tests with an image resolution of 512 × 272 pixels. In order to study the fracture process of cross-shaped pre-notches, a higher framing rate of 75,000 fps is used with an image resolution of 320 × 264 pixels.
Figure 4b shows the specimen coated with a randomized speckle pattern. It is necessary to clean and polish the specimen surface before preparing a randomized speckle pattern. The speckle quality directly affects the accuracy of the measurement results. In order to gain a high contrast speckle pattern, the outside surface of the copper plate is painted white and then marked with random black points. A randomized speckle pattern can be considered perfect when the black speckle dots have a diameter of approximately 5 pixels as seen by the two cameras [35]. The post-processing is performed with the VIC-3D software package (Correlated Solutions, Inc., Columbia, SC, USA) to obtain the full-field measurement.
2.3. Underwater Pressure Peak and Impulse Estimation
The free-field incident UNDEX pulse in the fluid can be idealized as an exponential pressure attenuation:
where is the initial peak pressure and is a characteristic decay time [10]. The free-field momentum (impulse/area) can be given by
In the FSI setup, the peak pressure and impulse of the shock wave is given by
where and are the acoustic impedance values of the fluid and solid, is the flyer impact velocity, and and are the diameters of the tube at the impact and pressure prediction locations, respectively. is the number of wave reverberations in the flyer and is the time required for the elastic longitudinal wave to twice traverse the flyer plate.
In this investigation, the diameters of impact locations, the tube at location A and location B are 66 mm, 106 mm, and 142 mm, respectively. The acoustic impedance values of solids and fluids are 40.82 × 10⁶ kg/(s·m2) and 1.46 × 10⁶ kg/(s·m2). Therefore, the peak pressure values at the two pressure transducer locations A and B can be simplified as follows:
3. Results and Discussion
3.1. Pressure Results
The typical pressure profiles of the A1# test at positions A and B are shown in Figure 5. The profiles were obtained using a flyer plate with a thickness of 5.0 mm and a launching velocity of 158.3 m/s. At position A, the recorded pressure history showed similar characteristics to that of the free-field incident UNDEX pulse, i.e., short rise time, a peak value of about 84.9 MPa, and subsequent exponential pressure decay. On the pressure profile at position B, the peak pressure is about 50.4 MPa (Figure 5b) and the reflective wave is observed as a second peak at about 250 μs.
The peak pressures at position A and B are calculated using Equations (5) and (6), respectively. The results are summarized in Table 1. It is clearly shown that the errors of peak pressure at positions A and B are all below 9%. Due to energy attenuation, the experimental peak pressures at position A are lower than the predicted value, but the experimental peak pressures at position B are higher than the predicted value, because of the stack of reflection waves.
3.2. Specimens without Pre-Notches
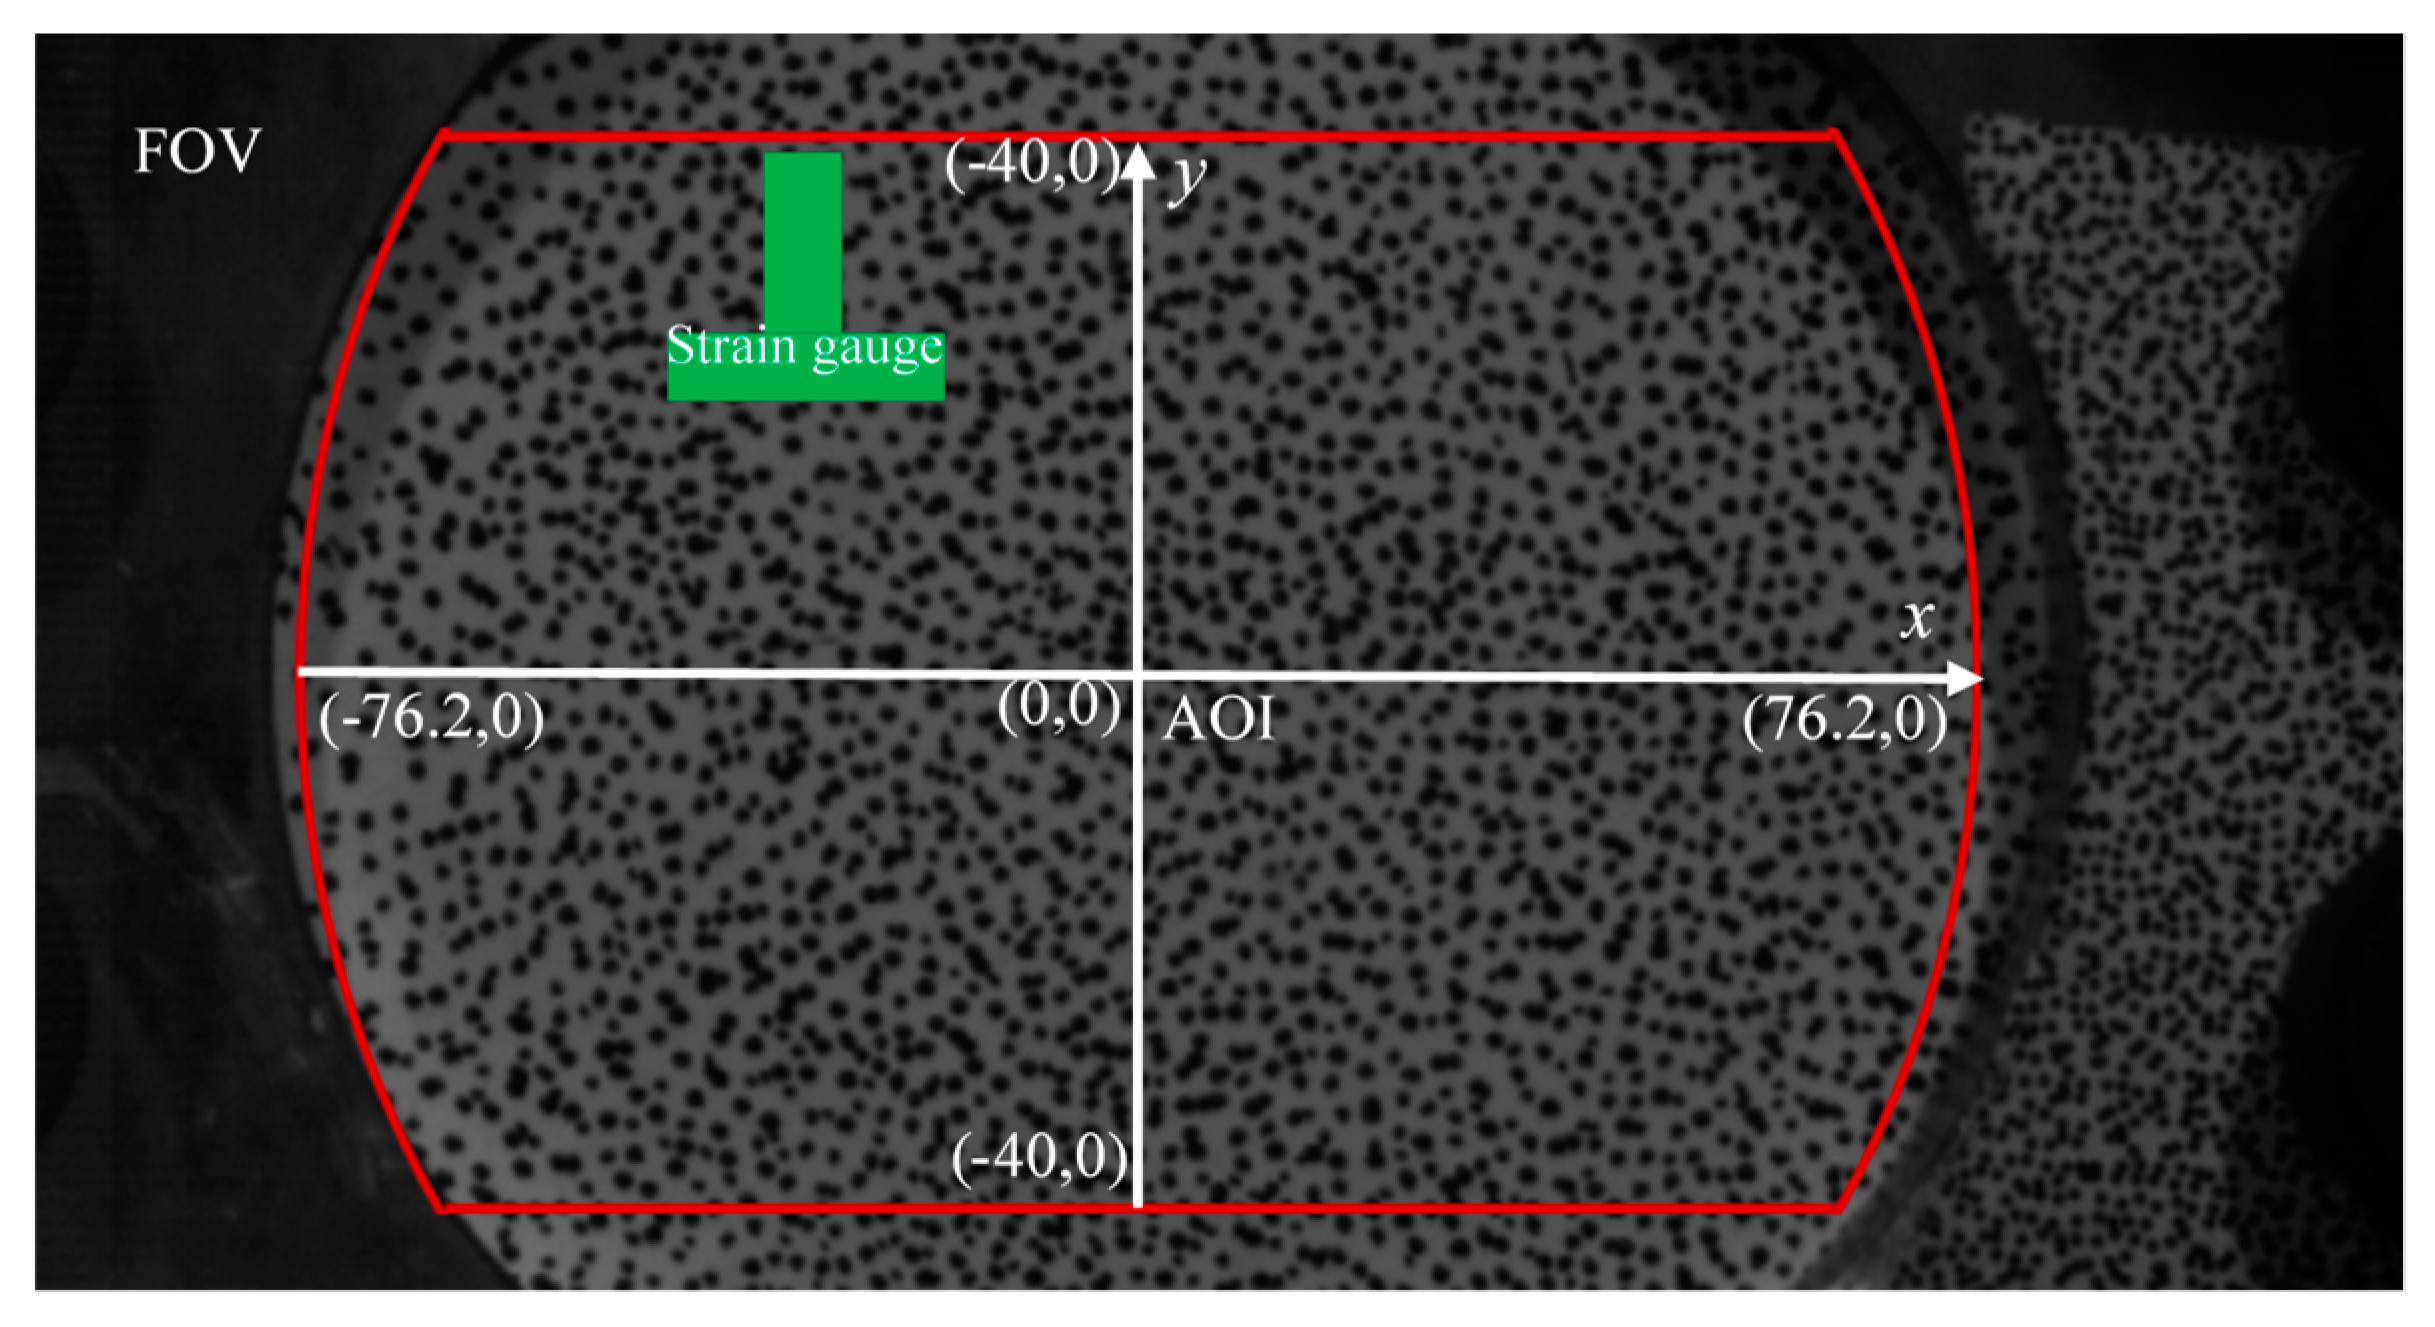
As shown in Figure 6, a reduced area surrounded by the red line at the specimen center was selected as the AOI (area of interest) to obtain full-field deformation. The green region corresponding to the strain gauges cannot be correlation calculated, because of the speckle lack.
Figure 7 shows the out-of-plane displacement fields of the A5# specimen (T = 1 mm, V0 = 46.6 m/s) at different time steps. The major component is the out-of-plane displacement (δ). The shock wave acts on the internal surface of the copper plate as a plane shock wave during the early period. More shock waves act on the plate boundary, bringing the clear displacement ring up to 0.08 ms, then the displacement increases from the boundary to the center of the plate until 0.4 ms. Note that the deformable contour exhibits an approximately planar circular shape in the first 0.4 ms, and evolves into a symmetric dome shape after 0.48 ms.
The out-of-plane displacement and velocity profiles along the x-axis are shown in Figure 8. Notice that the profiles are plotted from −60 to 70 mm, while the boundary is located between −76.2 and 76.2 mm. As indicated in Figure 8a, the plate is forced to move out of the plane underwater shock wave. The displacement is first produced at the boundary region (see lines from 0.02 ms to 0.24 ms), the shape after deforming of the plate is approximately symmetrical and is almost constant until 0.14 ms. The plate continues to deform when the pressure of the shock wave has vanished. At 1.52 ms, the displacement reaches its maximum at the center first, and then rebounds at 2.24 ms, due to elastic recovery.
Particles close to the boundary are constrained and have a very limited initial velocity. The plate has the same given velocity at 0.02 ms. From this moment on, the velocity increases from the boundary to the center, because of the centripetal radial flow of water. The outside surface obtains a maximum deformation velocity of 34.1 m/s at 0.42 ms (see Figure 8b), and then presents attenuation of velocity repeatedly. The inertia forces cause the plate to be further deformed.
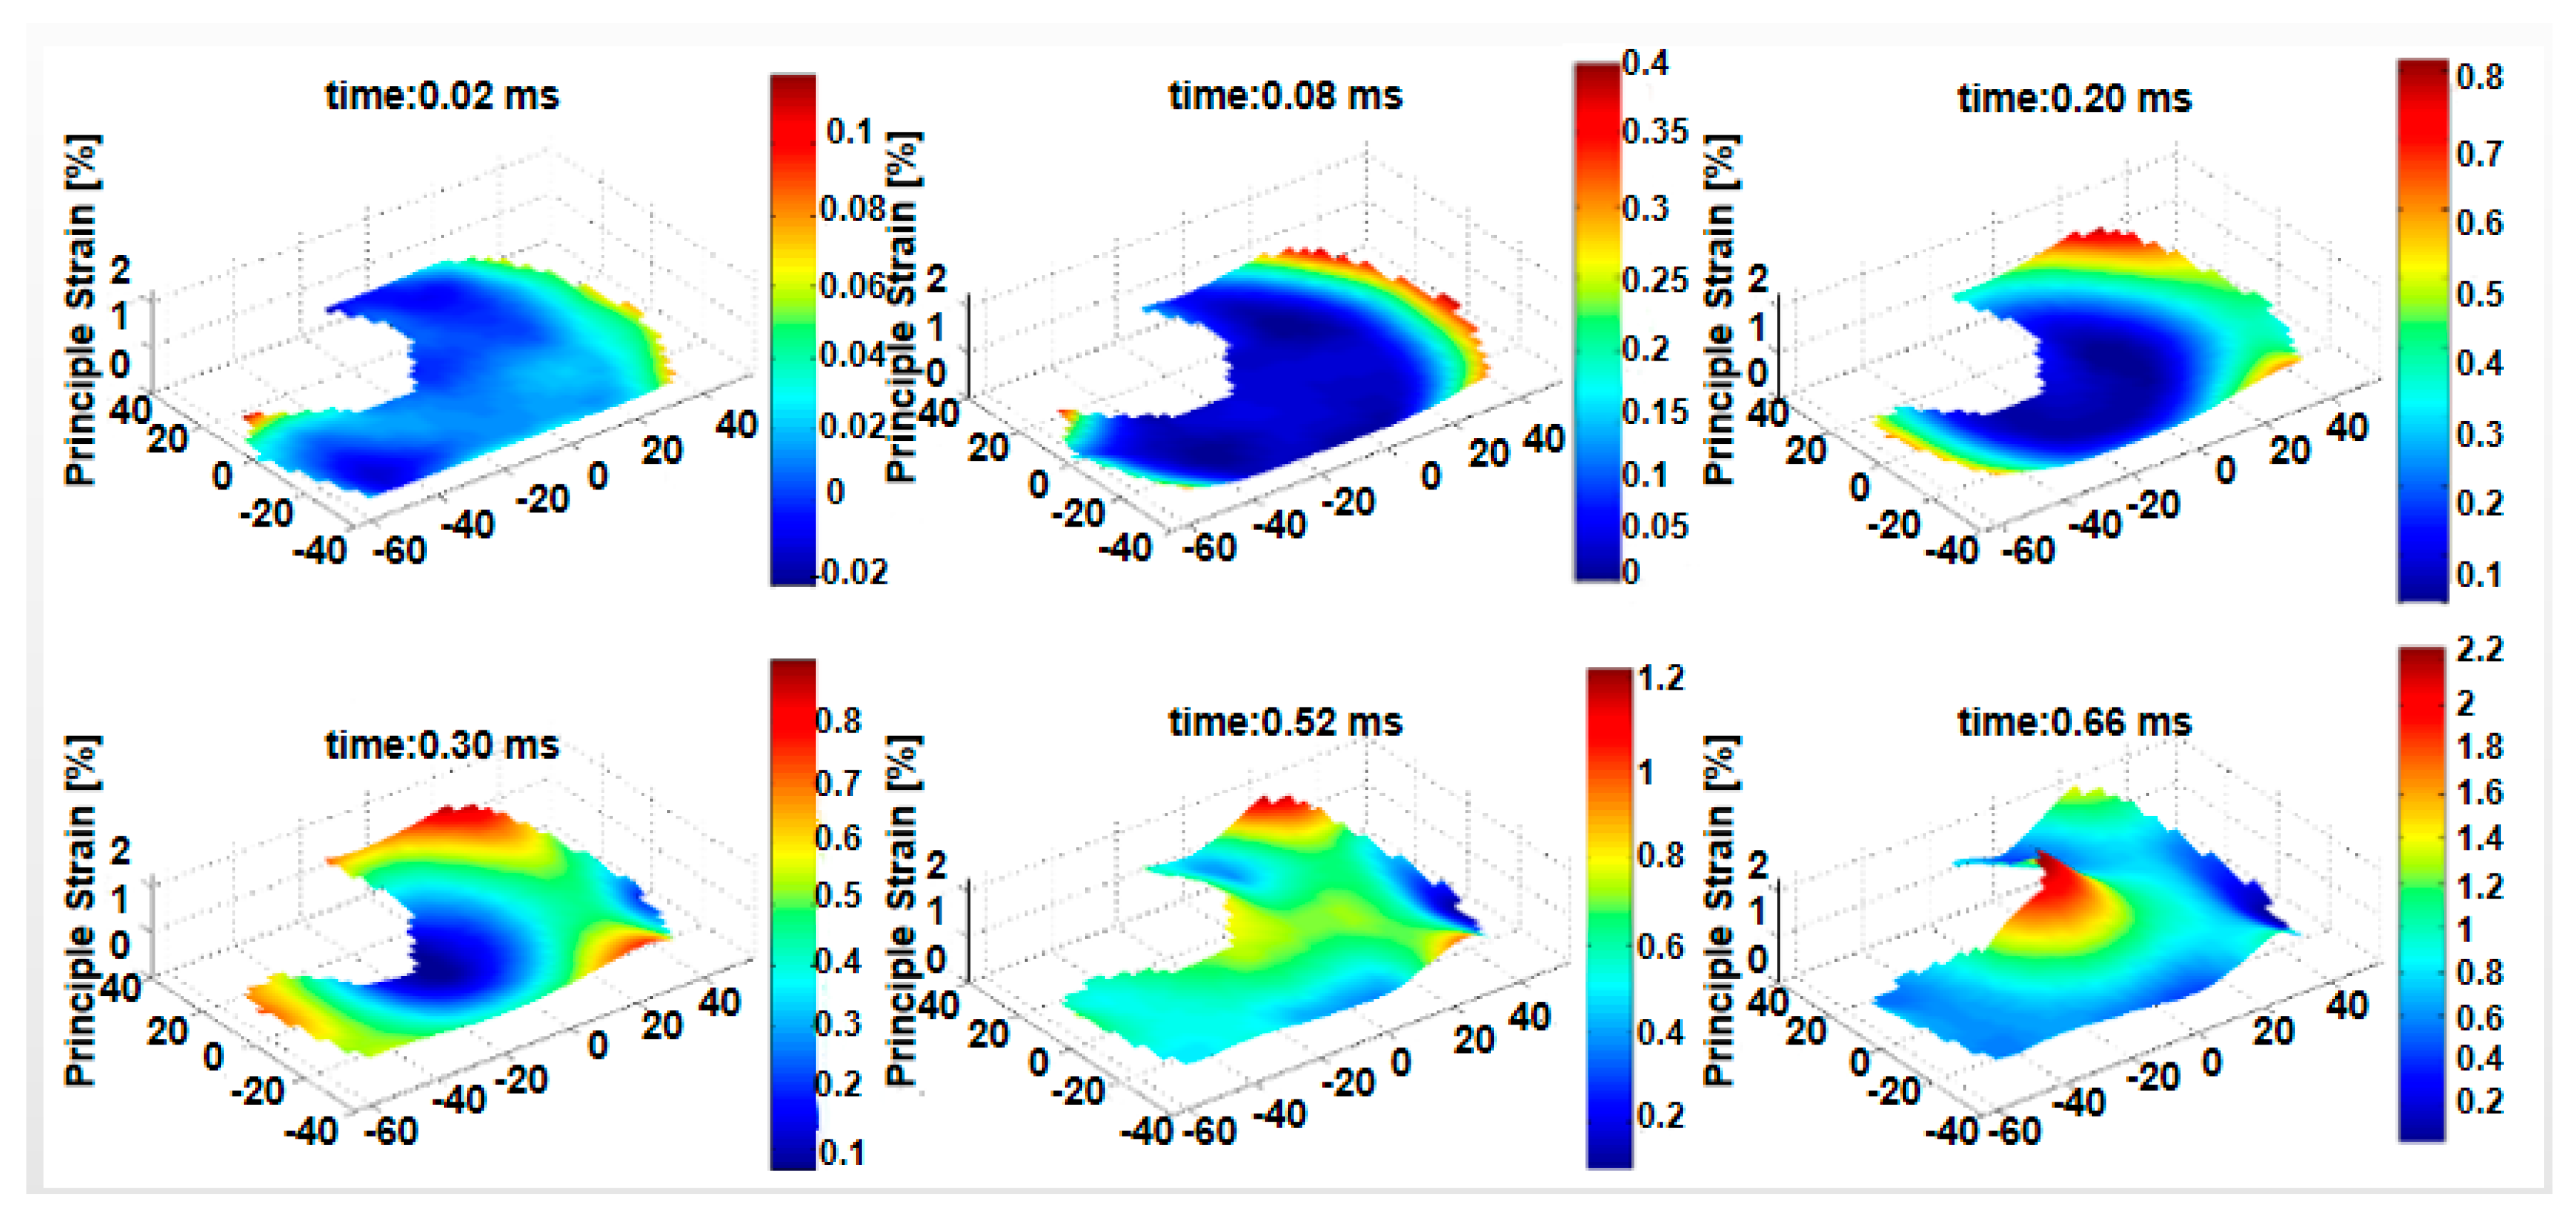
Figure 9 presents the evolution of the in-plane maximum principal strain fields of the A5# specimen at different time steps. It is found that higher principal strain appeared close to the boundaries until 0.30 ms, because the plate’s borders are constrained by steel flange. Further, due to the interaction of the inertia forces and refection waves, strain develops towards the center of the plate, and reaches a maximum value at 0.66 ms.
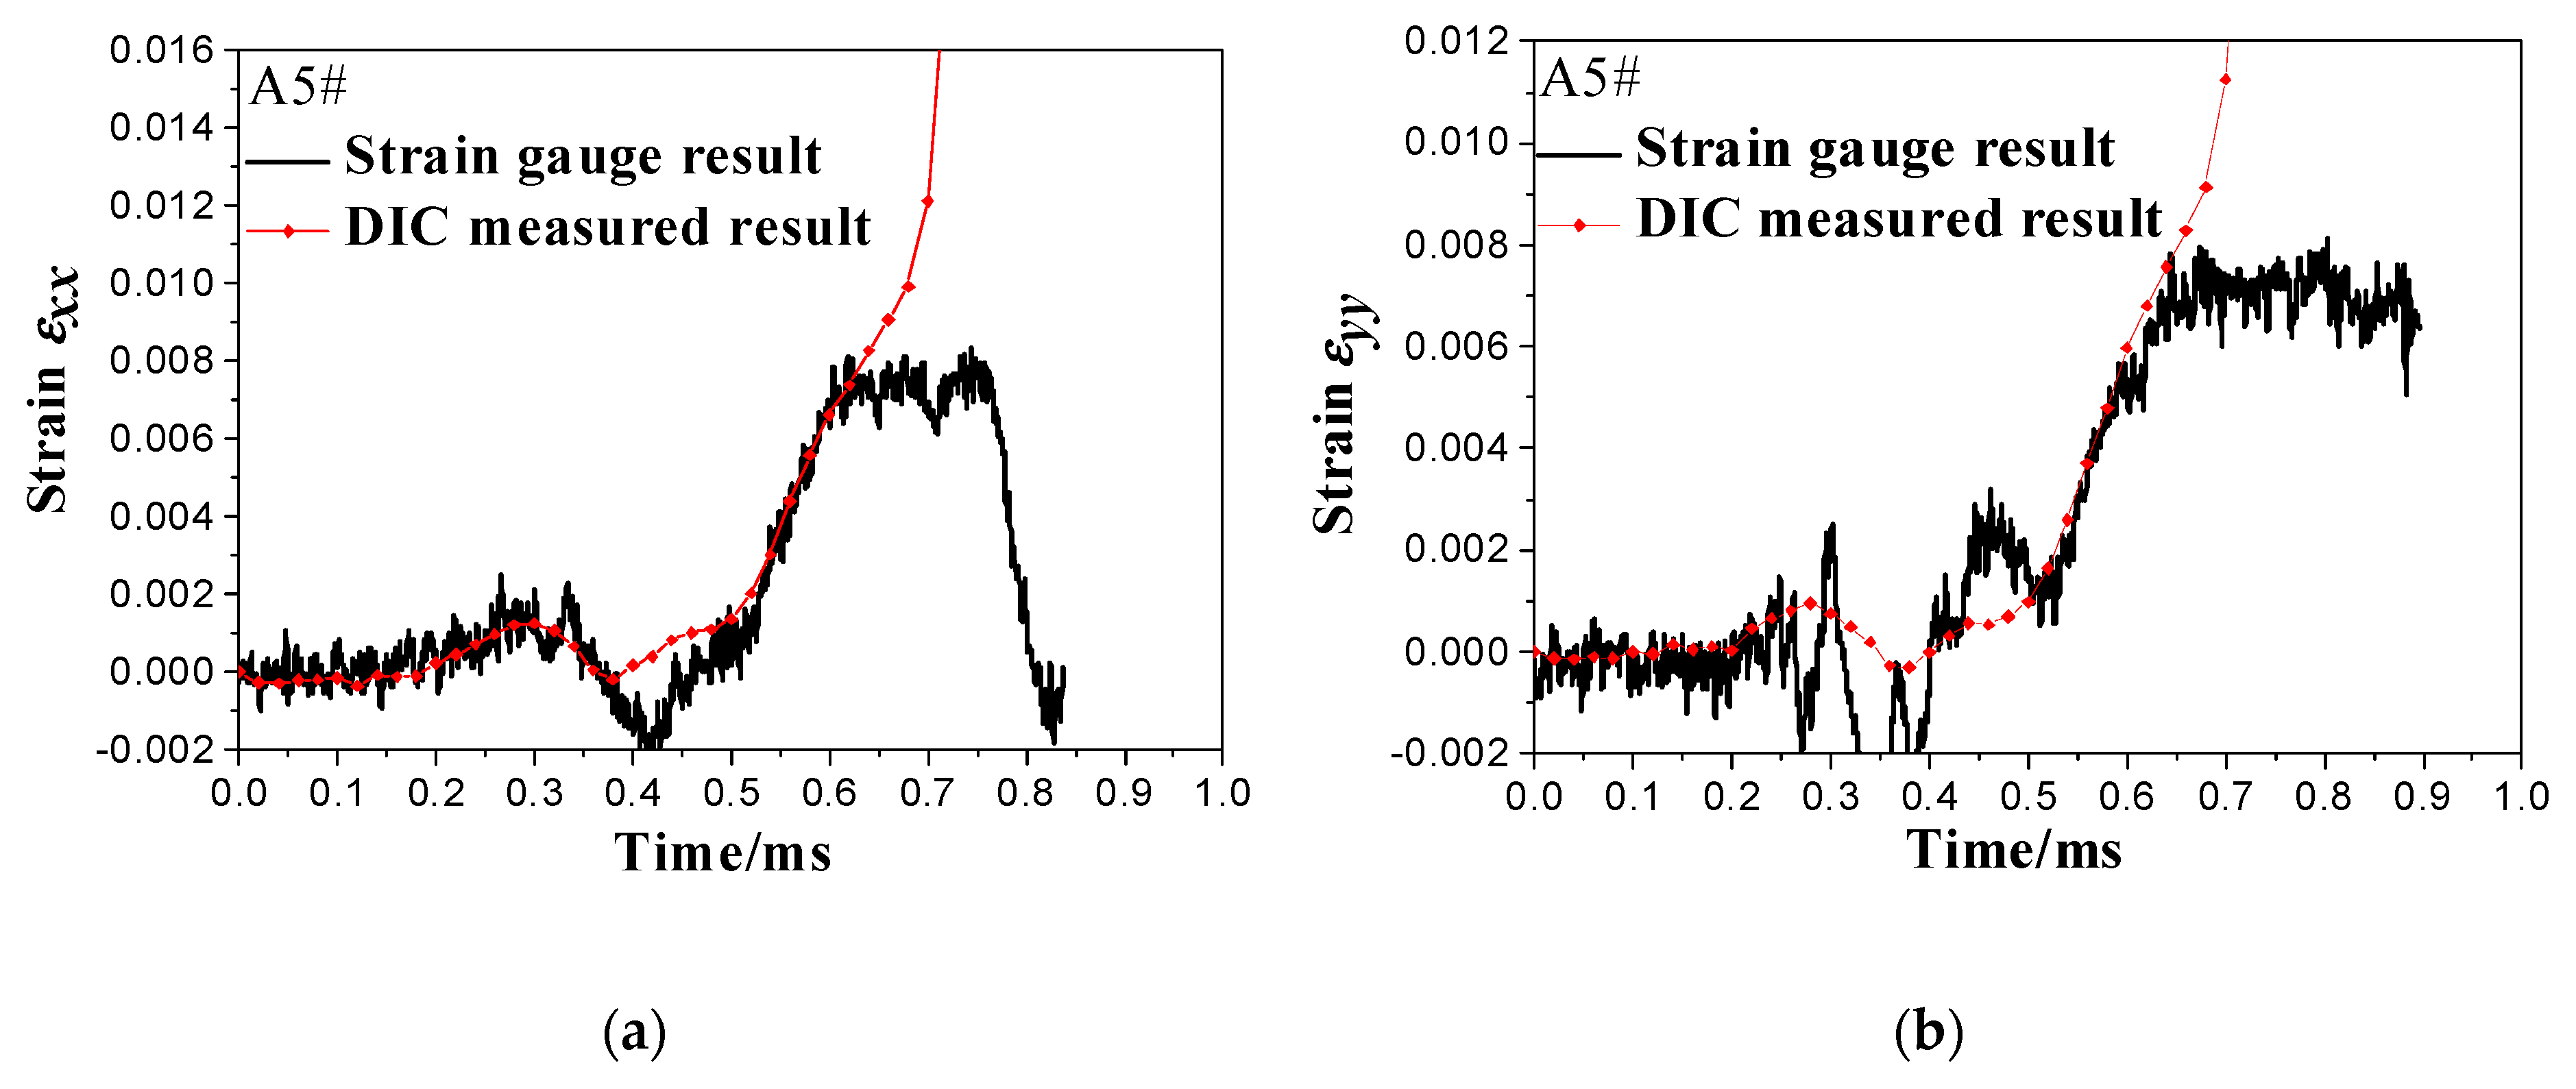
The comparison of strain histories measured by the DIC and strain gauges (see Figure 3b) are shown in Figure 10. The DIC results are obtained from strain data of the corresponding symmetric points. The evolution trends of the two history curves are similar. It can be seen that results from DIC and strain gauges show a good agreement in the initial growth stage until 0.6ms. From this moment on, strain gauges falling off from the sample cause strain curves to stop rising and start falling.
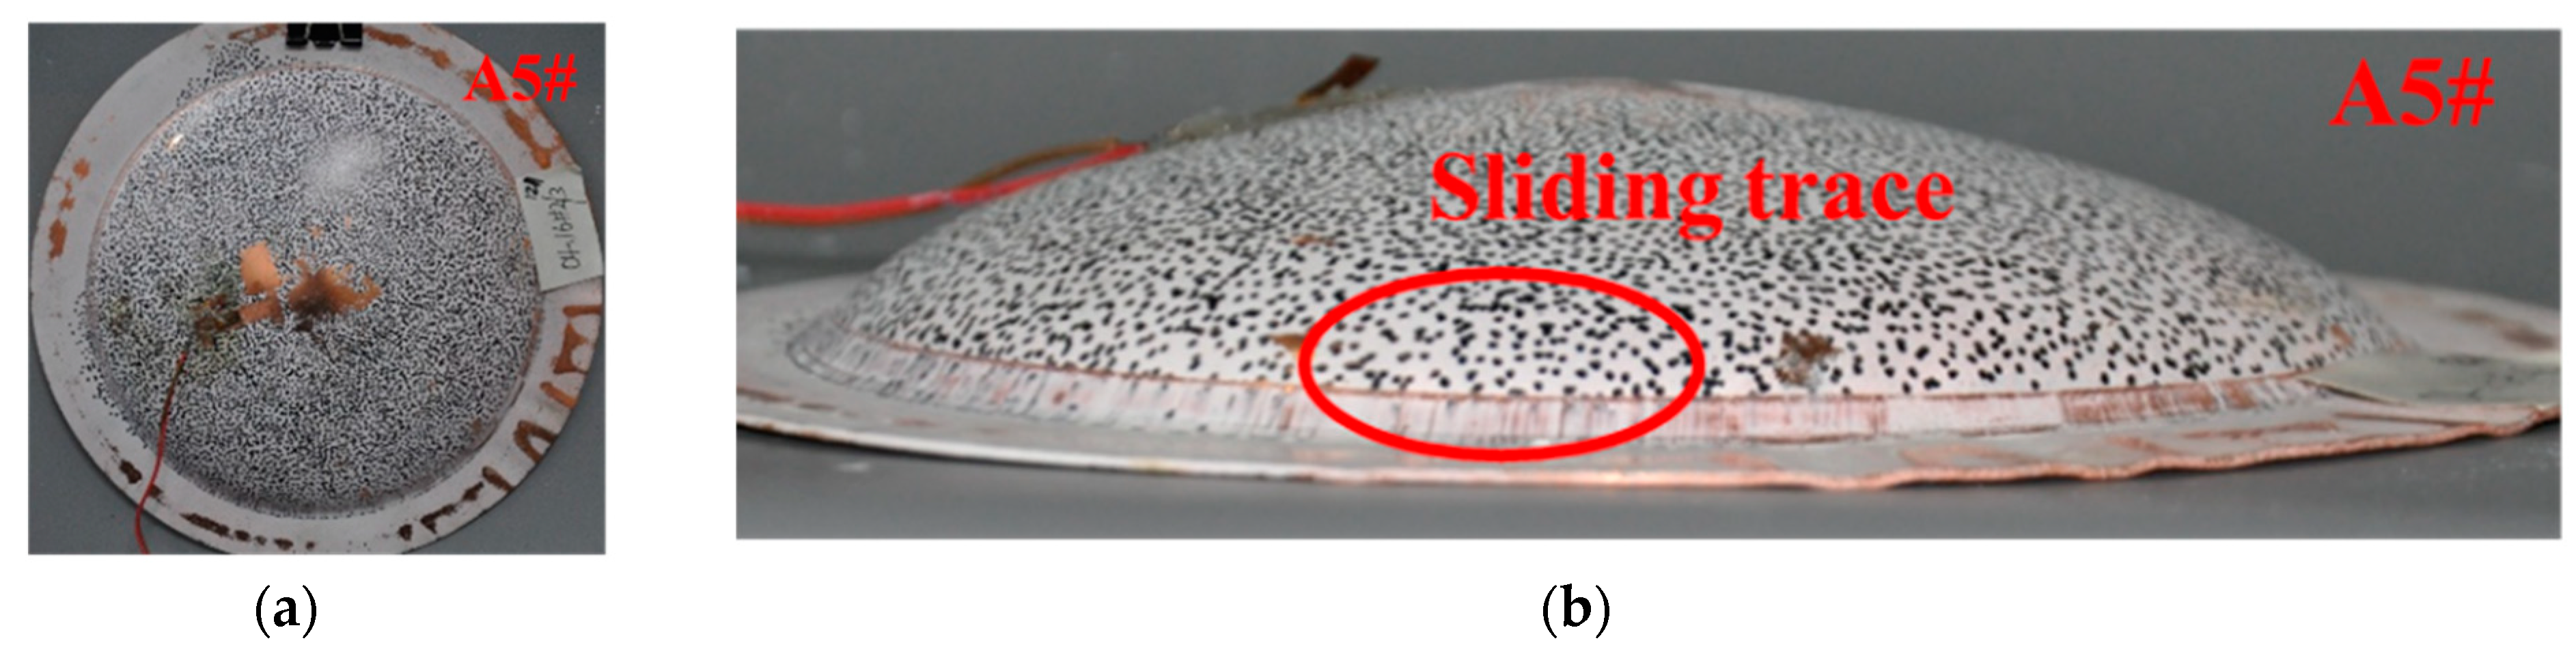
Figure 11 shows photographs of the recovered A5# specimens after the test. It can be seen the main failure mode of the specimen is only a large ductile deformation (mode ), as defined by Smith and Nurick [36]. Because the test plate slides out from the clamped location, an annular sliding trace can be clearly observed on the boundary (see Figure 11b).
The results of the deformation and failure mode for all seven specimens without pre-notches are summarized in Table 2. The peak pressure and impulse are predicted values by Equations (3) and (4), the dimensionless impulse is given by , where is the dimensionless mass, the final deflection and are obtained by DIC and the altimeter, the dimensionless final deflection is also given, where L = 152.4 mm is the specimen span. The relationship between the dimensionless impulse and normalized final deflection is shown in Figure 12. The result shows that the normalized final deflection of the plate increases linearly with the dimensionless impulse. The failure modes are always large ductile deformations (mode ). The relative out-of-plane measurement errors of DIC for seven tests are from 0.84%–6.83%, which can be estimated by .
3.3. Specimens with Pre-Notches
Table 3 lists the experimental conditions and the corresponding failure mode of the specimens with pre-notches. The specimens with pre-notches have been investigated to understand the effect of pre-notches on the dynamic deformations and failure modes. Figure 13 and Figure 14 show the evolution of the in-plane maximum principal strain of C1# and C2# specimen (T = 1 mm, L = 30 mm, and H = 0.5 mm). The selected frame rate and image resolution are 75,000 fps and 320 × 264 pixels for the C1# test. It is very clear from Figure 13 that weak strain concentration has appeared at the center of the outside surface at 559 μs. From this moment on, because the pre-notch causes the strength of the central region of the plate to decrease, higher principal strain localizes and concentrates around the pre-notch. The shape of strain concentration is close to the cross shape with a 45 degree angle, the position and direction of strain concentration correlate well with the pre-notch.
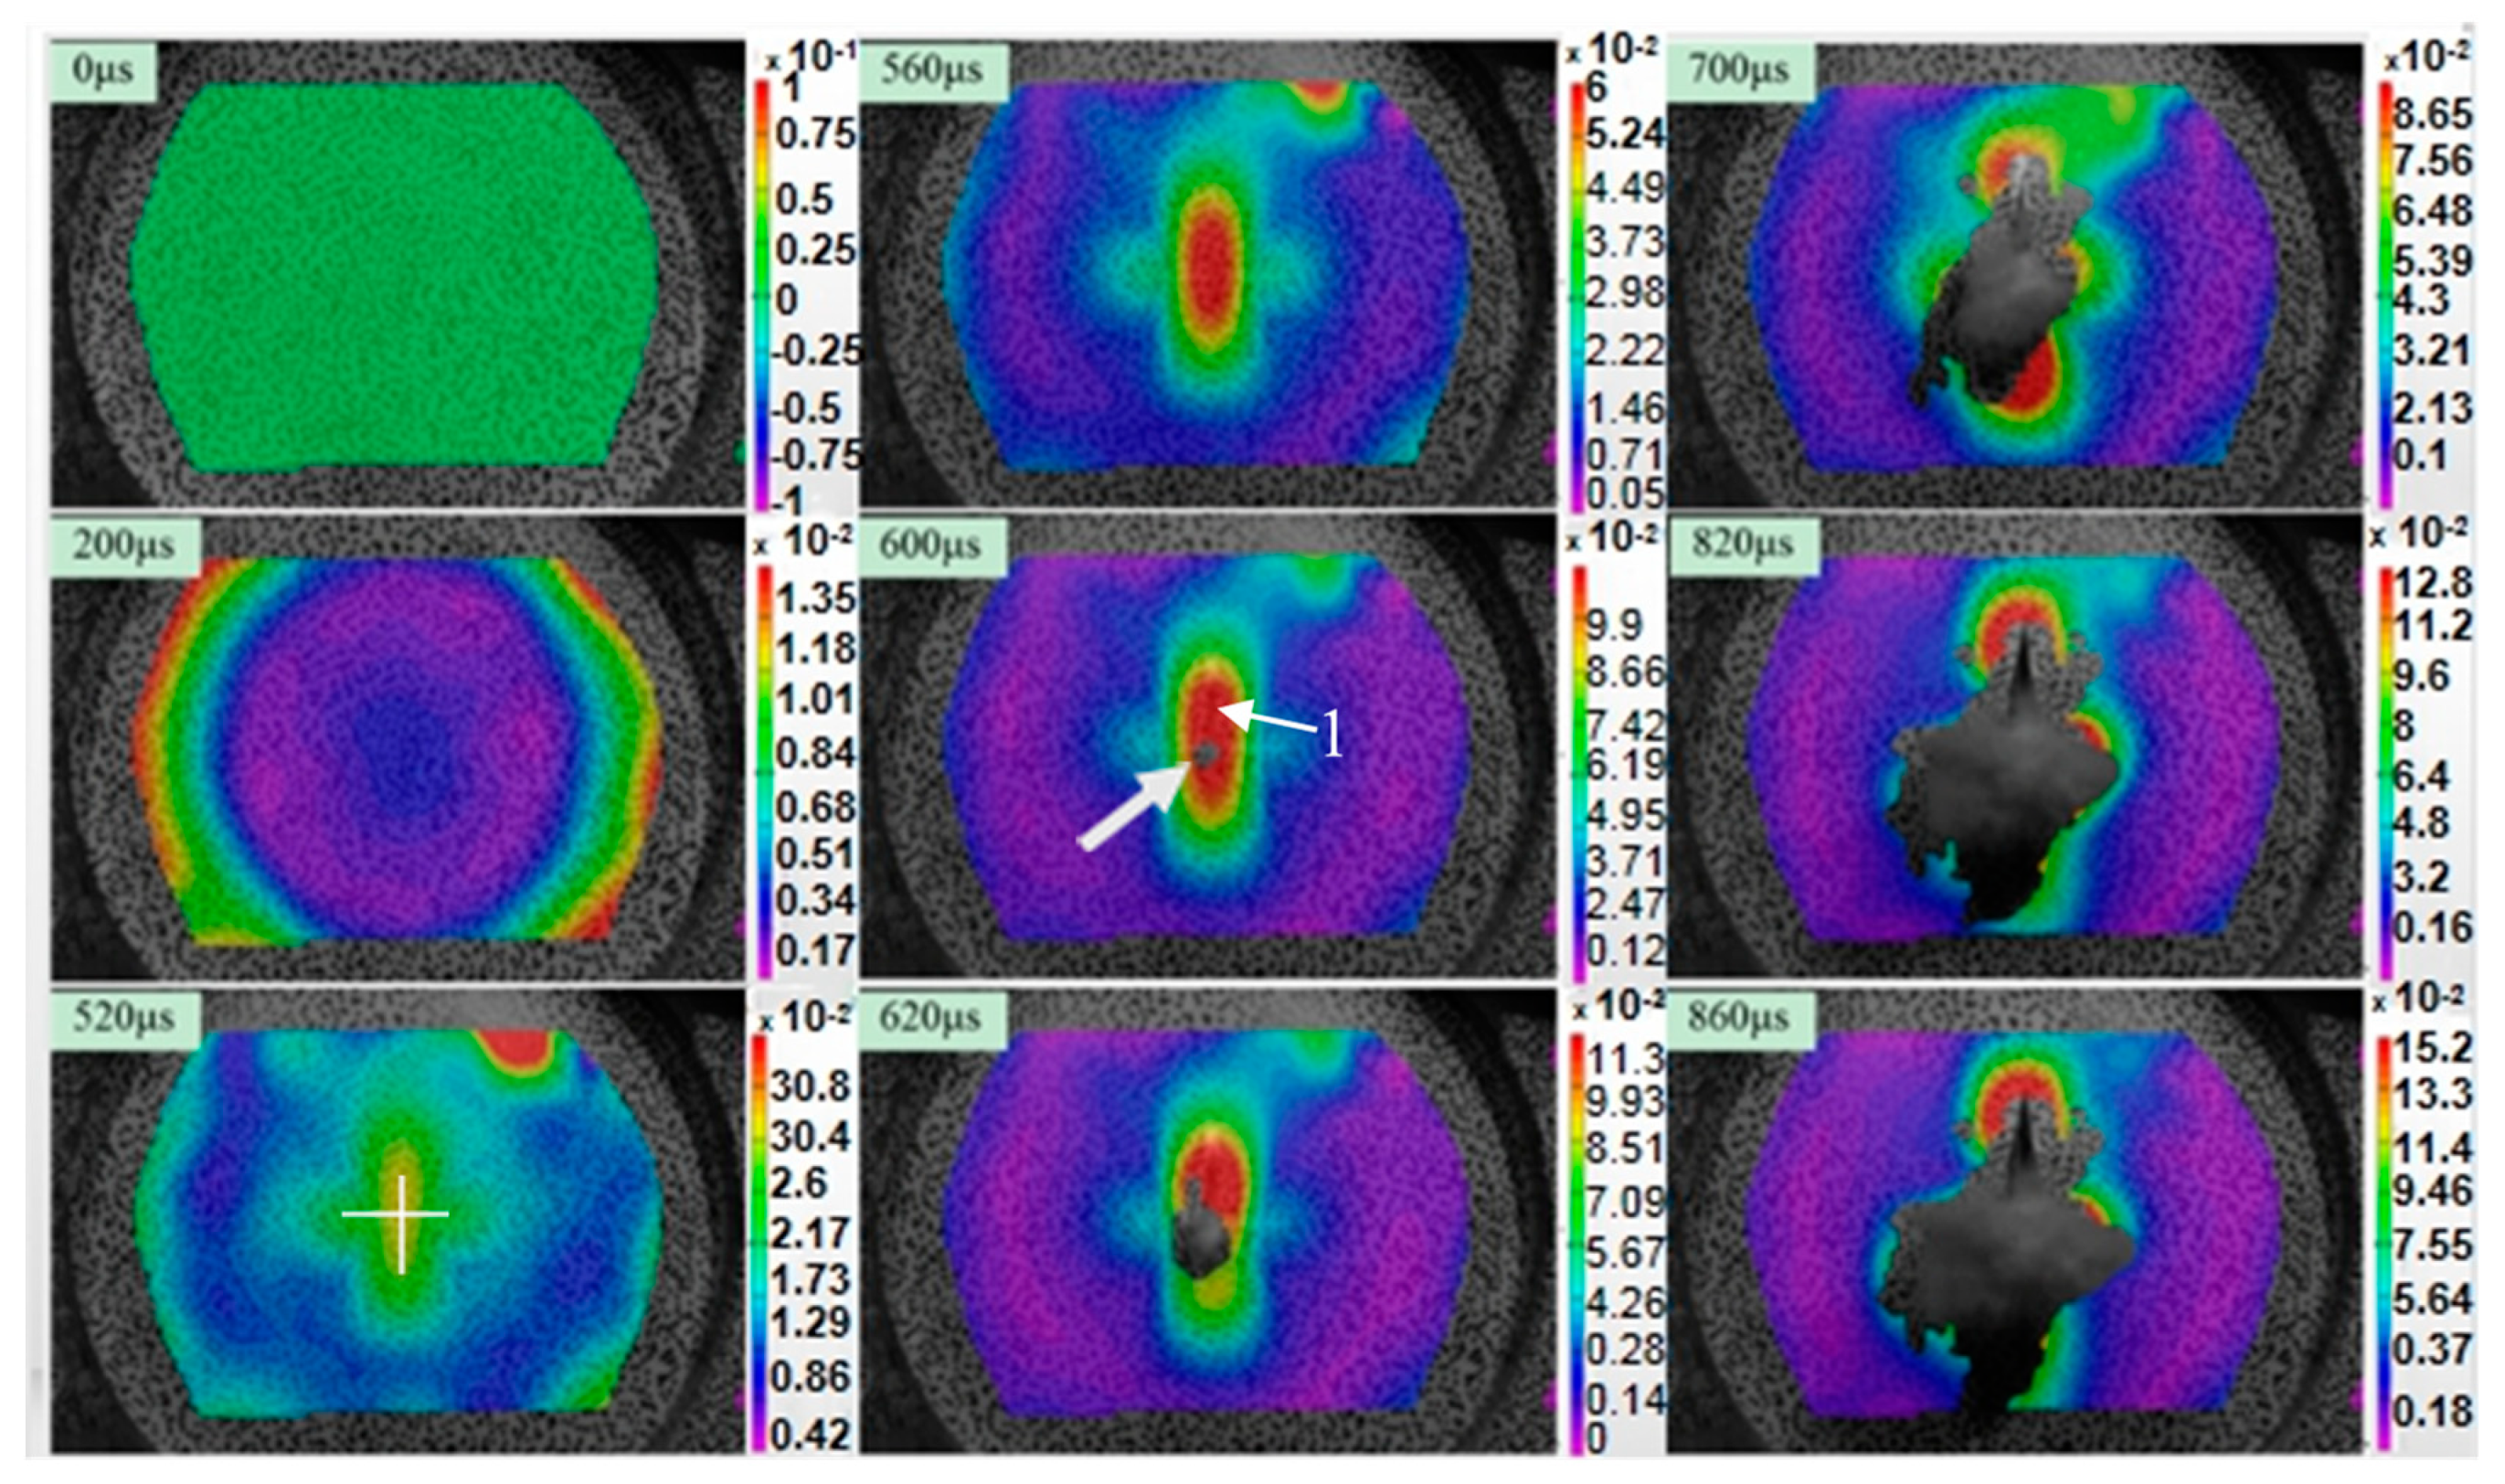
Compared with the test for C1#, the impact velocity has been increased to 118.9 m/s in the C2# test. A framing rate of 50,000 fps is used with an image resolution of 512 × 272 pixels. Similarly to the result of the test without a pre-notch, the principal strain increases from the boundary to center regions. Similarly to the test for C1#, a cross-shaped strain concentration appears in the correlated position of the pre-notch at 520 μs. At 600 μs, a mismatched region is also found on the displacement profile, demonstrating that a crack rupture occurs in the plate center (labeled “1”). After 620 μs, the water escapes through the crack from the anvil, and the crack continues to expand in the direction of the cross pre-notch.
Figure 15 shows the out-of-plane displacement fields on the surface of the R1# specimen with a ring-shaped pre-notch (T = 1 mm, Dc = 30 mm). The camera framing rate and image resolutions are the same as the test for C2#. The pre-notch is indicated by a white line. At 520 μs, a crack forms in the center area indicated by white ring A. After this moment, the crack extends along the ring-shaped pre-notch, and then the circular flyer falls off from the plate (see 840 μs in Figure 15). Figure 16 shows the in-plane maximum principal strain profile along the x-axis. Notice that strain concentration is located at ±15 mm from the center, where is the same location as the pre-notch. This explains how strain concentration also occurs around ring pre-notch.
After underwater loading tests, the specimens with the cross-shaped and ring-shaped pre-notches have been recovered for further analysis. The four typical failure modes observed in these experiments are reported in Figure 17. The 1 mm-thick plate with the depth cross pre-notch of 0.5 mm has been tested using a flyer with a velocity of 101.9 m/s. The larger ductile deformation and a cross-shaped local necking (mode ) appear in the center area of the C1# specimen, which is only presented in the pre-notch position marked with a white circle in Figure 17a.
For the same case, while the velocity of the flyer is increased to 118.9 m/s and 140.8 m/s, the failure modes of the C2# and C4# specimens evolve to splitting of pre-notch and tearing (mode ), see Figure 17c, the new cracks grow from the pre-notch tips. Scanning electron microscopy (SEM) was used to measure the microstructure of the fracture surfaces of the C2# specimen. Figure 18 shows the microstructures of different fracture surfaces of the C2# specimen, including the pre-notched part labeled by the white lines and the new crack part labeled by the red line. In the pre-notched part, due to the fact that the residual thickness of the plate is only 0.5 mm, a plug-like shear failure is easily caused by the underwater shock wave, therefore, considerable parallel striations are found on the fracture surface. In contrast, the fracture surface of the new crack part has many dimple structures, which are considered a typical feature of tensile tearing failure. This can be explained by the fact that after fracture of the pre-notch, the sectional tension by shock wave causes the tearing failure and a radial new crack.
For the 2 mm-thick plate with the depth of pre-notch increased to 1.5 mm, only a splitting of pre-notch (mode ) is observed on the outside face of the C3# specimen, labeled by a white ring line in Figure 17b. Furthermore, the shape of the pre-notch also influences the failure mode of the circular plate under clamped condition subjected to underwater impulsive loading. For the R1# and R2# specimens, the specimens occur failure along the pre-notch, and the fragment (mode ) produced as the circular flyer is shown in Figure 17d.
4. Conclusions
Experimental investigations on the non-linear dynamic responses of circular copper plates subjected to underwater impulsive loading using a fluid-structure interaction experimental setup were presented. The different types of copper plates, with and without pre-notches, were studied and analyzed. The shock pressure histories were successfully measured by the dynamic pressure transducers at locations A and B. A stereoscopic camera system combined with a 3D DIC technique was utilized to monitor the out-of-plane deformation, velocity, and in-plane maximum principal strain of the copper plates. Results showed that dynamic deformation is the interaction effect of the initial underwater shock wave and water medium flow.
For the clamped circular specimens without a pre-notch, a dimensionless deflection was performed to further investigate the relationship between the impulsive wave intensity, thickness of the specimens, and the final deflection. The linear relation between the normalized final deflection and the dimensionless impulse was observed.
The effects of the impulsive wave intensity, geometric dimension of the specimens, and the dimension of the pre-notch on the failure modes of the copper plates were also studied. Based on the observation of the current experiments, a large ductile deformation (mode ) was observed for the plate without a pre-notch, and other four typical failure modes, including large ductile deformation with local necking (mode ), splitting (mode ), splitting and tearing(mode ), and fragment (mode ) were found for the plates with different pre-notches.
This study provides insight into the relationship between the impulsive wave intensity, geometric dimensions of specimens and pre-notches, and the non-liner dynamic responses of copper plates subjected to underwater impulsive loading. This discussion will be helpful in understanding failure processes and predicting failure modes.
Author Contributions
Conceptualization, P.C.; experimental design and measurement, K.D., H.L., B.G. and D.X.; data analysis, K.D., H.L. and B.G.; writing-original draft manuscript, K.D.; Writing-review and editing, P.C. and J.R.
Funding
The present work was supported by the National Natural Science Foundation of China under Grants 11472047, 11472054 and 11521062.
Conflicts of Interest
The authors declare no conflict of interest.
References
- Rajendran, R.L.J. Blast loaded plates. Mar. Struct. 2009, 22, 99–127. [Google Scholar] [CrossRef]
- Fox, E.N. A review of underwater explosion phenomena. Comp. Underwater Explos. Res. 1947, 1, 1–83. [Google Scholar]
- Ahmed, W.K.P.J. Non-linear dynamic analysis assessment of explosively loaded submarine hull panels. Shock Vib. Bull. 1990, 1, 139–171. [Google Scholar]
- Ramajeyathilagam, K.; Vendhan, C.P. Deformation and rupture of thin rectangular plates subjected to underwater shock. Int. J. Impact Eng. 2004, 30, 699–719. [Google Scholar] [CrossRef]
- Ramajeyathilagam, K.; Vendhan, C.P.; Rao, V.B. Non-linear transient dynamic response of rectangular plates under shock loading. Int. J. Impact Eng. 2000, 24, 999–1015. [Google Scholar] [CrossRef]
- Ramajeyathilagam, K.; Vendhan, C.P.; Rao, V.B. Experimental and numerical investigations on deformation of cylindrical shell panels to underwater explosion. Shock Vib. 2001, 8, 253–268. [Google Scholar] [CrossRef]
- Cole, R.H. Underwater Explosions, 2nd ed.; Princeton University Press: Princeton, NJ, USA, 1948. [Google Scholar]
- Taylor, G.I. The pressure and impulse of submarine explosion waves on plates. In Aerodynamics and the Mechanics of Projectiles and Explosions; Batchelor, G.K., Ed.; Cambridge University Press: Cambridge, UK, 1963; Volume III, pp. 287–303. [Google Scholar]
- Hung, C.F.; Hsu, P.Y.; Hwang-Fuu, J.J. Elastic shock response of an air-backed plate to underwater explosion. Int. J. Impact Eng. 2005, 31, 151–168. [Google Scholar] [CrossRef]
- Espinosa, H.D.; Lee, S.; Moldovan, N. A novel fluid structure interaction experiment to investigate deformation of structural elements subjected to impulsive loading. Exp. Mech. 2006, 46, 805–824. [Google Scholar] [CrossRef]
- Mori, L.F.; Queheillalt, D.T.; Wadley, H.N.G.; Espinosa, H.D. Deformation and failure modes of I-core sandwich structures subjected to underwater impulsive loads. Exp. Mech. 2009, 49, 257–275. [Google Scholar] [CrossRef]
- Avachat, S.; Zhou, M. Effect of facesheet thickness on dynamic response of composite sandwich plates to underwater impulsive loading. Exp. Mech. 2012, 52, 83–93. [Google Scholar] [CrossRef]
- McShane, G.J.; Stewart, C.; Aronson, M.T.; Wadley, H.N.G.; Fleck, N.A.; Deshpande, V.S. Dynamic rupture of polymer-metal bilayer plates. Int. J. Solids Stuct. 2008, 45, 4407–4426. [Google Scholar] [CrossRef]
- Pan, B. Recent progress in digital image correlation. Exp. Mech. 2011, 51, 1223–1235. [Google Scholar] [CrossRef]
- Pan, B.; Yu, L.P.; Yang, Y.Q.; Song, W.D.; Guo, L.C. Full-field transient 3D deformation measurement of 3D braided composite panels during ballistic impact using single-carmera high-speed stereo-digital image correlation. Compos. Struct. 2016, 157, 25–32. [Google Scholar] [CrossRef]
- Sprangher, K.; Vasilakos, I.; Lecompte, D.; Sol, H.; Vantomme, J. Full-field deformation measurements of aluminum plates under free air blast loading. Exp. Mech. 2012, 52, 1371–1384. [Google Scholar] [CrossRef]
- Louar, M.A.; Belkassem, B.; Ousji, H.; Spranghers, K.; Kakogiannis, D.; Pyl, L.; Vantomme, J. Explosive driven shock tube loading of aluminium plates: Experimental study. Int. J. Impact Eng. 2015, 86, 111–123. [Google Scholar] [CrossRef]
- Chen, P.W.; Liu, H.; Ding, Y.S.; Guo, B.Q.; Chen, J.J.; Liu, H.B. Dynamic deformation of clamped circular plates subjected to confined blast loading. Strain 2016, 52, 478–491. [Google Scholar] [CrossRef]
- Aune, V.; Fagerholt, E.; Hauge, K.O.; Langseth, M.; Borvik, T. Experimental study on the response of thin aluminum and steel plates subjected to airblast loading. Int. J. Impact Eng. 2016, 90, 106–121. [Google Scholar] [CrossRef]
- Tiwari, V.; Sutton, M.A.; McNeill, S.R.; Xu, S.W.; Deng, X.M.; Fourney, W.L.; Bretall, D. Application of 3D image correlation for full-field transient plate deformation measurements during blast loading. Int. J. Impact Eng. 2009, 36, 862–874. [Google Scholar] [CrossRef]
- Gagliardi, F.J.; Cunningham, B.J. The use of digital image correlation in explosive experiments. In Proceedings of the 14th international detonation symposium, Coeur d’Alene, ID, USA, 11–16 April 2010. [Google Scholar]
- Arora, H.; Hooper, P.A.; Dear, J.P. The effects of air and underwater blast on composite sandwich panels and tubular laminate structures. Exp. Mech. 2012, 52, 59–81. [Google Scholar] [CrossRef]
- LeBlanc, J.; Shukla, A. Dynamic response of curved composite panels to underwater explosive loading: Experimental and computational comparisons. Compos. Struct. 2011, 93, 3072–3081. [Google Scholar] [CrossRef]
- LeBlanc, J.; Shukla, A. Response of E-glass/vinyl ester composite panels to underwater explosive loading: Effects of laminate modifications. Int. J. Impact Eng. 2011, 38, 796–803. [Google Scholar] [CrossRef]
- Xiang, D.L.; Rong, J.L.; He, X. Experimental investigation of dynamic response and deformation of aluminium honeycomb sandwich panels subjected to underwater impulsive loads. Shock Vib. 2015, 2015, 650167. [Google Scholar] [CrossRef]
- Huang, W.; Zhang, W.; Chen, T.; Jiang, X.W.; Liu, J.Y. Dynamic response of circular composite laminates subjected to underwater impulsive loading. Compos. Part. A 2018, 109, 63–74. [Google Scholar] [CrossRef]
- Shukla, A.; Gupta, S.; Matos, H.; LeBlanc, J.M. Dynamic collapse of underwater metallic structures-recent investigations: Contributions after the 2011 Murray Lecture. Exp. Mech. 2018, 58, 387–405. [Google Scholar] [CrossRef]
- Siebert, T.; Becker, T.; Spiltthof, K.; Neumann, I. High-speed digital image correlation: Error estimations and applications. Opt. Eng. 2007, 46, 0510045. [Google Scholar] [CrossRef]
- Pan, B.; Xie, H.M.; Guo, Z.Q.; Hua, T. Full-field strain measurement using a two-dimensional Savitzky-Golay digital differentiator in digital image correlation. Opt. Eng. 2007, 46, 0336013. [Google Scholar] [CrossRef]
- Pan, B.; Xie, H.M. Full-field strain measurement based on least-square fitting of local displacement for digital image correlation method. Acta Opt. Sin. 2007, 27, 1980–1986. [Google Scholar]
- Yu, L.; Pan, B. Color stereo-digital image correlation method using a single 3CCD color camera. Exp. Mech. 2017, 57, 649–657. [Google Scholar] [CrossRef]
- Schmidt, T.; Tyson, J.; Galanulis, K. Full-field dynamic displacement and strain measurement using advanced 3D image correlation photogrammetry: Part I. Exp. Tech. 2006, 27, 47–50. [Google Scholar] [CrossRef]
- Chen, P.W.; Liu, H.; Zhang, S.L.; Chen, A.; Guo, B.Q. Full-field 3D deformation measurement of thin metal plates subjected to underwater shock loading. In Advancement of Optical Methods in Experimental Mechanics, 1st ed.; Jin, H., Yoshida, S., Lamberti, L., Lin, M.T., Eds.; Springer: Cham, Switzerland, 2016; Volume 3; pp. 211–223. [Google Scholar]
- Jones, N. Structural Impact, 2nd ed.; Cambridge University Press: Cambridge, UK, 1997; pp. 348–349. [Google Scholar]
- Lecompte, D.; Smits, A.; Bossuyt, S.; Sol, H.; Vantomme, J.; Hemelrijck, D.V.; Habraken, A.M. Quality assessment of speckle patterns for digital image correlation. Opt. Laser Eng. 2006, 44, 1132–1145. [Google Scholar] [CrossRef] [Green Version]
- Teeling-Smith, R.G.; Nurick, G.N. The deformation and tearing of circular plates subjected to impulsive loads. Int. J. Impact Eng. 1991, 11, 77–91. [Google Scholar] [CrossRef]
Figure 1.
Principle diagram of 3D stereo matching.

Figure 2.
Schematic diagram of the experimental setup.

Figure 3.
Outline of different specimens: (a) schematic of insufficient clamping condition; (b) schematic of a specimen with strain gauges; (c) a copper plate with a cross-shaped pre-notch; (d) a copper plate with a ring-shaped pre-notch.
Figure 3.
Outline of different specimens: (a) schematic of insufficient clamping condition; (b) schematic of a specimen with strain gauges; (c) a copper plate with a cross-shaped pre-notch; (d) a copper plate with a ring-shaped pre-notch.

Figure 4.
Diagrams of the fluid-structure interaction (FSI) experimental setup: (a) the 3D digital imafge correlation (DIC) measuring system with two high-speed digital cameras and two light spots; (b) the interest area of the specimen surface with a speckle pattern.
Figure 4.
Diagrams of the fluid-structure interaction (FSI) experimental setup: (a) the 3D digital imafge correlation (DIC) measuring system with two high-speed digital cameras and two light spots; (b) the interest area of the specimen surface with a speckle pattern.

Figure 5.
Typical pressure-time history at positions A and B of the A1# test; (a) point A (b) point B.
Figure 5.
Typical pressure-time history at positions A and B of the A1# test; (a) point A (b) point B.

Figure 6.
Diagram of selected area of interest (AOI).

Figure 7.
Out-of-plane displacement fields of the A5# specimen (T = 1 mm, V0 = 46.6 m/s).

Figure 8.
The out-of-plane displacement and velocity profiles: (a) profile of displacement along the x-axis; (b) profile of velocity along the x-axis.
Figure 8.
The out-of-plane displacement and velocity profiles: (a) profile of displacement along the x-axis; (b) profile of velocity along the x-axis.

Figure 9.
In-plane maximum principal strain fields of the A5# specimen at different time steps.

Figure 10.
Comparison of the normal strain results from DIC and strain gauges; (a) strain of x-direction and (b) strain of y-direction.
Figure 10.
Comparison of the normal strain results from DIC and strain gauges; (a) strain of x-direction and (b) strain of y-direction.

Figure 11.
Photographs of recovered specimens after shock experiment, (a) shows the outside face; (b) shows a side view.
Figure 11.
Photographs of recovered specimens after shock experiment, (a) shows the outside face; (b) shows a side view.

Figure 12.
Normalized final deflection of specimens as a function of the dimensionless impulse.

Figure 13.
In-plane maximum principle strain of the C1# specimen at different time steps.

Figure 14.
In-plane maximum principal strain of the C2# specimen at different time steps.

Figure 15.
Out-of-plane displacement fields of the R1# specimen at different time steps.

Figure 16.
The in-plane maximum principal strain profile along the x-axis of the R1# specimen.

Figure 17.
Failure modes of copper plates with pre-notches: (a) large ductile deformation and local necking (mode failure); (b) splitting (mode failure); (c) splitting and tearing (mode failure); (d) fragment (mode failure).
Figure 17.
Failure modes of copper plates with pre-notches: (a) large ductile deformation and local necking (mode failure); (b) splitting (mode failure); (c) splitting and tearing (mode failure); (d) fragment (mode failure).

Figure 18.
Microstructures of different fracture surfaces of the C2# specimen.


Table 1.
Characteristic parameters of underwater impulsive loads.
| Sample Number | |||||
|---|---|---|---|---|---|
| Exp. | Equation (5) | Exp. | Equation (6) | ||
| A1# | 158.3 | 84.9 | 86.5 | 50.4 | 47.8 |
| A2# | 124.3 | 62.8 | 67.9 | 40.3 | 37.6 |
| A3# | 129.5 | 65.6 | 70.8 | 42.0 | 39.2 |
| A4# | 130.2 | 66.3 | 71.1 | 42.0 | 39.4 |
| A5# | 46.6 | 23.4 | 25.5 | 15.5 | 14.1 |
| A6# | 121 | 64.5 | 66.1 | 39.2 | 36.6 |
| A7# | 128.9 | 65.7 | 70.4 | 41.8 | 39.0 |
Table 2.
Experimental conditions of specimen plates without pre-notches.
| Number | Thickness T (mm) | Measurement Error (%) | Failure Mode | |||||||
|---|---|---|---|---|---|---|---|---|---|---|
| A1# | 1 | 158.3 | 42.1 | 2769 | 27.9 | 27.3 | 2.05 | 0.183 | 2.15 | Mode |
| A2# | 1 | 124.3 | 33.0 | 2174 | 23.9 | 24.1 | 1.61 | 0.157 | 0.84 | Mode |
| A3# | 2 | 129.5 | 34.4 | 2264 | 22.2 | 22.8 | 0.84 | 0.146 | 2.7 | Mode |
| A4# | 3 | 130.2 | 34.6 | 2277 | 16.1 | 17.2 | 0.56 | 0.106 | 6.83 | Mode |
| A5# | 1 | 46.6 | 12.4 | 815 | 18.6 | 17.8 | 0.60 | 0.122 | 4.3 | Mode |
| A6# | 1 | 121 | 32.2 | 2116 | 23.6 | 22.2 | 1.57 | 0.155 | 5.93 | Mode |
| A7# | 1 | 128.9 | 34.3 | 2254 | 24 | 23.7 | 1.67 | 0.158 | 1.25 | Mode |
Table 3.
Experimental conditions of specimen panels with pre-notches.
| Sample Number | Thickness T (mm) | Pre-Notch | V0 (m/s) | Failure Mode | |||
|---|---|---|---|---|---|---|---|
| Shape | Depth H(mm) | Length L(mm) | Diameter Dc(mm) | ||||
| C1# | 1 | Cross | 0.5 | 30 | — | 101.9 | Mode |
| C2# | 1 | Cross | 0.5 | 30 | — | 118.9 | Mode |
| C3# | 2 | Cross | 1.5 | 30 | — | 119.2 | Mode |
| C4# | 1 | Cross | 0.5 | 50 | — | 140.8 | Mode |
| R1# | 1 | Ring | 0.5 | — | 30 | 125.3 | Mode |
| R2# | 1 | Ring | 0.5 | — | 50 | 121.0 | Mode |
© 2019 by the authors. Licensee MDPI, Basel, Switzerland. This article is an open access article distributed under the terms and conditions of the Creative Commons Attribution (CC BY) license (http://creativecommons.org/licenses/by/4.0/).
Share and Cite
MDPI and ACS Style
Dai, K.; Liu, H.; Chen, P.; Guo, B.; Xiang, D.; Rong, J. Dynamic Response of Copper Plates Subjected to Underwater Impulsive Loading. Appl. Sci. 2019, 9, 1927. https://doi.org/10.3390/app9091927
AMA Style
Dai K, Liu H, Chen P, Guo B, Xiang D, Rong J. Dynamic Response of Copper Plates Subjected to Underwater Impulsive Loading. Applied Sciences. 2019; 9(9):1927. https://doi.org/10.3390/app9091927
Chicago/Turabian StyleDai, Kaida, Han Liu, Pengwan Chen, Baoqiao Guo, Dalin Xiang, and Jili Rong. 2019. "Dynamic Response of Copper Plates Subjected to Underwater Impulsive Loading" Applied Sciences 9, no. 9: 1927. https://doi.org/10.3390/app9091927
Note that from the first issue of 2016, this journal uses article numbers instead of page numbers. See further details here.