Genetic Variation and Autism: A Field Synopsis and Systematic Meta-Analysis

 , , , , ,
  , , , , , , , , , , and
Abstract
:1. Introduction
2. Materials and Methods
2.1. Experimental Section
2.1.1. Inclusion and Exclusion Criteria
2.1.2. Search Strategy
2.1.3. Data Extraction
2.2. Statistical Analysis
2.3. Construction of Protein-Protein Interaction (PPI) Network
3. Results
3.1. Study Characteristics
3.2. Re-Analysis of Meta-Analyses
3.2.1. Re-Analysis of Meta-Analyses of Observational Studies
3.2.2. Re-Analysis of Meta-Analyses of GWAS
3.2.3. Re-Analysis of Results from the GWAS Catalog and GWAS Datasets Included in the GWAS Meta-Analyses
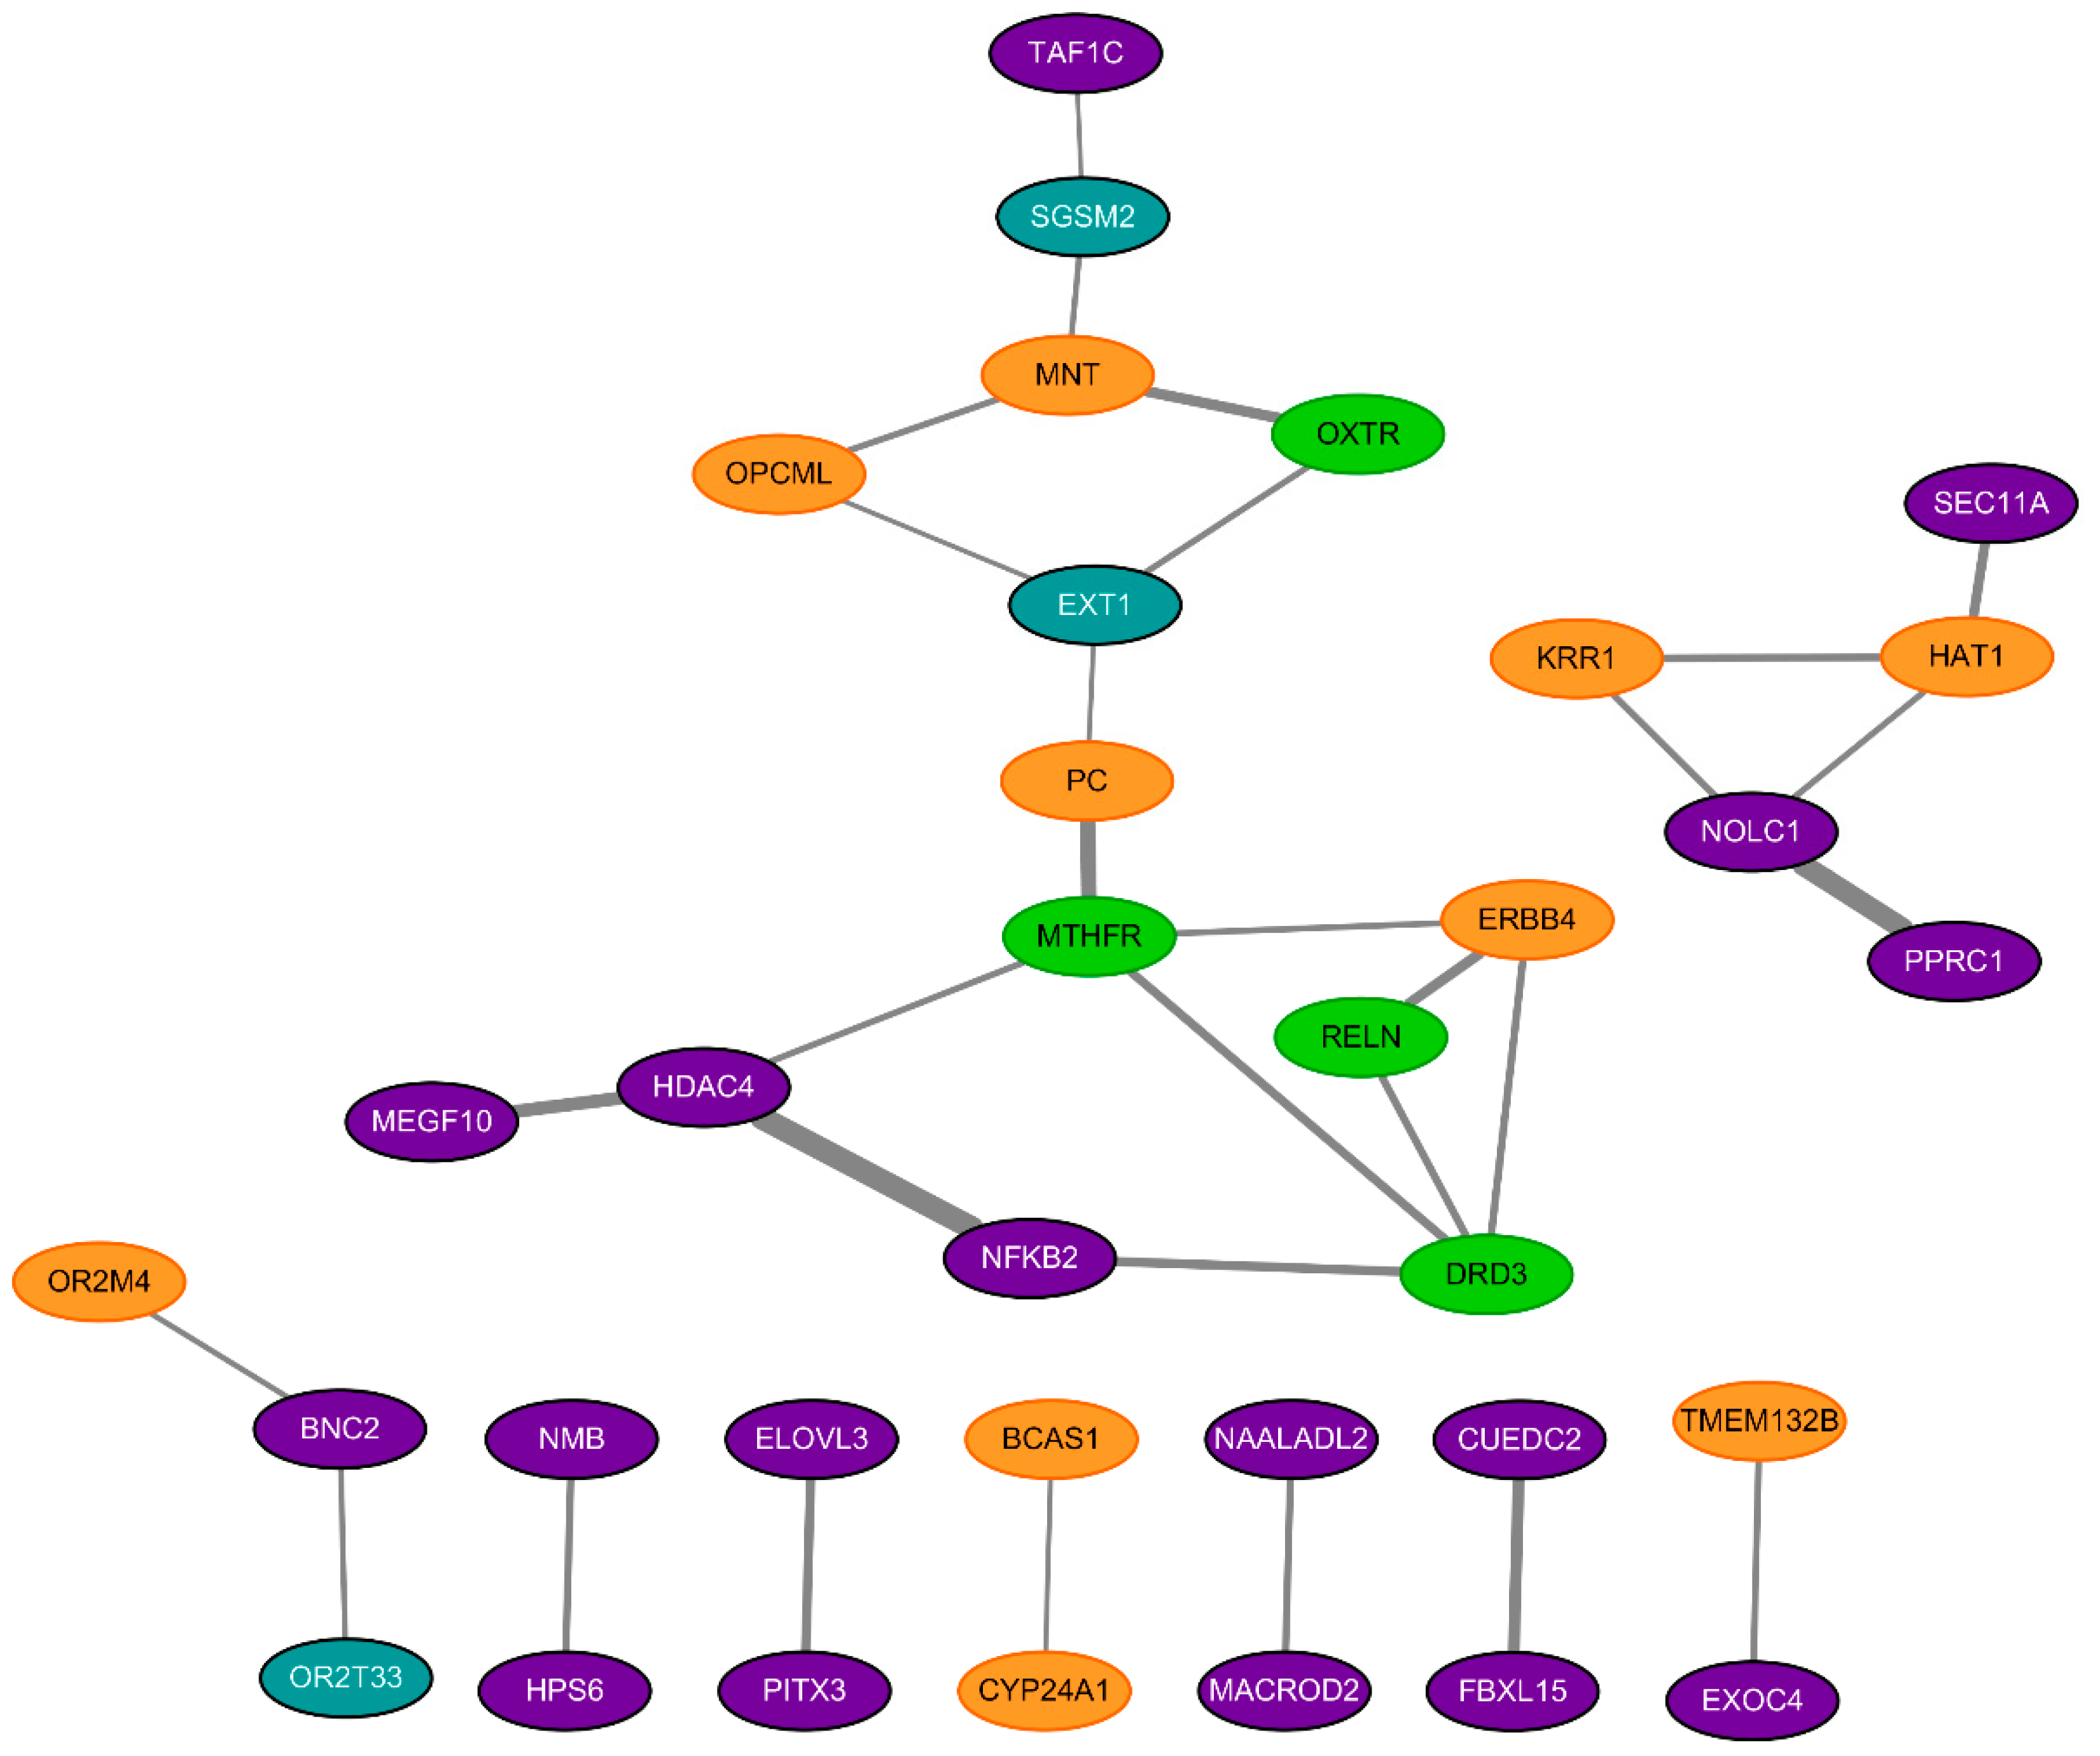
3.3. Protein-Protein Interaction (PPI) Network
4. Discussion
5. Conclusions
Supplementary Materials
Author Contributions
Funding
Conflicts of Interest
References
- Lyall, K.; Croen, L.; Daniels, J.; Fallin, M.D.; Ladd-Acosta, C.; Lee, B.K.; Park, B.Y.; Snyder, N.W.; Schendel, D.; Volk, H.; et al. The changing epidemiology of autism spectrum disorders. Annu. Rev. Public Health 2017, 38, 81–102. [Google Scholar] [CrossRef] [PubMed] [Green Version]
- American Psychiatric Association. Diagnostic and Statistical Manual of Mental Disorders (dsm-5®), 5th ed.; American Psychiatric Pub.: Arlington, VA, USA, 2013. [Google Scholar]
- Xu, G.; Strathearn, L.; Liu, B.; Bao, W. Prevalence of autism spectrum disorder among us children and adolescents, 2014–2016. JAMA 2018, 319, 81–82. [Google Scholar] [CrossRef] [PubMed] [Green Version]
- Zablotsky, B.; Black, L.I.; Maenner, M.J.; Schieve, L.A.; Blumberg, S.J. Estimated prevalence of autism and other developmental disabilities following questionnaire changes in the 2014 national health interview survey. Natl. Health Stat. Rep. 2015, 87, 1–20. [Google Scholar]
- Christensen, D.L.; Baio, J.; Van Naarden Braun, K.; Bilder, D.; Charles, J.; Constantino, J.N.; Daniels, J.; Durkin, M.S.; Fitzgerald, R.T.; Kurzius-Spencer, M.; et al. Prevalence and characteristics of autism spectrum disorder among children aged 8 years—Autism and developmental disabilities monitoring network, 11 sites, united states, 2012. MMWR Surveill. Summ. 2016, 65, 1–23. [Google Scholar] [CrossRef] [Green Version]
- Kim, J.Y.; Son, M.J.; Son, C.Y.; Radua, J.; Eisenhut, M.; Gressier, F.; Koyanagi, A.; Carvalho, A.F.; Stubbs, B.; Solmi, M.; et al. Environmental risk factors and biomarkers for autism spectrum disorder: An umbrella review of the evidence. Lancet Psychiatry 2019, 6, 590–600. [Google Scholar] [CrossRef] [Green Version]
- Ronald, A.; Hoekstra, R.A. Autism spectrum disorders and autistic traits: A decade of new twin studies. Am. J. Med. Genet. B Neuropsychiatr. Genet. 2011, 156B, 255–274. [Google Scholar] [CrossRef]
- Bai, D.; Yip, B.H.K.; Windham, G.C.; Sourander, A.; Francis, R.; Yoffe, R.; Glasson, E.; Mahjani, B.; Suominen, A.; Leonard, H.; et al. Association of genetic and environmental factors with autism in a 5-country cohort. JAMA Psychiatry 2019. [Google Scholar] [CrossRef]
- MacGregor, A.J.; Snieder, H.; Schork, N.J.; Spector, T.D. Twins: Novel uses to study complex traits and genetic diseases. Trends Genet 2000, 16, 131–134. [Google Scholar] [CrossRef]
- Modabbernia, A.; Velthorst, E.; Reichenberg, A. Environmental risk factors for autism: An evidence-based review of systematic reviews and meta-analyses. Mol. Autism. 2017, 8, 13. [Google Scholar] [CrossRef] [Green Version]
- Robinson, E.B.; St Pourcain, B.; Anttila, V.; Kosmicki, J.A.; Bulik-Sullivan, B.; Grove, J.; Maller, J.; Samocha, K.E.; Sanders, S.J.; Ripke, S.; et al. Genetic risk for autism spectrum disorders and neuropsychiatric variation in the general population. Nat. Genet. 2016, 48, 552–555. [Google Scholar] [CrossRef] [Green Version]
- State, M.W.; Levitt, P. The conundrums of understanding genetic risks for autism spectrum disorders. Nat. Neurosci. 2011, 14, 1499–1506. [Google Scholar] [CrossRef] [PubMed] [Green Version]
- MacArthur, J.; Bowler, E.; Cerezo, M.; Gil, L.; Hall, P.; Hastings, E.; Junkins, H.; McMahon, A.; Milano, A.; Morales, J. The new nhgri-ebi catalog of published genome-wide association studies (gwas catalog). Nucleic Acids Res. 2016, 45, D896–D901. [Google Scholar] [CrossRef] [PubMed]
- Wakefield, J. A bayesian measure of the probability of false discovery in genetic epidemiology studies. Am. J. Hum. Genet. 2007, 81, 208–227. [Google Scholar] [CrossRef] [PubMed] [Green Version]
- Wacholder, S.; Chanock, S.; Garcia-Closas, M.; El Ghormli, L.; Rothman, N. Assessing the probability that a positive report is false: An approach for molecular epidemiology studies. J. Natl. Cancer Inst. 2004, 96, 434–442. [Google Scholar] [CrossRef] [PubMed] [Green Version]
- Szklarczyk, D.; Franceschini, A.; Wyder, S.; Forslund, K.; Heller, D.; Huerta-Cepas, J.; Simonovic, M.; Roth, A.; Santos, A.; Tsafou, K.P.; et al. String v10: Protein-protein interaction networks, integrated over the tree of life. Nucleic Acids Res. 2015, 43, D447–D452. [Google Scholar] [CrossRef]
- Wang, K.; Zhang, H.; Ma, D.; Bucan, M.; Glessner, J.T.; Abrahams, B.S.; Salyakina, D.; Imielinski, M.; Bradfield, J.P.; Sleiman, P.M.; et al. Common genetic variants on 5p14.1 associate with autism spectrum disorders. Nature 2009, 459, 528–533. [Google Scholar] [CrossRef]
- Xia, K.; Guo, H.; Hu, Z.; Xun, G.; Zuo, L.; Peng, Y.; Wang, K.; He, Y.; Xiong, Z.; Sun, L.; et al. Common genetic variants on 1p13.2 associate with risk of autism. Mol. Psychiatry 2014, 19, 1212–1219. [Google Scholar] [CrossRef]
- Grove, J.; Ripke, S.; Als, T.D.; Mattheisen, M.; Walters, R.K.; Won, H.; Pallesen, J.; Agerbo, E.; Andreassen, O.A.; Anney, R.; et al. Identification of common genetic risk variants for autism spectrum disorder. Nat. Genet. 2019, 51, 431–444. [Google Scholar] [CrossRef] [Green Version]
- Liu, J.; Yang, A.; Zhang, Q.; Yang, G.; Yang, W.; Lei, H.; Quan, J.; Qu, F.; Wang, M.; Zhang, Z. Association between genetic variants in slc25a12 and risk of autism spectrum disorders: An integrated meta-analysis. Am. J. Med Genet. Part B Neuropsychiatr. Genet. 2015, 168, 236–246. [Google Scholar] [CrossRef]
- Rai, V. Association of methylenetetrahydrofolate reductase (mthfr) gene c677t polymorphism with autism: Evidence of genetic susceptibility. Metab. Brain Dis. 2016, 31, 727–735. [Google Scholar] [CrossRef]
- Pu, D.; Shen, Y.; Wu, J. Association between mthfr gene polymorphisms and the risk of autism spectrum disorders: A meta-analysis. Autism Res. 2013, 6, 384–392. [Google Scholar] [CrossRef] [PubMed]
- Shaik Mohammad, N.; Sai Shruti, P.; Bharathi, V.; Krishna Prasad, C.; Hussain, T.; Alrokayan, S.A.; Naik, U.; Radha Rama Devi, A. Clinical utility of folate pathway genetic polymorphisms in the diagnosis of autism spectrum disorders. Psychiatr. Genet. 2016, 26, 281–286. [Google Scholar] [CrossRef] [PubMed]
- Warrier, V.; Chee, V.; Smith, P.; Chakrabarti, B.; Baron-Cohen, S. A comprehensive meta-analysis of common genetic variants in autism spectrum conditions. Mol. Autism 2015, 6, 49. [Google Scholar] [CrossRef] [PubMed] [Green Version]
- Aoki, Y.; Cortese, S. Mitochondrial aspartate/glutamate carrier slc25a12 and autism spectrum disorder: A meta-analysis. Mol. Neurobiol. 2016, 53, 1579–1588. [Google Scholar] [CrossRef]
- LoParo, D.; Waldman, I.D. The oxytocin receptor gene (oxtr) is associated with autism spectrum disorder: A meta-analysis. Mol. Psychiatr. 2015, 20, 640–646. [Google Scholar] [CrossRef]
- Wang, Z.; Hong, Y.; Zou, L.; Zhong, R.; Zhu, B.; Shen, N.; Chen, W.; Lou, J.; Ke, J.; Zhang, T.; et al. Reelin gene variants and risk of autism spectrum disorders: An integrated meta-analysis. Am. J. Med. Genet. B Neuropsychiatr. Genet. 2014, 165B, 192–200. [Google Scholar] [CrossRef]
- Torrico, B.; Fernandez-Castillo, N.; Hervas, A.; Mila, M.; Salgado, M.; Rueda, I.; Buitelaar, J.K.; Rommelse, N.; Oerlemans, A.M.; Bralten, J.; et al. Contribution of common and rare variants of the ptchd1 gene to autism spectrum disorders and intellectual disability. Eur. J. Hum. Genet. 2015, 23, 1694–1701. [Google Scholar] [CrossRef] [Green Version]
- Kranz, T.M.; Kopp, M.; Waltes, R.; Sachse, M.; Duketis, E.; Jarczok, T.A.; Degenhardt, F.; Gorgen, K.; Meyer, J.; Freitag, C.M.; et al. Meta-analysis and association of two common polymorphisms of the human oxytocin receptor gene in autism spectrum disorder. Autism Res. 2016, 9, 1036–1045. [Google Scholar] [CrossRef]
- Anney, R.; Klei, L.; Pinto, D.; Regan, R.; Conroy, J.; Magalhaes, T.R.; Correia, C.; Abrahams, B.S.; Sykes, N.; Pagnamenta, A.T.; et al. A genome-wide scan for common alleles affecting risk for autism. Hum. Mol. Genet. 2010, 19, 4072–4082. [Google Scholar] [CrossRef]
- The Autism Spectrum Disorders Working Group of The Psychiatric Genomics Consortium. Meta-analysis of gwas of over 16,000 individuals with autism spectrum disorder highlights a novel locus at 10q24.32 and a significant overlap with schizophrenia. Mol. Autism 2017, 8, 21. [Google Scholar] [CrossRef]
- Ma, D.; Salyakina, D.; Jaworski, J.M.; Konidari, I.; Whitehead, P.L.; Andersen, A.N.; Hoffman, J.D.; Slifer, S.H.; Hedges, D.J.; Cukier, H.N.; et al. A genome-wide association study of autism reveals a common novel risk locus at 5p14.1. Ann. Hum. Genet. 2009, 73, 263–273. [Google Scholar] [CrossRef] [PubMed] [Green Version]
- Kuo, P.H.; Chuang, L.C.; Su, M.H.; Chen, C.H.; Chen, C.H.; Wu, J.Y.; Yen, C.J.; Wu, Y.Y.; Liu, S.K.; Chou, M.C.; et al. Genome-wide association study for autism spectrum disorder in taiwanese han population. PLoS ONE 2015, 10, e0138695. [Google Scholar] [CrossRef] [PubMed] [Green Version]
- Anney, R.; Klei, L.; Pinto, D.; Almeida, J.; Bacchelli, E.; Baird, G.; Bolshakova, N.; Bolte, S.; Bolton, P.F.; Bourgeron, T.; et al. Individual common variants exert weak effects on the risk for autism spectrum disorders. Hum. Mol. Genet. 2012, 21, 4781–4792. [Google Scholar] [CrossRef] [PubMed]
- Chaste, P.; Klei, L.; Sanders, S.J.; Hus, V.; Murtha, M.T.; Lowe, J.K.; Willsey, A.J.; Moreno-De-Luca, D.; Timothy, W.Y.; Fombonne, E. A genome-wide association study of autism using the simons simplex collection: Does reducing phenotypic heterogeneity in autism increase genetic homogeneity? Biol. Psychiatry 2015, 77, 775–784. [Google Scholar] [CrossRef] [Green Version]
- Main, P.A.; Angley, M.T.; O’Doherty, C.E.; Thomas, P.; Fenech, M. The potential role of the antioxidant and detoxification properties of glutathione in autism spectrum disorders: A systematic review and meta-analysis. Nutr. Metab. 2012, 9, 35. [Google Scholar] [CrossRef] [Green Version]
- Huang, C.H.; Santangelo, S.L. Autism and serotonin transporter gene polymorphisms: A systematic review and meta-analysis. Am. J. Med. Genet. B Neuropsychiatr. Genet. 2008, 147B, 903–913. [Google Scholar] [CrossRef]
- Curran, S.; Bolton, P.; Rozsnyai, K.; Chiocchetti, A.; Klauck, S.M.; Duketis, E.; Poustka, F.; Schlitt, S.; Freitag, C.M.; Lee, I.; et al. No association between a common single nucleotide polymorphism, rs4141463, in the macrod2 gene and autism spectrum disorder. Am. J. Med Genet. Part B: Neuropsychiatr. Genet. 2011, 156, 633–639. [Google Scholar] [CrossRef]
- Yang, P.Y.; Menga, Y.J.; Li, T.; Huang, Y. Associations of endocrine stress-related gene polymorphisms with risk of autism spectrum disorders: Evidence from an integrated meta-analysis. Autism Res. 2017, 10, 1722–1736. [Google Scholar] [CrossRef]
- Song, R.R.; Zou, L.; Zhong, R.; Zheng, X.W.; Zhu, B.B.; Chen, W.; Liu, L.; Miao, X.P. An integrated meta-analysis of two variants in hoxa1/hoxb1 and their effect on the risk of autism spectrum disorders. PLoS ONE 2011, 6, e25603. [Google Scholar] [CrossRef] [Green Version]
- Chen, N.; Bao, Y.; Xue, Y.; Sun, Y.; Hu, D.; Meng, S.; Lu, L.; Shi, J. Meta-analyses of reln variants in neuropsychiatric disorders. Behav. Brain Res. 2017, 332, 110–119. [Google Scholar] [CrossRef]
- Werling, A.M.; Bobrowski, E.; Taurines, R.; Gundelfinger, R.; Romanos, M.; Grunblatt, E.; Walitza, S. Cntnap2 gene in high functioning autism: No association according to family and meta-analysis approaches. J. Neural. Transm. 2016, 123, 353–363. [Google Scholar] [CrossRef] [PubMed]
- Zhang, T.; Zhang, J.; Wang, Z.; Jia, M.; Lu, T.; Wang, H.; Yue, W.; Zhang, D.; Li, J.; Wang, L. Association between cntnap2 polymorphisms and autism: A family-based study in the chinese han population and a meta-analysis combined with gwas data of psychiatric genomics consortium. Autism Res. 2019, 12, 553–561. [Google Scholar] [CrossRef] [PubMed]
- Noroozi, R.; Taheri, M.; Ghafouri-Fard, S.; Bidel, Z.; Omrani, M.D.; Moghaddam, A.S.; Sarabi, P.; Jarahi, A.M. Meta-analysis of gabrb3 gene polymorphisms and susceptibility to autism spectrum disorder. J. Mol. Neurosci. 2018, 65, 432–437. [Google Scholar] [CrossRef] [PubMed]
- Mahdavi, M.; Kheirollahi, M.; Riahi, R.; Khorvash, F.; Khorrami, M.; Mirsafaie, M. Meta-analysis of the association between gaba receptor polymorphisms and autism spectrum disorder (ASD). J. Mol. Neurosci. 2018, 65, 1–9. [Google Scholar] [CrossRef] [PubMed]
- Waltes, R.; Duketis, E.; Knapp, M.; Anney, R.J.; Huguet, G.; Schlitt, S.; Jarczok, T.A.; Sachse, M.; Kampfer, L.M.; Kleinbock, T.; et al. Common variants in genes of the postsynaptic fmrp signalling pathway are risk factors for autism spectrum disorders. Hum. Genet. 2014, 133, 781–792. [Google Scholar] [CrossRef] [PubMed]
- Torrico, B.; Chiocchetti, A.G.; Bacchelli, E.; Trabetti, E.; Hervas, A.; Franke, B.; Buitelaar, J.K.; Rommelse, N.; Yousaf, A.; Duketis, E.; et al. Lack of replication of previous autism spectrum disorder gwas hits in european populations. Autism Res. 2017, 10, 202–211. [Google Scholar] [CrossRef] [PubMed]
- Panagiotou, O.A.; Ioannidis, J.P.A.; Genome-Wide Significance Project. What should the genome-wide significance threshold be? Empirical replication of borderline genetic associations. Int. J. Epidemiol. 2011, 41, 273–286. [Google Scholar] [CrossRef]
- Skaar, D.A.; Shao, Y.; Haines, J.L.; Stenger, J.E.; Jaworski, J.; Martin, E.R.; DeLong, G.R.; Moore, J.H.; McCauley, J.L.; Sutcliffe, J.S.; et al. Analysis of the reln gene as a genetic risk factor for autism. Mol. Psychiatry 2005, 10, 563–571. [Google Scholar] [CrossRef] [Green Version]
- Glessner, J.T.; Wang, K.; Cai, G.; Korvatska, O.; Kim, C.E.; Wood, S.; Zhang, H.; Estes, A.; Brune, C.W.; Bradfield, J.P.; et al. Autism genome-wide copy number variation reveals ubiquitin and neuronal genes. Nature 2009, 459, 569–573. [Google Scholar] [CrossRef]
- Purcell, A.E.; Jeon, O.H.; Zimmerman, A.W.; Blue, M.E.; Pevsner, J. Postmortem brain abnormalities of the glutamate neurotransmitter system in autism. Neurology 2001, 57, 1618–1628. [Google Scholar] [CrossRef] [Green Version]


| Author, Year | Gene/Variant | Comparison | OR (95% CI) | p-Value | Model | No. of Studies | Power OR 1.2 | Power OR 1.5 | FPRP Values at Prior Probability | BFDP 0.001 | BFDP 0.000001 | |||
|---|---|---|---|---|---|---|---|---|---|---|---|---|---|---|
| OR 1.2 | OR 1.5 | |||||||||||||
| 0.001 | 0.000001 | 0.001 | 0.000001 | |||||||||||
| Gene variants with statistically significance (p-value < 0.05), FPRP < 0.2 and BFDP < 0.8 from observational studies | ||||||||||||||
| Rai 2016 [21] | MTHFR C677T | T vs. C | 1.37 (1.25, 1.50) | <0.0001 | Fixed | Overall (13) | 0.002 | 0.975 | 0.000 | 0.005 | 0.000 | 0.000 | 0.000 | 0.001 |
| Mohammad et al., 2016 [23] | MTHFR C677T | T (minor) | 1.47 (1.31, 1.65) | <0.0001 | Fixed | Overall (8) | 0.000 | 0.634 | 0.000 | 0.179 | 0.000 | 0.000 | 0.000 | 0.009 |
| Warrier et al., 2015 [24] | DRD3/rs167771 | G vs. A | 1.822 (1.398, 2.375) | 9.08 × 10⁻⁶ | Fixed | Overall (2) | 0.001 | 0.075 | 0.901 | 1.000 | 0.108 | 0.992 | 0.649 | 0.999 |
| Warrier et al., 2015 [24] | RELN/rs362691 | C vs. G | 0.832 (0.763, 0.908) | 3.93 × 10⁻⁵ | Fixed | Overall (6) | 0.486 | 1.000 | 0.071 | 0.987 | 0.036 | 0.974 | 0.584 | 0.999 |
| LoParo et al., 2015 [26] | OXTR/rs7632287 | A (minor) | 1.43 (1.23, 1.68) | 0.000005 | Random | Caucasian (2) | 0.016 | 0.720 | 0.451 | 0.999 | 0.018 | 0.950 | 0.432 | 0.999 |
| Gene variants with statistically significance (p-value < 0.05), FPRP > 0.2 or BFDP > 0.8 from observational studies | ||||||||||||||
| Liu et al., 2015 [20] | SLC25A12/rs2056202 | T vs. C | 0.809 (0.713, 0.917) | 0.001 | Fixed | Overall (8) | 0.321 | 0.999 | 0.740 | 1.000 | 0.478 | 0.999 | 0.957 | 1.000 |
| Liu et al., 2015 [20] | SLC25A12/rs2292813 | T vs. C | 0.752 (0.649,0.871) | <0.001 | Fixed | Overall (7) | 0.085 | 0.946 | 0.626 | 0.999 | 0.131 | 0.993 | 0.831 | 1.000 |
| Pu et al., 2013 [22] | MTHFR C677T | TT+CT vs. CC | 1.56 (1.12, 2.18) | 0.009 | Random | Overall (8) | 0.062 | 0.409 | 0.993 | 1.000 | 0.957 | 1.000 | 0.995 | 1.000 |
| Pu et al., 2013 [22] | MTHFR A1298C | CC vs. AA+AC | 0.73 (0.56, 0.97) | 0.03 | Fixed | Overall (5) | 0.181 | 0.734 | 0.994 | 1.000 | 0.976 | 1.000 | 0.997 | 1.000 |
| Warrier et al., 2015 [24] | SLC25A12/rs2292813 | C vs. T | 1.372 (1.161, 1.621) | 1.97 × 10⁻⁴ | Fixed | Overall (6) | 0.058 | 0.853 | 0.777 | 1.000 | 0.191 | 0.996 | 0.877 | 1.000 |
| Warrier et al., 2015 [24] | CNTNAP2/rs7794745 | A vs. T | 0.887 (0.828, 0.950) | 1.00 × 10⁻³ | Fixed | Overall (3) | 0.963 | 1.000 | 0.389 | 0.998 | 0.380 | 0.998 | 0.952 | 1.000 |
| Warrier et al., 2015 [24] | SLC25A12/rs2056202 | T vs. C | 1.227 (1.079, 1.396) | 2.00 × 10⁻³ | Fixed | Overall (8) | 0.368 | 0.999 | 0.837 | 1.000 | 0.654 | 0.999 | 0.976 | 1.000 |
| Warrier et al., 2015 [24] | OXTR/rs2268491 | T vs. C | 1.31 (1.092, 1.572) | 4.00 × 10⁻³ | Fixed | Overall (2) | 0.173 | 0.927 | 0.955 | 1.000 | 0.799 | 1.000 | 0.987 | 1.000 |
| Warrier et al., 2015 [24] | EN2/rs1861972 | A vs. G | 1.125 (1.035, 1.224) | 6.00 × 10⁻³ | Fixed | Overall (8) | 0.933 | 1.000 | 0.869 | 1.000 | 0.861 | 1.000 | 0.993 | 1.000 |
| Warrier et al., 2015 [24] | MTHFR/rs1801133 | T vs. C | 1.370 (1.079, 1.739) | 1.00 × 10⁻² | Random | Overall (10) | 0.138 | 0.772 | 0.986 | 1.000 | 0.926 | 1.000 | 0.994 | 1.000 |
| Warrier et al., 2015 [24] | ASMT/rs4446909 | G vs. A | 1.195 (1.038, 1.375) | 1.30 × 10⁻² | Fixed | Overall (3) | 0.523 | 0.999 | 0.961 | 1.000 | 0.928 | 1.000 | 0.995 | 1.000 |
| Warrier et al., 2015 [24] | MET/rs38845 | A vs. G | 1.322 (1.013, 1.724) | 1.60 × 10⁻² | Random | Overall (3) | 0.237 | 0.824 | 0.994 | 1.000 | 0.979 | 1.000 | 0.998 | 1.000 |
| Warrier et al., 2015 [24] | SLC6A4/rs2020936 | T vs. C | 1.244 (1.036, 1.492) | 1.90 × 10⁻² | Fixed | Overall (4) | 0.349 | 0.978 | 0.982 | 1.000 | 0.950 | 1.000 | 0.996 | 1.000 |
| Warrier et al., 2015 [24] | SLC6A4/STin2 VNTR | 12 vs. 9/10 | 1.492 (1.068, 2.083) | 1.90 × 10⁻² | Fixed | Caucasian (4) | 0.100 | 0.513 | 0.995 | 1.000 | 0.973 | 1.000 | 0.997 | 1.000 |
| Warrier et al., 2015 [24] | STX1A/rs4717806 | A vs. T | 0.851 (0.741, 0.978) | 2.30 × 10⁻² | Fixed | Overall (4) | 0.616 | 1.000 | 0.974 | 1.000 | 0.958 | 1.000 | 0.997 | 1.000 |
| Warrier et al., 2015 [24] | RELN/rs736707 | T vs. C | 1.269 (1.030, 1.563) | 2.50 × 10⁻² | Random | Overall (7) | 0.299 | 0.942 | 0.988 | 1.000 | 0.964 | 1.000 | 0.997 | 1.000 |
| Warrier et al., 2015 [24] | PON1/rs662 | A vs. G | 0.794 (0.642, 0.983) | 3.40 × 10⁻² | Fixed | Overall (2) | 0.329 | 0.946 | 0.990 | 1.000 | 0.973 | 1.000 | 0.997 | 1.000 |
| Warrier et al., 2015 [24] | OXTR/rs237887 | G vs. A | 1.163 (1.002, 1.349) | 4.70 × 10⁻² | Fixed | Overall (2) | 0.660 | 1.000 | 0.986 | 1.000 | 0.979 | 1.000 | 0.998 | 1.000 |
| Warrier et al., 2015 [24] | EN2/rs1861973 | T vs. C | 0.86 (0.791, 0.954) | 3.00 × 10⁻³ | Fixed | TDT (3) | 0.724 | 1.000 | 0.858 | 1.000 | 0.814 | 1.000 | 0.989 | 1.000 |
| Aoki et al., 2016 [25] | SCL25A12/rs2292813 | G (risk allele) | 1.190 (1.052, 1.346) | 0.006 | Random | Overall (9) | 0.553 | 1.000 | 0.911 | 1.000 | 0.849 | 1.000 | 0.990 | 1.000 |
| Aoki et al., 2016 [25] | SCL25A12/rs2056202 | G (risk allele) | 1.206 (1.035, 1.405) | 0.016 | Random | Overall (10) | 0.474 | 0.997 | 0.972 | 1.000 | 0.942 | 1.000 | 0.996 | 1.000 |
| LoParo et al., 2015 [26] | OXTR/rs237887 | G (minor allele) | 0.89 (0.79, 0.98) | 0.0239 | Random | Overall (3) | 0.910 | 1.000 | 0.951 | 1.000 | 0.947 | 1.000 | 0.997 | 1.000 |
| LoParo et al., 2015 [26] | OXTR/rs2268491 | T (minor allele) | 1.20 (1.05, 1.35) | 0.0075 | Random | Overall (3) | 0.500 | 1.000 | 0.828 | 1.000 | 0.707 | 1.000 | 0.981 | 1.000 |
| Wang et al., 2014 [27] | RELN/rs362691 | R vs. NR | 0.69 (0.56, 0.86) | 0.001 | Fixed | Overall (7) | 0.047 | 0.620 | 0.954 | 1.000 | 0.607 | 0.999 | 0.969 | 1.000 |
| Torrico et al., 2015 [28] | PTCHD1/rs7052177 | T (major allele) | 0.58 (0.45, 0.76) | 6.8 × 10⁻⁵ | Fixed | European (4) † | 0.004 | 0.156 | 0.948 | 1.000 | 0.333 | 0.998 | 0.890 | 1.000 |
| Kranz et al., 2016 [29] | OXTR/rs237889 | A vs. G | 1.12 (1.01, 1.24) | 0.0365 | Random | Overall (3) | 0.908 | 1.000 | 0.970 | 1.000 | 0.967 | 1.000 | 0.998 | 1.000 |
| Author, Year | Gene | Variant | Comparison | OR (95% CI) | p-Value | Power OR 1.2 | Power OR 1.5 | FPRP Values at Prior Probability | BFDP 0.001 | BFDP 0.000001 | |||
|---|---|---|---|---|---|---|---|---|---|---|---|---|---|
| OR 1.2 | OR 1.5 | ||||||||||||
| 0.001 | 0.000001 | 0.001 | 0.000001 | ||||||||||
| Gene variants with statistically significance (p-value < 5 × 10⁻⁸), FPRP < 0.2 and BFDP < 0.8 from meta-analysis of GWAS | |||||||||||||
| Anney et al., 2010 [30] | MACROD2 | rs4141463 | A (minor allele) | 0.73 (0.66–0.82) | 3.7 × 10⁻⁸ | 0.013 | 0.937 | 0.009 | 0.898 | 0.000 | 0.107 | 0.008 | 0.891 |
| Gene variants with statistically borderline significance (5 × 10⁻⁸ ≤ p-value < 0.05), FPRP < 0.2 and BFDP < 0.8 from meta-analyses of GWAS | |||||||||||||
| Anney et al., 2017 [31] | ALPK3 NMB SCAND2P SEC11A SLC28A1 WDR73 ZNF592 | rs4842996 | T vs. C | 1.08 (1.05–1.12) | 0.00001044 | 1.000 | 1.000 | 0.032 | 0.971 | 0.032 | 0.971 | 0.688 | 1.000 |
| EXOC4 | rs6467494 | T vs. C | 1.07 (1.04–1.09) | 0.0000172 | 1.000 | 1.000 | 0.000 | 0.000 | 0.000 | 0.000 | 0.000 | 0.000 | |
| NA | rs13233145 | A vs. C | 1.07 (1.04–1.10) | 0.00002906 | 1.000 | 1.000 | 0.002 | 0.618 | 0.002 | 0.618 | 0.136 | 0.994 | |
| NA | rs7684366 | T vs. C | 0.93 (0.90–0.96) | 0.00003137 | 1.000 | 1.000 | 0.007 | 0.882 | 0.007 | 0.882 | 0.373 | 0.998 | |
| MEGF10 | rs73785549 | C vs. G | 1.15 (1.08–1.21) | 0.0001308 | 0.950 | 1.000 | 0.000 | 0.070 | 0.000 | 0.067 | 0.005 | 0.835 | |
| ANO4 | rs2055471 | A vs. T | 1.07 (1.03–1.10) | 0.0001334 | 1.000 | 1.000 | 0.002 | 0.618 | 0.002 | 0.618 | 0.136 | 0.994 | |
| BNC2 | rs7860276 | A vs. G | 1.10 (1.05–1.15) | 0.0003196 | 1.000 | 1.000 | 0.026 | 0.964 | 0.026 | 0.964 | 0.598 | 0.999 | |
| NA | rs2293280 | C vs. G | 1.12 (1.06–1.18) | 0.0003606 | 0.995 | 1.000 | 0.020 | 0.954 | 0.020 | 0.954 | 0.514 | 0.999 | |
| NA | rs16975940 | T vs. C | 1.07 (1.03–1.10) | 0.0004742 | 1.000 | 1.000 | 0.002 | 0.618 | 0.002 | 0.618 | 0.136 | 0.994 | |
| NA | rs10169115 | C vs. G | 1.06 (1.02–1.09) | 0.004465 | 1.000 | 1.000 | 0.041 | 0.977 | 0.041 | 0.977 | 0.778 | 1.000 | |
| C10orf76 CUEDC2 ELOVL3 FBXL15 GBF1 HPS6 LDB1 MIR146B NFKB2 NOLC1 PITX3 PPRC1 PSD | rs1409313 | T vs. C | 1.10 (1.06–1.14) | 1.467 × 10⁻⁶ | 1.000 | 1.000 | 0.000 | 0.145 | 0.000 | 0.145 | 0.014 | 0.936 | |
| ESRRG | rs12725407 | C vs. G | 1.10 (1.06–1.14) | 2.115 × 10⁻⁶ | 1.000 | 1.000 | 0.000 | 0.145 | 0.000 | 0.145 | 0.014 | 0.936 | |
| HDAC4 MIR2467 MIR4269 | rs2931203 | A vs. T | 0.92 (0.88–0.95) | 4.243 × 10⁻⁶ | 1.000 | 1.000 | 0.000 | 0.261 | 0.000 | 0.261 | 0.031 | 0.970 | |
| Ma et al., 2009 [32] | NA | rs7704909 | C(minor)/T(major) | 1.30 (1.15–1.46) | 1.53 × 10⁻⁵ | 0.088 | 0.992 | 0.096 | 0.991 | 0.009 | 0.905 | 0.295 | 0.998 |
| NA | rs1896731 | C(minor)/T(major) | 0.76 (0.67–0.85) | 1.90 × 10⁻⁵ | 0.053 | 0.989 | 0.028 | 0.966 | 0.002 | 0.609 | 0.076 | 0.988 | |
| NA | rs12518194 | G(minor)/A(major) | 1.31 (1.16–1.49) | 8.34 × 10⁻⁶ | 0.091 | 0.980 | 0.302 | 0.998 | 0.039 | 0.976 | 0.605 | 0.999 | |
| NA | rs4307059 | C(minor)/T(major) | 1.31 (1.16–1.48) | 1.29 × 10⁻⁵ | 0.079 | 0.985 | 0.153 | 0.995 | 0.014 | 0.936 | 0.383 | 0.998 | |
| NA | rs4327572 | T(minor)/C(major) | 1.32 (1.17–1.49) | 4.05 × 10⁻⁶ | 0.062 | 0.981 | 0.103 | 0.991 | 0.007 | 0.878 | 0.249 | 0.997 | |
| Anney et al., 2010 [30] | NA | rs4078417 | C (minor allele) | 1.19 (1.10–1.30) | 5.6 × 10⁻⁵ | 0.574 | 1.000 | 0.167 | 0.995 | 0.103 | 0.991 | 0.795 | 1.000 |
| PPP2R5C | rs7142002 | G (minor allele) | 0.64 (0.53–0.78) | 2.9 × 10⁻⁶ | 0.004 | 0.343 | 0.687 | 1.000 | 0.028 | 0.966 | 0.459 | 0.999 | |
| Kuo et al., 2015 [33] | NAALADL2 | rs3914502 | A (minor allele) | 1.4 (1.2–1.6) | 3.5 × 10⁻⁶ | 0.012 | 0.844 | 0.062 | 0.985 | 0.001 | 0.482 | 0.051 | 0.982 |
| NAALADL2 | rs2222447 | A (minor allele) | 0.7 (0.6–0.8) | 5.3 × 10⁻⁵ | 0.005 | 0.763 | 0.030 | 0.969 | 0.000 | 0.178 | 0.013 | 0.932 | |
| NA | rs12543592 | G (minor allele) | 0.7 (0.6–0.8) | 3.2 × 10⁻⁶ | 0.005 | 0.763 | 0.030 | 0.969 | 0.000 | 0.178 | 0.013 | 0.932 | |
| NA | rs7026342 | C (minor allele) | 1.6 (1.2–2.0) | 1.8 × 10⁻⁴ | 0.006 | 0.285 | 0.864 | 1.000 | 0.113 | 0.992 | 0.749 | 1.000 | |
| NA | rs7030851 | A (minor allele) | 1.6 (1.3–2.0) | 1.4 × 10⁻⁴ | 0.006 | 0.285 | 0.864 | 1.000 | 0.113 | 0.992 | 0.749 | 1.000 | |
| Anney et al., 2012 [34] | RASSF5 | rs11118968 | A | 0.44 (0.32–0.61) | 2.452 × 10⁻⁷ | 0.000 | 0.006 | 0.930 | 1.000 | 0.117 | 0.993 | 0.504 | 0.999 |
| DNER | rs6752370 | G | 1.62 (1.33–1.96) | 8.526 × 10⁻⁷ | 0.001 | 0.214 | 0.407 | 0.999 | 0.003 | 0.764 | 0.089 | 0.990 | |
| YEATS2 | rs263035 | G | 1.39 (1.22–1.57) | 2.258 × 10⁻⁷ | 0.009 | 0.890 | 0.013 | 0.928 | 0.000 | 0.115 | 0.009 | 0.898 | |
| None | rs29456 | A | 1.65 (1.37–1.99) | 1.226 × 10⁻⁷ | 0.000 | 0.159 | 0.272 | 0.997 | 0.001 | 0.504 | 0.028 | 0.967 | |
| None | rs1936295 | A | 1.69 (1.37–2.09) | 6.636 × 10⁻⁷ | 0.001 | 0.136 | 0.620 | 0.999 | 0.009 | 0.905 | 0.179 | 0.995 | |
| None | rs4761371 | A | 0.46 (0.34–0.63) | 3.914 × 10⁻⁷ | 0.000 | 0.010 | 0.924 | 1.000 | 0.111 | 0.992 | 0.521 | 0.999 | |
| None | rs288604 | G | 1.58 (1.32–1.88) | 2.975 × 10⁻⁷ | 0.001 | 0.279 | 0.207 | 0.996 | 0.001 | 0.473 | 0.032 | 0.971 | |
| MACROD2 | rs6110458 | A | 1.46 (1.27–1.69) | 1.806 × 10⁻⁷ | 0.004 | 0.641 | 0.084 | 0.989 | 0.001 | 0.383 | 0.033 | 0.971 | |
| MACROD2 NCRNA00186 | rs14135 | G | 1.49 (1.28–1.74) | 1.778 × 10⁻⁷ | 0.003 | 0.534 | 0.130 | 0.993 | 0.001 | 0.467 | 0.042 | 0.977 | |
| NCRNA00186 MACROD2 | rs1475531 | C | 1.53 (1.30–1.79) | 2.011 × 10⁻⁷ | 0.001 | 0.402 | 0.083 | 0.989 | 0.000 | 0.213 | 0.013 | 0.929 | |
| PARD3B | rs4675502 | NA | 1.28 (1.16–1.41) | 4.34 × 10⁻⁷ | 0.095 | 0.999 | 0.006 | 0.856 | 0.001 | 0.362 | 0.030 | 0.969 | |
| NA | rs7711337 | NA | 0.82 (0.76–0.89) | 8.25 × 10⁻⁷ | 0.350 | 1.000 | 0.006 | 0.854 | 0.002 | 0.672 | 0.091 | 0.990 | |
| NA | rs7834018 | NA | 0.64 (0.53–0.77) | 7.54 × 10⁻⁷ | 0.003 | 0.333 | 0.465 | 0.999 | 0.007 | 0.871 | 0.186 | 0.996 | |
| TAF1C | rs4150167 | NA | 0.51 (0.39–0.66) | 2.91 × 10⁻⁷ | 0.000 | 0.021 | 0.764 | 1.000 | 0.015 | 0.937 | 0.142 | 0.994 | |
| Gene variants with statistically borderline significance (5 × 10⁻⁸ ≤ p-value < 0.05), FPRP > 0.2 or BFDP > 0.2 from meta-analyses of GWAS | |||||||||||||
| Waltes et al., 2014 [46] | CYFIP1c | rs7170637 | G > A | 0.85 (0.75, 0.96) | 0.007 | 0.625 | 1.000 | 0.934 | 1.000 | 0.898 | 1.000 | 0.993 | 1.000 |
| CAMK4c | rs25925 | C > G | 1.31 (1.04, 1.64) | 0.021 | 0.222 | 0.881 | 0.988 | 1.000 | 0.954 | 1.000 | 0.996 | 1.000 | |
| Anney et al., 2017 [31] | NA | rs1436358 | T vs. C | 0.86 (0.79–0.93) | 0.00001473 | 0.785 | 1.000 | 0.168 | 0.995 | 0.137 | 0.994 | 0.844 | 1.000 |
| MACROD2 MACROD2-AS1 | rs6079556 | A vs. C | 0.94 (0.91–0.97) | 0.00001731 | 1.000 | 1.000 | 0.102 | 0.991 | 0.102 | 0.991 | 0.887 | 1.000 | |
| LINC00535 | chr8_94389815_I | I vs. D | 0.92 (0.89–0.96) | 0.00002102 | 1.000 | 1.000 | 0.109 | 0.992 | 0.109 | 0.992 | 0.867 | 1.000 | |
| LINCR-0001 PRSS55 | rs4840484 | T vs. C | 1.07 (1.04–1.11) | 0.00002307 | 1.000 | 1.000 | 0.232 | 0.997 | 0.232 | 0.997 | 0.945 | 1.000 | |
| Anney et al., 2017 (continued) | ADTRP | rs10947543 | C vs. G | 0.94 (0.91–0.97) | 0.000031 | 1.000 | 1.000 | 0.102 | 0.991 | 0.102 | 0.991 | 0.887 | 1.000 |
| LRRC4 MIR593 SND1 SND1-IT1 | chr7_127644308_D | D vs. I | 0.93 (0.90–0.97) | 0.00003235 | 1.000 | 1.000 | 0.422 | 0.999 | 0.422 | 0.999 | 0.972 | 1.000 | |
| CCDC93 DDX18 INSIG2 | chr2_118616767_D | I vs. D | 0.85 (0.78–0.93) | 0.00003531 | 0.667 | 1.000 | 0.374 | 0.998 | 0.285 | 0.997 | 0.921 | 1.000 | |
| NA | chr14_99235398_I | I vs. D | 0.87 (0.81–0.94) | 0.00003765 | 0.862 | 1.000 | 0.327 | 0.998 | 0.296 | 0.998 | 0.930 | 1.000 | |
| TTBK1 | rs2756174 | A vs. C | 0.94 (0.91–0.97) | 0.00005245 | 1.000 | 1.000 | 0.102 | 0.991 | 0.102 | 0.991 | 0.887 | 1.000 | |
| HCG4B HLA-A HLA-H | rs115254791 | T vs. G | 0.94 (0.90–0.97) | 0.00005321 | 1.000 | 1.000 | 0.102 | 0.991 | 0.102 | 0.991 | 0.887 | 1.000 | |
| MIR2113 | rs9482120 | A vs. C | 0.94 (0.91–0.97) | 0.00009513 | 1.000 | 1.000 | 0.102 | 0.991 | 0.102 | 0.991 | 0.887 | 1.000 | |
| CRTAP SUSD5 | chr3_33191013_D | I vs. D | 0.93 (0.89–0.97) | 0.0000957 | 1.000 | 1.000 | 0.422 | 0.999 | 0.422 | 0.999 | 0.972 | 1.000 | |
| NA | rs9285005 | A vs. G | 0.91 (0.86–0.96) | 0.0001147 | 0.999 | 1.000 | 0.354 | 0.998 | 0.354 | 0.998 | 0.956 | 1.000 | |
| LOC100505609 | rs73065342 | T vs. C | 0.89 (0.83–0.95) | 0.0001169 | 0.976 | 1.000 | 0.322 | 0.998 | 0.317 | 0.998 | 0.941 | 1.000 | |
| DCAF4 DPF3 PAPLN PSEN1 RBM25 ZFYVE1 | rs1203311 | A vs. C | 0.86 (0.79–0.94) | 0.0001394 | 0.756 | 1.000 | 0.540 | 0.999 | 0.470 | 0.999 | 0.960 | 1.000 | |
| MACROD2 | rs192259652 | A vs. T | 0.91 (0.85–0.96) | 0.0001438 | 0.999 | 1.000 | 0.354 | 0.998 | 0.354 | 0.998 | 0.956 | 1.000 | |
| FOXP1 | rs76188283 | T vs. C | 1.09 (1.05–1.14) | 0.0002093 | 1.000 | 1.000 | 0.142 | 0.994 | 0.142 | 0.994 | 0.892 | 1.000 | |
| CCDC38 NTN4 SNRPF | chr12_96221819_D | I vs. D | 0.94 (0.91–0.97) | 0.0002128 | 1.000 | 1.000 | 0.102 | 0.991 | 0.102 | 0.991 | 0.887 | 1.000 | |
| NA | chr3_182308608_I | D vs. I | 0.94 (0.90–0.97) | 0.0002755 | 1.000 | 1.000 | 0.102 | 0.991 | 0.102 | 0.991 | 0.887 | 1.000 | |
| ASTN2 PAPPA PAPPA-AS1 | rs7026354 | A vs. G | 1.05 (1.03–1.08) | 0.0003018 | 1.000 | 1.000 | 0.407 | 0.999 | 0.407 | 0.999 | 0.979 | 1.000 | |
| NA | rs2368140 | A vs. G | 0.94 (0.91–0.98) | 0.0003049 | 1.000 | 1.000 | 0.783 | 1.000 | 0.783 | 1.000 | 0.993 | 1.000 | |
| NA | rs13016472 | T vs. C | 0.94 (0.91–0.98) | 0.0003629 | 1.000 | 1.000 | 0.783 | 1.000 | 0.783 | 1.000 | 0.993 | 1.000 | |
| DSCAM | rs62235658 | T vs. C | 0.92 (0.87–0.97) | 0.0004132 | 1.000 | 1.000 | 0.668 | 1.000 | 0.668 | 1.000 | 0.986 | 1.000 | |
| NA | rs3113169 | C vs. G | 0.93 (0.90–0.97) | 0.0004234 | 1.000 | 1.000 | 0.422 | 0.999 | 0.422 | 0.999 | 0.972 | 1.000 | |
| CASKIN2 GGA3 GRB2 LOC100287042 MIF4GD MIR3678 MIR6785 MRPS7 NUP85 SLC25A19 TMEM94 TSEN54 | rs12950709 | A vs. G | 0.92 (0.87–0.97) | 0.0004387 | 1.000 | 1.000 | 0.668 | 1.000 | 0.668 | 1.000 | 0.986 | 1.000 | |
| CAMP CDC25A CSPG5 DHX30 MAP4 MIR1226 MIR4443 SMARCC1 ZNF589 | rs7429990 | A vs. C | 0.94 (0.91–0.97) | 0.0004525 | 1.000 | 1.000 | 0.102 | 0.991 | 0.102 | 0.991 | 0.887 | 1.000 | |
| NA | chr8_84959513_D | D vs. I | 0.89 (0.83–0.96) | 0.0004634 | 0.956 | 1.000 | 0.728 | 1.000 | 0.718 | 1.000 | 0.985 | 1.000 | |
| ACTN2 | rs4659712 | A vs. G | 0.95 (0.92–0.98) | 0.0004976 | 1.000 | 1.000 | 0.550 | 0.999 | 0.550 | 0.999 | 0.986 | 1.000 | |
| ASB4 | rs113706540 | T vs. C | 0.93 (0.88–0.97) | 0.0005006 | 1.000 | 1.000 | 0.422 | 0.999 | 0.422 | 0.999 | 0.972 | 1.000 | |
| GJD4 | rs7897060 | C vs. G | 0.95 (0.91–0.98) | 0.0005789 | 1.000 | 1.000 | 0.550 | 0.999 | 0.550 | 0.999 | 0.986 | 1.000 | |
| AK5 DNAJB4 FAM73A FUBP1 GIPC2 MGC27382 NEXN NEXN-AS1 USP33 ZZZ3 | rs12126604 | T vs. C | 0.92 (0.87–0.97) | 0.0006161 | 1.000 | 1.000 | 0.668 | 1.000 | 0.668 | 1.000 | 0.986 | 1.000 | |
| SEMA6D | rs17387110 | T vs. G | 0.95 (0.92–0.98) | 0.0006996 | 1.000 | 1.000 | 0.550 | 0.999 | 0.550 | 0.999 | 0.986 | 1.000 | |
| NA | chr16_62649826_D | D vs. I | 0.87 (0.80–0.95) | 0.0007369 | 0.831 | 1.000 | 0.697 | 1.000 | 0.657 | 0.999 | 0.979 | 1.000 | |
| NA | rs4239875 | A vs. G | 1.06 (1.03–1.10) | 0.0008018 | 1.000 | 1.000 | 0.672 | 1.000 | 0.672 | 1.000 | 0.990 | 1.000 | |
| CTNNA3 DNAJC12 HERC4 MYPN POU5F1P5 SIRT1 | chr10_69763783_D | I vs. D | 0.91 (0.86–0.97) | 0.0008401 | 0.997 | 1.000 | 0.792 | 1.000 | 0.791 | 1.000 | 0.991 | 1.000 | |
| CLIC5 ENPP4 ENPP5 | rs7762549 | A vs. G | 0.95 (0.92–0.98) | 0.00085 | 1.000 | 1.000 | 0.550 | 0.999 | 0.550 | 0.999 | 0.986 | 1.000 | |
| NA | chr18_76035713_D | D vs. I | 0.93 (0.88–0.97) | 0.000884 | 1.000 | 1.000 | 0.422 | 0.999 | 0.422 | 0.999 | 0.972 | 1.000 | |
| BRICD5 CASKIN1 DNASE1L2 E4F1 MIR3180-5 MIR4516 MLST8 PGP PKD1 RAB26 SNHG19 SNORD60 TRAF7 | rs2078282 | A vs. G | 0.94 (0.91–0.98) | 0.0009187 | 1.000 | 1.000 | 0.783 | 1.000 | 0.783 | 1.000 | 0.993 | 1.000 | |
| OPCML | rs7952100 | C vs. G | 1.06 (1.03–1.10) | 0.0009399 | 1.000 | 1.000 | 0.672 | 1.000 | 0.672 | 1.000 | 0.990 | 1.000 | |
| LOC101927907 LRRTM4 | rs58500924 | A vs. G | 0.90 (0.84–0.96) | 0.0009721 | 0.990 | 1.000 | 0.581 | 0.999 | 0.579 | 0.999 | 0.977 | 1.000 | |
| RNGTT | rs35675874 | A vs. G | 0.94 (0.91–0.98) | 0.001031 | 1.000 | 1.000 | 0.783 | 1.000 | 0.783 | 1.000 | 0.993 | 1.000 | |
| LOC101928505 LOC101928539 | chr5_57079215_I | D vs. I | 1.07 (1.03–1.11) | 0.001076 | 1.000 | 1.000 | 0.232 | 0.997 | 0.232 | 0.997 | 0.945 | 1.000 | |
| DPP4 SLC4A10 | rs2909451 | T vs. C | 0.94 (0.90–0.98) | 0.001078 | 1.000 | 1.000 | 0.783 | 1.000 | 0.783 | 1.000 | 0.993 | 1.000 | |
| ERAP2 LNPEP | rs55767008 | T vs. C | 0.89 (0.82–0.96) | 0.001182 | 0.956 | 1.000 | 0.728 | 1.000 | 0.718 | 1.000 | 0.985 | 1.000 | |
| C2orf15 KIAA1211L LIPT1 LOC101927070 TSGA10 | rs10202643 | A vs. T | 0.95 (0.92–0.98) | 0.001269 | 1.000 | 1.000 | 0.550 | 0.999 | 0.550 | 0.999 | 0.986 | 1.000 | |
| AUTS2 | rs2293507 | T vs. G | 0.88 (0.81–0.96) | 0.001337 | 0.890 | 1.000 | 0.817 | 1.000 | 0.799 | 1.000 | 0.989 | 1.000 | |
| NA | rs138457704 | A vs. G | 1.07 (1.03–1.11) | 0.001357 | 1.000 | 1.000 | 0.232 | 0.997 | 0.232 | 0.997 | 0.945 | 1.000 | |
| GLDC | rs13288399 | C vs. G | 0.95 (0.91–0.98) | 0.001357 | 1.000 | 1.000 | 0.550 | 0.999 | 0.550 | 0.999 | 0.986 | 1.000 | |
| MTFR1 PDE7A | rs1513723 | C vs. G | 0.95 (0.92–0.98) | 0.001447 | 1.000 | 1.000 | 0.550 | 0.999 | 0.550 | 0.999 | 0.986 | 1.000 | |
| ASTN2 ASTN2-AS1 PAPPA TRIM32 | rs146737360 | T vs. G | 0.95 (0.92–0.98) | 0.001534 | 1.000 | 1.000 | 0.550 | 0.999 | 0.550 | 0.999 | 0.986 | 1.000 | |
| NA | chr6_45726254_D | D vs. I | 0.90 (0.83–0.96) | 0.001606 | 0.990 | 1.000 | 0.581 | 0.999 | 0.579 | 0.999 | 0.977 | 1.000 | |
| NA | rs6742513 | C vs. G | 1.07 (1.03–1.11) | 0.001611 | 1.000 | 1.000 | 0.232 | 0.997 | 0.232 | 0.997 | 0.945 | 1.000 | |
| NA | rs73204738 | A vs. C | 0.92 (0.88–0.97) | 0.001617 | 1.000 | 1.000 | 0.668 | 1.000 | 0.668 | 1.000 | 0.986 | 1.000 | |
| LINC01553 | rs11817353 | A vs. C | 0.95 (0.92–0.98) | 0.001678 | 1.000 | 1.000 | 0.550 | 0.999 | 0.550 | 0.999 | 0.986 | 1.000 | |
| Anney et al., 2017 (continued) | RAD51B | rs2842330 | A vs. C | 1.10 (1.04–1.16) | 0.001845 | 0.999 | 1.000 | 0.303 | 0.998 | 0.303 | 0.998 | 0.946 | 1.000 |
| RBFOX1 | rs12930616 | C vs. G | 1.05 (1.02–1.09) | 0.001985 | 1.000 | 1.000 | 0.913 | 1.000 | 0.913 | 1.000 | 0.998 | 1.000 | |
| GRID2 | rs6811974 | T vs. C | 0.95 (0.93–0.98) | 0.001995 | 1.000 | 1.000 | 0.550 | 0.999 | 0.550 | 0.999 | 0.986 | 1.000 | |
| NA | rs7135621 | T vs. C | 0.96 (0.93–0.98) | 0.002059 | 1.000 | 1.000 | 0.094 | 0.991 | 0.094 | 0.991 | 0.915 | 1.000 | |
| GFER NOXO1 NPW RNF151 RPS2 SNHG9 SNORA78 SYNGR3 TBL3 ZNF598 | rs55742253 | T vs. C | 0.93 (0.88–0.98) | 0.002075 | 1.000 | 1.000 | 0.868 | 1.000 | 0.868 | 1.000 | 0.995 | 1.000 | |
| PTPRB | rs10784860 | T vs. C | 0.95 (0.91–0.98) | 0.002211 | 1.000 | 1.000 | 0.550 | 0.999 | 0.550 | 0.999 | 0.986 | 1.000 | |
| LOC101927768 | rs9387201 | C vs. G | 1.09 (1.03–1.14) | 0.002427 | 1.000 | 1.000 | 0.142 | 0.994 | 0.142 | 0.994 | 0.892 | 1.000 | |
| BTBD11 LOC101929162 PRDM4 PWP1 | rs4964602 | T vs. G | 0.95 (0.91–0.98) | 0.00256 | 1.000 | 1.000 | 0.550 | 0.999 | 0.550 | 0.999 | 0.986 | 1.000 | |
| NA | rs1376888 | T vs. C | 1.05 (1.02–1.08) | 0.002668 | 1.000 | 1.000 | 0.407 | 0.999 | 0.407 | 0.999 | 0.979 | 1.000 | |
| KLHL29 | rs10182178 | A vs. G | 1.05 (1.02–1.08) | 0.003508 | 1.000 | 1.000 | 0.407 | 0.999 | 0.407 | 0.999 | 0.979 | 1.000 | |
| UBE2H | rs78661858 | A vs. G | 0.91 (0.85–0.97) | 0.003665 | 0.997 | 1.000 | 0.792 | 1.000 | 0.791 | 1.000 | 0.991 | 1.000 | |
| VAPA | rs29063 | A vs. G | 1.04 (1.01–1.07) | 0.004075 | 1.000 | 1.000 | 0.873 | 1.000 | 0.873 | 1.000 | 0.997 | 1.000 | |
| NA | rs190401890 | A vs. T | 1.12 (1.04–1.20) | 0.004114 | 0.975 | 1.000 | 0.568 | 0.999 | 0.562 | 0.999 | 0.975 | 1.000 | |
| LOC102723427 | rs192668887 | T vs. C | 0.91 (0.84–0.97) | 0.004205 | 0.997 | 1.000 | 0.792 | 1.000 | 0.791 | 1.000 | 0.991 | 1.000 | |
| SLC12A7 | rs73031119 | A vs. C | 0.91 (0.84–0.97) | 0.004399 | 0.997 | 1.000 | 0.792 | 1.000 | 0.791 | 1.000 | 0.991 | 1.000 | |
| ADGRL2 | rs75695875 | A vs. G | 0.93 (0.87–0.98) | 0.004715 | 1.000 | 1.000 | 0.868 | 1.000 | 0.868 | 1.000 | 0.995 | 1.000 | |
| NA | rs1943999 | C vs. G | 0.96 (0.92–0.99) | 0.004915 | 1.000 | 1.000 | 0.903 | 1.000 | 0.903 | 1.000 | 0.998 | 1.000 | |
| DNAH6 | rs2222734 | A vs. G | 0.92 (0.87–0.98) | 0.005058 | 0.999 | 1.000 | 0.906 | 1.000 | 0.906 | 1.000 | 0.996 | 1.000 | |
| OR8A1 OR8B12 | rs2226753 | T vs. C | 0.96 (0.93–0.99) | 0.005074 | 1.000 | 1.000 | 0.903 | 1.000 | 0.903 | 1.000 | 0.998 | 1.000 | |
| TUSC5 | rs35713482 | A vs. G | 1.05 (1.01–1.08) | 0.005154 | 1.000 | 1.000 | 0.407 | 0.999 | 0.407 | 0.999 | 0.979 | 1.000 | |
| C5orf15 VDAC1 | rs67120295 | T vs. C | 1.06 (1.02–1.10) | 0.005745 | 1.000 | 1.000 | 0.672 | 1.000 | 0.672 | 1.000 | 0.990 | 1.000 | |
| NA | rs76010911 | A vs. G | 1.11 (1.04–1.19) | 0.006255 | 0.986 | 1.000 | 0.769 | 1.000 | 0.767 | 1.000 | 0.989 | 1.000 | |
| MTMR9 SLC35G5 TDH | rs6601581 | T vs. C | 1.06 (1.02–1.11) | 0.006463 | 1.000 | 1.000 | 0.930 | 1.000 | 0.930 | 1.000 | 0.998 | 1.000 | |
| HSDL2 MIR3134 PTBP3 SUSD1 | rs7024761 | A vs. G | 1.05 (1.02–1.09) | 0.00648 | 1.000 | 1.000 | 0.913 | 1.000 | 0.913 | 1.000 | 0.998 | 1.000 | |
| CRTC3 GABARAPL3 IQGAP1 ZNF774 | rs2601187 | A vs. G | 1.05 (1.01–1.08) | 0.006859 | 1.000 | 1.000 | 0.407 | 0.999 | 0.407 | 0.999 | 0.979 | 1.000 | |
| LOC101927189 LRRC1 | rs4715431 | A vs. G | 1.04 (1.01–1.08) | 0.007007 | 1.000 | 1.000 | 0.977 | 1.000 | 0.977 | 1.000 | 0.999 | 1.000 | |
| NA | rs646680 | A vs. G | 0.95 (0.92–0.99) | 0.00723 | 1.000 | 1.000 | 0.937 | 1.000 | 0.937 | 1.000 | 0.998 | 1.000 | |
| CCNE1 | rs12609867 | A vs. G | 0.95 (0.91–0.99) | 0.00743 | 1.000 | 1.000 | 0.937 | 1.000 | 0.937 | 1.000 | 0.998 | 1.000 | |
| NOS1AP OLFML2B | rs75192393 | T vs. C | 1.07 (1.02–1.12) | 0.007697 | 1.000 | 1.000 | 0.787 | 1.000 | 0.787 | 1.000 | 0.993 | 1.000 | |
| KDM4A KDM4A-AS1 LOC101929592 MIR6079 PTPRF ST3GAL3 | rs79857083 | T vs. C | 1.04 (1.01–1.08) | 0.007758 | 1.000 | 1.000 | 0.977 | 1.000 | 0.977 | 1.000 | 0.999 | 1.000 | |
| NA | rs142968358 | T vs. G | 1.04 (1.01–1.07) | 0.007789 | 1.000 | 1.000 | 0.873 | 1.000 | 0.873 | 1.000 | 0.997 | 1.000 | |
| C3orf30 IGSF11 IGSF11-AS1 UPK1B | rs1102586 | A vs. G | 1.06 (1.02–1.10) | 0.007844 | 1.000 | 1.000 | 0.672 | 1.000 | 0.672 | 1.000 | 0.990 | 1.000 | |
| NA | chr11_98107192_D | D vs. I | 1.04 (1.01–1.08) | 0.00785 | 1.000 | 1.000 | 0.977 | 1.000 | 0.977 | 1.000 | 0.999 | 1.000 | |
| C9orf135 | rs76014157 | A vs. G | 0.90 (0.82–0.98) | 0.007946 | 0.962 | 1.000 | 0.941 | 1.000 | 0.939 | 1.000 | 0.997 | 1.000 | |
| NA | rs6437449 | A vs. G | 1.07 (1.02–1.11) | 0.008708 | 1.000 | 1.000 | 0.232 | 0.997 | 0.232 | 0.997 | 0.945 | 1.000 | |
| MYO5A | chr15_52811815_D | I vs. D | 0.90 (0.81–0.98) | 0.008799 | 0.962 | 1.000 | 0.941 | 1.000 | 0.939 | 1.000 | 0.997 | 1.000 | |
| NA | rs9466619 | A vs. G | 0.95 (0.92–0.99) | 0.009071 | 1.000 | 1.000 | 0.937 | 1.000 | 0.937 | 1.000 | 0.998 | 1.000 | |
| NA | rs6117854 | A vs. G | 0.96 (0.93–0.99) | 0.01012 | 1.000 | 1.000 | 0.903 | 1.000 | 0.903 | 1.000 | 0.998 | 1.000 | |
| C7orf33 | rs6955951 | A vs. T | 1.04 (1.01–1.07) | 0.01015 | 1.000 | 1.000 | 0.873 | 1.000 | 0.873 | 1.000 | 0.997 | 1.000 | |
| LHX6 | rs72767788 | A vs. C | 0.95 (0.91–0.99) | 0.01093 | 1.000 | 1.000 | 0.937 | 1.000 | 0.937 | 1.000 | 0.998 | 1.000 | |
| NA | rs2028664 | A vs. C | 1.04 (1.01–1.07) | 0.01095 | 1.000 | 1.000 | 0.873 | 1.000 | 0.873 | 1.000 | 0.997 | 1.000 | |
| ELAVL2 | rs180861134 | A vs. T | 1.05 (1.01–1.09) | 0.01104 | 1.000 | 1.000 | 0.913 | 1.000 | 0.913 | 1.000 | 0.998 | 1.000 | |
| RASGEF1C | rs12659560 | T vs. C | 1.04 (1.01–1.07) | 0.0112 | 1.000 | 1.000 | 0.873 | 1.000 | 0.873 | 1.000 | 0.997 | 1.000 | |
| MIR548AZ SYNE2 | rs2150291 | T vs. C | 1.05 (1.01–1.09) | 0.0113 | 1.000 | 1.000 | 0.913 | 1.000 | 0.913 | 1.000 | 0.998 | 1.000 | |
| WDFY4 | rs118059975 | A vs. C | 0.95 (0.91–0.99) | 0.01146 | 1.000 | 1.000 | 0.937 | 1.000 | 0.937 | 1.000 | 0.998 | 1.000 | |
| LINC01525 MAN1A2 | rs3820500 | A vs. G | 1.04 (1.01–1.07) | 0.0116 | 1.000 | 1.000 | 0.873 | 1.000 | 0.873 | 1.000 | 0.997 | 1.000 | |
| GALNT10 | rs17629195 | T vs. C | 1.04 (1.01–1.07) | 0.012 | 1.000 | 1.000 | 0.873 | 1.000 | 0.873 | 1.000 | 0.997 | 1.000 | |
| MIR597 TNKS | rs78853604 | T vs. C | 1.05 (1.01–1.08) | 0.01256 | 1.000 | 1.000 | 0.407 | 0.999 | 0.407 | 0.999 | 0.979 | 1.000 | |
| EXT1 | rs7835763 | A vs. T | 1.04 (1.01–1.08) | 0.01283 | 1.000 | 1.000 | 0.977 | 1.000 | 0.977 | 1.000 | 0.999 | 1.000 | |
| NA | rs4652928 | A vs. G | 0.96 (0.92–0.99) | 0.01384 | 1.000 | 1.000 | 0.903 | 1.000 | 0.903 | 1.000 | 0.998 | 1.000 | |
| PDE1C | rs11976985 | T vs. C | 0.95 (0.92–0.99) | 0.0141 | 1.000 | 1.000 | 0.937 | 1.000 | 0.937 | 1.000 | 0.998 | 1.000 | |
| BAX FTL GYS1 | rs2230267 | T vs. C | 1.04 (1.01–1.07) | 0.01429 | 1.000 | 1.000 | 0.873 | 1.000 | 0.873 | 1.000 | 0.997 | 1.000 | |
| Anney et al., 2017 (continued) | GRID2 | rs6854329 | C vs. G | 0.92 (0.86–0.99) | 0.01486 | 0.996 | 1.000 | 0.963 | 1.000 | 0.963 | 1.000 | 0.998 | 1.000 |
| NA | rs1926229 | C vs. G | 1.05 (1.01–1.08) | 0.01496 | 1.000 | 1.000 | 0.407 | 0.999 | 0.407 | 0.999 | 0.979 | 1.000 | |
| NA | rs261351 | T vs. C | 0.96 (0.93–0.99) | 0.01498 | 1.000 | 1.000 | 0.903 | 1.000 | 0.903 | 1.000 | 0.998 | 1.000 | |
| RAPGEF2 | rs4440173 | A vs. G | 1.04 (1.01–1.07) | 0.01564 | 1.000 | 1.000 | 0.873 | 1.000 | 0.873 | 1.000 | 0.997 | 1.000 | |
| MIR4650-1 MIR4650-2 POM121 SBDSP1 SPDYE7P TYW1B | rs4392770 | T vs. C | 1.05 (1.01–1.09) | 0.01564 | 1.000 | 1.000 | 0.913 | 1.000 | 0.913 | 1.000 | 0.998 | 1.000 | |
| NA | rs138493916 | C vs. G | 1.08 (1.02–1.14) | 0.01783 | 1.000 | 1.000 | 0.840 | 1.000 | 0.840 | 1.000 | 0.994 | 1.000 | |
| NA | rs615512 | A vs. G | 1.08 (1.02–1.14) | 0.01811 | 1.000 | 1.000 | 0.840 | 1.000 | 0.840 | 1.000 | 0.994 | 1.000 | |
| EP400 EP400NL PUS1 SNORA49 | rs11608890 | T vs. G | 0.94 (0.88–0.99) | 0.0187 | 1.000 | 1.000 | 0.951 | 1.000 | 0.951 | 1.000 | 0.998 | 1.000 | |
| DIAPH3 | chr13_60161890_I | I vs. D | 1.05 (1.01–1.09) | 0.01984 | 1.000 | 1.000 | 0.913 | 1.000 | 0.913 | 1.000 | 0.998 | 1.000 | |
| ADAM12 | rs1674923 | T vs. C | 0.96 (0.93–0.99) | 0.0203 | 1.000 | 1.000 | 0.903 | 1.000 | 0.903 | 1.000 | 0.998 | 1.000 | |
| ATP2B2 GHRL GHRLOS IRAK2 LINC00852 MIR378B MIR885 SEC13 TATDN2 | rs7619385 | A vs. G | 1.04 (1.01–1.07) | 0.02102 | 1.000 | 1.000 | 0.873 | 1.000 | 0.873 | 1.000 | 0.997 | 1.000 | |
| UNC13C | rs75099274 | A vs. G | 1.08 (1.01–1.14) | 0.02123 | 1.000 | 1.000 | 0.840 | 1.000 | 0.840 | 1.000 | 0.994 | 1.000 | |
| ZSWIM6 | rs10053166 | A vs. G | 0.95 (0.90–0.99) | 0.02226 | 1.000 | 1.000 | 0.937 | 1.000 | 0.937 | 1.000 | 0.998 | 1.000 | |
| HIVEP3 | rs2786484 | T vs. C | 0.93 (0.86–0.99) | 0.0237 | 1.000 | 1.000 | 0.958 | 1.000 | 0.958 | 1.000 | 0.998 | 1.000 | |
| FJX1 TRIM44 | rs76847144 | T vs. C | 0.93 (0.86–0.99) | 0.02643 | 1.000 | 1.000 | 0.958 | 1.000 | 0.958 | 1.000 | 0.998 | 1.000 | |
| WBSCR17 | rs148521358 | C vs. G | 0.94 (0.88–0.99) | 0.02731 | 1.000 | 1.000 | 0.951 | 1.000 | 0.951 | 1.000 | 0.998 | 1.000 | |
| MIR3134 SUSD1 | rs2564899 | T vs. C | 0.97 (0.94–1.00) | 0.02735 | 1.000 | 1.000 | 0.980 | 1.000 | 0.980 | 1.000 | 0.999 | 1.000 | |
| NA | chr8_138837351_I | I vs. D | 1.05 (1.01–1.09) | 0.0284 | 1.000 | 1.000 | 0.913 | 1.000 | 0.913 | 1.000 | 0.998 | 1.000 | |
| LINC01393 MDFIC | rs7799732 | A vs. G | 1.03 (1.00–1.06) | 0.03114 | 1.000 | 1.000 | 0.978 | 1.000 | 0.978 | 1.000 | 0.999 | 1.000 | |
| TBX18 TBX18-AS1 | rs76397051 | A vs. G | 1.05 (1.01–1.10) | 0.034 | 1.000 | 1.000 | 0.975 | 1.000 | 0.975 | 1.000 | 0.999 | 1.000 | |
| NA | rs171794 | T vs. C | 1.06 (1.01–1.12) | 0.03587 | 1.000 | 1.000 | 0.974 | 1.000 | 0.974 | 1.000 | 0.999 | 1.000 | |
| GDA | rs4327921 | A vs. G | 0.97 (0.94–1.00) | 0.03938 | 1.000 | 1.000 | 0.980 | 1.000 | 0.980 | 1.000 | 0.999 | 1.000 | |
| NA | rs2167341 | T vs. G | 1.05 (1.00–1.10) | 0.04203 | 1.000 | 1.000 | 0.975 | 1.000 | 0.975 | 1.000 | 0.999 | 1.000 | |
| EVA1C | rs62216215 | A vs. C | 1.04 (1.00–1.08) | 0.04598 | 1.000 | 1.000 | 0.977 | 1.000 | 0.977 | 1.000 | 0.999 | 1.000 | |
| LINC01036 | rs17589281 | T vs. C | 0.95 (0.89–1.00) | 0.04716 | 1.000 | 1.000 | 0.980 | 1.000 | 0.980 | 1.000 | 0.999 | 1.000 | |
| LOC283585 | rs61979775 | T vs. C | 0.97 (0.93–1.00) | 0.04813 | 1.000 | 1.000 | 0.980 | 1.000 | 0.980 | 1.000 | 0.999 | 1.000 | |
| CHMP4A GMPR2 MDP1 NEDD8 NEDD8-MDP1 TM9SF1 TSSK4 | rs72694312 | T vs. G | 1.06 (1.00–1.11) | 0.04814 | 1.000 | 1.000 | 0.930 | 1.000 | 0.930 | 1.000 | 0.998 | 1.000 | |
| Ma et al., 2009 [32] | NA | rs10065041 | T(minor)/C(major) | 1.21 (1.08–1.36) | 3.24 × 10⁻⁴ | 0.445 | 1.000 | 0.757 | 1.000 | 0.581 | 0.999 | 0.970 | 1.000 |
| NA | rs10038113 | C(minor)/T(major) | 0.75 (0.70–0.90) | 3.40 × 10⁻⁶ | 0.129 | 0.897 | 0.939 | 1.000 | 0.688 | 1.000 | 0.979 | 1.000 | |
| NA | rs6894838 | T(minor)/C(major) | 1.26 (1.12–1.42) | 8.00 × 10⁻⁵ | 0.212 | 0.998 | 0.416 | 0.999 | 0.131 | 0.993 | 0.827 | 1.000 | |
| Anney et al., 2010 [30] | HAT1 | rs6731562 | G (minor allele) | 1.25 (1.11–1.41) | 2.0 × 10⁻⁴ | 0.253 | 0.998 | 0.527 | 0.999 | 0.220 | 0.996 | 0.891 | 1.000 |
| POU6F2 | rs10258862 | G (minor allele) | 1.09 (1.00–1.18) | 4.6 × 10⁻² | 0.991 | 1.000 | 0.971 | 1.000 | 0.971 | 1.000 | 0.998 | 1.000 | |
| NA | rs6557675 | A (minor allele) | 0.84 (0.76–0.93) | 1.0 × 10⁻³ | 0.561 | 1.000 | 0.583 | 0.999 | 0.440 | 0.999 | 0.953 | 1.000 | |
| MYH11 | rs17284809 | A (minor allele) | 0.63 (0.50–0.79) | 5.7 × 10⁻⁵ | 0.008 | 0.312 | 0.891 | 1.000 | 0.168 | 0.995 | 0.821 | 1.000 | |
| GSG1L | rs205409 | G (minor allele) | 0.91 (0.84–0.99) | 2.8 × 10⁻² | 0.980 | 1.000 | 0.966 | 1.000 | 0.966 | 1.000 | 0.998 | 1.000 | |
| TAF1C | rs4150167 | A (minor allele) | 0.54 (0.40–0.73) | 2.1 × 10⁻⁵ | 0.002 | 0.085 | 0.963 | 1.000 | 0.420 | 0.999 | 0.905 | 1.000 | |
| Kuo et al., 2015 [33] | GLIS1 | rs12082358 | C (minor allele) | 1.3 (1.1–1.5) | 2.2 × 10⁻⁴ | 0.136 | 0.975 | 0.705 | 1.000 | 0.251 | 0.997 | 0.906 | 1.000 |
| GLIS1 | rs12080993 | A (minor allele) | 1.3 (1.1–1.5) | 1.5 × 10⁻⁴ | 0.136 | 0.975 | 0.705 | 1.000 | 0.251 | 0.997 | 0.906 | 1.000 | |
| GPD2 | rs3916984 | A (minor allele) | 1.3 (1.1–1.5) | 3.1 × 10⁻⁴ | 0.136 | 0.975 | 0.705 | 1.000 | 0.251 | 0.997 | 0.906 | 1.000 | |
| LRP2/BBS5 | rs13014164 | C (minor allele) | 1.7 (1.3–2.3) | 8.6 × 10⁻⁵ | 0.012 | 0.209 | 0.980 | 1.000 | 0.735 | 1.000 | 0.974 | 1.000 | |
| PDGFRA | rs7697680 | G (minor allele) | 1.5 (1.2–1.9) | 9.2 × 10⁻⁴ | 0.032 | 0.500 | 0.960 | 1.000 | 0.607 | 0.999 | 0.967 | 1.000 | |
| FSTL4 | rs11741756 | A (minor allele) | 1.3 (1.1–1.5) | 1.2 × 10⁻² | 0.136 | 0.975 | 0.705 | 1.000 | 0.251 | 0.997 | 0.906 | 1.000 | |
| NA | rs13211684 | G (minor allele) | 1.3 (1.1–1.5) | 2.5 × 10⁻³ | 0.136 | 0.975 | 0.705 | 1.000 | 0.251 | 0.997 | 0.906 | 1.000 | |
| NA | rs10966205 | T (minor allele) | 1.3 (1.2–1.5) | 2.9 × 10⁻⁵ | 0.136 | 0.975 | 0.705 | 1.000 | 0.251 | 0.997 | 0.906 | 1.000 | |
| C10orf68 | rs10763893 | A (minor allele) | 1.6 (1.2–2.2) | 6.1 × 10⁻⁴ | 0.038 | 0.346 | 0.990 | 1.000 | 0.917 | 1.000 | 0.992 | 1.000 | |
| NA | rs12366025 | A (minor allele) | 1.3 (1.1–1.6) | 3.8 × 10⁻³ | 0.225 | 0.912 | 0.983 | 1.000 | 0.936 | 1.000 | 0.995 | 1.000 | |
| NA | rs11030597 | G (minor allele) | 1.3 (1.1–1.6) | 4.1 × 10⁻³ | 0.225 | 0.912 | 0.983 | 1.000 | 0.936 | 1.000 | 0.995 | 1.000 | |
| NA | rs7933990 | A (minor allele) | 1.3 (1.1–1.6) | 2.5 × 10⁻³ | 0.225 | 0.912 | 0.983 | 1.000 | 0.936 | 1.000 | 0.995 | 1.000 | |
| NA | rs11030606 | A (minor allele) | 1.3 (1.1–1.6) | 5.6 × 10⁻³ | 0.225 | 0.912 | 0.983 | 1.000 | 0.936 | 1.000 | 0.995 | 1.000 | |
| MACROD2 | rs17263514 | A (minor allele) | 1.2 (1.0–1.4) | 1.4 × 10⁻² | 0.500 | 0.998 | 0.976 | 1.000 | 0.953 | 1.000 | 0.996 | 1.000 | |
| BCAS1/CYP24A1 | rs12479663 | C (minor allele) | 1.5 (1.3–1.9) | 4.0 × 10⁻⁵ | 0.032 | 0.500 | 0.960 | 1.000 | 0.607 | 0.999 | 0.967 | 1.000 | |
| Author, Year | Gene | Variant | Comparison | OR (95% CI) | p-Value | Power OR 1.2 | Power OR 1.5 | FPRP Values at Prior Probability | BFDP 0.001 | BFDP 0.000001 | |||
|---|---|---|---|---|---|---|---|---|---|---|---|---|---|
| OR 1.2 | OR 1.5 | ||||||||||||
| 0.001 | 0.000001 | 0.001 | 0.000001 | ||||||||||
| Gene variants with statistically significance (p-value < 5 × 10⁻⁸), FPRP < 0.2 and BFDP < 0.8 from GWAS catalog | |||||||||||||
| Anney et al., 2010 [30] | MACROD2 | rs4141463 | NA | 1.37 (1.22–1.52) | 4.00 × 10⁻⁸ | 0.006 | 0.956 | 0.000 | 0.316 | 0.000 | 0.003 | 0.000 | 0.208 |
| Chaste et al., 2014 [35] | AL163541.1 | rs4773054 | NA | 2.66 (1.83–3.86) | 5.00 × 10⁻⁸ | 0.000 | 0.001 | 0.949 | 1.000 | 0.169 | 0.995 | 0.526 | 0.999 |
| Gene variants with statistically borderline significance (5 × 10⁻⁸ ≤ p-value < 0.05), FPRP < 0.2 and BFDP < 0.8 from GWAS catalog | |||||||||||||
| Anney et al., 2010 [30] | PPP2R5C | rs7142002 | NA | 1.56 (1.28–1.89) | 3.00 × 10⁻⁶ | 0.004 | 0.344 | 0.602 | 0.999 | 0.016 | 0.942 | 0.338 | 0.998 |
| Anney et al., 2012 [34] | TAF1C | rs4150167 | NA | 1.96 (1.52–2.56) | 3.00 × 10⁻⁷ | 0.000 | 0.025 | 0.832 | 1.000 | 0.031 | 0.969 | 0.269 | 0.997 |
| Anney et al., 2012 [34] | PARD3B | rs4675502 | NA | 1.28 (1.16–1.41) | 4.00 × 10⁻⁷ | 0.095 | 0.999 | 0.006 | 0.856 | 0.001 | 0.362 | 0.030 | 0.969 |
| Anney et al., 2012 [34] | AC113414.1 | rs7711337 | NA | 1.22 (1.12–1.32) | 8.00 × 10⁻⁷ | 0.340 | 1.000 | 0.002 | 0.689 | 0.001 | 0.429 | 0.038 | 0.975 |
| Anney et al., 2012 [34] | AC009446.1, EYA1 | rs7834018 | NA | 1.56 (1.3–1.89) | 8.00 × 10⁻⁷ | 0.004 | 0.344 | 0.602 | 0.999 | 0.016 | 0.942 | 0.338 | 0.998 |
| Anney et al., 2017 [31] | AL133270.1, AL139093.1 | rs142968358 | T (risk allele) | 1.1 (1.06–1.14) | 1.00 × 10⁻⁶ | 1.000 | 1.000 | 0.000 | 0.145 | 0.000 | 0.145 | 0.014 | 0.936 |
| Anney et al., 2017 [31] | EXT1 | rs7835763 | A (risk allele) | 1.1 (1.06–1.14) | 2.00 × 10⁻⁶ | 1.000 | 1.000 | 0.000 | 0.145 | 0.000 | 0.145 | 0.014 | 0.936 |
| Chaste et al., 2014 [35] | INHCAP | rs1867503 | NA | 1.55 (1.30–1.84) | 4.00 × 10⁻⁷ | 0.002 | 0.354 | 0.241 | 0.997 | 0.002 | 0.608 | 0.058 | 0.984 |
| Chaste et al., 2014 [35] | CUEDC2 | rs1409313 | NA | 1.75 (1.40–2.18) | 4.00 × 10⁻⁷ | 0.000 | 0.085 | 0.610 | 0.999 | 0.007 | 0.876 | 0.121 | 0.993 |
| Chaste et al., 2014 [35] | CTU2 | rs11641365 | NA | 2.06 (1.54–2.76) | 3.00 × 10⁻⁷ | 0.000 | 0.017 | 0.897 | 1.000 | 0.071 | 0.987 | 0.433 | 0.999 |
| Chaste et al., 2014 [35] | AC067752.1, AC024598.1, ZNF365 | rs93895 | NA | 1.91 (1.48–2.47) | 2.00 × 10⁻⁷ | 0.000 | 0.033 | 0.804 | 1.000 | 0.024 | 0.961 | 0.241 | 0.997 |
| Kuo et al., 2015 [33] | LINC01151, AC108136.1 | rs12543592 | G (risk allele) | 1.43 (1.25–1.67) | 3.00 × 10⁻⁶ | 0.013 | 0.727 | 0.318 | 0.998 | 0.008 | 0.895 | 0.275 | 0.997 |
| Kuo et al., 2015 [33] | NAALADL2 | rs3914502 | A (risk allele) | 1.4 (1.20–1.60) | 4.00 × 10⁻⁶ | 0.012 | 0.844 | 0.062 | 0.985 | 0.001 | 0.482 | 0.051 | 0.982 |
| Kuo et al., 2015 [33] | OR2M4 | rs10888329 | NA | 1.82 (1.39–2.33) | 8.00 × 10⁻⁶ | 0.000 | 0.062 | 0.809 | 1.000 | 0.031 | 0.970 | 0.338 | 0.998 |
| Kuo et al., 2015 [33] | SGSM2 | rs2447097 | A (risk allele) | 1.53 (1.27–1.85) | 9.00 × 10⁻⁶ | 0.006 | 0.419 | 0.652 | 0.999 | 0.026 | 0.965 | 0.467 | 0.999 |
| Ma et al., 2009 [32] | Intergenic (RNU6-374P - MSNP1) | rs10038113 | T (risk allele) | 1.33 (1.11–1.43] | 3.00 × 10⁻⁶ | 0.003 | 0.999 | 0.000 | 0.000 | 0.000 | 0.000 | 0.000 | 0.000 |
| Gene variants with statistically borderline significance (5 × 10⁻⁸≤ p-value < 0.05), FPRP > 0.2 or BFDP > 0.8 from GWAS catalog | |||||||||||||
| Chaste et al., 2014 [35] | AL163541.1 | rs4773054 | NA | 2.9 (1.91–4.39) | 7.00 × 10⁻⁸ | 0.000 | 0.001 | 0.970 | 1.000 | 0.345 | 0.998 | 0.741 | 1.000 |
| Anney et al., 2017 [31] | HLA-A, AL671277.1 | rs115254791 | G (risk allele) | 1.0869565 (1.05–1.14) | 4.00 × 10⁻⁶ | 1.000 | 1.000 | 0.376 | 0.998 | 0.376 | 0.998 | 0.963 | 1.000 |
| Author, Year | Trait | Gene(s) | Variant | Comparison | OR (95% CI) | p-Value | Power OR 1.2 | Power OR 1.5 | FPRP Values at Prior Probability | BFDP 0.001 | BFDP 0.000001 | |||
|---|---|---|---|---|---|---|---|---|---|---|---|---|---|---|
| OR 1.2 | OR 1.5 | |||||||||||||
| 0.001 | 0.000001 | 0.001 | 0.000001 | |||||||||||
| Anney et al., 2012 [34] | ASD (European) | ERBB4 | rs1879532 | A | 2.02 (1.57–2.59) | 1.55 × 10⁻⁸ | 0.000 | 0.009 | 0.595 | 0.999 | 0.003 | 0.757 | 0.026 | 0.964 |
| Anney et al., 2012 [34] | Autism (European) | None | rs289932 | A | 0.49 (0.38–0.64) | 5.04 × 10⁻⁸ | 0.000 | 0.012 | 0.772 | 1.000 | 0.014 | 0.932 | 0.114 | 0.992 |
| Anney et al., 2012 [34] | ASD | TMEM132B | rs16919315 | A | 0.53 (0.42–0.67) | 5.12 × 10⁻⁸ | 0.000 | 0.028 | 0.589 | 0.999 | 0.004 | 0.800 | 0.049 | 0.981 |
| Anney et al., 2012 [34] | Autism (European) | ERBB4 | rs1879532 | A | 1.72 (1.39–2.11) | 1.66 × 10⁻⁷ | 0.000 | 0.095 | 0.416 | 0.999 | 0.002 | 0.676 | 0.044 | 0.979 |
| Anney et al., 2010 [30] | Autism | NA | rs6557675 | A (minor allele) | 0.61 (0.51–0.71) | 2.20 × 10⁻⁷ | 0.000 | 0.126 | 0.006 | 0.861 | 0.000 | 0.001 | 0.000 | 0.048 |
| Anney et al., 2012 [34] | Autism (European) | None | rs289858 | A | 0.52 (0.40–0.67) | 2.81 × 10⁻⁷ | 0.000 | 0.027 | 0.762 | 1.000 | 0.015 | 0.940 | 0.161 | 0.995 |
| Anney et al., 2012 [34] | ASD | SYNE2 | rs2150291 | A | 1.72 (1.40–2.13) | 2.83 × 10⁻⁷ | 0.000 | 0.105 | 0.579 | 0.999 | 0.006 | 0.864 | 0.119 | 0.993 |
| Anney et al., 2012 [34] | ASD (European) | RPH3AL | rs7207517 | A | 1.97 (1.51–2.57) | 3.05 × 10⁻⁷ | 0.000 | 0.022 | 0.817 | 1.000 | 0.025 | 0.963 | 0.226 | 0.997 |
| Anney et al., 2012 [34] | Autism (European) | None | rs4761371 | A | 0.46 (0.34–0.63) | 3.91 × 10⁻⁷ | 0.000 | 0.010 | 0.924 | 1.000 | 0.111 | 0.992 | 0.521 | 0.999 |
| Anney et al., 2012 [34] | ASD (European) | PRAMEF12 | rs1812242 | A | 1.44 (1.25–1.66) | 4.29 × 10⁻⁷ | 0.006 | 0.713 | 0.077 | 0.988 | 0.001 | 0.411 | 0.038 | 0.975 |
| Anney et al., 2012 [34] | ASD | None | rs10904487 | G | 0.63 (0.52–0.75) | 4.29 × 10⁻⁷ | 0.001 | 0.262 | 0.198 | 0.996 | 0.001 | 0.440 | 0.028 | 0.966 |
| Anney et al., 2012 [34] | Autism (European) | None | rs289932 | A | 0.67 (0.57–0.79) | 5.42 × 10⁻⁷ | 0.005 | 0.524 | 0.286 | 0.998 | 0.004 | 0.784 | 0.135 | 0.994 |
| Anney et al., 2010 [30] | Autism | MACROD2 | rs4141463 | A (minor allele) | 0.62 (0.52–0.73) | 5.50 × 10⁻⁷ | 0.000 | 0.192 | 0.047 | 0.980 | 0.000 | 0.048 | 0.002 | 0.655 |
| Anney et al., 2012 [34] | Autism | None | rs9608521 | A | 1.46 (1.25–1.69) | 7.62 × 10⁻⁷ | 0.004 | 0.641 | 0.084 | 0.989 | 0.001 | 0.383 | 0.033 | 0.971 |
| Anney et al., 2012 [34] | ASD | None | rs1408744 | A | 0.65 (0.54–0.77) | 8.06 × 10⁻⁷ | 0.002 | 0.385 | 0.235 | 0.997 | 0.002 | 0.618 | 0.062 | 0.985 |
| Anney et al., 2017 [31] | ASD | LINC00535 | chr8_94389815_I | I vs. D | 1.14 (1.09–1.19) | 9.47 × 10⁻⁷ | 0.990 | 1.000 | 0.000 | 0.002 | 0.000 | 0.002 | 0.686 | 1.000 |
| Anney et al., 2012 [34] | ASD (European) | PC | rs7122539 | A | 0.60 (0.49–0.74) | 9.64 × 10⁻⁷ | 0.001 | 0.162 | 0.628 | 0.999 | 0.011 | 0.917 | 0.213 | 0.996 |
| Anney et al., 2010 [30] | Autism | MACROD2 | rs4814324 | A (minor allele) | 1.58 (1.34–1.86) | 9.80 × 10⁻⁷ | 0.000 | 0.266 | 0.076 | 0.988 | 0.000 | 0.128 | 0.006 | 0.859 |
| Anney et al., 2010 [30] | Autism | MACROD2 | rs6079544 | A (minor allele) | 1.57 (1.33–1.84) | 1.20 × 10⁻⁶ | 0.000 | 0.287 | 0.053 | 0.982 | 0.000 | 0.081 | 0.004 | 0.797 |
| Anney et al., 2017 [31] | ASD | EXOC4 | rs6467494 | T vs. C | 1.12 (1.07–1.16) | 1.43 × 10⁻⁶ | 1.000 | 1.000 | 0.000 | 0.000 | 0.000 | 0.000 | 0.197 | 0.996 |
| Anney et al., 2010 [30] | Autism | MACROD2 | rs6079536 | A (minor allele) | 0.64 (0.54–0.75) | 1.60 × 10⁻⁶ | 0.001 | 0.307 | 0.059 | 0.984 | 0.000 | 0.102 | 0.005 | 0.837 |
| Anney et al., 2010 [30] | ASD | MYH11 | rs17284809 | A (minor allele) | 0.52 (0.39–0.69) | 1.70 × 10⁻⁶ | 0.001 | 0.043 | 0.915 | 1.000 | 0.121 | 0.993 | 0.636 | 0.999 |
| Anney et al., 2010 [30] | Autism | MACROD2 | rs6079553 | A (minor allele) | 1.55 (1.31–1.82) | 2.10 × 10⁻⁶ | 0.001 | 0.344 | 0.090 | 0.990 | 0.000 | 0.204 | 0.011 | 0.920 |
| Anney et al., 2010 [30] | Autism | MACROD2 | rs6074798 | A (minor allele) | 1.56 (1.32–1.84) | 2.10 × 10⁻⁶ | 0.001 | 0.321 | 0.123 | 0.993 | 0.000 | 0.287 | 0.017 | 0.945 |
| Anney et al., 2017 [31] | ASD | OPCML | rs7952100 | C vs.G | 1.14 (1.09–1.19) | 2.49 × 10⁻⁶ | 0.990 | 1.000 | 0.000 | 0.002 | 0.000 | 0.002 | 0.686 | 1.000 |
| Anney et al., 2010 [30] | Autism | MACROD2 | rs10446030 | G (minor allele) | 1.54 (1.30–1.81) | 3.20 × 10⁻⁶ | 0.001 | 0.375 | 0.116 | 0.992 | 0.000 | 0.301 | 0.019 | 0.951 |
| Kuo et al., 2015 [33] | ASD | STYK1 | rs16922945 | C (minor allele) | 1.86 (1.43–2.43) | 3.43 × 10⁻⁶ | 0.001 | 0.057 | 0.891 | 1.000 | 0.085 | 0.989 | 0.572 | 0.999 |
| Anney et al., 2010 [30] | ASD | POU5F2 | rs10258862 | G (minor allele) | 1.41 (1.23–1.61) | 3.70 × 10⁻⁶ | 0.009 | 0.820 | 0.043 | 0.978 | 0.000 | 0.319 | 0.027 | 0.966 |
| Anney et al., 2010 [30] | Autism | MACROD2 | rs6079540 | A (minor allele) | 0.65 (0.55–0.77) | 3.70 × 10⁻⁶ | 0.002 | 0.385 | 0.235 | 0.997 | 0.002 | 0.618 | 0.062 | 0.985 |
| Anney et al., 2010 [30] | Autism | MACROD2 | rs6074787 | A (minor allele) | 1.53 (1.30–1.80) | 4.10 × 10⁻⁶ | 0.002 | 0.406 | 0.147 | 0.994 | 0.001 | 0.418 | 0.031 | 0.970 |
| Anney et al., 2010 [30] | ASD | MACROD2 | rs6074798 | A (minor allele) | 1.38 (1.22–1.56) | 4.80 × 10⁻⁶ | 0.013 | 0.909 | 0.020 | 0.954 | 0.000 | 0.224 | 0.018 | 0.948 |
| Anney et al., 2010 [30] | Autism | MACROD2 | rs980319 | G (minor allele) | 1.52 (1.29–1.79) | 5.10 × 10⁻⁶ | 0.002 | 0.437 | 0.184 | 0.996 | 0.001 | 0.543 | 0.050 | 0.981 |
| Anney et al., 2010 [30] | Autism | MACROD2 | rs6079537 | G (minor allele) | 1.52 (1.29–1.79) | 6.00 × 10⁻⁶ | 0.002 | 0.437 | 0.184 | 0.996 | 0.001 | 0.543 | 0.050 | 0.981 |
| Kuo et al., 2015 [33] | ASD | NA | rs10966205 | A (minor allele) | 1.52 (1.27–1.83) | 6.25 × 10⁻⁶ | 0.006 | 0.444 | 0.609 | 0.999 | 0.022 | 0.957 | 0.426 | 0.999 |
| Kuo et al., 2015 [33] | ASD | OR2M4 | rs10888329 | T (minor allele) | 0.55 (0.43–0.72) | 8.05 × 10⁻⁶ | 0.001 | 0.081 | 0.916 | 1.000 | 0.144 | 0.994 | 0.718 | 1.000 |
| Anney et al., 2010 [30] | ASD | MACROD2 | rs6079536 | A (minor allele) | 0.73 (0.65–0.83) | 8.50 × 10⁻⁶ | 0.022 | 0.917 | 0.067 | 0.986 | 0.002 | 0.628 | 0.084 | 0.989 |
| Anney et al., 2010 [30] | ASD | NA | rs6557675 | A (minor allele) | 0.72 (0.63–0.82) | 8.70 × 10⁻⁶ | 0.014 | 0.877 | 0.051 | 0.982 | 0.001 | 0.457 | 0.047 | 0.980 |
| Kuo et al., 2015 [33] | ASD | NA | rs7933990 | A (minor allele) | 1.72 (1.35–2.19) | 9.40 × 10⁻⁶ | 0.002 | 0.133 | 0.861 | 1.000 | 0.075 | 0.988 | 0.606 | 0.999 |
| Kuo et al., 2015 [33] | ASD | MNT | rs2447097 | A (minor allele) | 1.53 (1.27–1.85) | 9.45 × 10⁻⁶ | 0.006 | 0.419 | 0.652 | 0.999 | 0.026 | 0.965 | 0.467 | 0.999 |
| Anney et al., 2010 [30] | ASD | GSG1L | rs205409 | G (minor allele) | 0.72 (0.64–0.82) | 9.60 × 10⁻⁶ | 0.014 | 0.877 | 0.051 | 0.982 | 0.001 | 0.457 | 0.047 | 0.980 |
| Kuo et al., 2015 [33] | ASD | OR2M4 | rs6672981 | C (minor allele) | 0.55 (0.42–0.72) | 9.64 × 10⁻⁶ | 0.001 | 0.081 | 0.916 | 1.000 | 0.144 | 0.994 | 0.718 | 1.000 |
| Kuo et al., 2015 [33] | ASD | OR2M4 | rs4397683 | C (minor allele) | 0.55 (0.42–0.72) | 9.86 × 10⁻⁶ | 0.001 | 0.081 | 0.916 | 1.000 | 0.144 | 0.994 | 0.718 | 1.000 |
| Anney et al., 2010 [30] | ASD | MACROD2 | rs980319 | G (minor allele) | 1.36 (1.20–1.54) | 1.00 × 10⁻⁵ | 0.024 | 0.939 | 0.049 | 0.981 | 0.001 | 0.570 | 0.068 | 0.987 |
| Kuo et al., 2015 [33] | ASD | BCAS1/CYP24A1 | rs12479663 | G (minor allele) | 1.81 (1.38–2.36) | 1.08 × 10⁻⁵ | 0.001 | 0.083 | 0.907 | 1.000 | 0.124 | 0.993 | 0.687 | 1.000 |
| Anney et al., 2010 [30] | ASD | MACROD2 | rs4814324 | A (minor allele) | 1.36 (1.20–1.54) | 1.10 × 10⁻⁵ | 0.024 | 0.939 | 0.049 | 0.981 | 0.001 | 0.570 | 0.068 | 0.987 |
| Kuo et al., 2015 [33] | ASD | KRR1 | rs3741496 | C (minor allele) | 1.49 (1.24–1.78) | 1.15 × 10⁻⁵ | 0.009 | 0.529 | 0.565 | 0.999 | 0.020 | 0.954 | 0.430 | 0.999 |
| Kuo et al., 2015 [33] | ASD | OR2M4 | rs4642918 | C (minor allele) | 0.56 (0.43–0.73) | 1.24 × 10⁻⁵ | 0.002 | 0.099 | 0.917 | 1.000 | 0.155 | 0.995 | 0.745 | 1.000 |
| Anney et al., 2010 [30] | ASD | MACROD2 | rs6079544 | A (minor allele) | 1.35 (1.20–1.53) | 1.30 × 10⁻⁵ | 0.033 | 0.951 | 0.074 | 0.988 | 0.003 | 0.733 | 0.124 | 0.993 |
| Kuo et al., 2015 [33] | ASD | NA | rs13211684 | G (minor allele) | 1.56 (1.28–1.91) | 1.36 × 10⁻⁵ | 0.006 | 0.352 | 0.750 | 1.000 | 0.045 | 0.979 | 0.572 | 0.999 |
| Kuo et al., 2015 [33] | ASD | MNT | rs2447095 | A (minor allele) | 1.52 (1.26–1.84) | 1.45 × 10⁻⁵ | 0.008 | 0.446 | 0.695 | 1.000 | 0.038 | 0.975 | 0.552 | 0.999 |
| Kuo et al., 2015 [33] | ASD | NA | rs12543592 | G (minor allele) | 0.67 (0.56–0.81) | 1.63 × 10⁻⁵ | 0.012 | 0.521 | 0.744 | 1.000 | 0.063 | 0.985 | 0.678 | 1.000 |
| Anney et al., 2010 [30] | ASD | MACROD2 | rs6079553 | A (minor allele) | 1.35 (1.19–1.52) | 1.70 × 10⁻⁵ | 0.026 | 0.959 | 0.027 | 0.965 | 0.001 | 0.424 | 0.041 | 0.977 |
| Kuo et al., 2015 [33] | ASD | KRR1 | rs1051446 | C (minor allele) | 1.47 (1.23–1.76) | 1.77 × 10⁻⁵ | 0.014 | 0.587 | 0.669 | 1.000 | 0.045 | 0.979 | 0.614 | 0.999 |
| Anney et al., 2010 [30] | ASD | NA | rs4078417 | C (minor allele) | 1.38 (1.21–1.57) | 1.90 × 10⁻⁵ | 0.017 | 0.897 | 0.055 | 0.983 | 0.001 | 0.524 | 0.059 | 0.984 |
| Anney et al., 2010 [30] | ASD | MACROD2 | rs10446030 | G (minor allele) | 1.34 (1.19–1.52) | 2.20 × 10⁻⁵ | 0.043 | 0.960 | 0.110 | 0.992 | 0.006 | 0.847 | 0.210 | 0.996 |
| Kuo et al., 2015 [33] | ASD | GPD2 | rs3916984 | T (minor allele) | 0.62 (0.49–0.77) | 2.25 × 10⁻⁵ | 0.004 | 0.256 | 0.804 | 1.000 | 0.056 | 0.984 | 0.595 | 0.999 |
| Kuo et al., 2015 [33] | ASD | NA | rs12366025 | T (minor allele) | 1.67 (1.31–2.11) | 2.49 × 10⁻⁵ | 0.003 | 0.184 | 0.860 | 1.000 | 0.086 | 0.989 | 0.662 | 0.999 |
| Ma et al., 2009 [32] | Autism | NA | rs10038113 | C(minor)/T(major) | 0.67 (0.56–0.81) | 2.75 × 10⁻⁵ | 0.012 | 0.521 | 0.744 | 1.000 | 0.063 | 0.985 | 0.678 | 1.000 |
| Anney et al., 2010 [30] | ASD | MACROD2 | rs6079540 | A (minor allele) | 0.75 (0.66–0.84) | 2.90 × 10⁻⁵ | 0.034 | 0.979 | 0.019 | 0.950 | 0.001 | 0.399 | 0.037 | 0.975 |
| Anney et al., 2010 [30] | Autism | HAT1 | rs6731562 | G (minor allele) | 1.51 (1.27–1.81) | 3.30 × 10⁻⁵ | 0.006 | 0.471 | 0.562 | 0.999 | 0.017 | 0.946 | 0.383 | 0.998 |
| Anney et al., 2010 [30] | ASD | MACROD2 | rs6074787 | A (minor allele) | 1.33 (1.18–1.50) | 3.40 × 10⁻⁵ | 0.047 | 0.975 | 0.067 | 0.986 | 0.003 | 0.776 | 0.147 | 0.994 |
| Kuo et al., 2015 [33] | ASD | GLIS1 | rs12080933 | A (minor allele) | 1.48 (1.23–1.78) | 3.57 × 10⁻⁵ | 0.013 | 0.557 | 0.707 | 1.000 | 0.053 | 0.983 | 0.648 | 0.999 |
| Kuo et al., 2015 [33] | ASD | FSTL4 | rs11741756 | T (minor allele) | 1.67 (1.31–2.13) | 3.64 × 10⁻⁵ | 0.004 | 0.194 | 0.903 | 1.000 | 0.157 | 0.995 | 0.785 | 1.000 |
| Kuo et al., 2015 [33] | ASD | STYK1 | rs7953930 | G (minor allele) | 1.65 (1.30–2.09) | 3.83 × 10⁻⁵ | 0.004 | 0.215 | 0.888 | 1.000 | 0.133 | 0.994 | 0.761 | 1.000 |
| Anney et al., 2010 [30] | Autism | NA | rs4078417 | C (minor allele) | 1.50 (1.26–1.79) | 4.10 × 10⁻⁵ | 0.007 | 0.500 | 0.509 | 0.999 | 0.014 | 0.933 | 0.339 | 0.998 |
| Anney et al., 2010 [30] | ASD | MACROD2 | rs4141463 | A (minor allele) | 0.75 (0.66–0.85) | 4.30 × 10⁻⁵ | 0.049 | 0.967 | 0.118 | 0.993 | 0.007 | 0.873 | 0.243 | 0.997 |
| Kuo et al., 2015 [33] | ASD | OR2M3 | rs11204613 | G (minor allele) | 0.58 (0.45–0.75) | 4.60 × 10⁻⁵ | 0.003 | 0.144 | 0.920 | 1.000 | 0.185 | 0.996 | 0.799 | 1.000 |
| Anney et al., 2010 [30] | ASD | MACROD2 | rs6079537 | G (minor allele) | 1.32 (1.17–1.49) | 5.40 × 10⁻⁵ | 0.062 | 0.981 | 0.103 | 0.991 | 0.007 | 0.878 | 0.249 | 0.997 |
| Anney et al., 2010 [30] | Autism | GSG1L | rs205409 | G (minor allele) | 0.69 (0.58–0.81) | 1.10 × 10⁻⁴ | 0.011 | 0.663 | 0.353 | 0.998 | 0.009 | 0.896 | 0.271 | 0.997 |
| Anney et al., 2010 [30] | Autism | POU5F2 | rs10258862 | G (minor allele) | 1.43 (1.21–1.71) | 1.80 × 10⁻⁴ | 0.027 | 0.700 | 0.764 | 1.000 | 0.112 | 0.992 | 0.799 | 1.000 |
| Gene | Function of the Encoding Proteins |
|---|---|
| OXTR | Receptor for oxytocin associated with social recognition and emotion processing |
| MTHFR | Influences susceptibility to neural tube defect by changing folate metabolism |
| RELN | Control cell positioning and neural migration during brain development |
| DRD3 | D3 subtype of the five dopamine receptors; localized to the limbic areas of the brain |
| MNT | Protein member of the Myc/Max/Mad network; transcriptional repressor and an antagonist of Myc-dependent transcriptional activation and cell growth |
| OPCML | Member of the IgLON subfamily in the immunoglobulin protein superfamily of proteins; localized in the plasma membrane; accessory role in opioid receptor function |
| PC | Pyruvate carboxylase; gluconeogenesis, lipogenesis, insulin secretion and synthesis of neurotransmitter glutamate |
| ERBB4 | Tyr protein kinase family and the epidermal growth factor receptor subfamily; binds to and is activated by neuregulins, and induces mitogenesis and differentiation |
| OR2M4 | Members of a large family of GPCR; olfactory receptors initiating a neuronal response that triggers the perception of a smell |
| BCAS1 | Oncogene; highly expressed in three amplified breast cancer cell lines and in one breast tumor without amplification at 20q13.2. |
| CYP24A1 | Cytochrome P450 superfamily of enzymes; drug metabolism and synthesis of cholesterol, steroids and other lipids |
| TMEM132B | The function remains poorly understood despite their mutations associated with non-syndromic hearing loss, panic disorder, and cancer |
| KRR1 | Nucleolar protein; 18S rRNA synthesis and 40S ribosomal assembly |
| HAT1 | Type B histone acetyltransferase; rapid acetylation of newly synthesized cytoplasmic histones; replication-dependent chromatin assembly |
| SGSM2 | GTPase activator; regulators of membrane trafficking |
| EXT1 | Endoplasmic reticulum-resident type II transmembrane glycosyltransferase; involved in the chain elongation step of heparan sulfate biosynthesis |
| OR2T33 | Members of a large family of GPCR; share a 7-transmembrane domain structure with many neurotransmitter and hormone receptors |
| TAF1C | Binds to the core promoter of ribosomal RNA genes to position the polymerase properly; acts as a channel for regulatory signals |
| HDAC4 | Class II of the histone deacetylase/acuc/apha family; represses transcription when tethered to a promoter |
| MEGF10 | Member of the multiple epidermal growth factor-like domains protein family; cell adhesion, motility and proliferation; critical mediator of apoptotic cell phagocytosis; amyloid-beta peptide uptake in brain |
| NFKB2 | Subunit of the transcription factor complex nuclear factor-kappa-B; central activator of genes involved in inflammation and immune function |
| BNC2 | Conserved zinc finger protein; skin color saturation |
| NMB | Member of the bombesin-like family of neuropeptides; negatively regulate eating behavior; regulate colonic smooth muscle contraction |
| HPS6 | Organelle biogenesis associated with melanosomes, platelet dense granules, and lysosomes |
| ELOVL3 | GNS1/SUR4 family; elongation of long chain fatty acids to provide precursors for synthesis of sphingolipids and ceramides |
| PITX3 | Member of the RIEG/PITX homeobox family; transcription factors; lens formation during eye development |
| NAALADL2 | Not well-known, but diseases associated with NAALADL2 include Chromosome 6Pter-P24 Deletion Syndrome and Cornelia De Lange Syndrome. |
| MACROD2 | Deacetylase removing ADP-ribose from mono-ADP-ribosylated proteins; translocate from the nucleus to the cytoplasm upon DNA damage |
| CUEDC2 | CUE domain-containing protein; down-regulate ESR1 protein levels through progesterone-induced and degradation of receptors |
| FBXL15 | Substrate recognition component of SCF E3 ubiquitin-protein ligase complex; mediates the ubiquitination and subsequent proteasomal degradation of SMURF1 |
| EXOC4 | Component of the exocyst complex; targeting exocytic vesicles to specific docking sites on the plasma membrane |
| NOLC1 | Nucleolar protein; act as a regulator of RNA polymerase I; neural crest specification; nucleologenesis |
| PPRC1 | Similar to PPAR-gamma coactivator 1; activate mitochondrial biogenesis through NRF1 in response to proliferative signals |
| SEC11A | Member of the peptidase S26B family; subunit of the signal peptidase complex; cell migration and invasion, gastric cancer and lymph node metastasis |
© 2020 by the authors. Licensee MDPI, Basel, Switzerland. This article is an open access article distributed under the terms and conditions of the Creative Commons Attribution (CC BY) license (http://creativecommons.org/licenses/by/4.0/).
Share and Cite
Lee, J.; Son, M.J.; Son, C.Y.; Jeong, G.H.; Lee, K.H.; Lee, K.S.; Ko, Y.; Kim, J.Y.; Lee, J.Y.; Radua, J.; et al. Genetic Variation and Autism: A Field Synopsis and Systematic Meta-Analysis. Brain Sci. 2020, 10, 692. https://doi.org/10.3390/brainsci10100692
Lee J, Son MJ, Son CY, Jeong GH, Lee KH, Lee KS, Ko Y, Kim JY, Lee JY, Radua J, et al. Genetic Variation and Autism: A Field Synopsis and Systematic Meta-Analysis. Brain Sciences. 2020; 10(10):692. https://doi.org/10.3390/brainsci10100692
Chicago/Turabian StyleLee, Jinhee, Min Ji Son, Chei Yun Son, Gwang Hun Jeong, Keum Hwa Lee, Kwang Seob Lee, Younhee Ko, Jong Yeob Kim, Jun Young Lee, Joaquim Radua, and et al. 2020. "Genetic Variation and Autism: A Field Synopsis and Systematic Meta-Analysis" Brain Sciences 10, no. 10: 692. https://doi.org/10.3390/brainsci10100692