


Abstract
A substantial amount of amyloid-beta (Aβ) accumulates in the occipital cortices; however, it draws less attention. We investigated the clinical implications of Aβ accumulation in the occipital lobes in the Alzheimer’s disease (AD) continuum. [18F]-Florbetaben amyloid PET scans were performed in a total of 121 AD or amnestic mild cognitive impairment (aMCI) patients. Of the 121 patients, 74 Aβ positive patients were divided into occipital Aβ positive (OCC+) and occipital Aβ negative (OCC−) groups based on Aβ accumulation in the bilateral occipital lobes. The OCC+ group (41/74, 55.4%) was younger and had a younger age at onset than the OCC− group. The OCC+ group also had an increased standard uptake value ratio in the occipital lobes and greater cortical thinning in relevant areas. The OCC+ group had a higher global deterioration scale, lower performance for the copy, immediate recall, delayed recall, and recognition in Rey–Osterrieth Complex Figure tests than the OCC- group, although both groups had similar disease durations. AD or aMCI patients in the OCC+ group exhibited features noted in early onset AD with relevant neuropsychological and image findings. Occipital Aβ positivity in amyloid PET scans need to be considered as an underestimated marker of early onset AD continuum.
1. Introduction
The aggregation of beta-amyloid (Aβ) peptides and the formation of Aβ plaques are pathological hallmarks of preclinical and clinical Alzheimer’s disease (AD) [1,2,3]. The main brain regions of Aβ plaque accumulation in AD encompass the association cortices, including the prefrontal, orbitofrontal, parietal, temporal, and cingulate cortices, and the precuneus. Intriguingly, many amyloid PET imaging studies have shown a substantial amount of fibrillar forms of Aβ aggregation in the occipital lobes [4,5,6,7], although such findings and their clinical implications have not been appreciated in the literature. This is probably because the pathological accumulation of Aβ in the occipital cortices could have been interpreted as changes in primary cortices such as the primary motor and sensory cortices. Given the non-trivial and potentially underestimated accumulation of Aβ in the occipital lobes and pathological evidence that indicated existence of Aβ plaques in the occipital cortices [8,9], we investigated whether there was a substantial amount of Aβ in the occipital lobes and how it affected clinical features on the Alzheimer’s continuum, which refers to individuals with biomarker designation of either AD or Alzheimer’s pathologic change [2]. We hypothesized that patients with Aβ accumulation in the occipital lobes may have an earlier age of onset or a more aggressive disease course. We also assessed cortical thickness and administered detailed neuropsychological tests to understand the clinical implications of Aβ accumulation in the occipital lobes.
2. Materials and Methods
2.1. Participants
A total of 520 patients were clinically diagnosed as probable AD or amnestic mild cognitive impairment (aMCI) after completion of 3T MRI and neuropsychological tests between May 2013 and January 2016 at the Memory Disorder Clinic at Asan Medical Center, Seoul, Korea. The patients with probable AD dementia met criteria recommended by the National Institute on Aging–Alzheimer’s Association [1] and the patients with aMCI met the Petersen criteria for mild cognitive impairment [10]. The umbrella term, Alzheimer’s Continuum [2], was used to indicate both aMCI due to AD and AD dementia with amyloid PET positivity in this study [1]. Patients with diagnosis fulfilling posterior cortical atrophy were not included in the study [11]. We performed a [18F]-Florbetaben amyloid PET scan for a total of 121 subjects. A total of 75 subjects who completed the same diagnostic workups and fulfilled the diagnostic criteria of subjective memory impairment served as control subjects for cortical thickness analysis.
2.2. Ethical Approval
All procedures performed in studies involving human participants were in accordance with the ethical standards of the institutional research committee and complied with the principles of the 1964 Declaration of Helsinki and its later amendments or comparable ethical standards. Written informed consent was obtained from every subject prior to participation and also from the caregiver of the subject categorized as AD. The Institutional Review Board of Asan Medical Center approved the study protocol (2013-0847, 2014-0783, 2016-0588, 2016-0589, 2016-0590).
2.3. Demographics and Clinical Characteristics
We recorded the following information for each subject: age, sex, education level, history of hypertension (HT), diabetes mellitus (DM), hyperlipidemia, apolipoprotein E (APOE) state, age at onset, and disease duration. Age at onset was defined as the age when AD-related symptoms manifested, based on the report of the subject or an informant on the subject’s medical records. Disease duration was defined as the time from symptom onset to the time of [18F]-Florbetaben PET scan. Scores for the Korean version of the Mini-Mental State Examination (K-MMSE), Clinical Dementia Rating (CDR), CDR–sum of boxes (CDR–SB), and Global Deterioration Scale (GDS) were compared between the OCC+ and OCC− groups.
2.4. MRI Acquisition and Cortical Thickness Analysis
All the participants underwent three dimensional (3D) T1-weighted MRI scans. T1-weighted volumetric MRI scans were acquired with a 3D gradient-echo T1-weighted sequence using a 3 Tesla MRI scanner (Achieva; Philips Medical Systems, Best, The Netherlands; echo time, 3.1 ms; repetition time, 6.8 ms; slice thickness, 1 mm with no gap; field of view, 270 mm; matrix size, 244 × 227 pixels). Images were processed using a standard Montreal Neurological Institute anatomic pipeline (ver. 1.1.9.; http://wiki.bic.mni.mcgill.ca/index.php/CIVET). The cortical thickness was measured as described previously [12]. Briefly, regional differences in cortical thickness of each group are shown at a false discovery rate corrected p < 0.05 with age, sex, education, and intracranial volume serving as covariates.
2.5. [18F]-Florbetaben Amyloid PET Acquisition and Analysis
The PET data were acquired using GE Discovery 690/710/690 Elite PET-CT scanners (GE Healthcare, Milwaukee, WI, USA) with profiles as described below (47 axial image planes; slice thickness, 3.27 mm; matrix size, 128 × 128; and transaxial field of view, 25 cm). A single dose of 300 MBq ± 20% [18F]-Florbetaben [13] was intravenously administered in a maximum volume of 10 mL. PET images were acquired from 90 to 110 min after injection with a three-dimensional (3D) list-mode acquisition setting on the scanners. The 5 min × 4 frames of PET scans were reviewed for any motion artifacts and motion-free frames were selected and summed. Finally, 20 min static PET images were used to obtain standard uptake values (SUV) and for further analysis.
2.6. [18F]-Florbetaben Amyloid PET Visual Assessment
We performed a visual rating of the [18F]-Florbetaben amyloid PET scans to determine whether each was global amyloid-positive or global amyloid-negative. Experts at the department of nuclear medicine (J.S.K. and M.O.), who were blinded to the diagnosis of each participant, assessed the PET images according to predefined Regional Cortical Tracer Binding (RCTB) and Brain Amyloid-beta Plaque Load (BAPL) scoring systems [4]. After this visual rating of global Aβ accumulation, we divided the global Aβ positive subjects into occipital Aβ positive (OCC+) and occipital Aβ negative (OCC−) groups, based on visual assessment of axial, coronal, and sagittal amyloid PET scans by two readers (J.H. and J.E.K.) blinded to the patients’ diagnoses. The occipital area used for visual assessment was defined medially by the parieto-occipital sulcus and laterally by an artificial line connecting the parieto-occipital sulcus and preoccipital notch. Cohen’s κ coefficient for inter-rater agreement over the division of subjects with amyloid imaging positivity into OCC+ and OCC− groups was calculated to be 0.70. In cases where there was any disagreement, the two readers reached a consensus after discussion.
2.7. Quantitative [18F]-Florbetaben Amyloid PET Analysis
Quantitative amyloid PET image analysis was conducted for all patients except for one, due to acquisition error of 3D-T1 MRI. FreeSurfer 5.1 was used for the generation of automatic volumes of interest (VOIs) for the quantitative PET analysis. First, the PET image of each patient was co-registered to the corresponding 3D-T1 MR image using a rigid-body transform-based registration method using Statistical Parametric Mapping 8 (SPM8, http://www.fil.ion.ucl.ac.uk/spm/software/spm8/). After the automated segmentation of structures, a correction was made when necessary, in accordance with the FreeSurfer manual (http://surfer.nmr.mgh.harvard.edu/fswiki/). Partial volume correction was not performed. The global SUV ratio (SUVR) was calculated for a merged group of lobar VOIs in AD signature areas (occipital, parietal, temporal, frontal, medial frontal, central, and posterior cingulate cortices, precuneus, and hippocampus/amygdala) using the cerebellar cortex as a reference [14,15].
2.8. Neuropsychological Test
All patients underwent neuropsychological tests using the Seoul Neuropsychological Screening Battery [16]. This included the following cognitive domain-specific functions: digit span forward and backward, for attention; the Korean version of the Boston Naming Test (K-BNT [16]), for language; the Rey–Osterrieth Complex Figure Test (RCFT) copy test, for visuospatial function; the Seoul Verbal Learning Test (SVLT) immediate recall, delayed recall task, and a recognition task, for verbal memory; RCFT immediate recall, delayed recall task, and a recognition task, for assessing visual memory function; and the phonemic and semantic Controlled Oral Word Association Test (COWAT [17]) and a Stroop Test (color reading), for frontal/executive function [18].
2.9. Visuoperceptual Function Tests
We made a composite test battery for the assessment of detailed visuoperceptual functions. This comprised tests for shape perception, angle perception, color perception, face perception, letter perception, visual agnosia, color agnosia, prosopagnosia, and reading. It included the Extended Complex Figure Test (ECFT) [17] for shape perception, a short version of the Benton Judgment Of Line Orientation test (JOLO) [18] for angle perception, a matching test of ten color plates for color perception, a facial discrimination subtest of the Korean version of the Florida Affect Battery (K-FAB) [19] for facial perception, the naming of ten color plates for color agnosia, and the Korean version of the naming of famous faces to assess prosopagnosia [20].
2.10. Statistical Analysis
We compared patients’ demographics and detailed neuropsychological test results between the OCC+ and OCC− groups. A simple κ statistic was used to assess the inter-reader agreement. The SUVR values in the ROIs in the brain were compared to see whether the SUVR in the occipital cortices was lower than that in the other regions using a repeated-measures ANOVA with regional SUVR as a within-subjects factor. The SUVRs in each brain ROI were compared between the OCC+ and OCC− groups using a linear regression model with age, sex, education, and global SUVR as covariates. For comparison between the groups, we used independent Student t-tests for continuous variables (age, education, age at onset, disease duration, K-MMSE score, and geriatric depression scale score) and χ2 tests for categorical variables (sex, diagnosis, APOE status, HT, DM, hyperlipidemia, and CDR). We applied linear regression analysis to each subscore of the neuropsychological tests with the disease state and global SUVR as covariates. A z-score adjusted for age and education was used for statistical analysis of the neuropsychological tests. We used SPSS version 21.0 (IBM Corp., Armonk, NY, USA) for the statistical analyses. Statistical significance was set as p < 0.05.
3. Results
3.1. Differences in Clinical Features between OCC+ and OCC- Groups
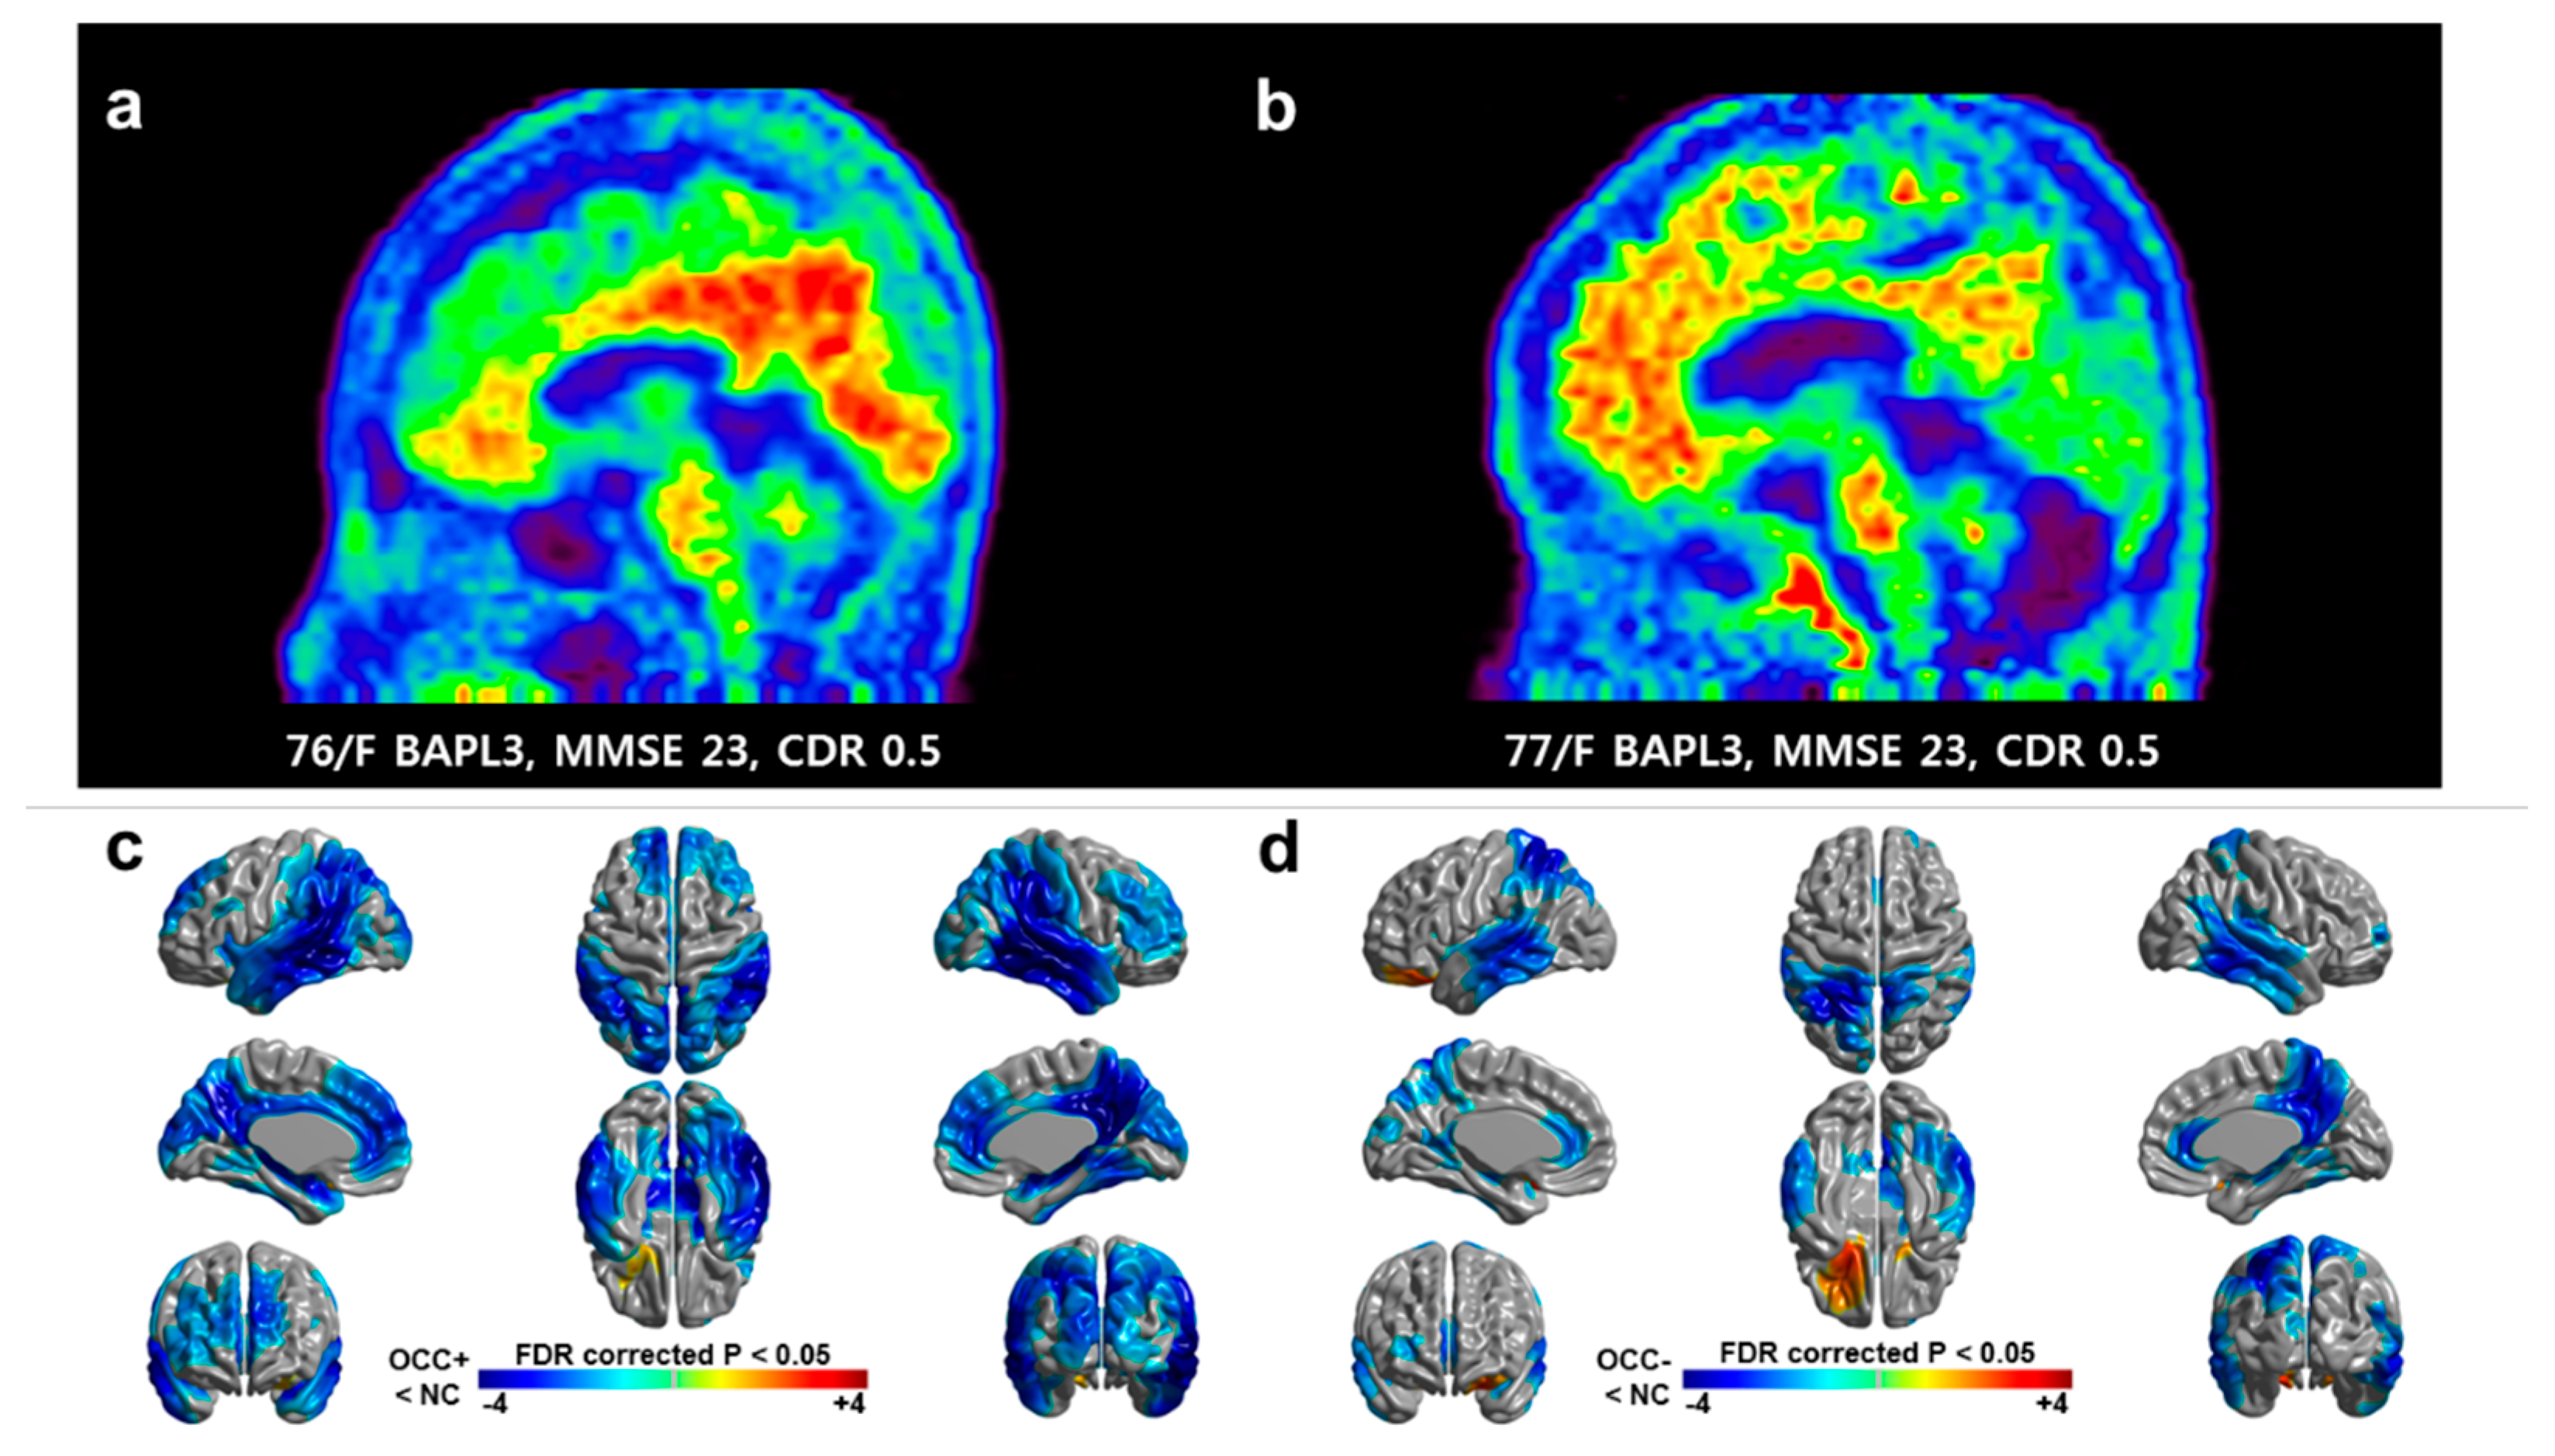
Of the 121 patients, 74 (74/121, 63.6%) showed increased global amyloid uptake on the [18F]-Florbetaben PET scans. Out of these 74 patients, 41 (41/74, 55.4%) showed increased amyloid uptake in the occipital lobes, and 33 patients (33/74, 44.6%) did not (Figure 1a,b). The OCC+ group was younger (mean age = 68.3 ± 10.8 years) than the OCC− group (74.5 ± 6.5 years, p = 0.003), and the OCC+ group had an earlier age at onset (65.5 ± 11.1 years vs. 72.1 ± 7.1 years, p = 0.003), with an age range that was relatively compatible with early onset AD (EOAD; Table 1). The OCC+ group had higher GDS scores, a tendency to have more subjects with CDR 1, and higher CDR-SB scores, even though both groups had a similar disease duration (Table 1).
Figure 1.
Representative [18F]-Florbetaben PET images and regional cortical thinning compared between the occipital Aβ positive group (OCC+) and occipital Aβ negative group (OCC−) groups. (a) [18F]-Florbetaben amyloid PET image of an occipital amyloid-beta (Aβ) positive patient. (b) [18F]-Florbetaben amyloid PET image of an occipital Aβ negative patient. (c,d) Regional differences in cortical thickness between each group and control are shown. Maps at a false discovery rate corrected p < 0.05 are shown with age, sex, education, and intracranial volume serving as covariates. The color scale bar represents the z-score.
Table 1.
Demographics and clinical characteristics.
3.2. Differences in Neuroimaging Findings between OCC+ and OCC− Groups
Intriguingly, the quantitative measurement of [18F]-Florbetaben PET revealed that SUVR in the occipital lobes was higher than the SUVR in several AD signature areas, including the hippocampus/amygdala and temporal lobes. The SUVR in the occipital lobes was higher than the SUVR in primary cortices and was comparable with the value in frontal lobes in the OCC+ group (Table 2, upper table). As expected, that the OCC+ group had greater amyloid deposition in the bilateral occipital lobes than the OCC− group. Beyond the occipital area, the OCC+ group showed a higher SUVR globally, as well as regionally in the parietal, temporal, and precuneus areas (Table 2, lower table). The false discovery rate adjustment of p-values did not alter the statistical significance of the dataset. When compared to normal elderly subjects, the OCC+ group showed greater cortical thinning in the occipital area, as well as in the lateral parietal, lateral temporal, and precuneus regions, than the OCC− group (Figure 1c,d). Overall, the OCC+ group showed a substantial amount of amyloid uptake in the occipital lobes and greater regional and global amyloid uptakes with cortical thinning in relevant areas.
Table 2.
Quantitative [18F]-Florbetaben amyloid PET analysis in the occipital lobes.
3.3. Differences in Neuropsychological Tests between OCC+ and OCC− Groups
The detailed neuropsychological tests revealed that the OCC+ group had a lower performance on RCFT copy, immediate recall, delayed recall, and recognition tests than the OCC− group. These findings remained significant even after treating disease state, or disease state and global SUVR, as covariates (Table 3). The additional visuoperceptual function tests revealed no statistically significant differences between the OCC+ and OCC− groups (Table 4). The ECFT score to assess visual perception was slightly lower in the OCC+ group than in the OCC− group when age, sex, education, disease state, and global SUVR served as covariates (p = 0.021).
Table 3.
Neuropsychological test results.
Table 4.
Visuoperceptual function test results.
4. Discussion
This study resulted in three main findings. First, we demonstrated that there was a substantial amount of amyloid deposition in the occipital lobes in Alzheimer’s Continuum patients at levels at least as high as or higher than in other AD signature regions. Second, the OCC+ group had a younger age at onset than the OCC− group, with the age range comparable to that for the onset of EOAD. Third, the OCC+ group had greater cortical thinning in the occipital lobes and adjacent areas, with greater impairment in visuospatial functions than the OCC− group.
In previous studies, considerable Aβ deposition was observed in the occipital lobes in patients with AD, although it was not noted or appreciated [4,5,6,7]. In the present study, we also observed significant deposition of Aβ in the occipital lobes, which was higher than medial temporal lobes, hippocampus/amygdala, and frontal lobes. This is probably due to the fact that the occipital cortices include not only primary visual cortices but also association cortices. The SUVRs in the primary motor and sensory cortices were lower than those in the occipital lobes. Based on the difference in clinical and neuroimaging characteristics between the OCC+ group and the OCC- group, we interpreted that the increased uptake in the occipital lobes has its own clinical implications. Many studies have reported that EOAD patients exhibited various characteristics in neuroimaging studies, such as atrophy in symptom-related areas [21], and greater global or parieto-occipital accumulation of Aβ [19]. In our previous study, we found that patients with greater atrophy in the parieto-occipital area were younger, had a younger age at onset, and had more Aβ accumulation in diffuse areas [12], findings that were comparable with those of early onset occipital Aβ accumulation in the present study. As EOAD is thought to have a more aggressive course than late onset AD (LOAD) [22], subjects with OCC+ in this study might have earlier onset of symptoms and a tendency to have worse global cognitive scores for a given disease duration.
When compared to normal elderly subjects, greater cortical thinning in the lateral temporal, lateral and medial parietal, and medial frontal cortices was noted in the OCC+ group than the OCC− group. This finding is comparable with previous studies that showed a difference in cortical thickness between patients with EOAD and LOAD [19]. In the present study, the visuospatial and visual memory functions differed significantly between the OCC+ and OCC− groups, which was compatible with corresponding cortical atrophy. A similar finding was observed in a previous study, in which occipital Aβ accumulation correlated with visuospatial dysfunction, although the visuoperceptual function was not evaluated in that study [23]. The visuoperceptual test results in the present study revealed no significant difference between the OCC+ and OCC− groups, even though the OCC+ group had greater Aβ accumulation in the occipital lobes and adjacent areas. These findings suggest that additional brain pathology, such as tau accumulation, would be required for the impairment of visuoperceptual function in Alzheimer’s Continuum [23].
Patients with PCA was not included in the study. Previous case reports have suggested higher occipital amyloid-PET uptakes in patients with PCA compared with typical AD [24,25,26]. However, other studies with larger numbers of subjects or longitudinal follow-up showed that the accumulation of Aβ in AD brain was widespread across association cortices, relatively non-specific to the presenting clinical features of AD, which correlated with tau accumulation [27,28,29]. Although differences may exist across studies, the existence of PCA needs to be considered in the case of increased amyloid uptake in posterior cortices of AD patients.
This study had several strengths, including thorough clinical investigation with visuoperceptual function tests and both qualitative and quantitative imaging analysis of amyloid on PET scans to assess occipital Aβ positivity. However, there were limitations. First, this was a cross-sectional study, so we could not observe the progression of clinical and image findings in the subjects with or without the accumulation of occipital Aβ. A longitudinal follow-up study would provide additional information regarding the changes in the occipital lobes and additional clinical implications. Second, we did not perform partial volume correction in this study, which may have affected the results. The small sample size was another limitation. Additional studies with larger numbers of participants are needed to confirm these results.
5. Conclusions
This study showed that AD and aMCI patients with occipital Aβ accumulation exhibited features noted in early onset AD; compared with patients without occipital Aβ accumulation, they had a younger age at onset and worse global cognitive score. These patients also had more impairment in the visuospatial and visual memory domains, reflecting cortical atrophy in relevant brain areas. Taken together, Aβ accumulation in the occipital lobes in amyloid PET scans needs to be recognized as being a potential biomarker of early onset AD dementia and relevant cognitive impairment.
Author Contributions
Conceptualization, J.H.R., J.S.K.; methodology, C.M.K., M.O. and J.S.O.; software, J.H.R. and J.S.O.; validation, J.S.O.; formal analysis, J.H., C.M.K. and J.S.O.; investigation, J.H., C.M.K., J.E.K., M.O., J.S.O., J.-H.L. and J.H.R.; resources, J.H.R. and J.S.K.; data curation, J.H., C.M.K., J.H.R.; writing—original draft preparation, J.H., J.H.R.; writing—review and editing, J.H.R., J.-H.L.; visualization, C.M.K.; supervision, J.H.R., J.S.K.; project administration, J.H.R., J.S.K.; funding acquisition, J.H.R., J.S.K., Y.W.Y. All authors have read and agreed to the published version of the manuscript.
Funding
This work was supported by the Basic Science Research Program through the National Research Foundation of Korea (NRF) funded by the Ministry of Education (2021R1I1A1A01049566), grants from the Korea Health Technology R&D Project through the Korea Health Industry Development Institute (KHIDI), funded by the Ministry of Health & Welfare, Republic of Korea (HI14C3319; HI14C2768, HI21C0893), a grant from the Industrial Core Technology Development Program (10060305) funded by the Ministry of Trade, Industry & Energy (MOTIE) & Korea Evaluation Institute of Industrial Technology (KEIT), grants (2016-0588; 2015-0590; 2014-0783) from the Asan Institute for Life Sciences and a research grant from Korea University College of Medicine (K2123751) (to J.H.R.).
Institutional Review Board Statement
The Institutional Review Board of Asan Medical Center approved the study protocol (2013-0847, 2014-0783, 2016-0588, 2016-0589, 2016-0590) on and starting from 17 September 2013.
Informed Consent Statement
Informed consent was obtained from all subjects involved in the study.
Data Availability Statement
Data will be available upon request.
Acknowledgments
We appreciate Hyojeong Moon for her efforts for data collection, Noh Eul Han for her consultation for visuoperceptual function tests, and Kyung Sook Yang for her consultation for statistical analysis.
Conflicts of Interest
The authors declare that they have no conflict of interest.
References
- McKhann, G.M.; Knopman, D.S.; Chertkow, H.; Hyman, B.T.; Jack, C.R., Jr.; Kawas, C.H.; Klunk, W.E.; Koroshetz, W.J.; Manly, J.J.; Mayeux, R.; et al. The diagnosis of dementia due to alzheimer’s disease: Recommendations from the national institute on aging-alzheimer’s association workgroups on diagnostic guidelines for alzheimer’s disease. Alzheimers Dement. J. Alzheimers Assoc. 2011, 7, 263–269. [Google Scholar] [CrossRef] [Scilit]
- Jack, C.R.; Bennett, D.A.; Blennow, K.; Carrillo, M.C.; Dunn, B.; Haeberlein, S.B.; Holtzman, D.M.; Jagust, W.; Jessen, F.; Karlawish, J.; et al. NIA-AA Research Framework: Toward a biological definition of Alzheimer’s disease. Alzheimers Dementia 2018, 14, 535–562. [Google Scholar] [CrossRef] [Scilit] [PubMed]
- Long, J.M.; Holtzman, D.M. Alzheimer Disease: An Update on Pathobiology and Treatment Strategies. Cell 2019, 179, 312–339. [Google Scholar] [CrossRef] [Scilit] [PubMed]
- Barthel, H.; Gertz, H.J.; Dresel, S.; Peters, O.; Bartenstein, P.; Buerger, K.; Hiemeyer, F.; Wittemer-Rump, S.M.; Seibyl, J.; Reininger, C.; et al. Cerebral amyloid-beta pet with florbetaben (18f) in patients with alzheimer’s disease and healthy controls: A multicentre phase 2 diagnostic study. Lancet Neurol. 2011, 10, 424–435. [Google Scholar] [CrossRef] [Scilit]
- Bailly, M.; Ribeiro, M.J.; Vercouillie, J.; Hommet, C.; Gissot, V.; Camus, V.; Guilloteau, D. 18f-fdg and 18f-florbetapir pet in clinical practice: Regional analysis in mild cognitive impairment and alzheimer disease. Clin. Nucl. Med. 2015, 40, e111–e116. [Google Scholar] [CrossRef] [Scilit] [PubMed]
- Klunk, W.E.; Engler, H.; Nordberg, A.; Wang, Y.; Blomqvist, G.; Holt, D.P.; Bergstrom, M.; Savitcheva, I.; Huang, G.F.; Estrada, S.; et al. Imaging brain amyloid in alzheimer’s disease with pittsburgh compound-b. Ann. Neurol. 2004, 55, 306–319. [Google Scholar] [CrossRef] [Scilit]
- Jack, C.R., Jr.; Lowe, V.J.; Senjem, M.L.; Weigand, S.D.; Kemp, B.J.; Shiung, M.M.; Knopman, D.S.; Boeve, B.F.; Klunk, W.E.; Mathis, C.A.; et al. 11c pib and structural mri provide complementary information in imaging of alzheimer’s disease and amnestic mild cognitive impairment. Brain A J. Neurol. 2008, 131, 665–680. [Google Scholar] [CrossRef] [Scilit] [PubMed]
- McKee, A.C.; Au, R.; Cabral, H.J.; Kowall, N.W.; Seshadri, S.; Kubilus, C.A.; Drake, J.; Wolf, P.A. Visual association pathology in preclinical alzheimer disease. J. Neuropathol. Exp. Neurol. 2006, 65, 621–630. [Google Scholar] [CrossRef] [Scilit] [PubMed]
- Pikkarainen, M.; Kauppinen, T.; Alafuzoff, I. Hyperphosphorylated tau in the occipital cortex in aged nondemented subjects. J. Neuropathol. Exp. Neurol. 2009, 68, 653–660. [Google Scholar] [CrossRef] [Scilit] [PubMed]
- Petersen, R.C.; Smith, G.E.; Waring, S.C.; Ivnik, R.J.; Tangalos, E.G.; Kokmen, E. Mild cognitive impairment: Clinical characterization and outcome. Arch. Neurol. 1999, 56, 303–308. [Google Scholar] [CrossRef] [Scilit]
- Crutch, S.J.; Schott, J.M.; Rabinovici, G.D.; Murray, M.; Snowden, J.S.; van der Flier, W.M.; Dickerson, B.C.; Vandenberghe, R.; Ahmed, S.; Bak, T.H.; et al. Consensus classification of posterior cortical atrophy. Alzheimer’s Dementia. 2017, 13, 870–884. [Google Scholar] [CrossRef] [Scilit]
- Hwang, J.; Kim, C.M.; Jeon, S.; Lee, J.M.; Hong, Y.J.; Roh, J.H.; Lee, J.H.; Koh, J.Y.; Na, D.L.; Alzheimer’s Disease Neuroimaging Initiative. Prediction of alzheimer’s disease pathophysiology based on cortical thickness patterns. Alzheimers Dement. 2016, 2, 58–67. [Google Scholar] [CrossRef] [Scilit]
- Becker, G.A.; Ichise, M.; Barthel, H.; Luthardt, J.; Patt, M.; Seese, A.; Schultze-Mosgau, M.; Rohde, B.; Gertz, H.J.; Reininger, C.; et al. Pet quantification of 18f-florbetaben binding to beta-amyloid deposits in human brains. J. Nucl. Med. 2013, 54, 723–731. [Google Scholar] [CrossRef] [Scilit] [PubMed]
- Dickerson, B.C.; Bakkour, A.; Salat, D.H.; Feczko, E.; Pacheco, J.; Greve, D.N.; Grodstein, F.; Wright, C.I.; Blacker, D.; Rosas, H.D.; et al. The cortical signature of alzheimer’s disease: Regionally specific cortical thinning relates to symptom severity in very mild to mild ad dementia and is detectable in asymptomatic amyloid-positive individuals. Cereb. Cortex 2009, 19, 497–510. [Google Scholar] [CrossRef] [Scilit] [PubMed]
- Jennings, D.; Seibyl, J.; Sabbagh, M.; Lai, F.; Hopkins, W.; Bullich, S.; Gimenez, M.; Reininger, C.; Putz, B.; Stephens, A.; et al. Age dependence of brain beta-amyloid deposition in down syndrome: An [18f]florbetaben pet study. Neurology 2015, 84, 500–507. [Google Scholar] [CrossRef] [Scilit]
- Ahn, H.J.; Chin, J.; Park, A.; Lee, B.H.; Suh, M.K.; Seo, S.W.; Na, D.L. Seoul Neuropsychological Screening Battery-dementia version (SNSB-D): A useful tool for assessing and monitoring cognitive impairments in dementia patients. J. Korean Med. Sci. 2010, 25, 1071–1076. [Google Scholar] [CrossRef] [Scilit] [PubMed]
- Fastenau, P.S.; Denburg, N.L.; Hufford, B.J. Adult norms for the rey-osterrieth complex figure test and for supplemental recognition and matching trials from the extended complex figure test. Clin. Neuropsychol. 1999, 13, 30–47. [Google Scholar] [CrossRef] [Scilit]
- Woodard, J.L.; Benedict, R.H.; Roberts, V.J.; Goldstein, F.C.; Kinner, K.M.; Capruso, D.X.; Clark, A.N. Short-form alternatives to the judgment of line orientation test. J. Clin. Exp. Neuropsychol. 1996, 18, 898–904. [Google Scholar] [CrossRef] [Scilit] [PubMed]
- Cho, H.; Seo, S.W.; Kim, J.H.; Suh, M.K.; Lee, J.H.; Choe, Y.S.; Lee, K.H.; Kim, J.S.; Kim, G.H.; Noh, Y.; et al. Amyloid deposition in early onset versus late onset alzheimer’s disease. J. Alzheimers Dis. JAD 2013, 35, 813–821. [Google Scholar] [CrossRef] [Scilit]
- Becker, J.T.; Lopez, O.L.; Boller, F. Understanding impaired analysis of faces by patients with probable alzheimer’s disease. Cortex 1995, 31, 129–137. [Google Scholar] [CrossRef] [Scilit]
- Ridgway, G.R.; Lehmann, M.; Barnes, J.; Rohrer, J.D.; Warren, J.D.; Crutch, S.J.; Fox, N.C. Early-onset alzheimer disease clinical variants: Multivariate analyses of cortical thickness. Neurology 2012, 79, 80–84. [Google Scholar] [CrossRef] [Scilit]
- Van der Flier, W.M.; Pijnenburg, Y.A.; Fox, N.C.; Scheltens, P. Early-onset versus late-onset alzheimer’s disease: The case of the missing apoe varepsilon4 allele. Lancet Neurol. 2011, 10, 280–288. [Google Scholar] [CrossRef] [Scilit]
- Ossenkoppele, R.; Zwan, M.D.; Tolboom, N.; van Assema, D.M.; Adriaanse, S.F.; Kloet, R.W.; Boellaard, R.; Windhorst, A.D.; Barkhof, F.; Lammertsma, A.A.; et al. Amyloid burden and metabolic function in early-onset alzheimer’s disease: Parietal lobe involvement. Brain A J. Neurol. 2012, 135, 2115–2125. [Google Scholar] [CrossRef] [Scilit] [PubMed]
- Day, G.S.; Gordon, B.A.; Jackson, K.; Christensen, J.J.; Rosana Ponisio, M.; Su, Y.; Ances, B.M.; Benzinger, T.L.S.; Morris, J.C. Tau-pet binding distinguishes patients with early-stage posterior cortical atrophy from amnestic alzheimer disease dementia. Alzheimer Dis. Assoc. Disord. 2017, 31, 87–93. [Google Scholar] [CrossRef] [Scilit]
- Lehmann, M.; Ghosh, P.M.; Madison, C.; Laforce, R., Jr.; Corbetta-Rastelli, C.; Weiner, M.W.; Greicius, M.D.; Seeley, W.W.; Gorno-Tempini, M.L.; Rosen, H.J. Diverging patterns of amyloid deposition and hypometabolism in clinical variants of probable Alzheimer’s disease. Brain. 2013, 136, 844–858. [Google Scholar] [CrossRef] [Scilit] [PubMed]
- Singh, T.D.; Josephs, K.A.; Machulda, M.M.; Drubach, D.A.; Apostolova, L.G.; Lowe, V.J.; Whitwell, J.L. Clinical, fdg and amyloid pet imaging in posterior cortical atrophy. J. Neurol. 2015, 262, 1483–1492. [Google Scholar] [CrossRef] [Scilit] [PubMed]
- Sintini, I.; Martin, P.R.; Graff-Radford, J.; Senjem, M.L.; Schwarz, C.G.; Machulda, M.M.; Spychalla, A.J.; Drubach, D.A.; Knopman, D.S.; Petersen, R.C.; et al. Longitudinal tau-pet uptake and atrophy in atypical alzheimer’s disease. Neuroimage Clin. 2019, 23, 101823. [Google Scholar] [CrossRef] [Scilit]
- Sintini, I.; Graff-Radford, J.; Senjem, M.L.; Schwarz, C.G.; Machulda, M.M.; Martin, P.R.; Jones, D.T.; Boeve, B.F.; Knopman, D.S.; Kantarci, K.; et al. Longitudinal neuroimaging biomarkers differ across alzheimer’s disease phenotypes. Brain 2020, 143, 2281–2294. [Google Scholar] [CrossRef] [Scilit]
- Whitwell, J.L.; Graff-Radford, J.; Tosakulwong, N.; Weigand, S.D.; Machulda, M.M.; Senjem, M.L.; Spychalla, A.J.; Vemuri, P.; Jones, D.T.; Drubach, D.A.; et al. Imaging correlations of tau, amyloid, metabolism, and atrophy in typical and atypical alzheimer’s disease. Alzheimers Dement. 2018, 14, 1005–1014. [Google Scholar] [CrossRef] [Scilit] [PubMed]

Publisher’s Note: MDPI stays neutral with regard to jurisdictional claims in published maps and institutional affiliations. |
© 2021 by the authors. Licensee MDPI, Basel, Switzerland. This article is an open access article distributed under the terms and conditions of the Creative Commons Attribution (CC BY) license (https://creativecommons.org/licenses/by/4.0/).