Multi-Study Proteomic and Bioinformatic Identification of Molecular Overlap between Amyotrophic Lateral Sclerosis (ALS) and Spinal Muscular Atrophy (SMA)


 , and
, and 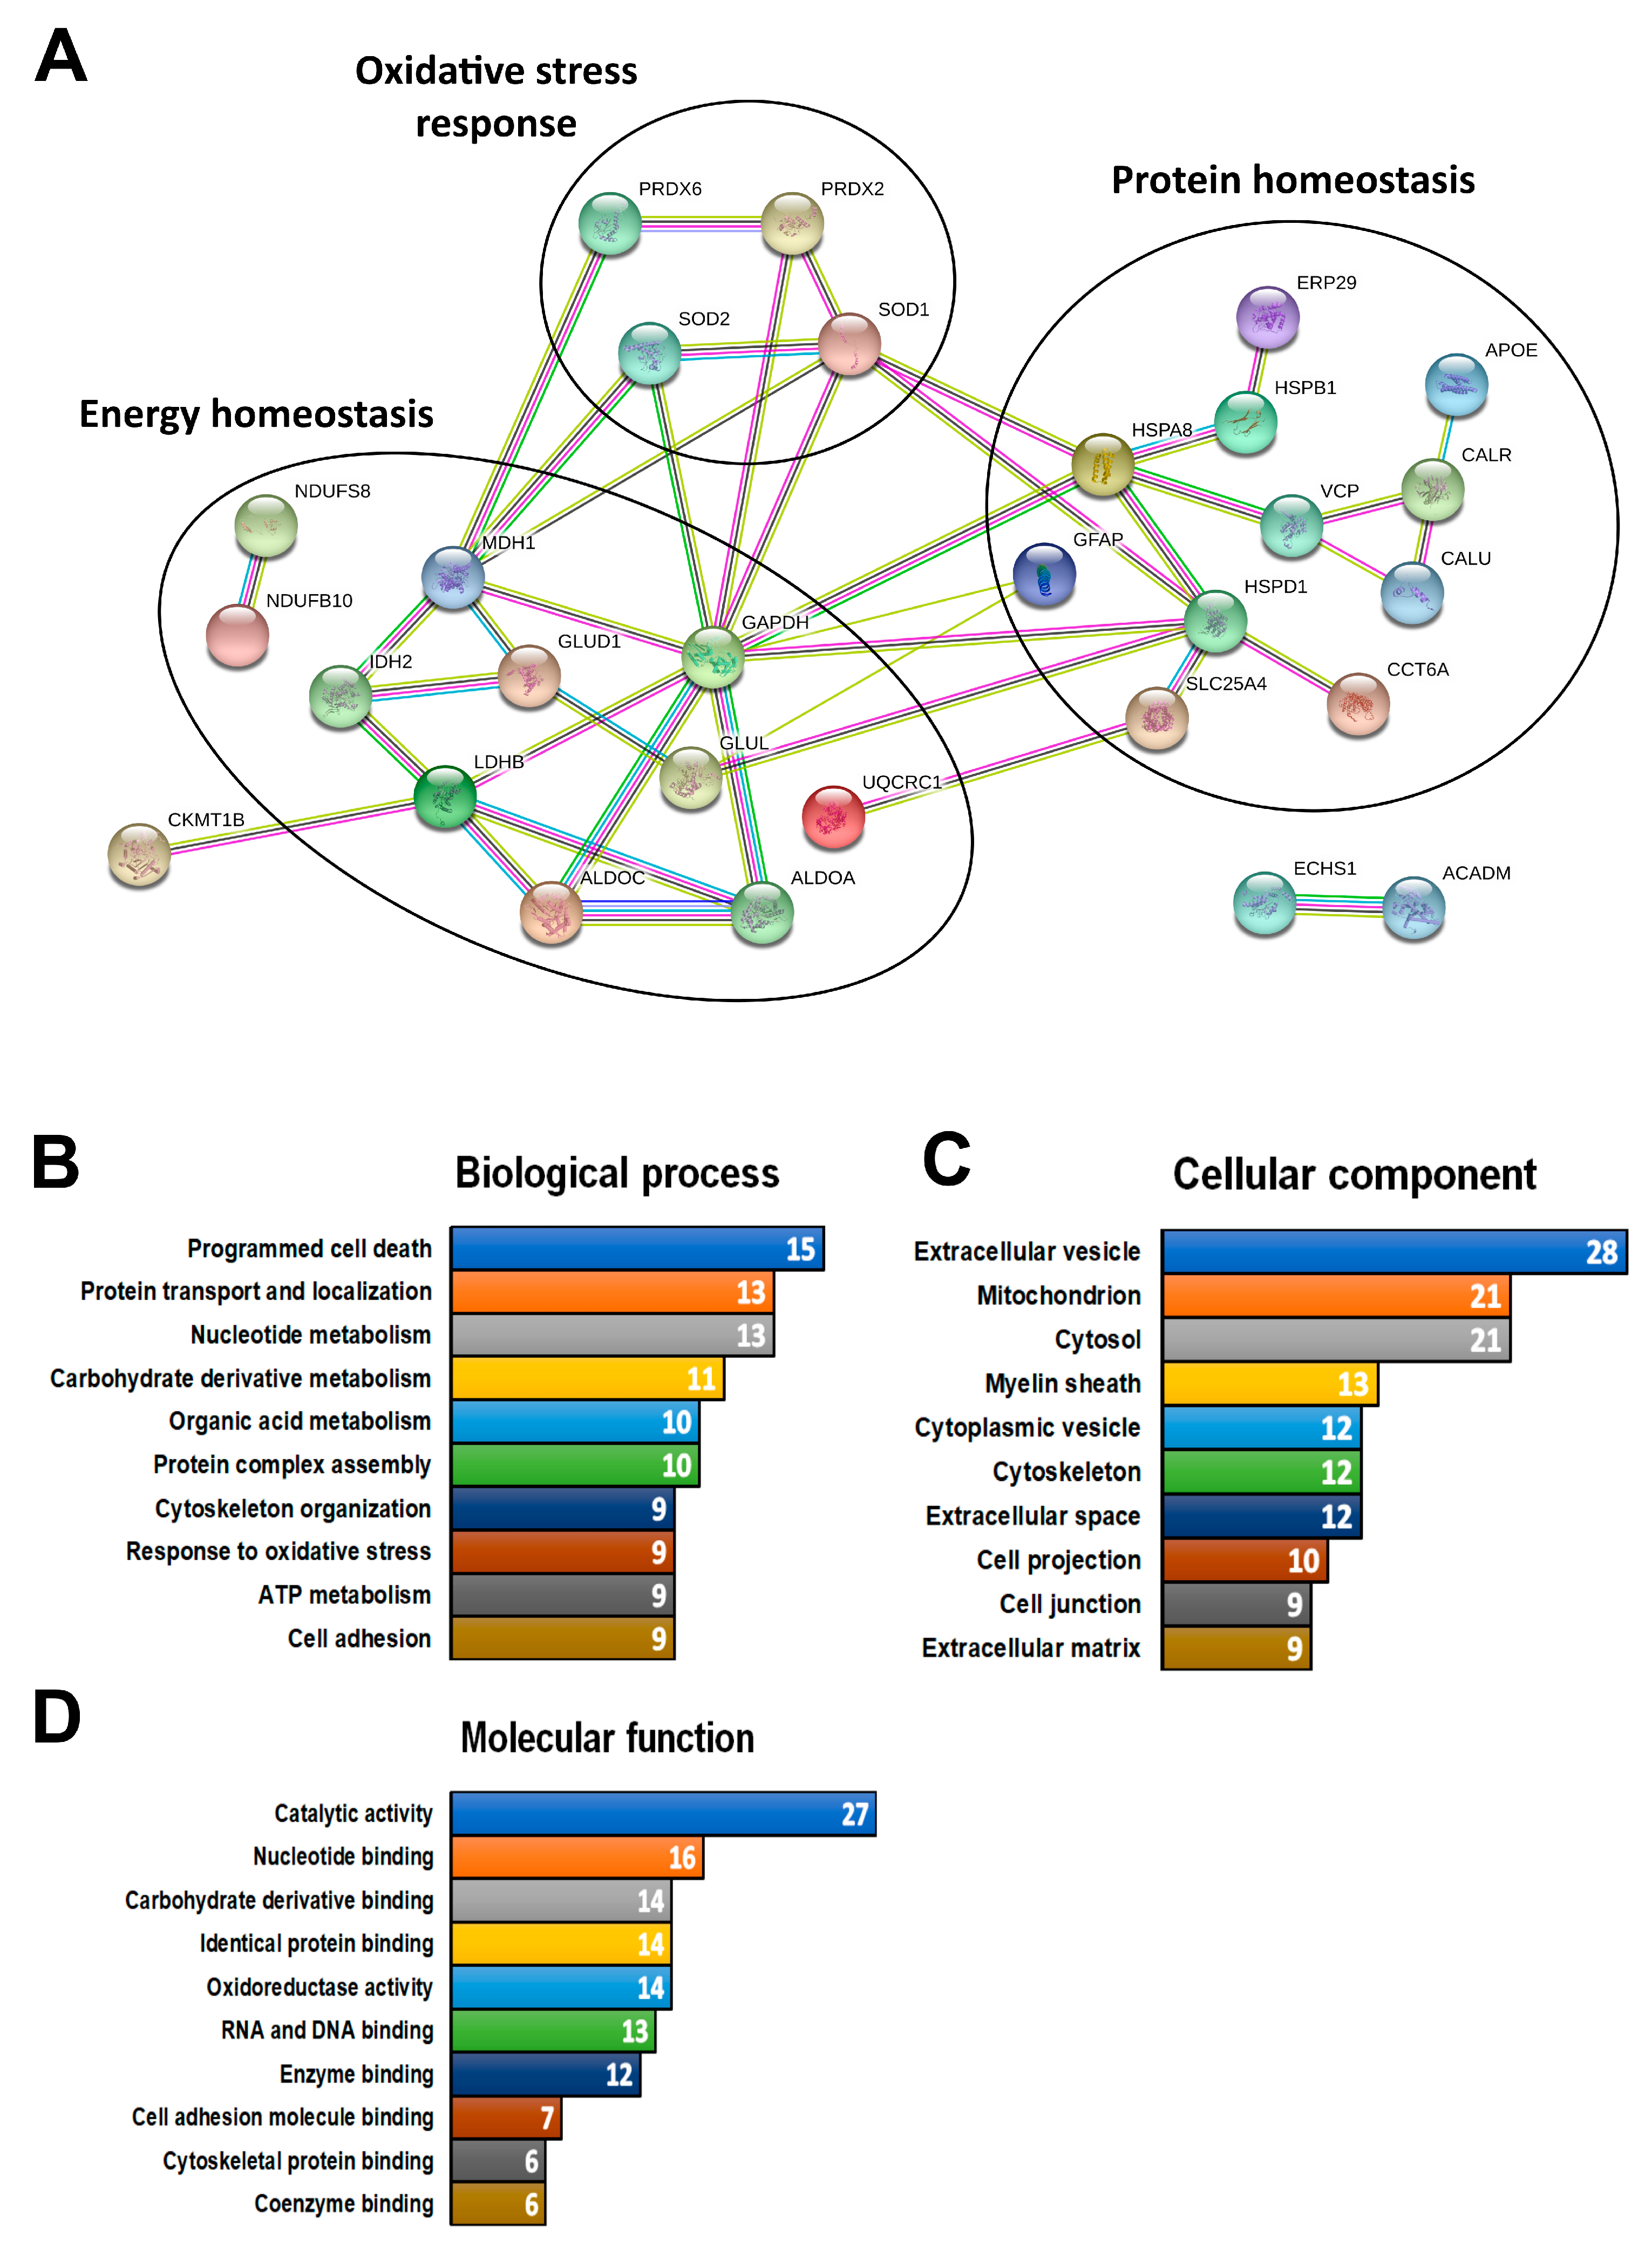
Abstract
:1. Introduction
2. Materials and Methods
2.1. Identification of ALS Proteomic Studies
2.2. Comparison of ALS Proteomic Studies
2.3. Bioinformatics Analysis
2.4. Comparison of SMA and ALS Proteome Changes
2.5. Animal Models
2.6. Western Blotting
2.7. Immunohistochemistry
2.8. Quantitative PCR
3. Results
3.1. Overview of ALS Proteomic Studies
3.2. Multi-Study Proteomic Identification of Conserved Molecular Response in ALS Patients and ALS Experimental Models
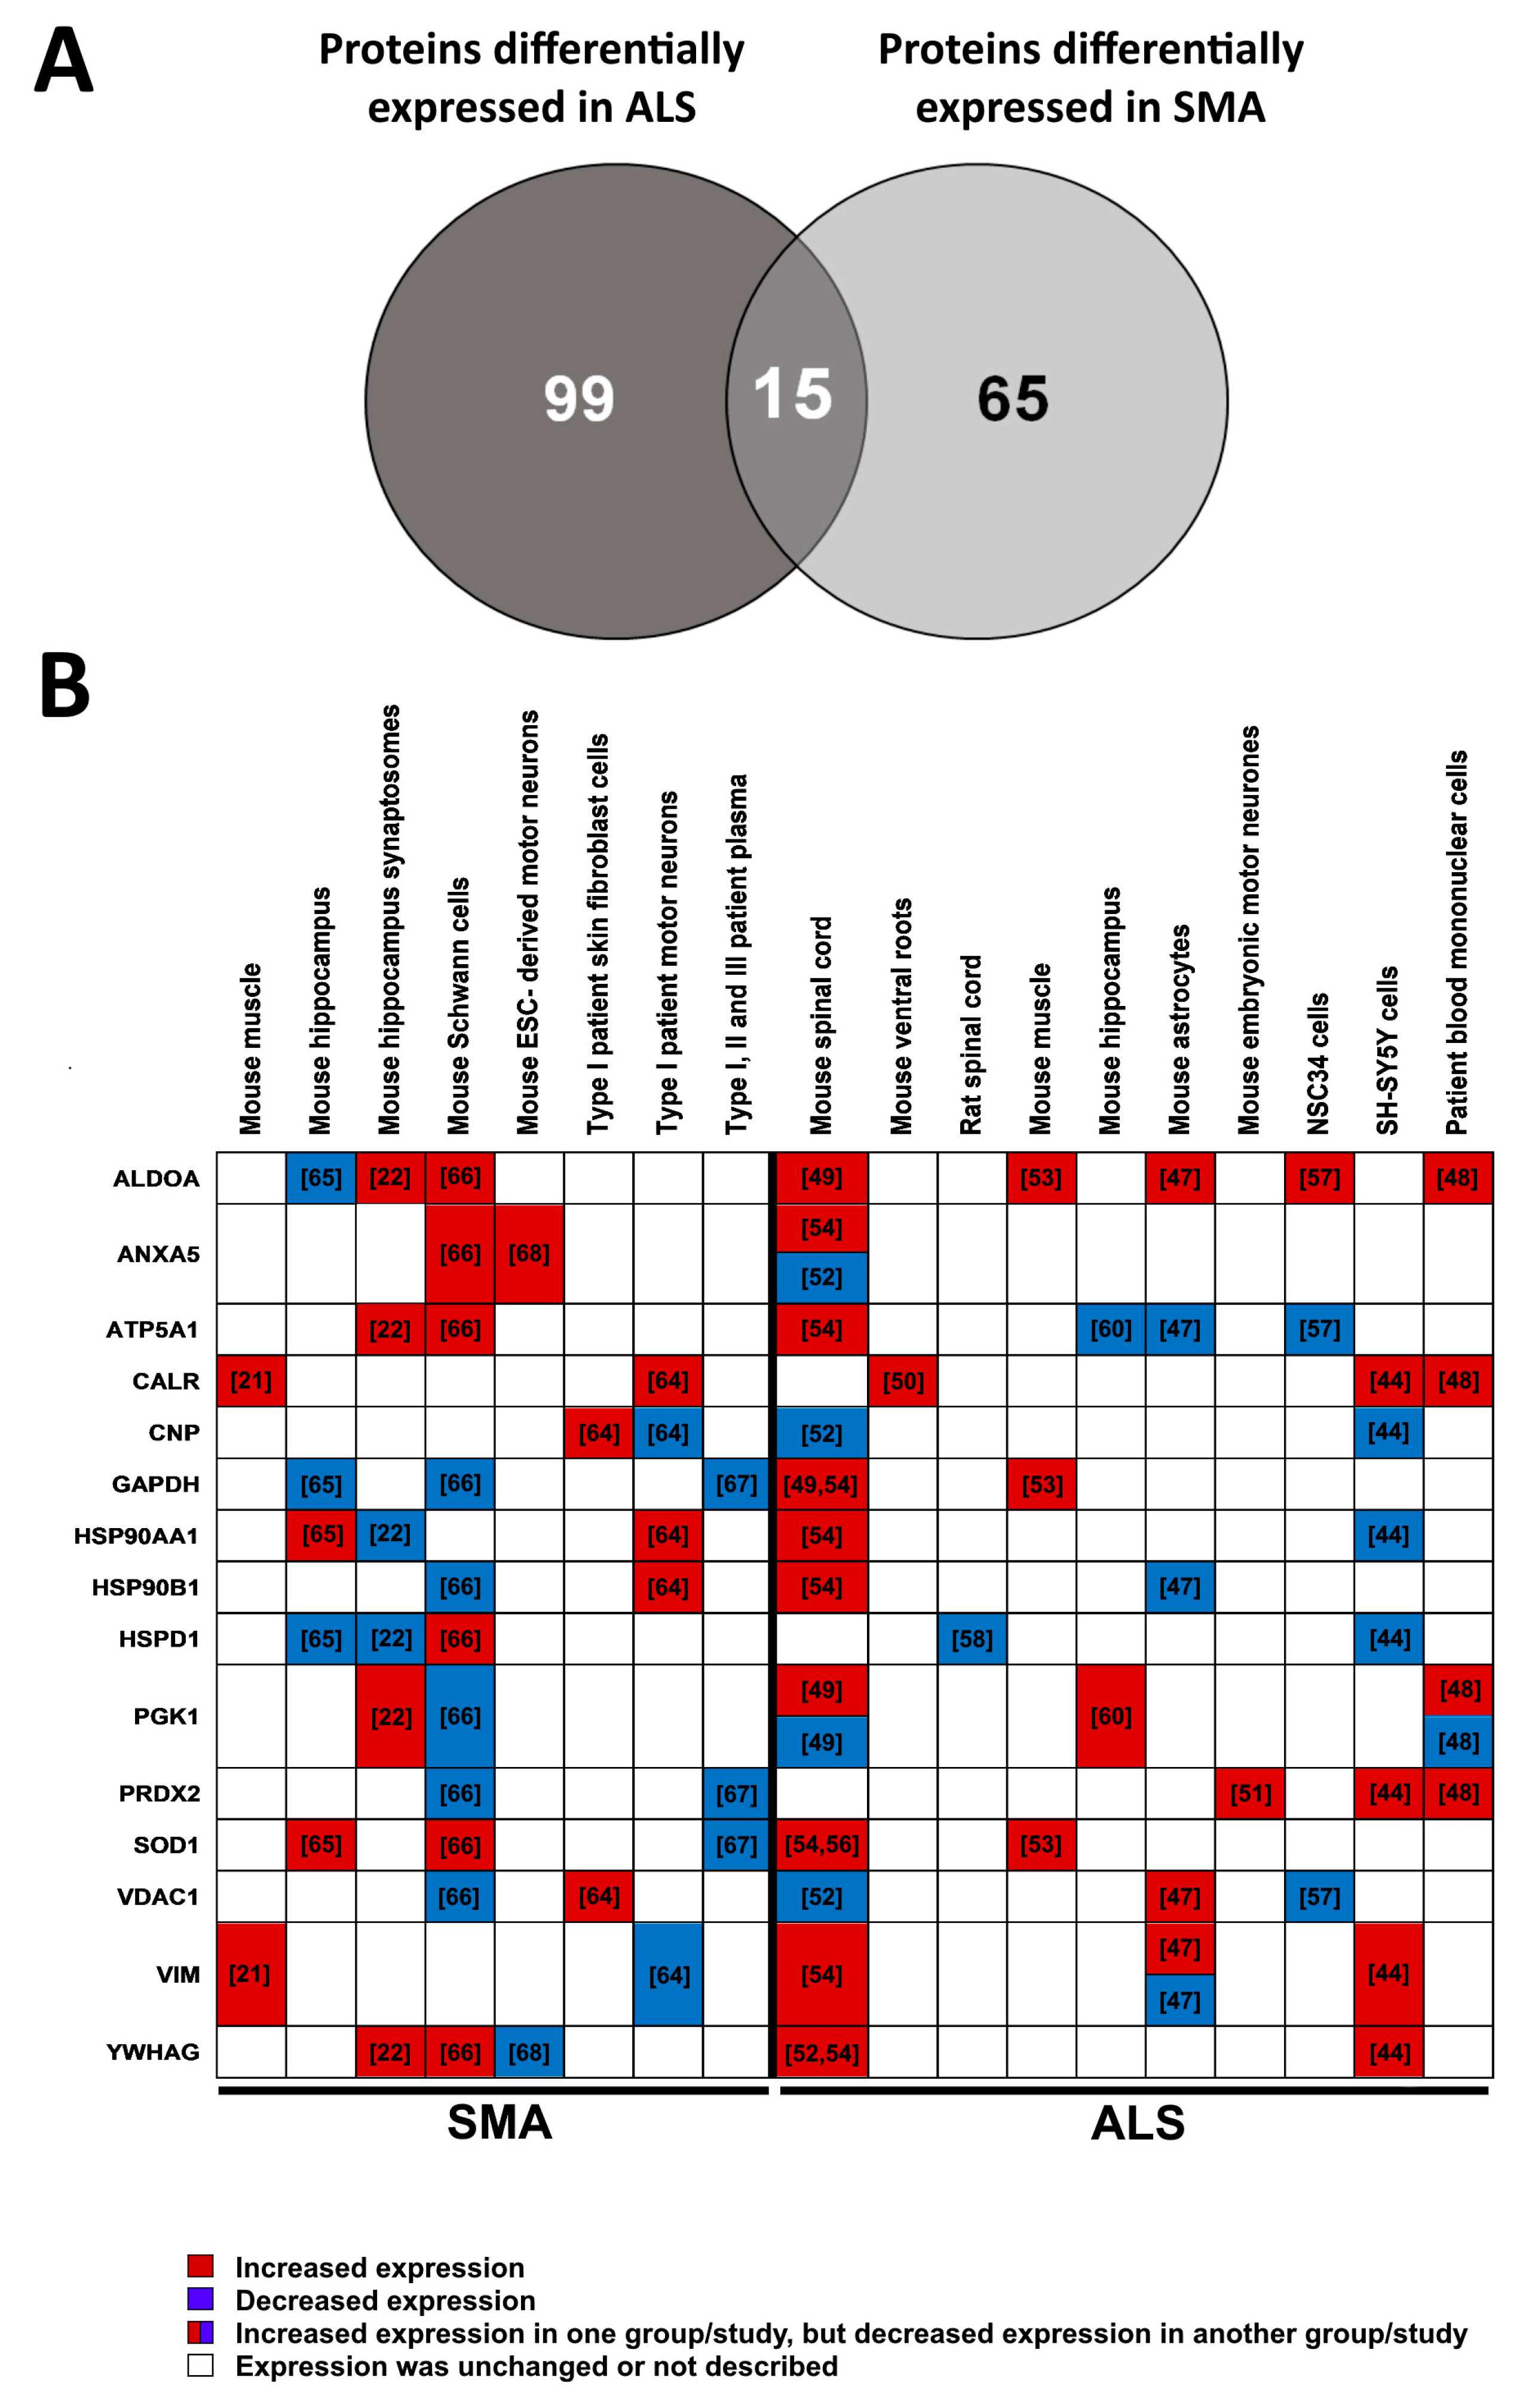
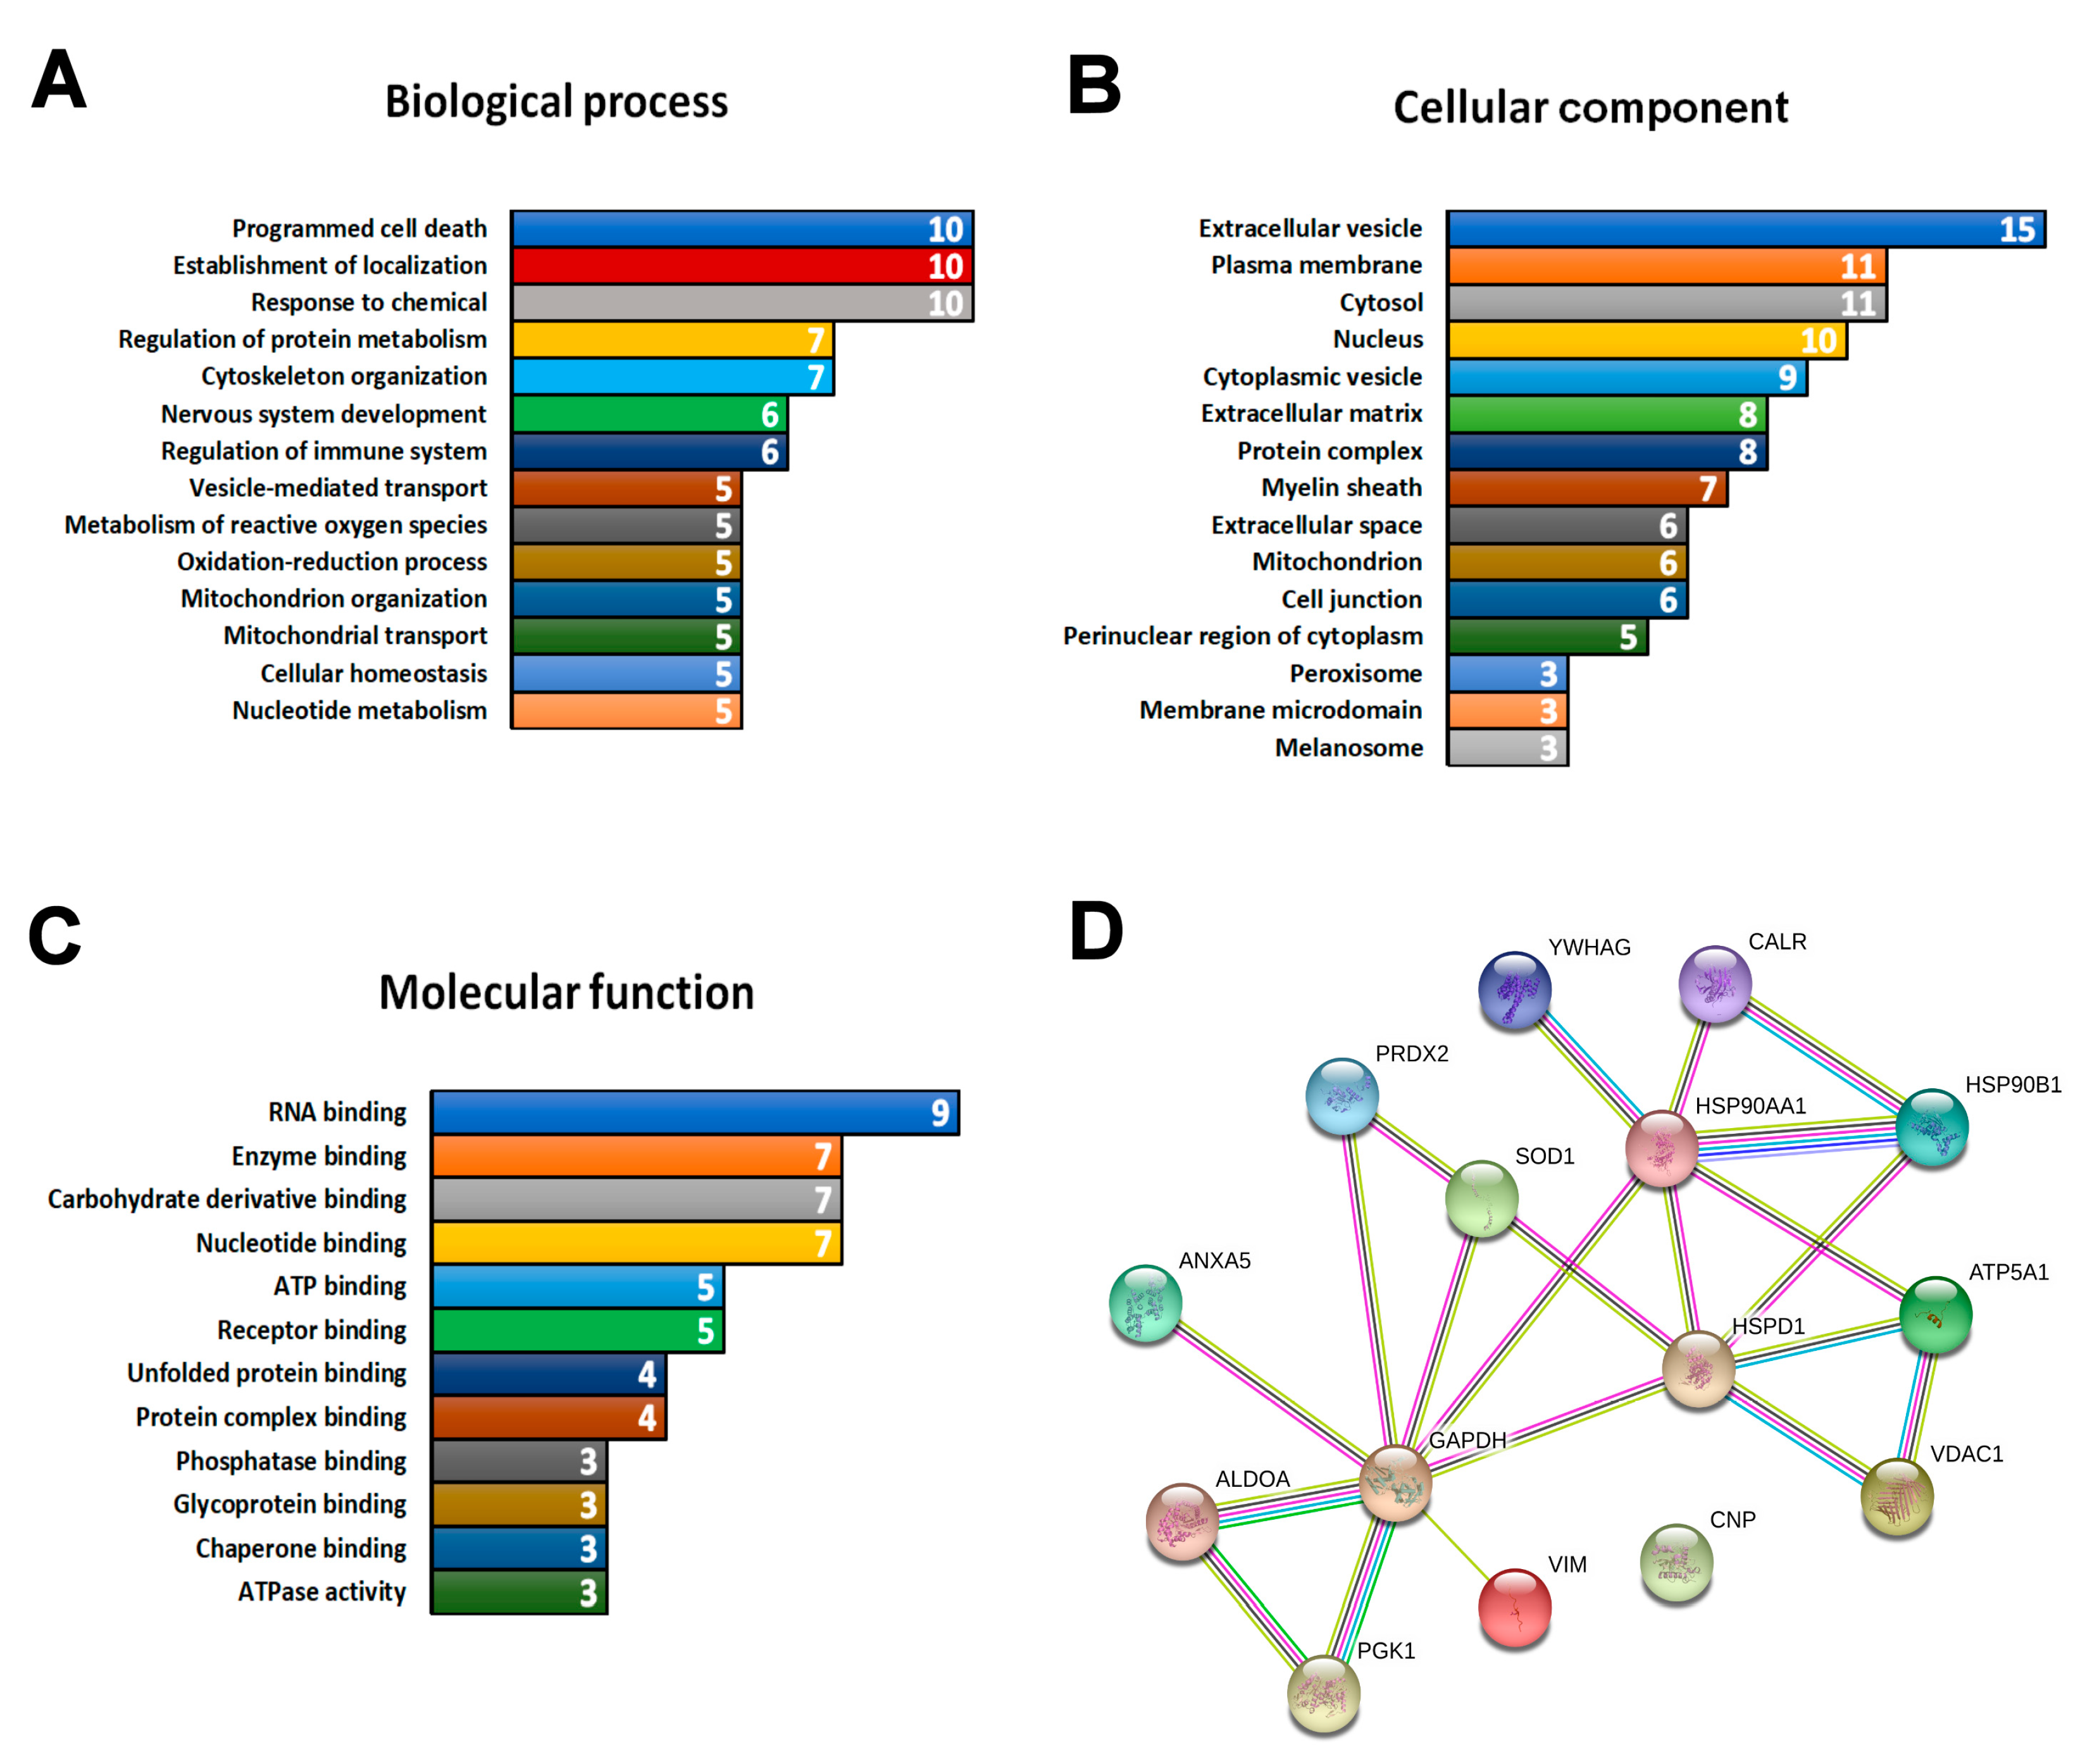
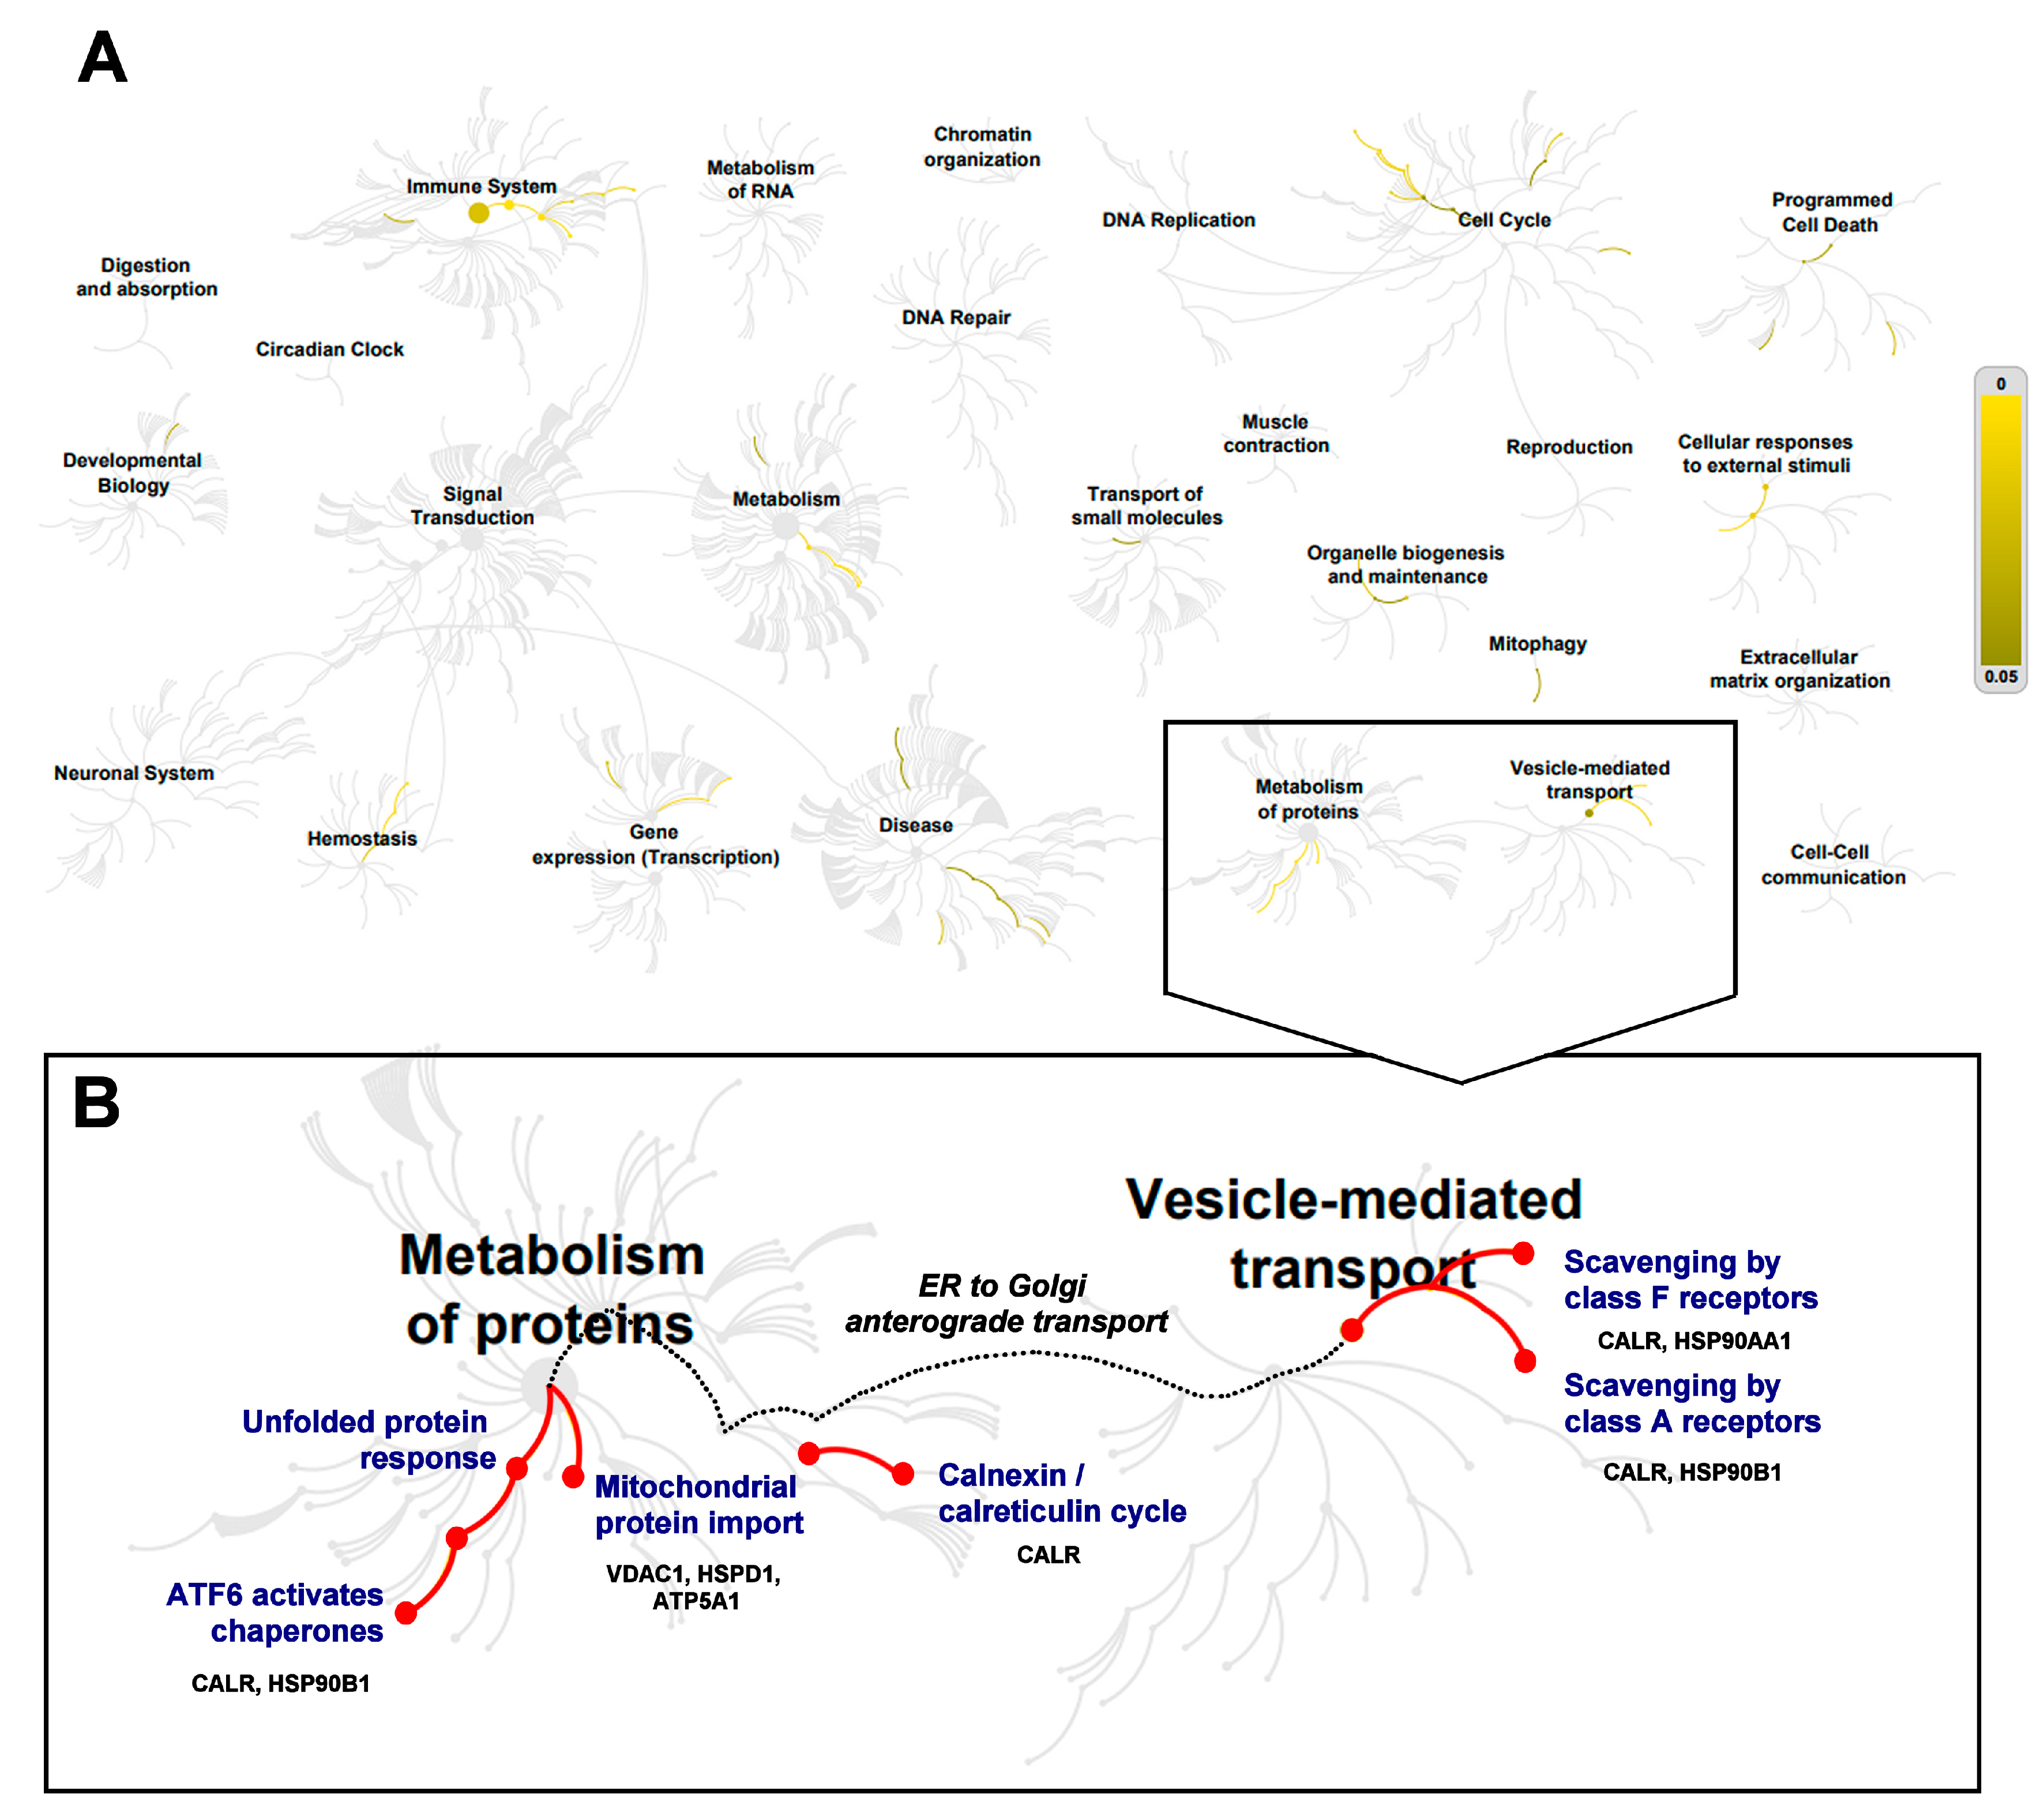
3.3. Multi-Study Proteomic Identification of Conserved Molecular Perturbations in both SMA and ALS
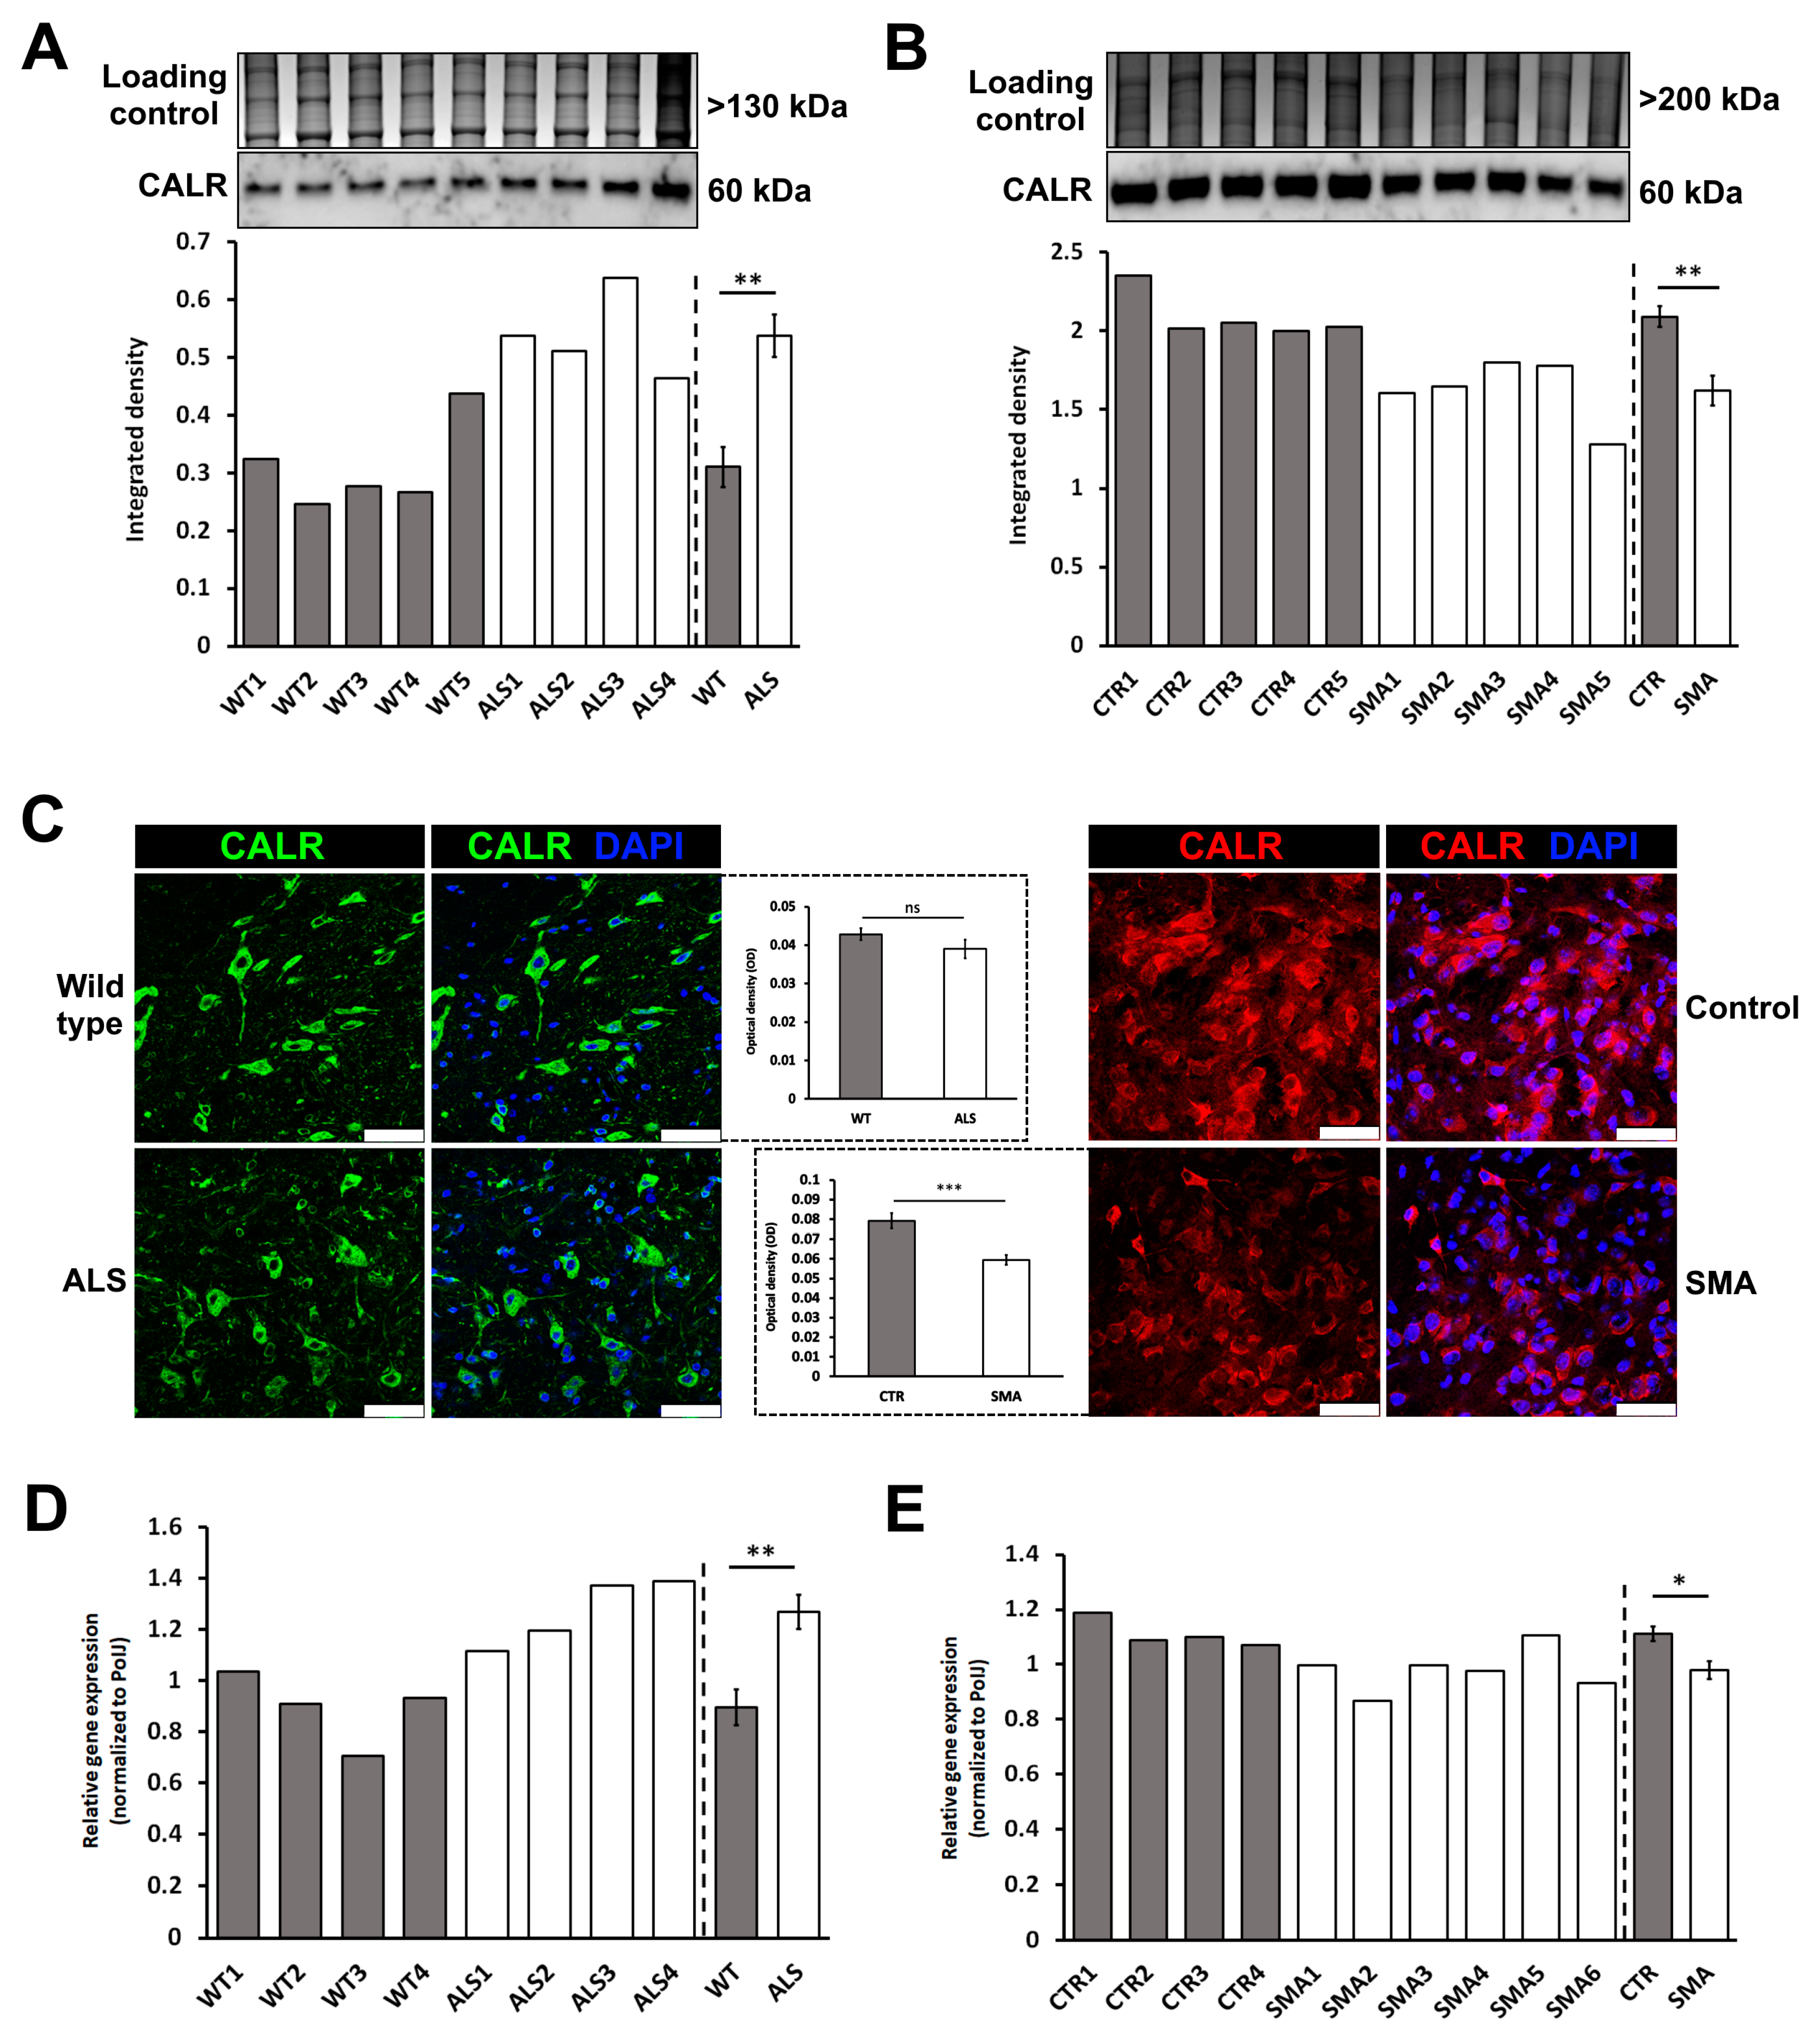
3.4. Calreticulin Expression is Dysregulated in Spinal Cord Tissue from ALS and SMA Mice
4. Discussion
Supplementary Materials
Author Contributions
Funding
Conflicts of Interest
References
- Naganska, E.; Matyja, E. Amyotrophic lateral sclerosis—Looking for pathogenesis and effective therapy. Folia Neuropathol. 2011, 49, 1–13. [Google Scholar] [PubMed]
- Valdmanis, P.N.; Rouleau, G.A. Genetics of familial amyotrophic lateral sclerosis. Neurology 2008, 70, 144–152. [Google Scholar] [CrossRef] [PubMed]
- Zou, Z.-Y.; Zhou, Z.-R.; Che, C.-H.; Liu, C.-Y.; He, R.-L.; Huang, H.-P. Genetic epidemiology of amyotrophic lateral sclerosis: A systematic review and meta-analysis. J. Neurol. Neurosurg. Psychiatry 2017, 88, 540–549. [Google Scholar] [CrossRef] [PubMed]
- Groen, E.J.N.; Talbot, K.; Gillingwater, T.H. Advances in therapy for spinal muscular atrophy: Promises and challenges. Nat. Rev. Neurol. 2018, 14, 214–224. [Google Scholar] [CrossRef] [PubMed]
- Lefebvre, S.; Burglen, L.; Reboullet, S.; Clermont, O.; Burlet, P.; Viollet, L.; Benichou, B.; Cruaud, C.; Millasseau, P.; Zeviani, M.; et al. Identification and characterization of a spinal muscular atrophy-determining gene. Cell 1995, 80, 155–165. [Google Scholar] [CrossRef] [Green Version]
- Shorrock, H.K.; Gillingwater, T.H.; Groen, E.J.N. Overview of Current Drugs and Molecules in Development for Spinal Muscular Atrophy Therapy. Drugs 2018, 78, 293–305. [Google Scholar] [CrossRef] [PubMed] [Green Version]
- Dorst, J.; Ludolph, A.C.; Huebers, A. Disease-modifying and symptomatic treatment of amyotrophic lateral sclerosis. Ther. Adv. Neurol. Disord. 2017, 11, 1756285617734734. [Google Scholar] [CrossRef] [PubMed]
- Miller, R.G.; Appel, S.H. Introduction to supplement: The current status of treatment for ALS. Amyotroph. Lateral Scler. Front. Degener. 2017, 18, 1–4. [Google Scholar] [CrossRef] [PubMed]
- Finkel, R.S.; Chiriboga, C.A.; Vajsar, J.; Day, J.W.; Montes, J.; De Vivo, D.C.; Yamashita, M.; Rigo, F.; Hung, G.; Schneider, E.; et al. Treatment of infantile-onset spinal muscular atrophy with nusinersen: A phase 2, open-label, dose-escalation study. Lancet 2016, 388, 3017–3026. [Google Scholar] [CrossRef]
- Chiriboga, C.A.; Swoboda, K.J.; Darras, B.T.; Iannaccone, S.T.; Montes, J.; De Vivo, D.C.; Norris, D.A.; Bennett, C.F.; Bishop, K.M. Results from a phase 1 study of nusinersen (ISIS-SMNRx) in children with spinal muscular atrophy. Neurology 2016, 86, 890–897. [Google Scholar] [CrossRef] [PubMed] [Green Version]
- Finkel, R.S.; Mercuri, E.; Darras, B.T.; Connolly, A.M.; Kuntz, N.L.; Kirschner, J.; Chiriboga, C.A.; Saito, K.; Servais, L.; Tizzano, E.; et al. Nusinersen versus Sham Control in Infantile-Onset Spinal Muscular Atrophy. N. Engl. J. Med. 2017, 377, 1723–1732. [Google Scholar] [CrossRef] [PubMed]
- Ravits, J.; Appel, S.; Baloh, R.H.; Barohn, R.; Rix Brooks, B.; Elman, L.; Floeter, M.K.; Henderson, C.; Lomen-Hoerth, C.; Macklis, J.D.; et al. Deciphering amyotrophic lateral sclerosis: What phenotype, neuropathology and genetics are telling us about pathogenesis. Amyotroph. Lateral Scler. Front. Degener. 2013, 14, 5–18. [Google Scholar] [CrossRef] [Green Version]
- Gonçalves, I.D.C.G.; Rehorst, W.A.; Kye, M.J. Dysregulation of RNA Mediated Gene Expression in Motor Neuron Diseases. CNS Neurol. Disord. Drug Targets 2016, 15, 887–895. [Google Scholar] [CrossRef] [PubMed]
- Gama-Carvalho, M.; Garcia-Vaquero, M.L.; Pinto, F.R.; Besse, F.; Weis, J.; Voigt, A.; Schulz, J.B.; De Las Rivas, J. Linking Amyotrophic Lateral Sclerosis and Spinal Muscular Atrophy through RNA-transcriptome homeostasis: A genomics perspective. J. Neurochem. 2017, 141, 12–30. [Google Scholar] [CrossRef] [PubMed]
- Bowerman, M.; Murrray, L.M.; Scamps, F.; Schneider, B.L.; Kothary, R.; Raoul, C. Pathogenic commonalities between spinal muscular atrophy and amyotrophic lateral sclerosis: Converging roads to therapeutic development. Eur. J. Med. Genet. 2017, 61, 685–698. [Google Scholar] [CrossRef] [PubMed]
- Fuller, H.R.; Gillingwater, T.H.; Wishart, T.M. Commonality amid diversity: Multi-study proteomic identification of conserved disease mechanisms in spinal muscular atrophy. Neuromuscul. Disord. 2016, 26, 560–569. [Google Scholar] [CrossRef] [PubMed]
- Gelebart, P.; Opas, M.; Michalak, M. Calreticulin, a Ca2+-binding chaperone of the endoplasmic reticulum. Int. J. Biochem. Cell Biol. 2005, 37, 260–266. [Google Scholar] [CrossRef]
- Huang, D.W.; Sherman, B.T.; Lempicki, R.A. Systematic and integrative analysis of large gene lists using DAVID bioinformatics resources. Nat. Protoc. 2009, 4, 44–57. [Google Scholar] [CrossRef]
- Huang, D.W.; Sherman, B.T.; Lempicki, R.A. Bioinformatics enrichment tools: Paths toward the comprehensive functional analysis of large gene lists. Nucleic Acids Res. 2009, 37, 1–13. [Google Scholar] [CrossRef]
- Chen, Y.; Liu, X.H.; Wu, J.-J.; Ren, H.M.; Wang, J.; Ding, Z.T.; Jiang, V.P. Proteomic analysis of cerebrospinal fluid in amyotrophic lateral sclerosis. Exp. Ther. Med. 2016, 11, 2095–2106. [Google Scholar] [CrossRef] [Green Version]
- Mutsaers, C.A.; Lamont, D.J.; Hunter, G.; Wishart, T.M.; Gillingwater, T.H. Label-free proteomics identifies Calreticulin and GRP75/Mortalin as peripherally accessible protein biomarkers for spinal muscular atrophy. Genome Med. 2013, 5, 95. [Google Scholar] [CrossRef] [PubMed] [Green Version]
- Wishart, T.M.; Mutsaers, C.A.; Riessland, M.; Reimer, M.M.; Hunter, G.; Hannam, M.L.; Eaton, S.L.; Fuller, H.R.; Roche, S.L.; Somers, E.; et al. Dysregulation of ubiquitin homeostasis and β-catenin signaling promote spinal muscular atrophy. J. Clin. Investig. 2014, 124, 1821–1834. [Google Scholar] [CrossRef] [PubMed] [Green Version]
- Szklarczyk, D.; Franceschini, A.; Wyder, S.; Forslund, K.; Heller, D.; Huerta-Cepas, J.; Simonovic, M.; Roth, A.; Santos, A.; Tsafou, K.P.; et al. STRING v10: Protein–protein interaction networks, integrated over the tree of life. Nucleic Acids Res. 2014, 43, D447–D452. [Google Scholar] [CrossRef] [PubMed]
- Fabregat, A.; Jupe, S.; Matthews, L.; Sidiropoulos, K.; Gillespie, M.; Garapati, P.; Haw, R.; Jassal, B.; Korninger, F.; May, B.; et al. The Reactome pathway Knowledgebase. Nucleic Acids Res. 2018, 46, D649–D655. [Google Scholar] [CrossRef] [PubMed]
- Hsieh-Li, H.M.; Chang, J.-G.; Jong, Y.-J.; Wu, M.-H.; Wang, N.M.; Tsai, C.H.; Li, H. A mouse model for spinal muscular atrophy. Nat. Genet. 2000, 24, 66–70. [Google Scholar] [CrossRef] [PubMed]
- Gurney, M.E.; Pu, H.; Chiu, A.Y.; Dal Canto, M.C.; Polchow, C.Y.; Alexander, D.D.; Caliendo, J.; Hentati, A.; Kwon, Y.W.; Deng, H.X. Motor neuron degeneration in mice that express a human Cu, Zn superoxide dismutase mutation. Science 1994, 264, 1772–1775. [Google Scholar] [CrossRef] [PubMed]
- Riessland, M.; Ackermann, B.; Forster, A.; Jakubik, M.; Hauke, J.; Garbes, L.; Fritzsche, I.; Mende, Y.; Blumcke, I.; Hahnen, E.; et al. SAHA ameliorates the SMA phenotype in two mouse models for spinal muscular atrophy. Hum. Mol. Genet. 2010, 19, 1492–1506. [Google Scholar] [CrossRef] [PubMed] [Green Version]
- Schindelin, J.; Arganda-Carreras, I.; Frise, E.; Kaynig, V.; Longair, M.; Pietzsch, T.; Preibisch, S.; Rueden, C.; Saalfeld, S.; Schmid, B.; et al. Fiji: An open-source platform for biological-image analysis. Nat. Methods 2012, 9, 676–682. [Google Scholar] [CrossRef] [PubMed]
- Radonić, A.; Thulke, S.; Mackay, I.M.; Landt, O.; Siegert, W.; Nitsche, A. Guideline to reference gene selection for quantitative real-time PCR. Biochem. Biophys. Res. Commun. 2004, 313, 856–862. [Google Scholar] [CrossRef] [PubMed]
- Pfaffl, M.W. A new mathematical model for relative quantification in real-time RT-PCR. Nucleic Acids Res. 2001, 29, e45. [Google Scholar] [CrossRef]
- Collins, M.A.; An, J.; Hood, B.L.; Conrads, T.P.; Bowser, R.P. Label-Free LC−MS/MS Proteomic Analysis of Cerebrospinal Fluid Identifies Protein/Pathway Alterations and Candidate Biomarkers for Amyotrophic Lateral Sclerosis. J. Proteome Res. 2015, 14, 4486–4501. [Google Scholar] [CrossRef] [PubMed]
- Varghese, A.M.; Sharma, A.; Mishra, P.; Vijayalakshmi, K.; Harsha, H.C.; Sathyaprabha, T.N.; Bharath, S.M.; Nalini, A.; Alladi, P.A.; Raju, T.R. Chitotriosidase-a putative biomarker for sporadic amyotrophic lateral sclerosis. Clin. Proteomics 2013, 10, 19. [Google Scholar] [CrossRef] [PubMed]
- Mendonça, D.M.F.; Pizzati, L.; Mostacada, K.; de Martins, S.C.; Higashi, R.; Ayres Sá, L.; Moura Neto, V.; Chimelli, L.; Martinez, A.M.B. Neuroproteomics: An insight into ALS. Neurol. Res. 2012, 34, 937–943. [Google Scholar] [CrossRef] [PubMed]
- Von Neuhoff, N.; Oumeraci, T.; Wolf, T.; Kollewe, K.; Bewerunge, P.; Neumann, B.; Brors, B.; Bufler, J.; Wurster, U.; Schlegelberger, B.; et al. Monitoring CSF Proteome Alterations in Amyotrophic Lateral Sclerosis: Obstacles and Perspectives in Translating a Novel Marker Panel to the Clinic. PLoS ONE 2012, 7, e44401. [Google Scholar] [CrossRef] [PubMed]
- Ryberg, H.; An, J.; Darko, S.; Lustgarten, J.L.; Jaffa, M.; Gopalakrishnan, V.; Lacomis, D.; Cudkowicz, M.; Bowser, R. Discovery and verification of amyotrophic lateral sclerosis biomarkers by proteomics. Muscle Nerve 2010, 42, 104–111. [Google Scholar] [CrossRef] [Green Version]
- Brettschneider, J.; Mogel, H.; Lehmensiek, V.; Ahlert, T.; Süssmuth, S.; Ludolph, A.C.; Tumani, H. Proteome analysis of cerebrospinal fluid in amyotrophic lateral sclerosis (ALS). Neurochem. Res. 2008, 33, 2358–2363. [Google Scholar] [CrossRef] [PubMed]
- Ranganathan, S.; Williams, E.; Ganchev, P.; Gopalakrishnan, V.; Lacomis, D.; Urbinelli, L.; Newhall, K.; Cudkowicz, M.E.; Brown, R.H., Jr.; Bowser, R. Proteomic profiling of cerebrospinal fluid identifies biomarkers for amyotrophic lateral sclerosis. J. Neurochem. 2005, 95, 1461–1471. [Google Scholar] [CrossRef] [PubMed] [Green Version]
- Ranganathan, S.; Nicholl, G.C.B.; Henry, S.; Lutka, F.; Sathanoori, R.; Lacomis, D.; Bowser, R. Comparative proteomic profiling of cerebrospinal fluid between living and post mortem ALS and control subjects. Amyotroph. Lateral Scler. 2007, 8, 373–379. [Google Scholar] [CrossRef] [PubMed] [Green Version]
- Pasinetti, G.M.; Ungar, L.H.; Lange, D.J.; Yemul, S.; Deng, H.; Yuan, X.; Brown, R.H.; Cudkowicz, M.E.; Newhall, K.; Peskind, E.; et al. Identification of potential CSF biomarkers in ALS. Neurology 2006, 66, 1218–1222. [Google Scholar] [CrossRef] [PubMed]
- Thompson, A.G.; Gray, E.; Thezenas, M.L.; Charles, D.; Evetts, S.; Hu, M.T.; Talbot, K.; Fischer, R.; Kessler, B.M.; Turner, M.R. Cerebrospinal Fluid Macrophage Biomarkers in Amyotrophic Lateral Sclerosis. Ann. Neurol. 2018, 83, 258–268. [Google Scholar] [CrossRef] [PubMed]
- De Benedetti, S.; Gianazza, E.; Banfi, C.; Marocchi, A.; Lunetta, C.; Penco, S.; Bonomi, F.; Iametti, S. Serum Proteome in a Sporadic Amyotrophic Lateral Sclerosis Geographical Cluster. Proteomics Clin. Appl. 2017, 11, 1700043. [Google Scholar] [CrossRef] [PubMed]
- Schwenk, B.M.; Hartmann, H.; Serdaroglu, A.; Schludi, M.H.; Hornburg, D.; Meissner, F.; Orozco, D.; Colombo, A.; Tahirovic, S.; Michaelsen, M.; et al. TDP-43 loss of function inhibits endosomal trafficking and alters trophic signaling in neurons. EMBO J. 2016, 35, 2350–2370. [Google Scholar] [CrossRef] [PubMed]
- Sharma, A.; Varghese, A.M.; Vijaylakshmi, K.; Sumitha, R.; Prasanna, V.K.; Shruthi, S.; Chandrasekhar Sagar, B.K.; Datta, K.K.; Gowda, H.; Nalini, A.; et al. Cerebrospinal Fluid from Sporadic Amyotrophic Lateral Sclerosis Patients Induces Mitochondrial and Lysosomal Dysfunction. Neurochem. Res. 2016, 41, 965–984. [Google Scholar] [CrossRef] [PubMed]
- Stalekar, M.; Yin, X.; Rebolj, K.; Darovic, S.; Troakes, C.; Mayr, M.; Shaw, C.E.; Rogelj, B. Proteomic analyses reveal that loss of TDP-43 affects RNA processing and intracellular transport. Neuroscience 2015, 293, 157–170. [Google Scholar] [CrossRef] [PubMed]
- Conti, A.; Riva, N.; Pesca, M.; Iannaccone, S.; Cannistraci, C.V.; Corbo, M.; Previtali, S.C.; Quattrini, A.; Alessio, M. Increased expression of Myosin binding protein H in the skeletal muscle of amyotrophic lateral sclerosis patients. Biochim. Biophys. Acta 2014, 1842, 99–106. [Google Scholar] [CrossRef] [PubMed] [Green Version]
- Elf, K.; Shevchenko, G.; Nygren, I.; Larsson, L.; Bergquist, J.; Askmark, H.; Artemenko, K. Alterations in muscle proteome of patients diagnosed with amyotrophic lateral sclerosis. J. Proteomics 2014, 108, 55–64. [Google Scholar] [CrossRef] [PubMed]
- Basso, M.; Pozzi, S.; Tortarolo, M.; Fiordaliso, F.; Bisighini, C.; Pasetto, L.; Spaltro, G.; Lidonnici, D.; Gensano, F.; Battaglia, E.; et al. Mutant Copper-Zinc superoxide dismutase (SOD1) induces protein secretion pathway alterations and exosome release in astrocytes: Implications for disease spreading and motor neuron pathology in amyotrophic lateral sclerosis. J. Biol. Chem. 2013, 288, 15699–15711. [Google Scholar] [CrossRef] [PubMed]
- Nardo, G.; Pozzi, S.; Pignataro, M.; Lauranzano, E.; Spano, G.; Garbelli, S.; Mantovani, S.; Marinou, K.; Papetti, L.; Monteforte, M.; et al. Amyotrophic lateral sclerosis multiprotein biomarkers in peripheral blood mononuclear cells. PLoS ONE 2011, 6, e25545. [Google Scholar] [CrossRef]
- Bastone, A.; Fumagalli, E.; Bigini, P.; Perini, P.; Bernardinello, D.; Cagnotto, A.; Mereghetti, I.; Curti, D.; Salmona, M.; Mennini, T. Proteomic profiling of cervical and lumbar spinal cord reveals potential protective mechanisms in the wobbler mouse, a model of motor neuron degeneration. J. Proteome Res. 2009, 8, 5229–5240. [Google Scholar] [CrossRef]
- Zhou, J.-Y.; Afjehi-Sadat, L.; Asress, S.; Duong, D.M.; Cudkowicz, M.; Glass, J.D.; Peng, J. Galectin-3 is a candidate biomarker for ALS: Discovery by a proteomics approach. J. Proteome Res. 2010, 9, 5133–5141. [Google Scholar] [CrossRef]
- Duplan, L.; Bernard, N.; Casseron, W.; Dudley, K.; Thouvenot, E.; Honnorat, J.; Rogemond, V.; De Bovis, B.; Aebischer, P.; Marin, P.; et al. Collapsin response mediator protein 4a (CRMP4a) is upregulated in motoneurons of mutant SOD1 mice and can trigger motoneuron axonal degeneration and cell death. J. Neurosci. 2010, 30, 785–796. [Google Scholar] [CrossRef] [PubMed]
- Bergemalm, D.; Forsberg, K.; Jonsson, P.A.; Graffmo, K.S.; Brännströ, T.; Andersen, P.M.; Antti, H.; Marklund, S.L. Changes in the spinal cord proteome of an amyotrophic lateral sclerosis murine model determined by differential in-gel electrophoresis. Mol. Cell. Proteom. 2009, 8, 1306–1317. [Google Scholar] [CrossRef] [PubMed]
- Staunton, L.; Jockusch, H.; Ohlendieck, K. Proteomic analysis of muscle affected by motor neuron degeneration: The wobbler mouse model of amyotrophic lateral sclerosis. Biochem. Biophys. Res. Commun. 2011, 406, 595–600. [Google Scholar] [CrossRef] [PubMed] [Green Version]
- Basso, M.; Samengo, G.; Nardo, G.; Massignan, T.; D’Alessandro, G.; Tartari, S.; Cantoni, L.; Marino, M.; Cheroni, C.; De Biasi, S.; et al. Characterization of detergent-insoluble proteins in ALS indicates a causal link between nitrative stress and aggregation in pathogenesis. PLoS ONE 2009, 4, e8130. [Google Scholar] [CrossRef] [PubMed]
- Massignan, T.; Casoni, F.; Basso, M.; Stefanazzi, P.; Biasini, E.; Tortarolo, M.; Salmona, M.; Gianazza, E.; Bendotti, C.; Bonetto, V. Proteomic analysis of spinal cord of presymptomatic amyotrophic lateral sclerosis G93A SOD1 mouse. Biochem. Biophys. Res. Commun. 2007, 353, 719–725. [Google Scholar] [CrossRef] [PubMed]
- Strey, C.W.; Spellman, D.; Stieber, A.; Gonatas, J.O.; Wang, X.; Lambris, J.D.; Gonatas, N.K. Dysregulation of stathmin, a microtubule-destabilizing protein, and up-regulation of Hsp25, Hsp27, and the antioxidant peroxiredoxin 6 in a mouse model of familial amyotrophic lateral sclerosis. Am. J. Pathol. 2004, 165, 1701–1718. [Google Scholar] [CrossRef]
- Fukada, K.; Zhang, F.; Vien, A.; Cashman, N.R.; Zhu, H. Mitochondrial Proteomic Analysis of a Cell Line Model of Familial Amyotrophic Lateral Sclerosis. Mol. Cell. Proteom. 2004, 3, 1211–1223. [Google Scholar] [CrossRef] [Green Version]
- Li, Q.; Vande Velde, C.; Israelson, A.; Xie, J.; Bailey, A.O.; Dong, M.-Q.; Chun, S.-J.; Roy, T.; Winer, L.; Yates, J.R.; et al. ALS-linked mutant superoxide dismutase 1 (SOD1) alters mitochondrial protein composition and decreases protein import. Proc. Natl. Acad. Sci. USA 2010, 107, 21146–21151. [Google Scholar] [CrossRef] [Green Version]
- Allen, S.; Heath, P.R.; Kirby, J.; Wharton, S.B.; Cookson, M.R.; Menzies, F.M.; Banks, R.E.; Shaw, P.J. Analysis of the cytosolic proteome in a cell culture model of familial amyotrophic lateral sclerosis reveals alterations to the proteasome, antioxidant defenses, and nitric oxide synthetic pathways. J. Biol. Chem. 2003, 278, 6371–6383. [Google Scholar] [CrossRef]
- Shin, J.-H.; London, J.; Le Pecheur, M.; Weitzdoerfer, R.; Hoeger, H.; Lubec, G. Proteome analysis in hippocampus of mice overexpressing human Cu/Zn-superoxide dismutase 1. Neurochem. Int. 2005, 46, 641–653. [Google Scholar] [CrossRef]
- Engelen-Lee, J.; Blokhuis, A.M.; Spliet, W.G.M.; Pasterkamp, R.J.; Aronica, E.; Demmers, J.A.A.; Broekhuizen, R.; Nardo, G.; Bovenschen, N.; Van Den Berg, L.H. Proteomic profiling of the spinal cord in ALS: Decreased ATP5D levels suggest synaptic dysfunction in ALS pathogenesis. Amyotroph. Lateral Scler. Front. Degener. 2017, 18, 210–220. [Google Scholar] [CrossRef] [PubMed]
- Umoh, M.E.; Dammer, E.B.; Dai, J.; Duong, D.M.; Lah, J.J.; Levey, A.I.; Gearing, M.; Glass, J.D.; Seyfried, N.T. A proteomic network approach across the ALS-FTD disease spectrum resolves clinical phenotypes and genetic vulnerability in human brain. EMBO Mol. Med. 2018, 10, 48–62. [Google Scholar] [CrossRef] [PubMed]
- Anderson, N.L.; Anderson, N.G. The human plasma proteome: History, character, and diagnostic prospects. Mol. Cell. Proteom. 2002, 1, 845–867. [Google Scholar] [CrossRef] [PubMed]
- Fuller, H.R.; Mandefro, B.; Shirran, S.L.; Gross, A.R.; Kaus, A.S.; Botting, C.H.; Morris, G.E.; Sareen, D. Spinal Muscular Atrophy Patient iPSC-Derived Motor Neurons Have Reduced Expression of Proteins Important in Neuronal Development. Front. Cell. Neurosci. 2016, 9, 506. [Google Scholar] [CrossRef] [PubMed] [Green Version]
- Wishart, T.M.; Huang, J.P.-W.; Murray, L.M.; Lamont, D.J.; Mutsaers, C.A.; Ross, J.; Geldsetzer, P.; Ansorge, O.; Talbot, K.; Parson, S.H.; et al. SMN deficiency disrupts brain development in a mouse model of severe spinal muscular atrophy. Hum. Mol. Genet. 2010, 19, 4216–4228. [Google Scholar] [CrossRef] [PubMed] [Green Version]
- Sarvestany, A.A.; Hunter, G.; Tavendale, A.; Lamont, D.J.; Hurtado, M.L.; Graham, L.C.; Wishart, T.M.; Gillingwater, T.H. Label-Free Quantitative Proteomic Profiling Identifies Disruption of Ubiquitin Homeostasis As a Key Driver of Schwann Cell Defects in Spinal Muscular Atrophy. J. Proteome Res. 2014, 13, 4546–4557. [Google Scholar] [CrossRef]
- Kobayashi, D.T.; Shi, J.; Stephen, L.; Ballard, K.L.; Dewey, R.; Mapes, J.; Chung, B.; McCarthy, K.; Swoboda, K.J.; Crawford, T.O.; et al. SMA-MAP: A Plasma Protein Panel for Spinal Muscular Atrophy. PLoS ONE 2013, 8, e60113. [Google Scholar] [CrossRef]
- Wu, C.-Y.; Whye, D.; Glazewski, L.; Choe, L.; Kerr, D.; Lee, K.H.; Mason, R.W.; Wang, W. Proteomic assessment of a cell model of spinal muscular atrophy. BMC Neurosci. 2011, 12, 25. [Google Scholar] [CrossRef]
- Sidiropoulos, K.; Viteri, G.; Sevilla, C.; Jupe, S.; Webber, M.; Orlic-Milacic, M.; Jassal, B.; May, B.; Shamovsky, V.; Duenas, C.; et al. Reactome enhanced pathway visualization. Bioinformatics 2017, 33, 3461–3467. [Google Scholar] [CrossRef] [Green Version]
- Schröder, M. Endoplasmic reticulum stress responses. Cell. Mol. Life Sci. 2008, 65, 862–894. [Google Scholar] [CrossRef]
- Gonatas, N.K.; Stieber, A.; Mourelatos, Z.; Chen, Y.; Gonatas, J.O.; Appel, S.H.; Hays, A.P.; Hickey, W.F.; Hauw, J.-J. Fragmentation of the Golgi apparatus of motor neurons in amyotrophic lateral sclerosis. Am. J. Pathol. 1992, 140, 731–737. [Google Scholar] [PubMed]
- Mourelatos, Z.; Gonatas, N.K.; Stieber, A.; Gurney, M.E.; Dal Canto, M.C. The Golgi apparatus of spinal cord motor neurons in transgenic mice expressing mutant Cu, Zn superoxide dismutase becomes fragmented in early, preclinical stages of the disease. Proc. Natl. Acad. Sci. USA 1996, 93, 5472–5477. [Google Scholar] [CrossRef] [PubMed]
- Atkin, J.D.; Farg, M.A.; Walker, A.K.; Mclean, C.; Tomas, D.; Horne, M.K. Endoplasmic reticulum stress and induction of the unfolded protein response in human sporadic amyotrophic lateral sclerosis. Neurobiol. Dis. 2008, 30, 400–407. [Google Scholar] [CrossRef] [PubMed]
- Ng, S.-Y.; Soh, B.S.; Rodriguez-Muela, N.; Hendrickson, D.G.; Price, F.; Rinn, J.L.; Rubin, L.L. Genome-Wide RNA-Seq of Human Motor Neurons Implicates Selective ER Stress Activation in Spinal Muscular Atrophy. Cell Stem Cell 2015, 17, 569–584. [Google Scholar] [CrossRef] [PubMed]
- Montague, K.; Malik, B.; Gray, A.L.; La Spada, A.R.; Hanna, M.G.; Szabadkai, G.; Greensmith, L. Endoplasmic reticulum stress in spinal and bulbar muscular atrophy: A potential target for therapy. Brain 2014, 137, 1894–1906. [Google Scholar] [CrossRef] [PubMed]
- Yaguchi, M.; Hashizume, Y.; Yoshida, M.K.; Gonatas, N.; Okamoto, K. Reduction of the size of the Golgi apparatus of spinal anterior horn cells in patients with X-linked spinal and bulbar muscular atrophy. Amyotroph. Lateral Scler. Other Mot. Neuron Disord. 2003, 4, 17–21. [Google Scholar] [CrossRef]
- Neveling, K.; Martinez-Carrera, L.A.; Hölker, I.; Heister, A.; Verrips, A.; Hosseini-Barkooie, S.M.; Gilissen, C.; Vermeer, S.; Pennings, M.; Meijer, R.; et al. Mutations in BICD2, which encodes a golgin and important motor adaptor, cause congenital autosomal-dominant spinal muscular atrophy. Am. J. Hum. Genet. 2013, 92, 946–954. [Google Scholar] [CrossRef]
- Atkin, J.D.; Farg, M.A.; Soo, K.Y.; Walker, A.K.; Halloran, M.; Turner, B.J.; Nagley, P.; Horne, M.K. Mutant SOD1 inhibits ER-Golgi transport in amyotrophic lateral sclerosis. J. Neurochem. 2014, 129, 190–204. [Google Scholar] [CrossRef]
- Preston, A.M.; Gurisik, E.; Bartley, C.; Laybutt, D.R.; Biden, T.J. Reduced endoplasmic reticulum (ER)-to-Golgi protein trafficking contributes to ER stress in lipotoxic mouse beta cells by promoting protein overload. Diabetologia 2009, 52, 2369–2373. [Google Scholar] [CrossRef]
- Soo, K.Y.; Halloran, M.; Sundaramoorthy, V.; Parakh, S.; Toth, R.P.; Southam, K.A.; Mclean, C.A.; Lock, P.; King, A.; Farg, M.A.; et al. Rab1-dependent ER-Golgi transport dysfunction is a common pathogenic mechanism in SOD1, TDP-43 and FUS-associated ALS. Acta Neuropathol. 2015, 130, 679–697. [Google Scholar] [CrossRef]
- Peter, C.J.; Evans, M.; Thayanithy, V.; Taniguchi-Ishigaki, N.; Bach, I.; Kolpak, A.; Bassell, G.J.; Rossoll, W.; Lorson, C.L.; Bao, Z.-Z.; et al. The COPI vesicle complex binds and moves with survival motor neuron within axons. Hum. Mol. Genet. 2011, 20, 1701–1711. [Google Scholar] [CrossRef] [PubMed] [Green Version]
- Ting, C.-H.; Wen, H.-L.; Liu, H.-C.; Hsieh-Li, H.-M.; Li, H.; Lin-Chao, S. The spinal muscular atrophy disease protein SMN is linked to the Golgi network. PLoS ONE 2012, 7, e51826. [Google Scholar] [CrossRef] [PubMed]
- Custer, S.K.; Todd, A.G.; Singh, N.N.; Androphy, E.J. Dilysine motifs in exon 2b of SMN protein mediate binding to the COPI vesicle protein a-COP and neurite outgrowth in a cell culture model of spinal muscular atrophy. Hum. Mol. Genet. 2013, 22, 4043–4052. [Google Scholar] [CrossRef] [PubMed]
- Li, H.; Custer, S.K.; Gilson, T.; Hao, L.T.; Beattie, C.E.; Androphy, E.J. α-COP binding to the survival motor neuron protein SMN is required for neuronal process outgrowth. Hum. Mol. Genet. 2015, 24, 7295–7307. [Google Scholar] [CrossRef] [PubMed] [Green Version]
- Prell, T.; Lautenschläger, J.; Grosskreutz, J. Calcium-dependent protein folding in amyotrophic lateral sclerosis. Cell Calcium 2013, 54, 132–143. [Google Scholar] [CrossRef] [PubMed]
- Bernard-Marissal, N.; Moumen, A.; Sunyach, C.; Pellegrino, C.; Dudley, K.; Henderson, C.E.; Raoul, C.; Pettmann, B. Reduced calreticulin levels link endoplasmic reticulum stress and Fas-triggered cell death in motoneurons vulnerable to ALS. J. Neurosci. 2012, 32, 4901–4912. [Google Scholar] [CrossRef]
- Jablonka, S.; Beck, M.; Lechner, B.; Mayer, C.; Sendtner, M. Defective Ca2+ channel clustering in axon terminals disturbs excitability in motoneurons in spinal muscular atrophy. J. Cell Biol. 2007, 179, 139–149. [Google Scholar] [CrossRef]
- Ruiz, R.; Casanas, J.J.; Torres-Benito, L.; Cano, R.; Tabares, L. Altered intracellular Ca2+ homeostasis in nerve terminals of severe spinal muscular atrophy mice. J. Neurosci. 2010, 30, 849–857. [Google Scholar] [CrossRef]
- McGivern, J.V.; Patitucci, T.N.; Nord, J.A.; Barabas, M.; Stucky, C.L.; Ebert, A.D. Spinal muscular atrophy astrocytes exhibit abnormal calcium regulation and reduced growth factor production. Glia 2013, 61, 1418–1428. [Google Scholar] [CrossRef] [Green Version]
- Siklós, L.; Engelhardt, J.; Harati, Y.; Smith, R.G.; Joó, F.; Appel, S.H. Ultrastructural evidence for altered calcium in motor nerve terminals in amyotrophc lateral sclerosis. Ann. Neurol. 1996, 39, 203–216. [Google Scholar] [CrossRef]
- Siklós, L.; Engelhardt, J.I.; Alexianu, M.E.; Gurney, M.E.; Siddique, T.; Appel, S.H. Intracellular calcium parallels motoneuron degeneration in SOD-1 mutant mice. J. Neuropathol. Exp. Neurol. 1998, 57, 571–587. [Google Scholar] [CrossRef] [PubMed]
- Kruman, I.I.; Pedersen, W.A.; Springer, J.E.; Mattson, M.P. ALS-linked Cu/Zn-SOD mutation increases vulnerability of motor neurons to excitotoxicity by a mechanism involving increased oxidative stress and perturbed calcium homeostasis. Exp. Neurol. 1999, 160, 28–39. [Google Scholar] [CrossRef] [PubMed]
- Ashby, M.C.; Tepikin, A.V. ER calcium and the functions of intracellular organelles. Semin. Cell Dev. Biol. 2001, 12, 11–17. [Google Scholar] [CrossRef] [PubMed]
- Tarr, J.M.; Young, P.J.; Morse, R.; Shaw, D.J.; Haigh, R.; Petrov, P.G.; Johnson, S.J.; Winyard, P.G.; Eggleton, P. A mechanism of release of calreticulin from cells during apoptosis. J. Mol. Biol. 2010, 401, 799–812. [Google Scholar] [CrossRef] [PubMed] [Green Version]
- Gagliardi, S.; Zucca, S.; Pandini, C.; Diamanti, L.; Bordoni, M.; Sproviero, D.; Arigoni, M.; Olivero, M.; Pansarasa, O.; Ceroni, M.; et al. Long non-coding and coding RNAs characterization in Peripheral Blood Mononuclear Cells and Spinal Cord from Amyotrophic Lateral Sclerosis patients. Sci. Rep. 2018, 8, 2378. [Google Scholar] [CrossRef] [PubMed]
- Mougeot, J.-L.C.; Li, Z.; Price, A.E.; Wright, F.A.; Brooks, B.R. Microarray analysis of peripheral blood lymphocytes from ALS patients and the SAFE detection of the KEGG ALS pathway. BMC Med. Genom. 2011, 4, 74. [Google Scholar] [CrossRef] [PubMed]
- De Oliveira, G.P.; Alves, C.J.; Chadi, G. Early gene expression changes in spinal cord from SOD1 G93A Amyotrophic Lateral Sclerosis animal model. Front. Cell. Neurosci. 2013, 7, 216. [Google Scholar] [CrossRef] [PubMed]
- Maeda, M.; Harris, A.W.; Kingham, B.F.; Lumpkin, C.J.; Opdenaker, L.M.; Mccahan, S.M.; Wang, W.; Butchbach, M.E.R. Transcriptome Profiling of Spinal Muscular Atrophy Motor Neurons Derived from Mouse Embryonic Stem Cells. PLoS ONE 2014, 9, e106818. [Google Scholar] [CrossRef] [PubMed]
- Gabanella, F.; Butchbach, M.E.R.; Saieva, L.; Carissimi, C.; Burghes, A.H.M.; Pellizzoni, L. Ribonucleoprotein assembly defects correlate with spinal muscular atrophy severity and preferentially affect a subset of spliceosomal snRNPs. PLoS ONE 2007, 2, e921. [Google Scholar] [CrossRef] [PubMed]
- Saal, L.; Briese, M.; Kneitz, S.; Glinka, M.; Sendtner, M. Subcellular transcriptome alterations in a cell culture model of spinal muscular atrophy point to widespread defects in axonal growth and presynaptic differentiation. RNA 2014, 20, 1789–1802. [Google Scholar] [CrossRef] [Green Version]
- Tank, E.M.; Figueroa-Romero, C.; Hinder, L.M.; Bedi, K.; Archbold, H.C.; Li, X.; Weskamp, K.; Safren, N.; Paez-Colasante, X.; Pacut, C.; et al. Abnormal RNA stability in amyotrophic lateral sclerosis. Nat. Commun. 2018, 9, 2845. [Google Scholar] [CrossRef] [PubMed]
- Zhu, Y.; Yang, M.; Li, F.; Li, M.; Xu, Z.; Yang, F.; Liu, Y.; Chen, W.; Zhang, Y.; Xu, R. Aberrant Levels of Cystatin C in Amyotrophic Lateral Sclerosis: A Systematic Review and Meta Analysis. Int. J. Biol. Sci. 2018, 14, 1041–1053. [Google Scholar] [CrossRef] [PubMed]
- Magistretti, P.J.; Allaman, I. A cellular perspective on brain energy metabolism and functional imaging. Neuron 2015, 86, 883–901. [Google Scholar] [CrossRef]
- Tan, W.; Pasinelli, P.; Trotti, D. Role of mitochondria in mutant SOD1 linked amyotrophic lateral sclerosis. Biochim. Biophys. Acta 2014, 1842, 1295–1301. [Google Scholar] [CrossRef] [PubMed]
- Rozas, P.; Bargsted, L.; Martínez, F.; Hetz, C.; Medinas, D.B. The ER proteostasis network in ALS: Determining the differential motoneuron vulnerability. Neurosci. Lett. 2017, 636, 9–15. [Google Scholar] [CrossRef]
- Manfredi, G.; Kawamata, H. Mitochondria and endoplasmic reticulum crosstalk in amyotrophic lateral sclerosis. Neurobiol Dis. 2016, 90, 35–42. [Google Scholar] [CrossRef] [Green Version]
- Bernard-Marissal, N.; Chrast, R.; Schneider, B.L. Endoplasmic reticulum and mitochondria in diseases of motor and sensory neurons: A broken relationship? Cell Death Dis. 2018, 9, 333. [Google Scholar] [CrossRef] [PubMed]
- Quek, C.; Hill, A.F. The role of extracellular vesicles in neurodegenerative diseases. Biochem. Biophys. Res. Commun. 2017, 483, 1178–1186. [Google Scholar] [CrossRef]
- Nash, L.A.; Mcfall, E.R.; Perozzo, A.M.; Turner, M.; Poulin, K.L.; De Repentigny, Y.; Burns, J.K.; Mcmillan, H.J.; Chardon, J.W.; Burger, D.; et al. Survival Motor Neuron Protein is Released from Cells in Exosomes: A Potential Biomarker for Spinal Muscular Atrophy OPEN. Sci. Rep. 2017, 7, 13859. [Google Scholar] [CrossRef]


© 2018 by the authors. Licensee MDPI, Basel, Switzerland. This article is an open access article distributed under the terms and conditions of the Creative Commons Attribution (CC BY) license (http://creativecommons.org/licenses/by/4.0/).
Share and Cite
Šoltić, D.; Bowerman, M.; Stock, J.; Shorrock, H.K.; Gillingwater, T.H.; Fuller, H.R. Multi-Study Proteomic and Bioinformatic Identification of Molecular Overlap between Amyotrophic Lateral Sclerosis (ALS) and Spinal Muscular Atrophy (SMA). Brain Sci. 2018, 8, 212. https://doi.org/10.3390/brainsci8120212
Šoltić D, Bowerman M, Stock J, Shorrock HK, Gillingwater TH, Fuller HR. Multi-Study Proteomic and Bioinformatic Identification of Molecular Overlap between Amyotrophic Lateral Sclerosis (ALS) and Spinal Muscular Atrophy (SMA). Brain Sciences. 2018; 8(12):212. https://doi.org/10.3390/brainsci8120212
Chicago/Turabian StyleŠoltić, Darija, Melissa Bowerman, Joanne Stock, Hannah K. Shorrock, Thomas H. Gillingwater, and Heidi R. Fuller. 2018. "Multi-Study Proteomic and Bioinformatic Identification of Molecular Overlap between Amyotrophic Lateral Sclerosis (ALS) and Spinal Muscular Atrophy (SMA)" Brain Sciences 8, no. 12: 212. https://doi.org/10.3390/brainsci8120212