Computer-Aided Diagnosis System of Alzheimer’s Disease Based on Multimodal Fusion: Tissue Quantification Based on the Hybrid Fuzzy-Genetic-Possibilistic Model and Discriminative Classification Based on the SVDD Model


Abstract
:1. Introduction
2. Related-Work
2.1. Related-Work to the MR Segmentation of Brain Regions
2.2. Related Work to Computer Aided-Diagnosis System of Alzheimer’s Disease
2.3. Discussion Related to CAD Systems of Alzheimer’s Disease
3. Study on Patients with Alzheimer’s Disease: Method and Experience
3.1. Preprocessing and Registration
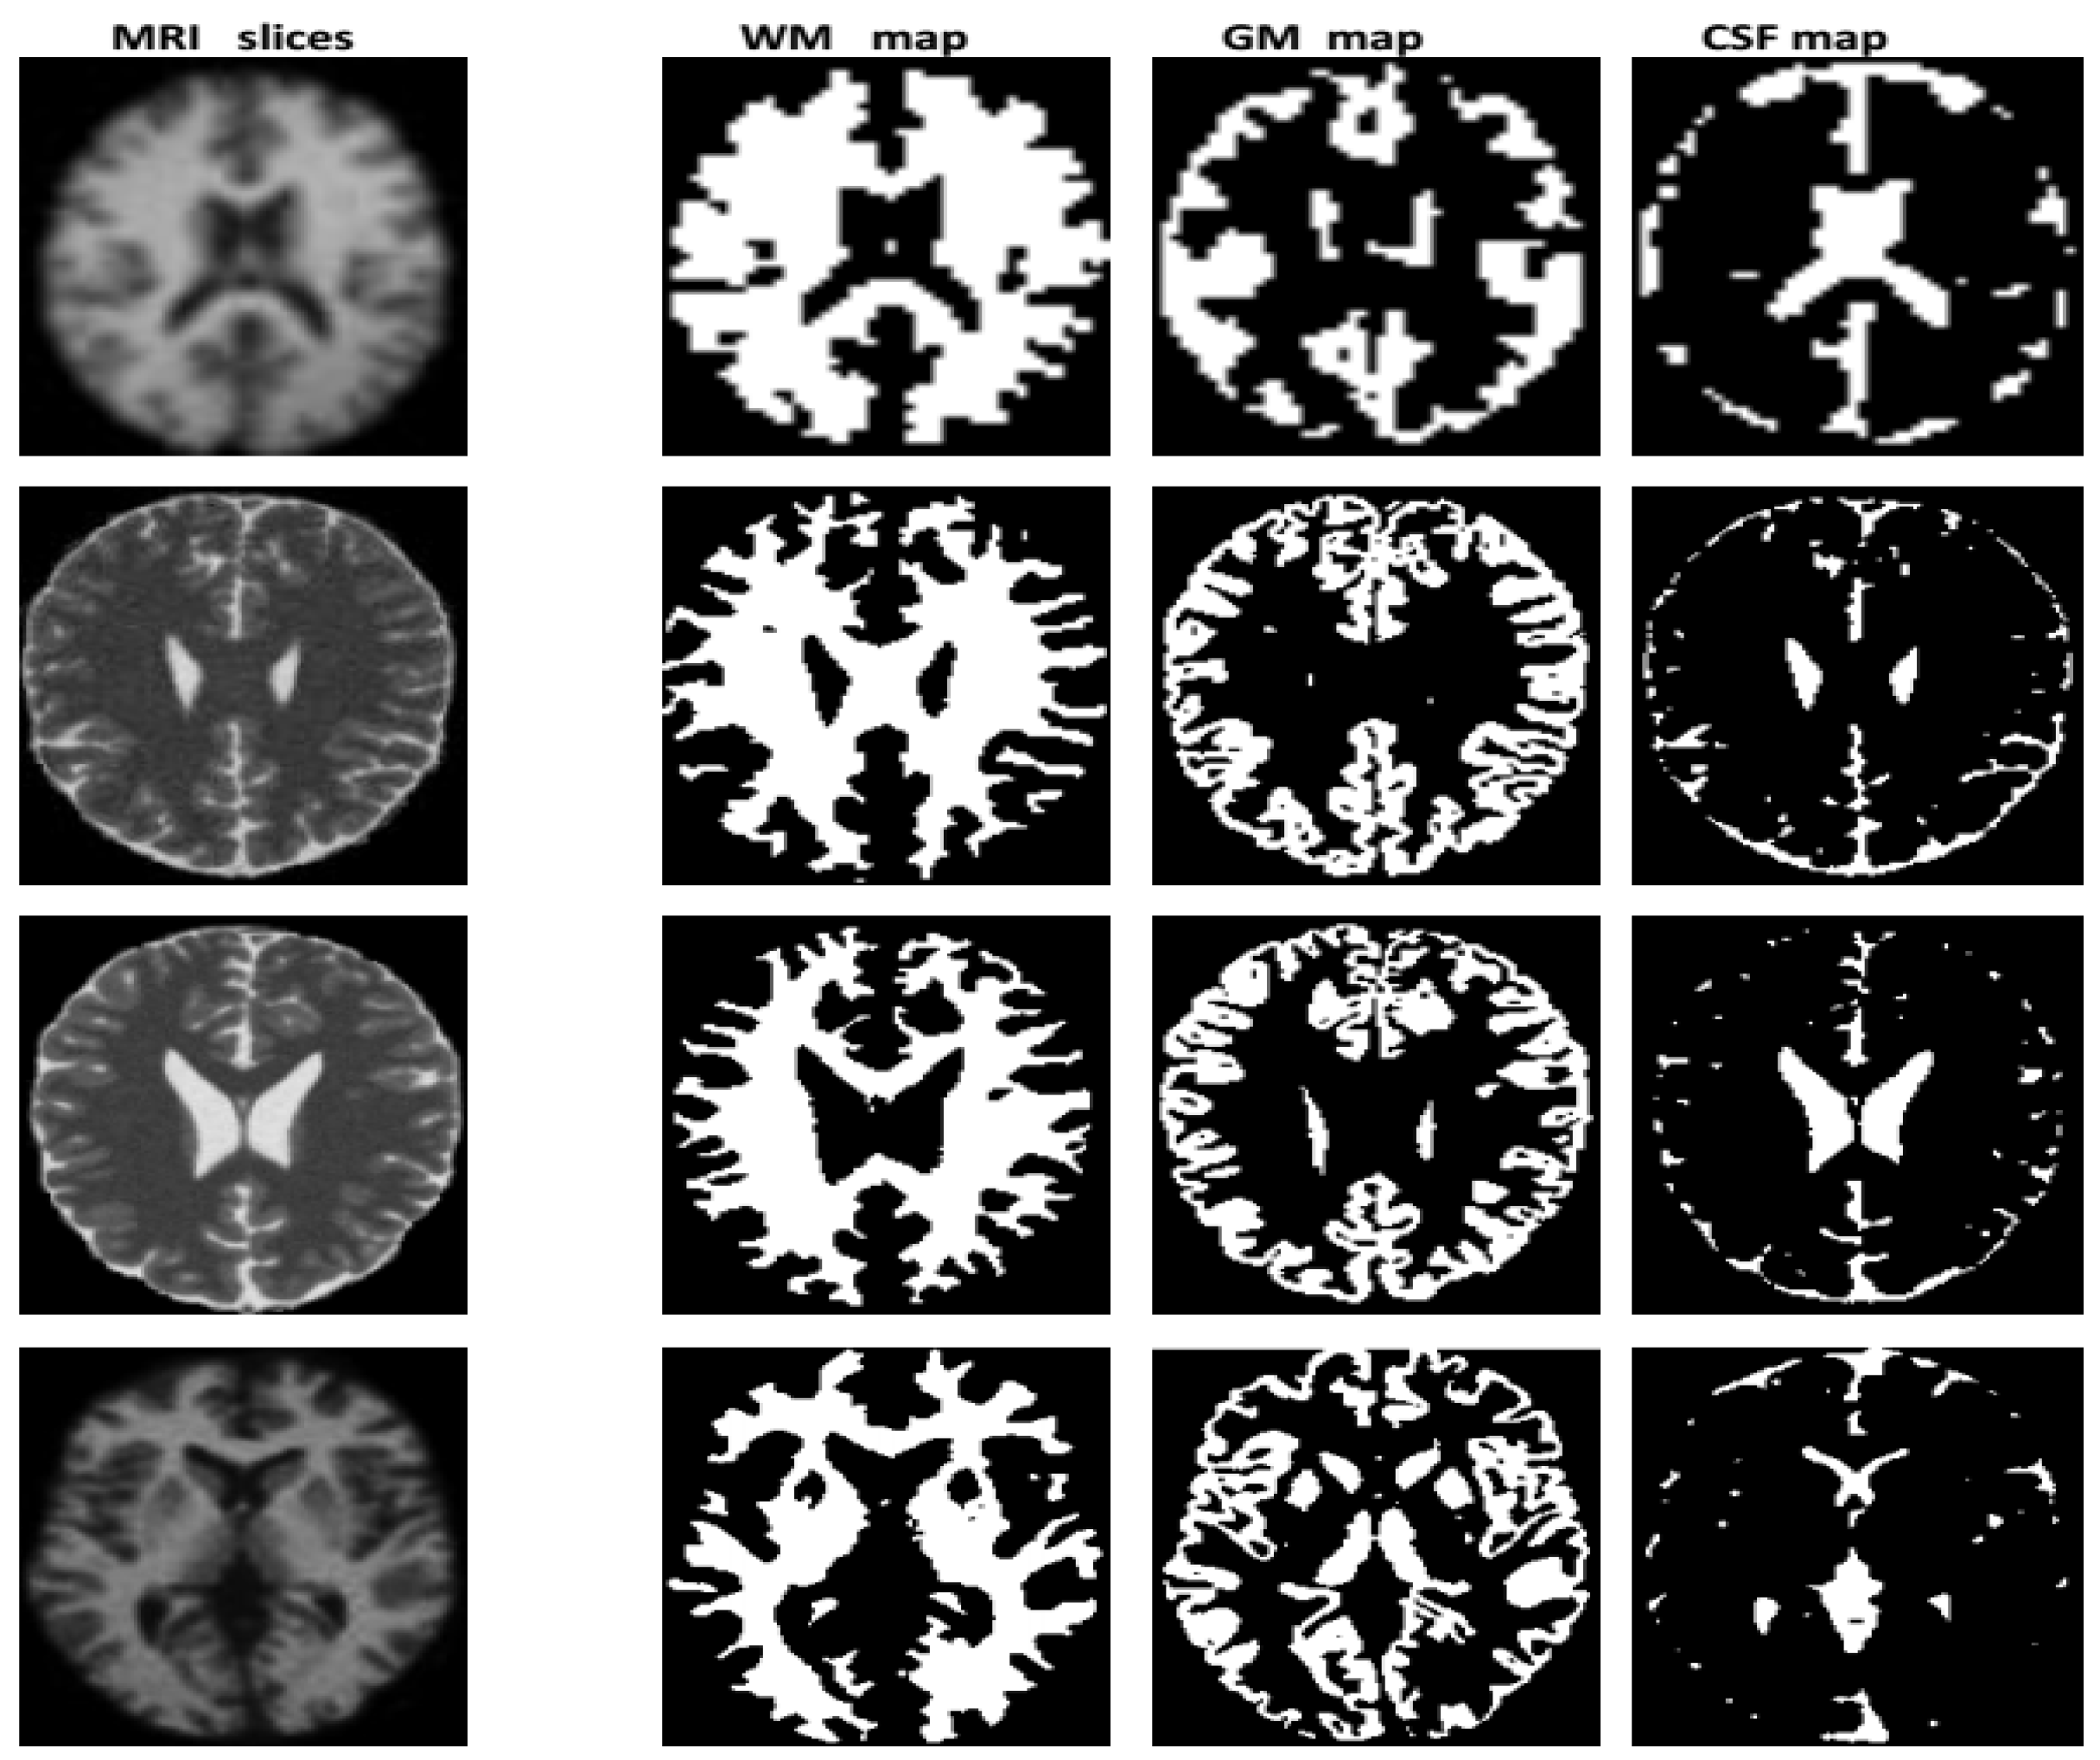
3.2. Segmentation
3.2.1. Modeling
Initialization by the Bias Corrected Fuzzy C-Means Algorithm
- B, the matrice of centroids and the center of cluster i (1 ≤ i ≤ C) with C, the number of cluster.
- X, the matrice of voxels vectors and xj (1 ≤ j ≤ N), the observed log-transformed intensities at the jth voxel.
- , the matrice of degrees of membership [] with m, a parameter controlling the degree of fuzzification.
- βj, the bias field value at the jth voxel, that helps in removing the inhomogeneity effect.
- Ni represents size of neighborhood to be considered. The neighborhood effect is controlled by the parameter α whose selection strongly affects the precision of the results.
- stands for set of neighbours that exists in a window around xj and is the cardinality of Ni.
| Algorithm 1: BCFCM Pseudo-Code |
Let the voxels set, the matrix of membership degrees and the matrix of cluster centers with m the degree of fuzzy and ε the threshold representing convergence error.
|
Optimization by the Genetic Algorithms
Modelization by Possibilistic Fuzzy C-Means Algorithm
| Algorithm 2: PFCM Pseudo-Code |
Let the vectors of voxels, the matrix of membership degrees, the matrix of typicality degrees, the matrix of cluster centers with m the degree of fuzzy and the degree of weight possibilistic.
|
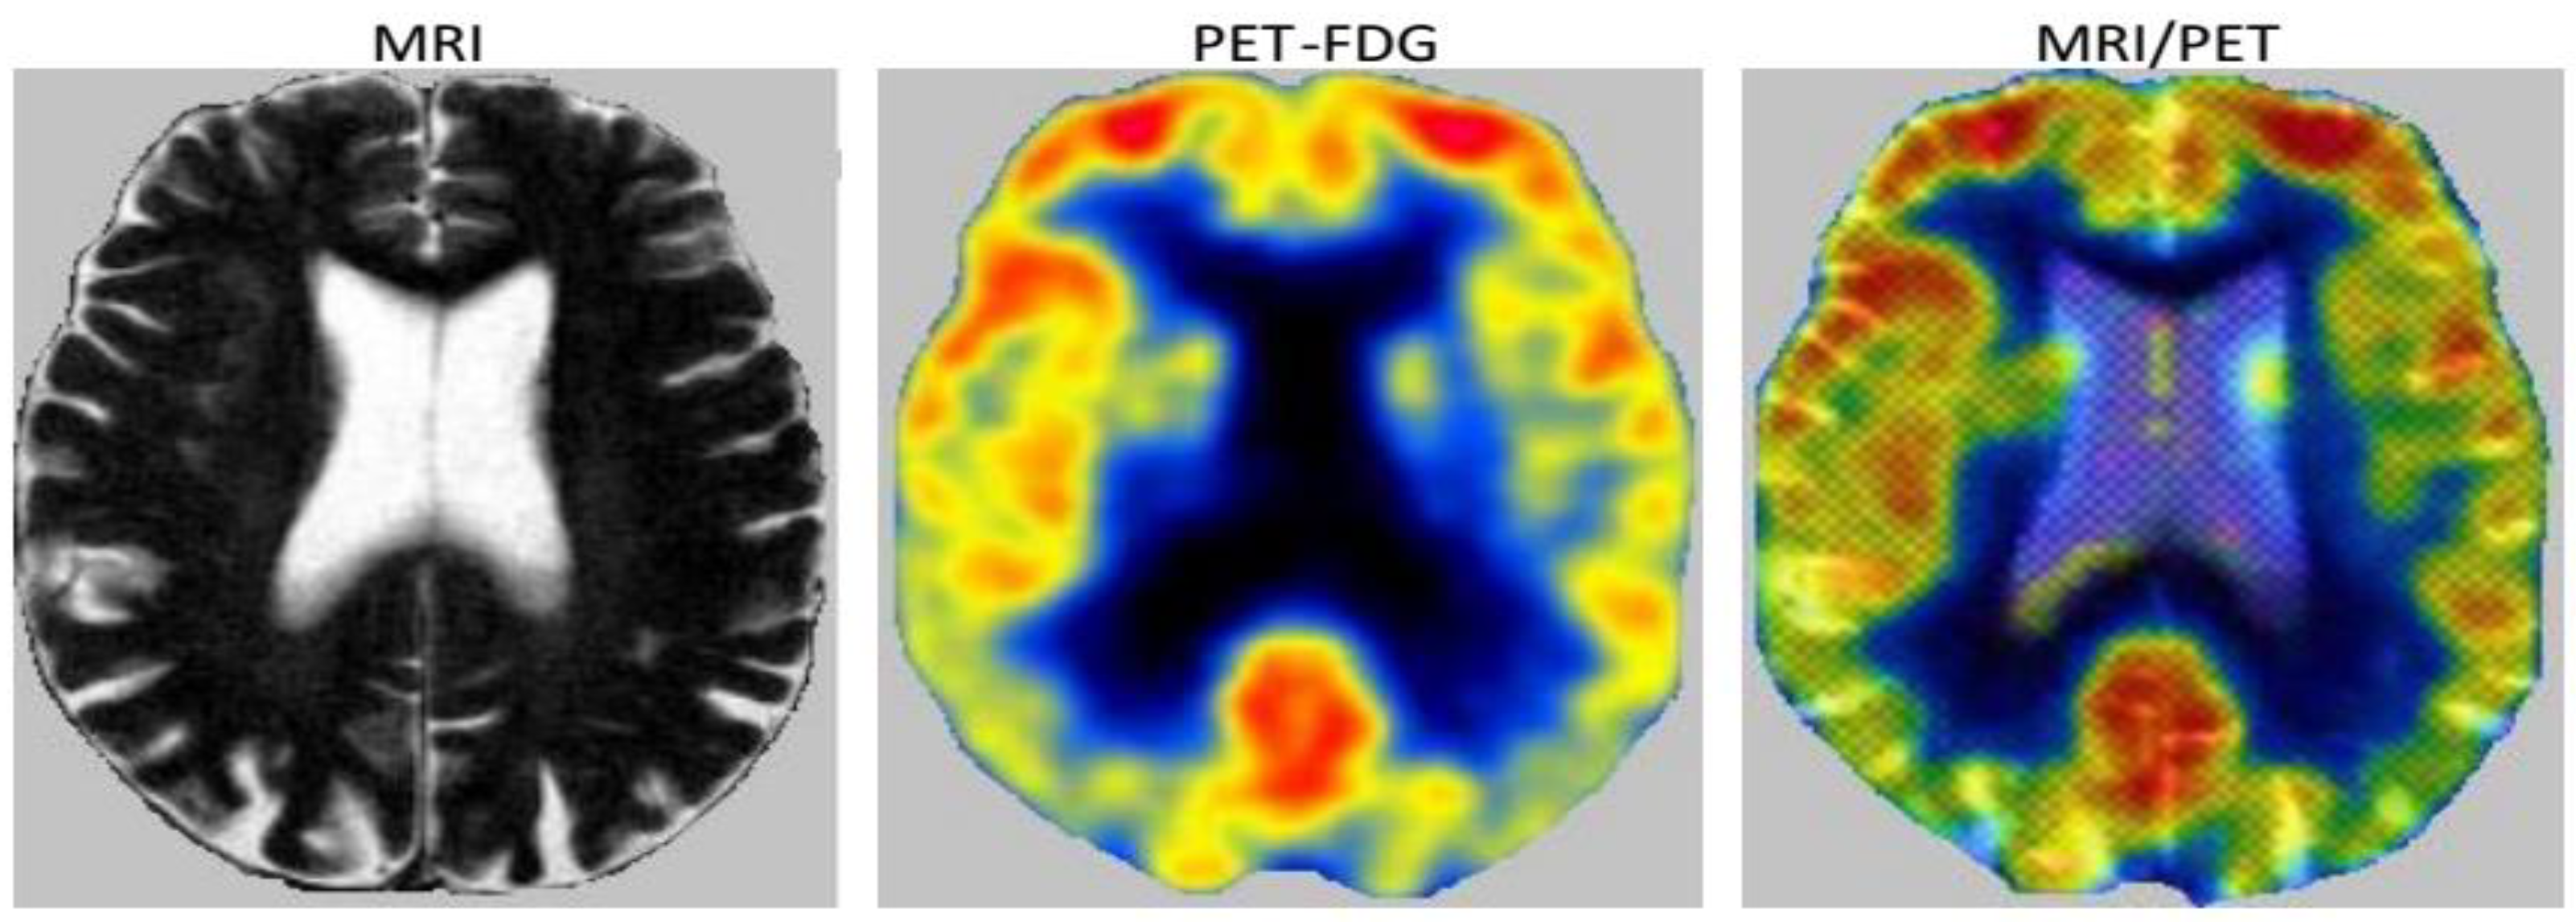
3.2.2. Fusion
3.2.3. Decision
Image Labeling
Synthetic Image
3.3. Classification
3.3.1. Principle of Operation of the SVDD
3.3.2. Adoption of the “Divide-and-Conquer” Strategy
3.3.3. Computational Complexity
4. Material, Quantitative Validation & Discussion
4.1. Information on Patients, Imaging Parameters and Acquisition
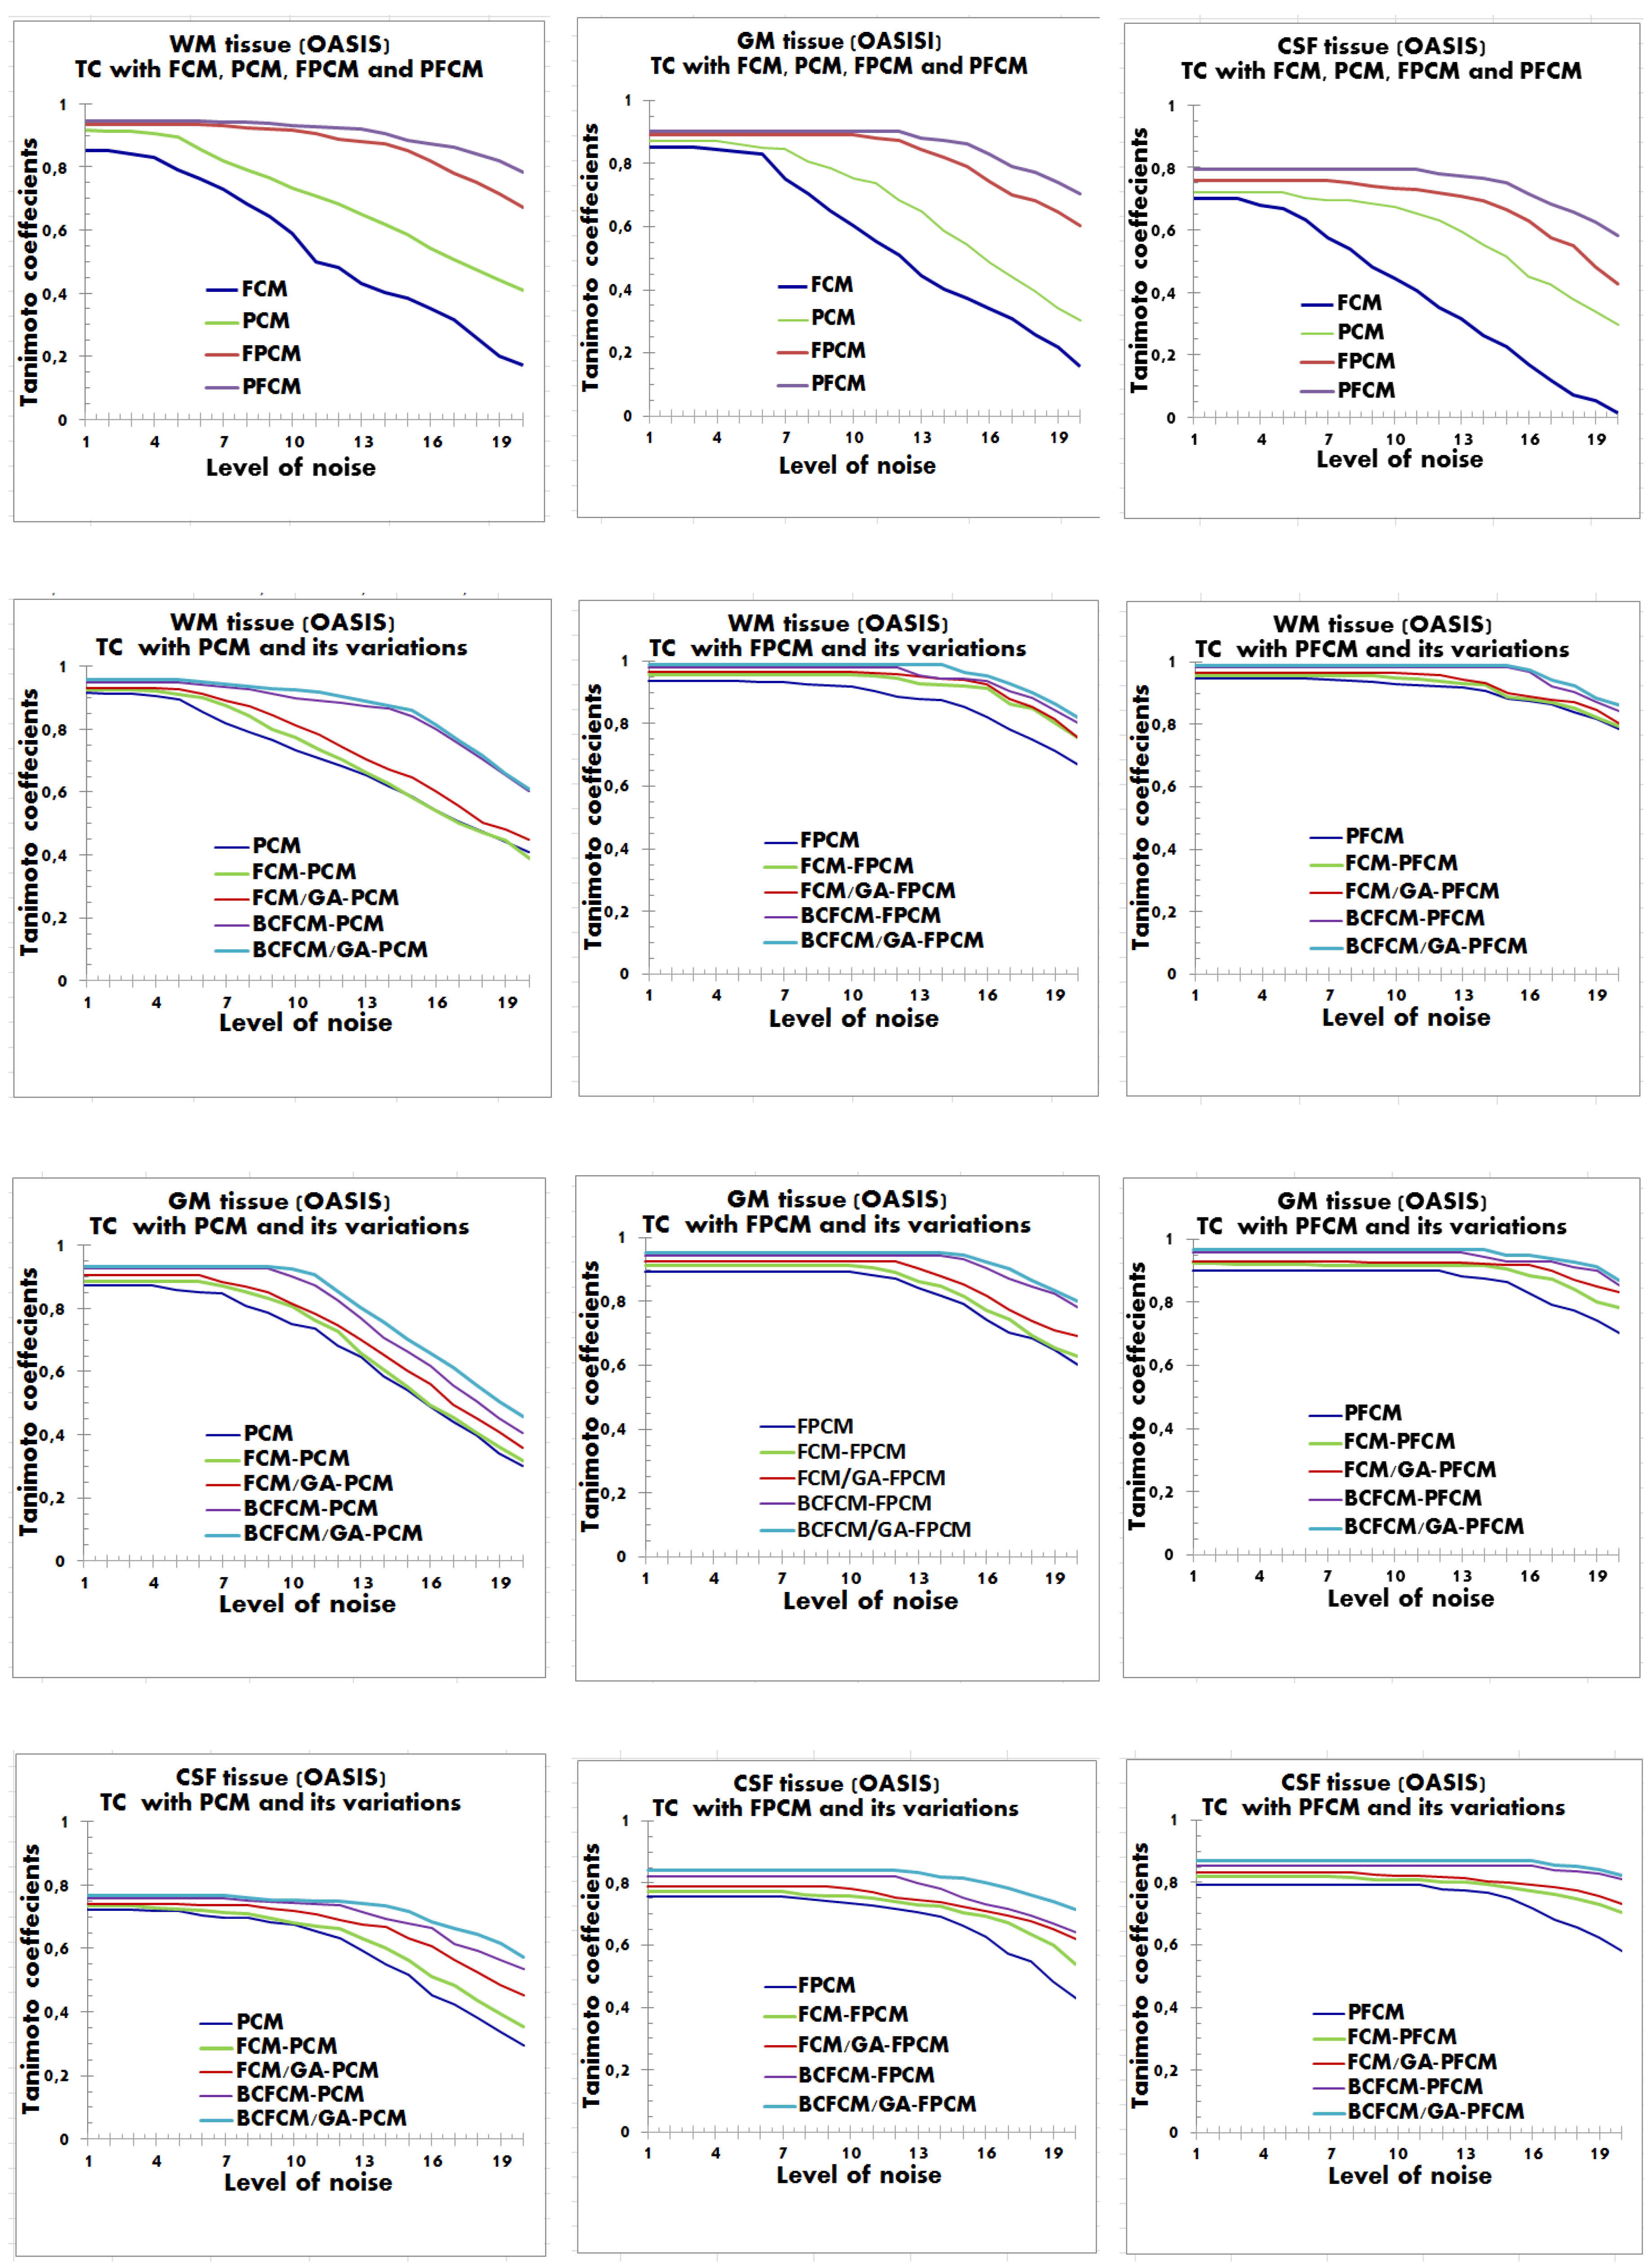
4.2. Performance Evaluation of the Segmentation
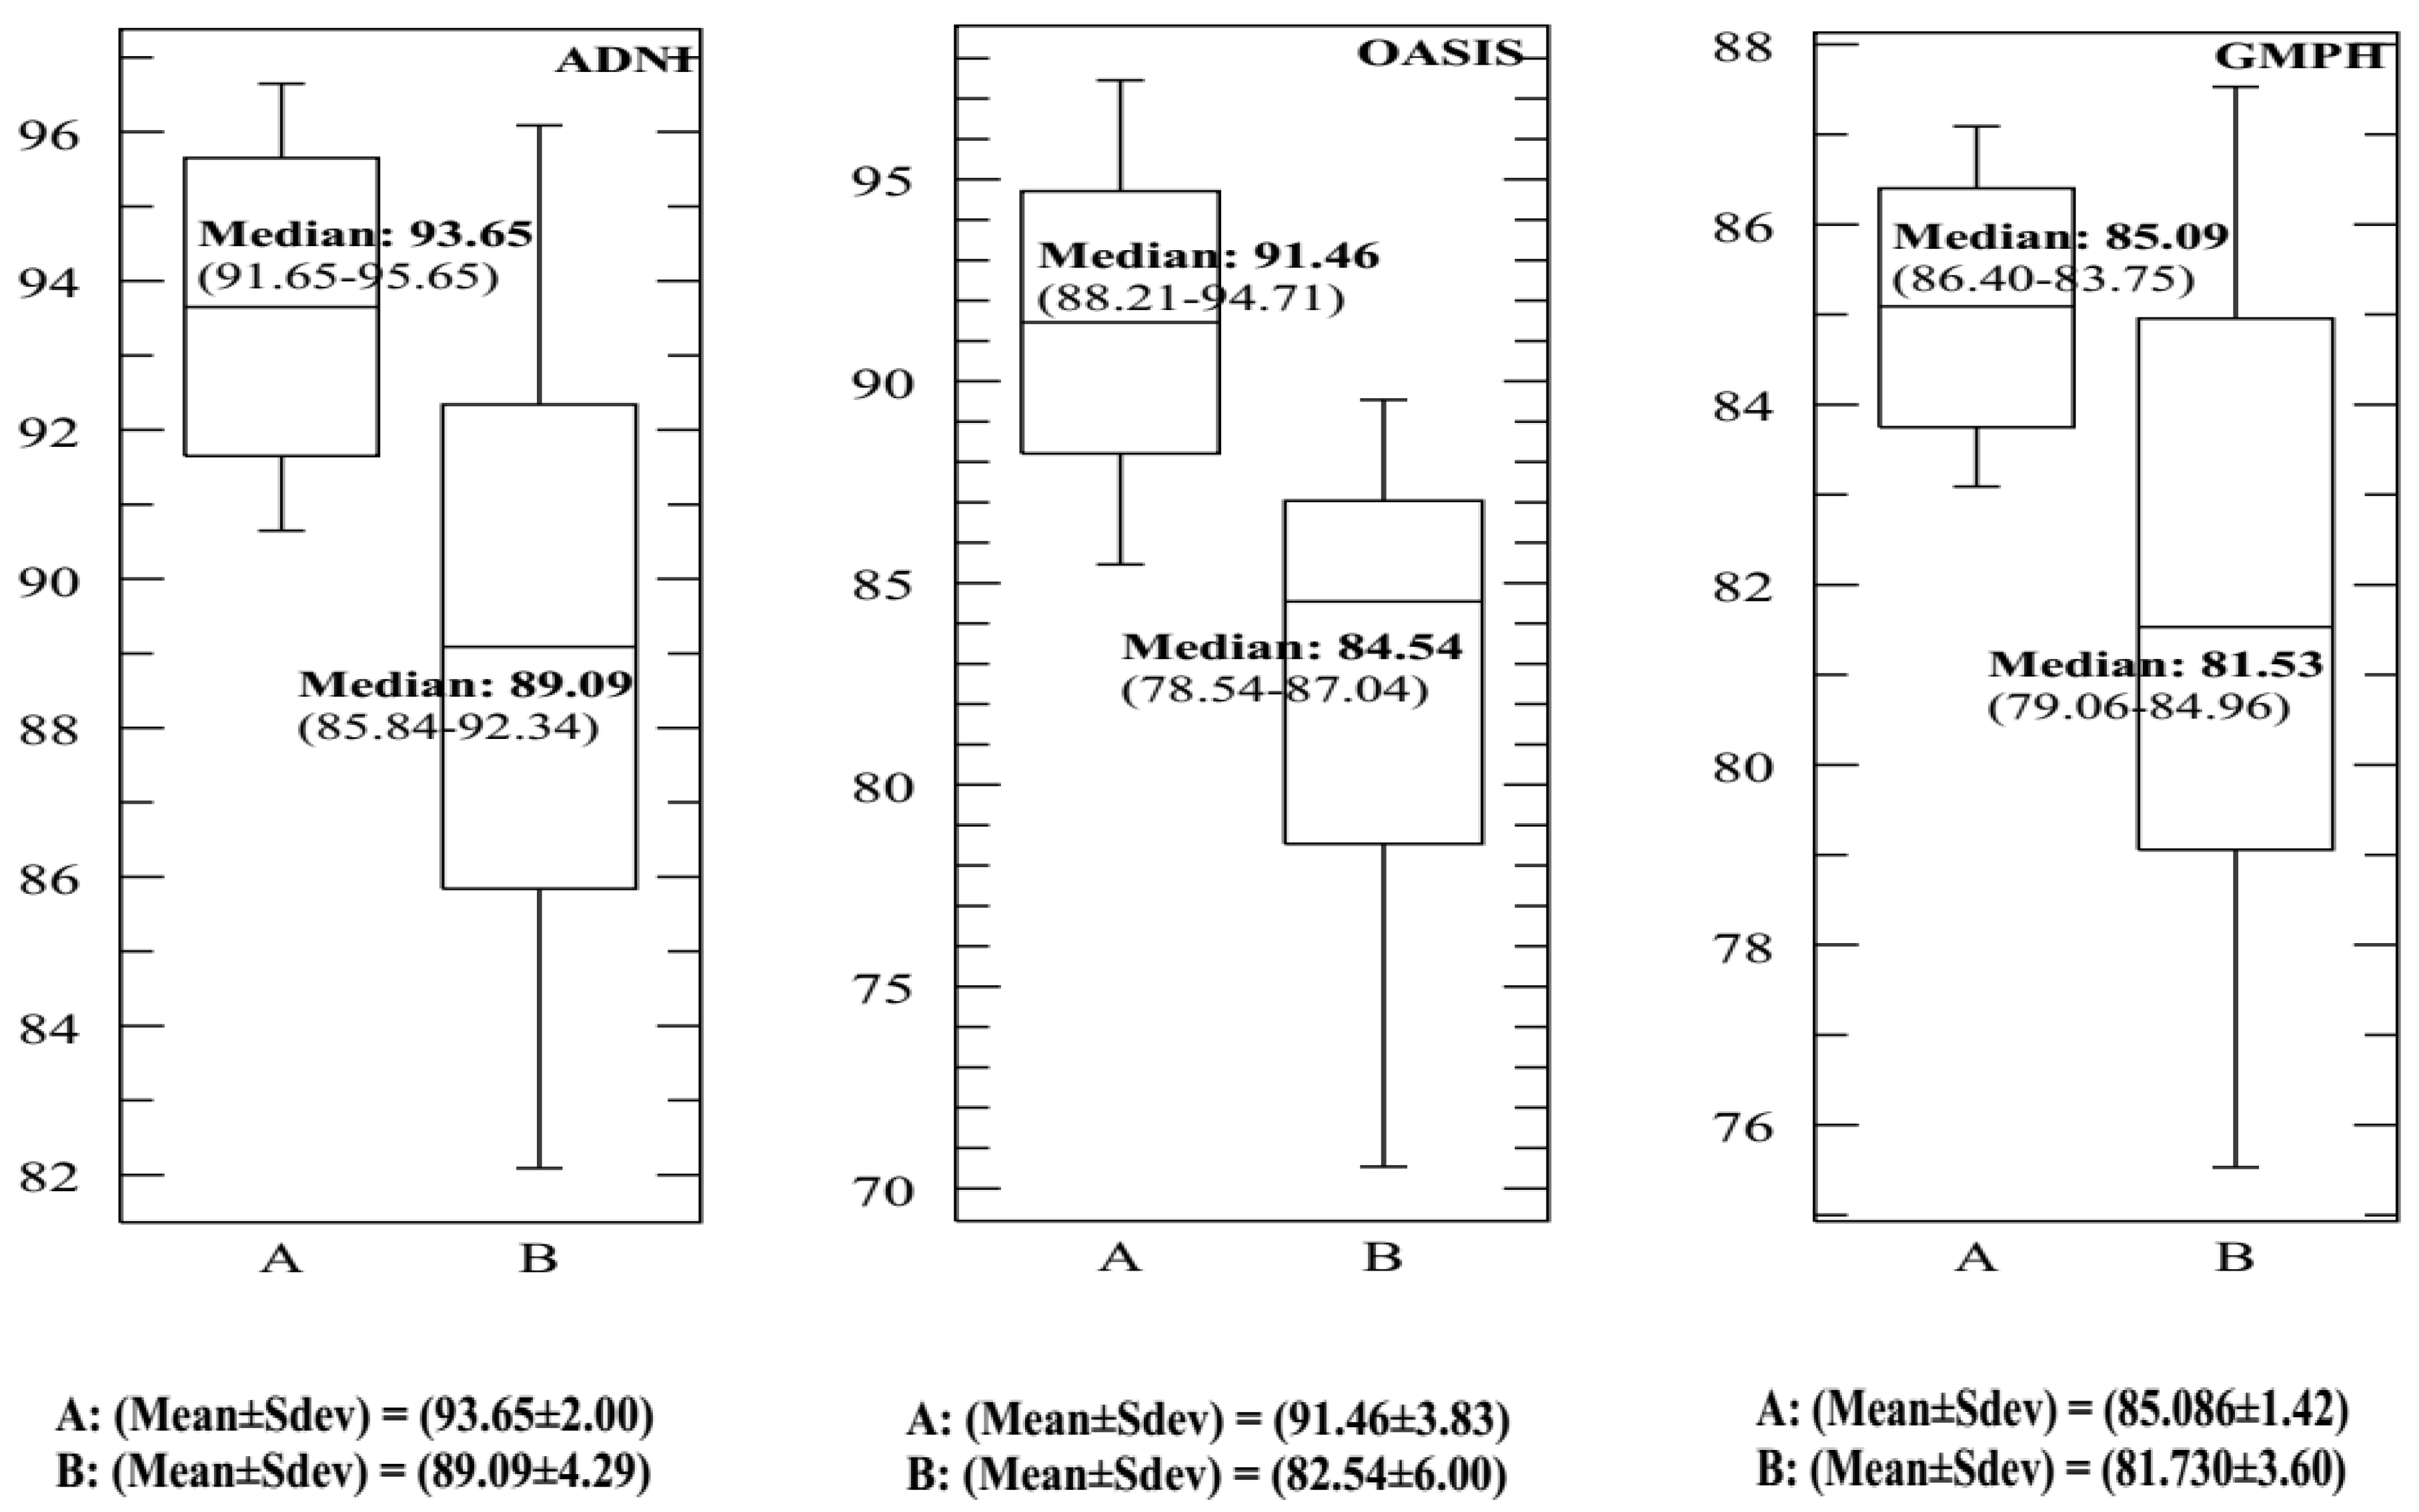
4.3. Performance Evaluation of the CAD System
5. Conclusions and Perspective
Author Contributions
Funding
Acknowledgments
Conflicts of Interest
References
- Patterson, C. World Alzheimer Report 2018 The state of the art of dementia research: New frontiers (Alzheimer’s Disease International (ADI)). 2018. Available online: https://www.alz.co.uk/news/world-alzheimer-report-2018-state-of-art-of-dementia-research-new-frontiers (accessed on 19 October 2018).
- Herrmann, N.; Harimoto, T.; Balshaw, R.; Lanctôt, K.L. Risk factors for progression of Alzheimer disease in a Canadian population: The Canadian outcomes study in dementia (COSID). Can. J. Psychiatry. Rev. Can. De Psychiatr. 2015, 60, 189–199. [Google Scholar] [CrossRef] [PubMed]
- Biagetti, G.; Crippa, P.; Falaschetti, L.; Luzzi, S.; Santarelli, R.; Turchetti, C. Classification of Alzheimer’s disease from structural magnetic resonance imaging using particle-bernstein polynomials algorithm. In Intelligent Decision Technologies; Czarnowski, I., Howlett, R.J., Jain, L.C., Eds.; Springer: Singapore, 2019; pp. 49–62. [Google Scholar]
- Karami, V.; Nittari, G.; Amenta, F. Neuroimaging computer-aided diagnosis systems for Alzheimer’s disease. Int. J. Imaging Syst. Technol. 2019, 29, 83–94. [Google Scholar] [CrossRef]
- Lazli, L.; Boukadoum, M.; Aït-Mohamed, O. Computer-aided diagnosis system for Alzheimer’s disease using fuzzy-possibilistic tissue segmentation and SVM classification. In Proceedings of the 2018 IEEE Life Sciences Conference (LSC), Montreal, QC, Canada, 28–30 October 2018; pp. 33–36. [Google Scholar]
- Islam, J.; Zhang, Y. A novel deep learning based multi-class classification method for Alzheimer’s disease detection using brain MRI data. In Proceedings of the Brain Informatics: International Conference, BI 2017, Beijing, China, 16–18 November 2017; pp. 213–222. [Google Scholar] [CrossRef]
- Alvarez Fernandez, I.; Aguilar, M.; Manuel González, J.; Ysamat, M.; Lorenzo-Bosquet, C.; Alonso, A.; Pablo, T.J.; Silvia, R.; Monica, D.-F.; Maria, C.; et al. Clinic-based validation of cerebrospinal fluid biomarkers with florbetapir PET for diagnosis of dementia. J. Alzheimer. Dis. 2018, 61, 135–143. [Google Scholar] [CrossRef] [PubMed]
- Dessouky, M.M.; Elrashidy, M.A.; Taha, T.E.; Abdelkader, H.M. Computer-aided diagnosis system for Alzheimer’s disease using different discrete transform techniques. Am. J. Alzheimer Dis. Other Dement. 2016, 31, 282–293. [Google Scholar] [CrossRef] [PubMed]
- Khedher, L.; Illán, I.A.; Górriz, J.M.; Ramírez, J.; Brahim, A.; Meyer-Baese, A. Independent component analysis-support vector machine-based computer-aided diagnosis system for Alzheimer’s with visual support. Int. J. Neural Syst. 2016, 27, 1650050. [Google Scholar] [CrossRef] [PubMed]
- Hua, X.; Hibar, D.P.; Ching, C.R.K.; Boyle, C.P.; Rajagopalan, P.; Gutman, B.A.; Leow, A.D.; Toga, A.W.; Jack, C.R., Jr.; Harvey, D.; et al. Unbiased tensor-based morphometry: Improved robustness and sample size estimates for Alzheimer’s disease clinical trials. NeuroImage 2013, 66, 648–661. [Google Scholar] [CrossRef] [PubMed]
- Dubois, D.; Prade, H. Possibility theory. In Encyclopedia of Complexity and Systems Science; Meyers, R.A., Ed.; Springer: New York, NY, USA, 2009; pp. 6927–6939. [Google Scholar] [CrossRef]
- Dubois, D.; Prade, H. Possibility theory and its applications: Where do we stand. In Springer Handbook of Computational Intelligence; Kacprzyk, J., Pedrycz, W., Eds.; Springer: Berlin/Heidelberg, Germany, 2015; pp. 31–60. [Google Scholar] [CrossRef]
- Pal, N.R.; Pal, K.; Keller, J.M.; Bezdek, J.C. A possibilistic fuzzy c-means clustering algorithm. IEEE Trans. Fuzzy Syst. 2005, 13, 517–530. [Google Scholar] [CrossRef]
- Ahmed, M.N.; Yamany, S.M.; Mohamed, N.; Farag, A.A.; Moriarty, T. A modified fuzzy c-means algorithm for bias field estimation and segmentation of MRI data. IEEE Trans. Med Imaging 2002, 21, 193–199. [Google Scholar] [CrossRef]
- Goldberg, D.E.; Corruble, V. Algorithmes Génétiques: Exploration, Optimisation et Apprentissage Automatique; Addison-Wesley France: Paris, France, 1996. [Google Scholar]
- Lazli, L.; Boukadoum, M.; Aït-Mohamed, O. Hybrid possibilistic-genetic technique for assessment of brain tissues volume: Case study for Alzheimer patients images clustering. In Proceedings of the 2017 18th IEEE/ACIS International Conference on Software Engineering, Artificial Intelligence, Networking and Parallel/Distributed Computing (SNPD), Kanazawa, Japan, 26–28 June 2017; pp. 143–147. [Google Scholar] [CrossRef]
- Tax, D.M.J.; Duin, R.P.W. Support vector data description. Mach. Learn. 2004, 54, 45–66. [Google Scholar] [CrossRef]
- Pauwels, E.; Ambekar, O. One class classification for anomaly detection: Support vector data description revisited. In Proceedings of the Advances in Data Mining. Applications and Theoretical Aspects, New York, NY, USA, 30 August–3 September 2011. [Google Scholar] [CrossRef]
- Liu, Y.-H.; Ting, Y.; Shyu, S.-S.; Chen, C.-K.; Lee, C.-L.; Jeng, M.-D. A support vector data description committee for face detection. Math. Probl. Eng. 2014, 2014, 478482. [Google Scholar] [CrossRef]
- Jiang, H.; Wang, H.; Hu, W.; Kakde, D.; Chaudhuri, A. Fast Incremental SVDD Learning Algorithm with the Gaussian Kernel. 2017. Available online: https://ui.adsabs.harvard.edu/abs/2017arXiv170900139J/abstract (accessed on 25 March 2019).
- Uslu, F.S.; Binol, H.; Ilarslan, M.; Bal, A. Improving SVDD classification performance on hyperspectral images via correlation based ensemble technique. Opt. Lasers Eng. 2017, 89, 169–177. [Google Scholar] [CrossRef]
- Liao, Y.; Kakde, D.; Chaudhuri, A.; Jiang, H.; Sadek, C.; Kong, S. A new bandwidth selection criterion for analyzing hyperspectral data using SVDD. In Proceedings of the Proc. SPIE 10644, Algorithms and Technologies for Multispectral, Hyperspectral, and Ultraspectral Imagery XXIV, 106441M, Orlando, FL, USA, 15–19 April 2018. [Google Scholar] [CrossRef]
- Sohrab, F.; Raitoharju, J.; Gabbouj, M.; Iosifidis, A. Subspace support vector data description. In Proceedings of the 2018 24th International Conference on Pattern Recognition (ICPR), Beijing, China, 20–24 August 2018; pp. 722–727. [Google Scholar] [CrossRef]
- Xie, W.; Liang, G.; Guo, Q. A new improved FSVM algorithm based on SVDD. Concurr. Comput. Pract. Exp. 2019, 31, e4893. [Google Scholar] [CrossRef]
- Shawe-Taylor, D.C.S.R.H.J.; Shawe-Taylor, J.; Cristianini, N. Kernel Methods for Pattern Analysis; Cambridge University Press: Cambridge, UK, 2004. [Google Scholar]
- Bezdek, J.C.; Hall, L.O.; Clarke, L.P. Review of MR image segmentation techniques using pattern recognition. Med Phys. 1993, 20, 1033–1048. [Google Scholar] [CrossRef] [PubMed]
- Bowman, F.D. Brain imaging analysis. Annu. Rev. Stat. Appl. 2014, 1, 61–85. [Google Scholar] [CrossRef] [PubMed]
- Ismail, M.; Soliman, A.; Ghazal, M.; Switala, A.E.; Gimel’farb, G.; Barnes, G.N.; Khalil, A.; El-Baz, A. A fast stochastic framework for automatic MR brain images segmentation. PLoS ONE 2017, 12, e0187391. [Google Scholar] [CrossRef]
- Khalid, N.E.A.; Ibrahim, S.; Haniff, P.N.M.M. MRI Brain abnormalities segmentation using K-nearest neighbors (k-NN). Int. J. Comput. Sci. Eng. (IJCSE) 2011, 3, 980–990. [Google Scholar]
- Steenwijk, M.D.; Pouwels, P.J.W.; Daams, M.; van Dalen, J.W.; Caan, M.W.A.; Richard, E.; Barkhof, F.; Vrenken, H. Accurate white matter lesion segmentation by k nearest neighbor classification with tissue type priors (kNN-TTPs). Neuroimage Clin. 2013, 3, 462–469. [Google Scholar] [CrossRef] [Green Version]
- Havaei, M.; Jodoin, P.; Larochelle, H. Efficient interactive brain tumor segmentation as within-brain kNN classification. In Proceedings of the 2014 22nd International Conference on Pattern Recognition, Stockholm, Sweden, 24–28 August 2014; pp. 556–561. [Google Scholar] [CrossRef]
- Moeskops, P.; Viergever, M.A.; Mendrik, A.M.; De Vries, L.S.; Benders, M.J.N.L.; Išgum, I. Automatic segmentation of MR brain images with a convolutional neural network. IEEE Trans. Med Imaging 2016, 35, 1252–1261. [Google Scholar] [CrossRef]
- Akkus, Z.; Galimzianova, A.; Hoogi, A.; Rubin, D.L.; Erickson, B.J. Deep learning for brain MRI segmentation: State of the art and future directions. J. Digit. Imaging 2017, 30, 449–459. [Google Scholar] [CrossRef]
- Mittal, M.; Goyal, L.M.; Kaur, S.; Kaur, I.; Verma, A.; Jude Hemanth, D. Deep learning based enhanced tumor segmentation approach for MR brain images. Appl. Soft Comput. 2019, 78, 346–354. [Google Scholar] [CrossRef]
- Bezdek, J.C.; Hall, L.O.; Clark, M.C.; Goldgof, D.B.; Clarke, L.P. Medical image analysis with fuzzy models. Stat. Methods Med Res. 1997, 6, 191–214. [Google Scholar] [CrossRef] [PubMed]
- Wang, J.; Kong, J.; Lu, Y.; Qi, M.; Zhang, B. A modified FCM algorithm for MRI brain image segmentation using both local and non-local spatial constraints. Comput. Med Imaging Graph. 2008, 32, 685–698. [Google Scholar] [CrossRef] [PubMed]
- Shen, S.; Sandham, W.; Granat, M.; Sterr, A. MRI fuzzy segmentation of brain tissue using neighborhood attraction with neural-network optimization. IEEE Trans. Inf. 2005, 9, 459–467. [Google Scholar] [CrossRef]
- Szilagyi, L.; Benyo, Z.; Szilagyi, S.M.; Adam, H.S. MR brain image segmentation using an enhanced fuzzy C-means algorithm. In Proceedings of the 25th Annual International Conference of the IEEE Engineering in Medicine and Biology Society (IEEE Cat. No.03CH37439), Cancun, Mexico, 17–21 September 2003; Volume 1, pp. 724–726. [Google Scholar] [CrossRef]
- Zhang, D.-Q.; Chen, S.-C. A novel kernelized fuzzy C-means algorithm with application in medical image segmentation. Atificial Intell. Med. China 2004, 32, 37–50. [Google Scholar] [CrossRef] [PubMed] [Green Version]
- Chuang, K.-S.; Tzeng, H.-L.; Chen, S.; Wu, J.; Chen, T.-J. Fuzzy c-means clustering with spatial information for image segmentation. Comput. Med Imaging Graph. 2006, 30, 9–15. [Google Scholar] [CrossRef] [Green Version]
- Cai, W.; Chen, S.; Zhang, D. Fast and robust fuzzy c-means clustering algorithms incorporating local information for image segmentation. Pattern Recognit. 2007, 40, 825–838. [Google Scholar] [CrossRef] [Green Version]
- Sikka, K.; Sinha, N.; Singh, P.; Mishra, A. A fully automated algorithm under modified FCM framework for improved brain MR image segmentation. Magn. Reson. Imaging 2009, 27, 994–1004. [Google Scholar] [CrossRef]
- Krishnapuram, R.; Keller, J.M. A possibilistic approach to clustering. IEEE Trans. Fuzzy Syst. 1993, 1, 98–110. [Google Scholar] [CrossRef]
- Barni, M.; Cappellini, V.; Mecocci, A. A possibilistic approach to clustering—Comments. IEEE Trans. Fuzzy Syst. 1996, 4, 393–396. [Google Scholar] [CrossRef]
- Huang, C.-H.; Lee, J.-D. Improving MMI with enhanced-FCM for the fusion of brain MR and SPECT images. In Proceedings of the 17th International Conference on Pattern Recognition, Cambridge, UK, 26 August 2004; Volume 3, pp. 562–565. [Google Scholar] [CrossRef]
- Hinrichs, C.; Singh, V.; Xu, G.; Johnson, S. MKL for robust multi-modality AD classification. In Proceedings of the International Conference on Medical Image Computing and Computer-Assisted Intervention, London, UK, 20–24 September 2009; Volume 12, pp. 786–794. [Google Scholar] [CrossRef]
- López, M.; Ramírez, J.; Górriz, J.M.; Álvarez, I.; Salas-Gonzalez, D.; Segovia, F.; Gómez-Río, M. Principal component analysis-based techniques and supervised classification schemes for the early detection of Alzheimer’s disease. In Proceedings of the 3rd International Work-Conference on the Interplay between Natural and Artificial Computation (IWINAC), Almería, Spain, 3–7 June 2009. [Google Scholar]
- Daliri, M.R. Automated diagnosis of Alzheimer disease using the scale-invariant feature transforms in magnetic resonance images. J. Med Syst. 2012, 36, 995–1000. [Google Scholar] [CrossRef]
- Bhavana, V.; Krishnappa, H.K. Multi-modality medical image fusion using discrete wavelet transform. Procedia Comput. Sci. 2015, 70, 625–631. [Google Scholar] [CrossRef]
- Zhang, D.; Wang, Y.; Zhou, L.; Yuan, H.; Shen, D. Multimodal classification of Alzheimer’s disease and mild cognitive impairment. NeuroImage 2011, 55, 856–867. [Google Scholar] [CrossRef] [PubMed]
- Huang, S.; Li, J.; Ye, J.; Chen, K.; Wu, T.; Fleisher, A.; Reiman, E. Identifying Alzheimer’s disease-related brain regions from multi-modality neuroimaging data using sparse composite linear discrimination analysis. In Proceedings of the Advances in Neural Information Processing Systems 24: 25th Annual Conference on Neural Information Processing Systems, NIPS, Granada, Spain, 12–14 December 2011. [Google Scholar]
- Gray, K.R.; Aljabar, P.; Heckemann, R.A.; Hammers, A.; Rueckert, D. Random forest-based similarity measures for multi-modal classification of Alzheimer’s disease. NeuroImage 2013, 65, 167–175. [Google Scholar] [CrossRef] [PubMed]
- Liu, F.; Wee, C.-Y.; Chen, H.; Shen, D. Inter-modality relationship constrained multi-modality multi-task feature selection for Alzheimer’s Disease and mild cognitive impairment identification. NeuroImage 2014, 84, 466–475. [Google Scholar] [CrossRef] [PubMed]
- Cheng, D.; Liu, M. CNNs based multi-modality classification for AD diagnosis. In Proceedings of the 2017 10th International Congress on Image and Signal Processing, BioMedical Engineering and Informatics (CISP-BMEI), Shanghai, China, 14–16 October 2017; pp. 1–5. [Google Scholar] [CrossRef]
- Smith, S.M. Fast robust automated brain extraction. Hum. Brain Mapp. 2002, 17, 143–155. [Google Scholar] [CrossRef] [PubMed]
- spm8. Available online: https://www.fil.ion.ucl.ac.uk/spm/software/spm8/ (accessed on 19 February 2018).
- N3. Available online: http://www.bic.mni.mcgill.ca/software/N3/ (accessed on 28 January 2017).
- Barra, V.; Boire, J. Tissue characterization on MR images by a possibilistic clustering on a 3D wavelet representation. J. Magn. Reson. Imaging 2000, 11, 267–278. [Google Scholar] [CrossRef]
- Fusionviewer. Available online: http://www.kgbtechnologies.com/fusionviewer (accessed on 28 March 2019).
- Adni. Available online: http://adni.loni.usc.edu/ (accessed on 4 April 2017).
- Oasis. Available online: www.oasis-brains.org (accessed on 9 June 2019).
- Marcus, D.S.; Wang, T.H.; Parker, J.; Csernansky, J.G.; Morris, J.C.; Buckner, R.L. Open access series of imaging studies (OASIS): Cross-sectional MRI data in young, middle aged, nondemented, and demented older adults. J. Cogn. Neurosci. 2007, 19, 1498–1507. [Google Scholar] [CrossRef]
- ADNI_Acknowledgement_List. Available online: http://adni.loni.usc.edu/wp-content/uploads/how_to_apply/ADNI_Acknowledgement_List.pdf (accessed on 28 May 2017).


| Characteristics of Patients | ||||||
| ADNI [60] | OASIS [61] | GMPH | ||||
| AD | Healthy | AD | Healthy | AD | Healthy | |
| Nb. patients | 77 | 82 | 100 | 98 | 5 | - |
| Woman/Man | 42/35 | 42/40 | 104/94 | 2/3 | - | |
| Age | 75.4 ± 7.1 | 75.3 ± 5.2 | 70.17 (42.5–91.7) | 71–86 | - | |
| Education | 14.9 ± 3.4 | 15.6 ± 3.2 | 15.2 ± 2.7 (8–23) | - | - | |
| MMSE (base) | 23.8 ± 1.9 | 29.0 ± 1.2 | 29.1 ± 0.8 (27–30) | - | - | |
| MMSE (2 years) | 19.3 ± 5.6 | 29.0 ± 1.3 | - | - | - | - |
| ADAS-Cog (b) | 18.3 ± 6.1 | 7.3 ± 3.3 | - | - | - | - |
| ADAS-Cog (2 y) | 27.3 ± 11.7 | 6.3 ± 3.5 | - | - | - | - |
| Characteristics of the images (MRI/PET) | ||||||
| ADNI | OASIS | GMPH | ||||
| AD | Healthy | AD | Healthy | AD | Healthy | |
| RF (%) | 20 | 20 | 20 | 20 | 20 | - |
| ST (mm) | 1, 3, 5 | 1, 3, 5 | 1, 3, 5 | 1, 3, 5 | 1, 3, 5 | - |
| SNR (%) | 1–20 | 1–20 | 1–20 | 1–20 | 1–20 | - |
| Nb. slices | 20 | 20 | 4 | 4 | 64 | - |
| Nb. volumes | 60 | 60 | 60 | 60 | 60 | - |
| Nb. total | 92,400 | 98,400 | 24,000 | 23,520 | 19,200 | - |
| ADNI (AC%, SE%, SP%) | |||||||||
| (σ, C) | C = 0.004 | C = 0.05 | C = 0.00625 | C = 0.125 | C = 0.15 | C = 0.25 | C = 0.35 | C = 0.45 | C = 0.5 |
| σ = 0 | 90.15 89.21 81.04 | 89.24 88.39 80.99 | 89.01 87.74 80.12 | 88.41 87.13 79.59 | 88.05 86.75 79.03 | 87.65 86.36 78.51 | 87.04 86.04 78.08 | 86.38 85.72 77.38 | 86.02 85.07 77.52 |
| σ = 0.5 | 93.65 91.46 85.09 | 93.15 91.03 84.64 | 93.01 89.57 84.03 | 92.47 89.07 83.56 | 92.29 88.46 83.29 | 92.03 88.03 83.01 | 91.83 87.86 82.46 | 91.42 87.53 82.39 | 91.05 87.02 82.00 |
| OASIS (AC%, SE%, SP%) | |||||||||
| σ = 0 | 88.54 88.35 87.00 | 88.35 88.14 86.75 | 88.02 88.02 86.24 | 87.61 87.75 86.00 | 87.34 87.25 85.61 | 87.01 87 85.23 | 86.82 86.84 84.99 | 86.41 86.36 84.76 | 86.04 86.14 84.51 |
| σ = 0.5 | 90.34 91.35 91.06 | 90.86 91.01 91.35 | 91.46 92.00 91.78 | 90.06 90.65 90.54 | 89.48 90.24 90.00 | 89.02 90.03 87.89 | 89 89.82 87.26 | 88.89 89.07 87.03 | 88.55 89 87.00 |
| GMPH (AC%, SE%, SP%) | |||||||||
| σ = 0 | 85.09 86.14 84.92 | 85.09 86.14 84.92 | 85.09 86.14 84.92 | 85.09 86.14 84.92 | 85.09 86.14 84.92 | 85.09 86.14 84.92 | 85.09 86.14 84.92 | 85.09 86.14 84.92 | 85.09 86.14 84.92 |
| σ = 0.5 | 84.58 86.00 84.07 | 85.09 86.14 84.92 | 83.85 85.65 83.53 | 83.02 85.07 83.08 | 84.36 84.62 82.14 | 83.84 84.02 81.73 | 83.19 83.72 81.27 | 83 83.38 80.74 | 82.47 83.07 80.44 |
| Reference | Classification | Segmentation | Data | Modality | Nb. Patients | SNR (%) | AC (%) | SE (%) | SP (%) | AUC | EER (%) |
|---|---|---|---|---|---|---|---|---|---|---|---|
| This study | SVDD (RBF) 10-FCV | BCFCM/GA /PFCM | ADNI | MRI/PET | 159 (77 AD, 82 HC) | 20 | 93.65 | 90.08 | 92.75 | 0.9730 | - |
| This study | SVDD (RBF) 10-FCD | BCFCM/GA /PFCM | ADNI | MRI | 159 (77 AD, 82 HC) | 20 | 88.15 | 89.02 | 90.18 | 0.9500 | - |
| This study | SVDD (RBF) 10-FCV | BCFCM/GA /PFCM | ADNI | PET | 159 (77 AD, 82 HC) | 20 | 85.16 | 86.84 | 84.14 | 0.9204 | - |
| This study | SVM (RBF) 10-FCV | BCFCM/GA /PFCM | ADNI | MRI/PET | 159 (77 AD, 82 HC) | 20 | 89.09 | 87.72 | 88.18 | 0.8720 | - |
| This study | SVM (RBF) 10-FCD | BCFCM/GA /PFCM | ADNI | MRI | 159 (77 AD, 82 HC) | 20 | 83.42 | 82.34 | 87.51 | - | - |
| This study | SVM (RBF) 10-FCV | BCFCM/GA /PFCM | ADNI | PET | 159 (77 AD, 82 HC) | 20 | 80.72 | 84.34 | 81.23 | - | - |
| [5] | SVM (RBF) LCV | FCM/PCM | ADNI | MRI | 95 (45 AD, 50 HC) | 20 | 75 | 84.67 | 81.58 | - | - |
| [5] | SVM(RBF) LCV | FCM/PCM | ADNI | PET | 95 (45 AD, 50 HC) | 20 | 73 | 86.36 | 82.67 | - | - |
| [54] | CNN 10-FCV | NA | ADNI | MRI/PET | 193(93 AD, 100 HC) | NA | 89.64 | 87.1 | 92 | 0.9445 | - |
| [47] | SVM (RBF) | PCA/LDA | ADNI | PET | 105 (53 AD, 52 HC) | NA | 89.52 | - | - | - | - |
| [47] | FFNN | PCA/LDA | ADNI | PET | 105 (53 AD, 52 HC) | NA | 88.75 | - | - | - | - |
| [46] | MKL-SVM 10-FCV | NA | ADNI | MRI/PET | 159 (77 AD, 82 HC) | NA | 81 | 78.52 | 81.76 | 0.885 | - |
| This study | SVDD (RBF) 10-FCV | BCFCM/GA /PFCM | OASIS | MRI/PET | 198 (100 AD, 98 HC) | 20 | 91.46 | 92.00 | 91.78 | 0.9670 | 64 |
| This study | SVDD (RBF) 10-FCV | BCFCM/GA/ PFCM | OASIS | MRI | 198 (100 AD, 98 HC) | 20 | 81.46 | 78.57 | 83.73 | 0.9041 | - |
| This study | SVDD (RBF) 10-FCV | BCFCM/GA /PFCM | OASIS | PET | 198 (100 AD, 98 HC) | 20 | 79.24 | 80.16 | 83.58 | 0.8538 | - |
| This study | SVM(RBF) 10-FCV | BCFCM/GA /PFCM | OASIS | MRI/PET | 198 (100 AD, 98 HC) | 20 | 82.54 | 82.53 | 82.89 | 0.8090 | - |
| This study | SVM(RBF) 10-FCV | BCFCM/GA /PFCM | OASIS | MRI | 198 (100 AD, 98 HC) | 20 | 76.52 | 74.21 | 79.49 | - | - |
| This study | SVM(RBF) 10-FCV | BCFCM/GA /PFCM | OASIS | PET | 198 (100 AD, 98 HC) | 20 | 74.82 | 74.27 | 81.86 | - | - |
| [48] | SVM(linear) LCV | k-means/GA | OASIS | MRI | 198 (100 AD, 98 HC) | NA | - | - | - | - | 72 |
| This study | SVDD (RBF) 10-FCV | BCFCM/GA/ PFCM | GMPH | MRI/PET | 5 (5 AD, 0 HC) | 20 | 85.09 | 86.41 | 84.92 | 0.946 | - |
| This study | SVDD (RBF) 10-FCV | BCFCM/GA /PFCM | GMPH | MRI | 5 (5 AD, 0 HC) | 20 | 76.82 | 83.43 | 82.98 | 0.8608 | - |
| This study | SVDD (RBF) 10-FCV | BCFCM/GA /PFCM | GMPH | PET | 5 (5 AD, 0 HC) | 20 | 73.49 | 81.07 | 75.71 | 0.8089 | - |
| This study | SVM(RBF) 10-FCV | BCFCM/GA /PFCM | GMPH | MRI/PET | 5 (5 AD, 0 HC) | 20 | 81.53 | 80.27 | 82.07 | 0.8190 | - |
| This study | SVM(RBF) 10-FCV | BCFCM/GA /PFCM | GMPH | MRI | 5 (5 AD, 0 HC) | 20 | 75.01 | 80.21 | 76.48 | - | - |
| This study | SVM(RBF) 10-FCV | BCFCM/GA /PFCM | GMPH | PET | 5 (5 AD, 0 HC) | 20 | 71.72 | 78.73 | 71.92 | - | - |
© 2019 by the authors. Licensee MDPI, Basel, Switzerland. This article is an open access article distributed under the terms and conditions of the Creative Commons Attribution (CC BY) license (http://creativecommons.org/licenses/by/4.0/).
Share and Cite
Lazli, L.; Boukadoum, M.; Ait Mohamed, O. Computer-Aided Diagnosis System of Alzheimer’s Disease Based on Multimodal Fusion: Tissue Quantification Based on the Hybrid Fuzzy-Genetic-Possibilistic Model and Discriminative Classification Based on the SVDD Model. Brain Sci. 2019, 9, 289. https://doi.org/10.3390/brainsci9100289
Lazli L, Boukadoum M, Ait Mohamed O. Computer-Aided Diagnosis System of Alzheimer’s Disease Based on Multimodal Fusion: Tissue Quantification Based on the Hybrid Fuzzy-Genetic-Possibilistic Model and Discriminative Classification Based on the SVDD Model. Brain Sciences. 2019; 9(10):289. https://doi.org/10.3390/brainsci9100289
Chicago/Turabian StyleLazli, Lilia, Mounir Boukadoum, and Otmane Ait Mohamed. 2019. "Computer-Aided Diagnosis System of Alzheimer’s Disease Based on Multimodal Fusion: Tissue Quantification Based on the Hybrid Fuzzy-Genetic-Possibilistic Model and Discriminative Classification Based on the SVDD Model" Brain Sciences 9, no. 10: 289. https://doi.org/10.3390/brainsci9100289