2.3. Quality Control and Normalization
After the removal of duplicates, we filtered CEL files using standard quality control (QC) measures typical to the Affymetrix platform [
6]. We used the “simpleaffy” BioConductor library [
5] to inspect scale factors and presence of BioB spike-ins. Chips having more than three times the mean scale factor for a given submission or having no BioB spike-ins were removed.
We then removed outlier CEL files within each submission as follows. We computed “Relative Log Expression” (RLE) and “Normalized Unscaled Standard Errors” (NUSE) values within each submission. RLE and NUSE measures should be centered on zero and one, respectively. As a submission in a database is a set of CEL files, each CEL corresponding to a microarray assay conducted under different conditions by the same group, we expect an outlier CEL to have smaller spread of RLE and NUSE values. CEL files with interquartile range higher than 0.75 for RLE and NUSE were removed. Also, CEL files that were 0.075 from the required center for RLE and NUSE are identified as outliers and removed.
After the removal of CEL files that failed the above quality control procedures, we applied a normalization procedure so that gene expressions can be compared across experiments. We first converted the raw probe intensity values into expression values using the standard MAS 5.0 procedure with a scaling factor of 1000. Then, expression values are transformed to log2 space and mean centered, i.e.,
G[i,
j] is updated to
Gi,j-
Mi, where
Gi,j is the raw expression value of gene
i in chip
j,
Mi is the average gene expression of gene
i and
G[i,
j] is the normalized expression value of gene
i in chip
j. Finally, we used the “limma” Bioconductor library [
4] to perform quantile normalization.
Table 1 shows the number of submissions, which we refer to as experiments in the rest of this paper, and the number of CEL files left after quality control procedures. Note that this table also includes 3546 CELs prepared by [
7].
2.4. Data Filtering
In differential gene expression studies, where the main goal is to select genes with significant up or down regulation, genes with low expression range are eliminated because this indicates that those genes have no vital role in the pathway being studied. Filtering genes with low expression range is important in reverse-engineering gene networks also because most construction methods use correlation measures, and in order for a correlation measure between any two genes to be valid, the genes are expected to cover a wider expression range.
In the data filtering step, probes with lower expression range are identified using inter-quartile range (IQR) measure of the expression values. Typically, a threshold
q is selected based on prior knowledge or empirical analysis, and all the probes having IQR <
q is eliminated. In previous work where a gene network from a dataset of 3546 Affymetrix ATH CEL files was reported [
7], an IQR threshold of 0.65 was selected. In
Section 3.1, we discuss the effect of using this threshold on our dataset collection.
Clearly, lowering the value of the threshold q increases the number of genes that survive the filter, and consequently increase the size of the network. While it is desirable that the number of genes included in the network is as high as possible, simply reducing the IQR threshold to allow larger number of genes can produce spurious results in network construction due to invalid correlation measures, and thus undermining the primary goal of reverse-engineering networks.
A method for estimating the IQR threshold is expected to achieve two fundamental objectives:
- (1)
As demonstrated by Bourgona et al. (2010) [
11], filtering of genes by a criterion independent of the statistical test used to detect the strongly differentiated genes increases the detection power of multiple testing. This is applicable for network construction methods also, because the valid correlations are evaluated using an interaction-by-interaction statistical testing.
- (2)
The set of genes that survive the filtering should reflect the dataset’s characteristic variability of expression values.
The method proposed by Kapetis et al. (2012) [
12] to select the IQR threshold is based on [
11] and is designed to accomplish the first objective. The method by Kapetis et al. (2012) [
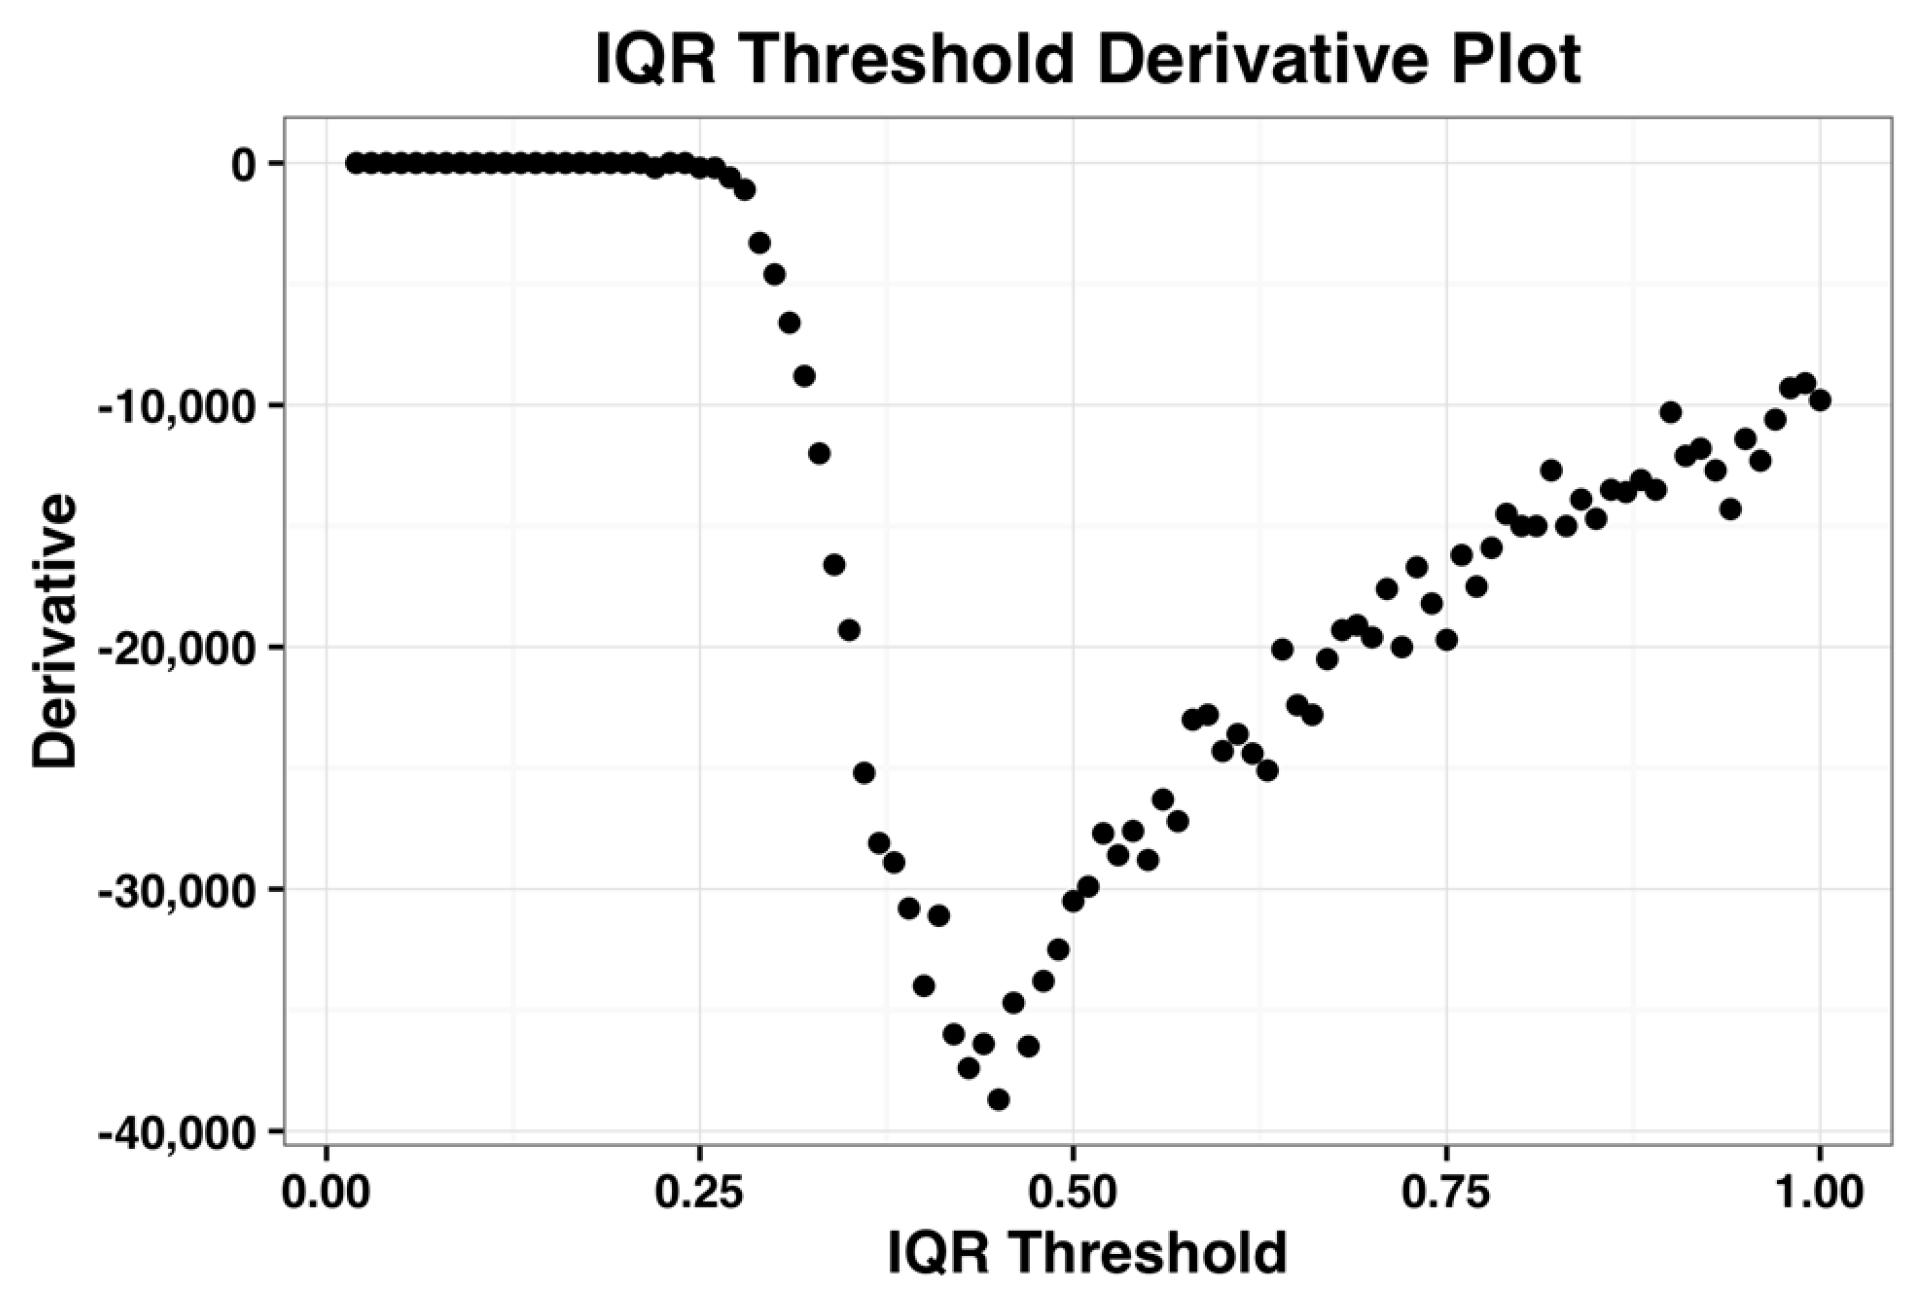
12] achieves this objective by identifying the probe-sets with the highest variability in signal across arrays. It computes the first derivative of the IQR profile and identifies its minimum point i.e., the steepest slope of the IQR profile plot.
We now demonstrate this method by applying it on the complete dataset.
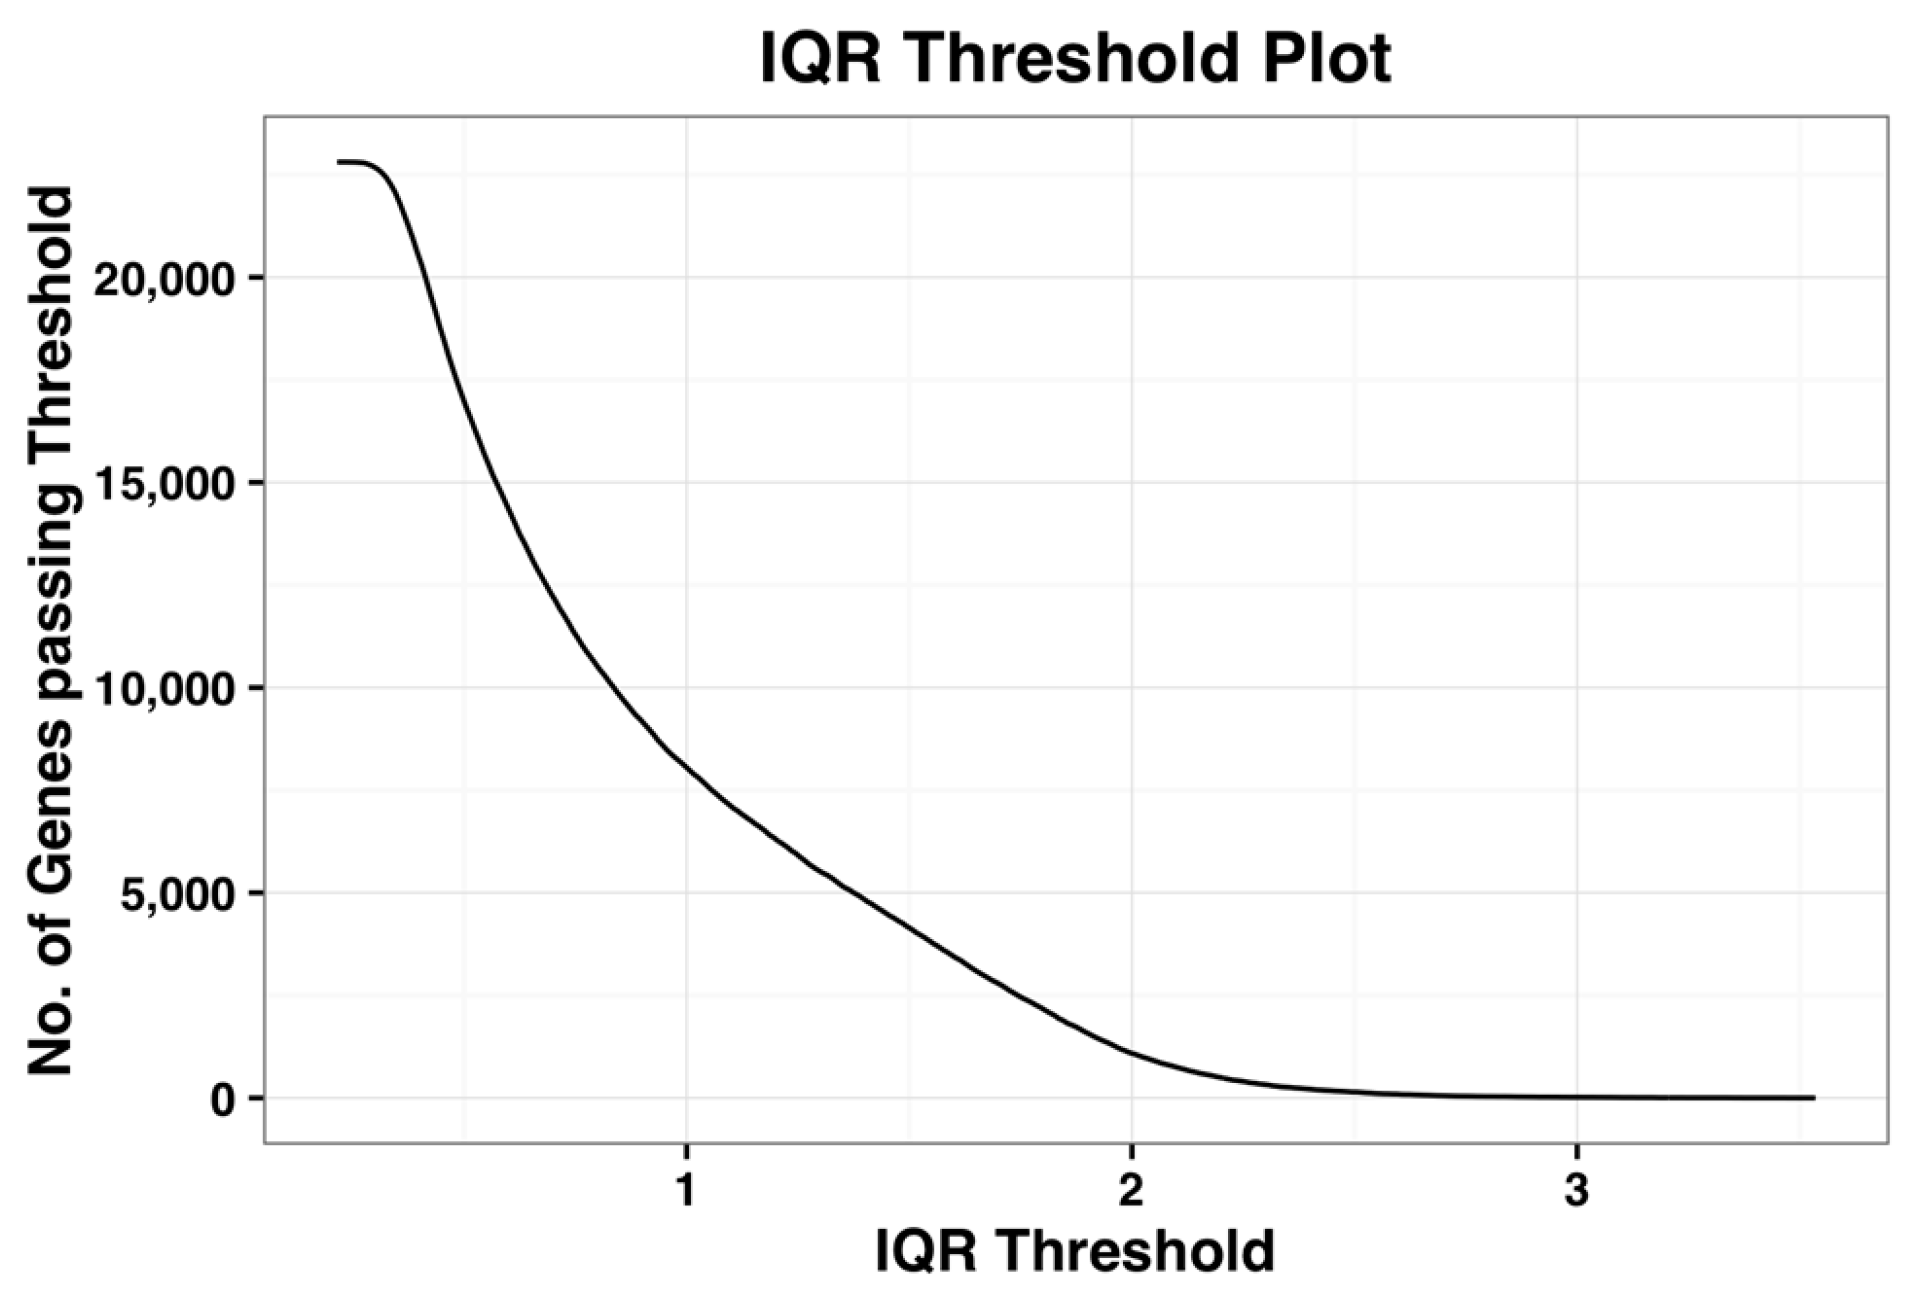
Figure 1, shown below, is the plot of number of probe-sets that survive a given IQR threshold value. When the IQR threshold is zero, all the probe sets pass the threshold. As IQR increases, the number of genes that pass the filter reduces gradually. Kapetis et al. (2012) [
12] call this plot as the IQR profile plot.
The derivative plot of the IQR profile of the complete dataset is shown in the
Figure 2 below and its minimum occurs when IQR threshold is 0.44. Kapetis et al. (2012) [
12] select this minimum value as the threshold. We refer the reader to [
11,
12] for further details on this method.
We used the following method to estimate the threshold
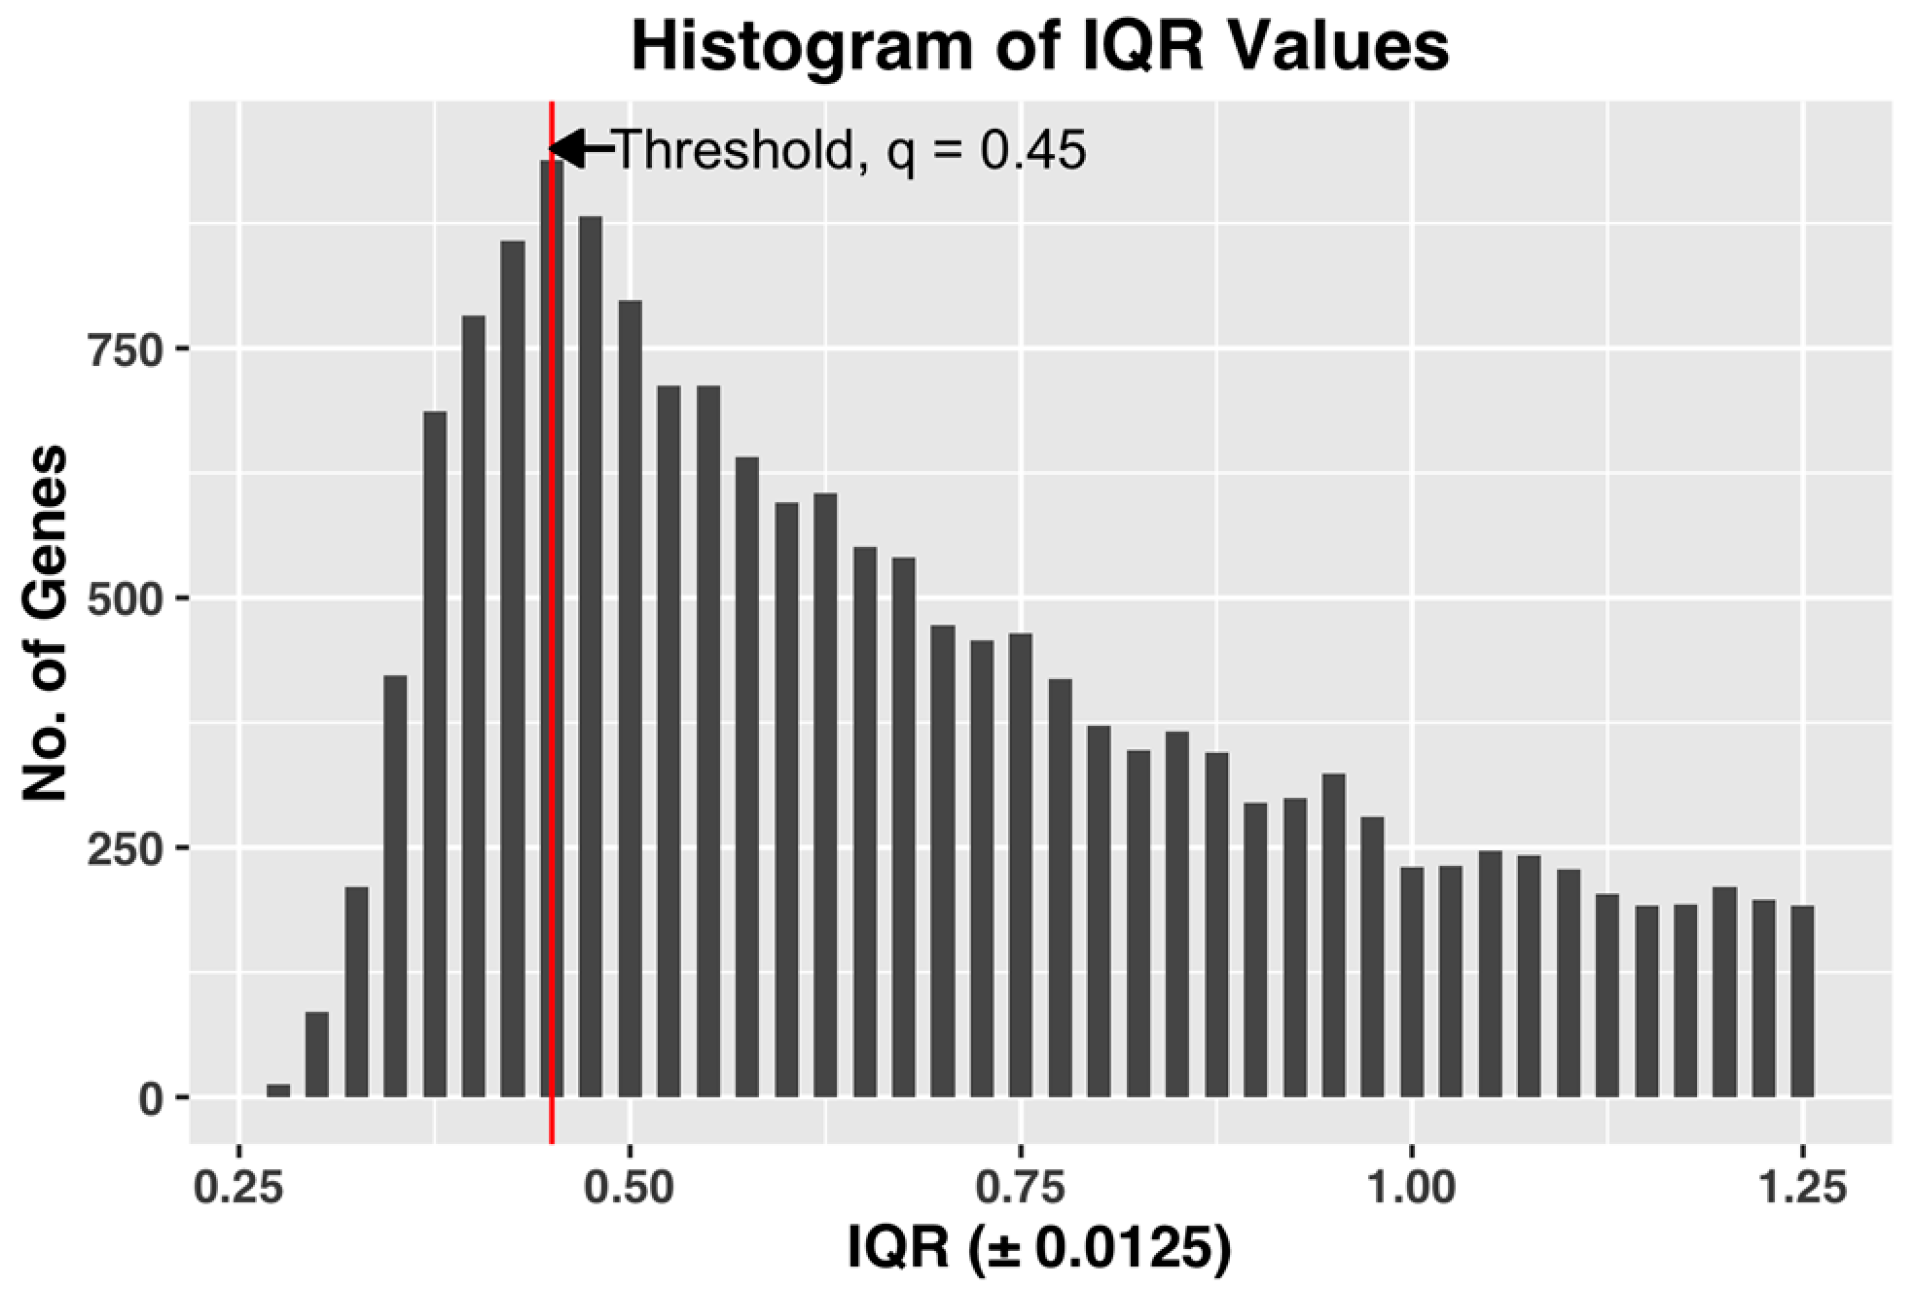
q, which achieves both of the desired objectives. After computing the gene expression IQR values of all the 22,810 probe-sets, we constructed a histogram plot of the 22,810 IQR values. Based on the plot, we selected
q as the IQR value
x, which has the maximum number of genes in the bin. The histogram bin size is selected to be granular enough to allow us to select a unique value of the threshold
q.
Figure 3, shown below, demonstrates the selection of threshold q by plotting the histogram plot of IQR values for a complete dataset of all the CEL files.
The selected q, by being the IQR value corresponding to the bin with maximum number of genes, i.e., the most common IQR expression value in the dataset, represents the characteristic IQR value of the dataset. Any value to the right of the selected q will reject the representative majority and can potentially leave out genes showing sufficient activity within the dataset.
We also found that in our datasets, the steepest slope of IQR plot always appears before the maximum point of the IQR histogram plot (See
Figure 3 for example). Since the method by Kapetis et al. (2012) [
12] uses the steepest slope of the IQR plot, the value q selected by our method is at least as high as the value selected by their method. Our method, while being simpler and easier to compute compared to Kapetis et al. (2012) [
12], accomplishes both the objectives.
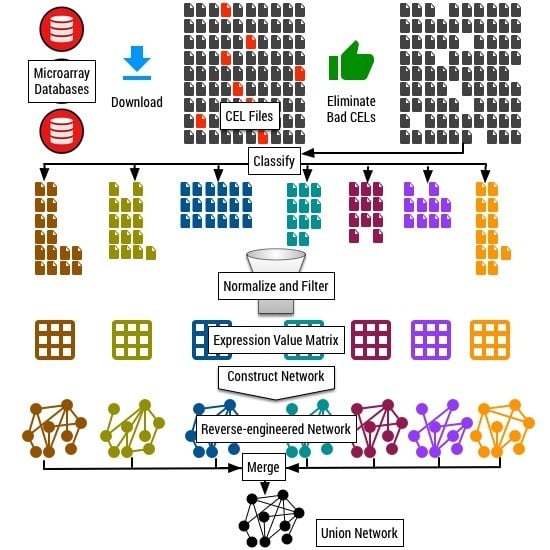
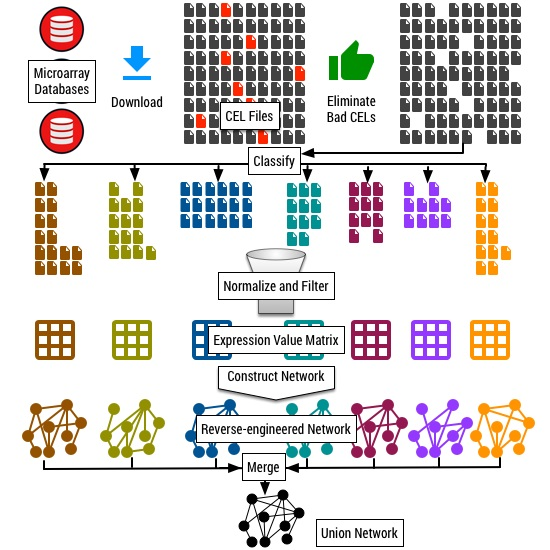
2.6. Classification
Our final dataset consists of 11,760 CEL files that survived the quality control procedures described in
Section 2.2 and
Section 2.3. We call this dataset of 11,760 CEL files as the “complete dataset”. To the best of our knowledge, this is the largest collection of microarray datasets for
Arabidopsis thaliana. In this complete dataset, if we remove all the genes having IQR expression value less than 0.65 (as suggested by Aluru et al. (2012) [
7]), only 13,384 genes remain for network construction. This is much less than the 15,495 genes that survived data filtering in the previous analysis of 3546 Affymetrix ATH CEL files reported in Aluru et al. (2012) [
7].
As our dataset collection is inclusive of and more than thrice the size of the dataset used in Aluru et al. (2012) [
7], it is reasonable to expect that the enlarged dataset should result in inclusion of more genes and discovery of more interactions. This conundrum of generating smaller networks with more data is due to the fact that gene interactions are tissue or process specific. The inclusion of a large number of experiments unrelated to the scope of a gene interaction can negatively affect its discovery. In addition, this may also lead to filtering out of a relevant gene in the network due to lack of sufficient dynamic range of expression over the entire dataset. As a consequence, simply enlarging the dataset and processing it as a whole does not lead to larger networks with more comprehensive discovery of novel gene interactions. We postulate that proper categorization of experiments is crucial to quality of gene network constructions, and demonstrate this as follows.
We classified the collection of 11,760 CEL files into tissue-specific and process-specific classes. We developed a two-step classification procedure. In the first step, we search for keywords related to different plant tissues and the physiological processes within the description and metadata available for each submission in the database. Based on the keywords identified, we made a preliminary partition of the 11,760 CEL files. In this preliminary assignment, one submission can be assigned to multiple categories. In the second step, we manually scanned the metadata available for each experiment and refine the preliminary classification further to resolve any error in the assigned categories.
Table 2 shows the list of tissue and process categories we use for classification and the corresponding number of experiments and CEL files under each category.
2.7. Network Construction Methods
Though we focus primarily on pre-processing techniques in this paper, we briefly discuss network construction methods here because the effectiveness of the proposed pre-processing techniques is evaluated in the context of network construction. Reverse-engineering networks are a well-studied problem and many different methods with varying capabilities have been developed for network construction (for example, [
15,
16,
17,
18]).
For the purpose of evaluating our pre-processing methods, we use two different network-reverse engineering methods. In both of these methods, a correlation measure is evaluated for every pair of genes in the dataset, and correlations that are deemed significant are reported as edges in the output network. One uses the Pearson correlation coefficient as the correlation measure, while the other uses Mutual Information.
Pearson correlation coefficient (PCC) is a measure of linear relationship between any two variables of interest and it ranges from +1 to −1, where +1 indicates the strongest positive correlation, while −1 a strong negative correlation. We use the pcor function in R to compute PCC. After measuring PCC for every pair of genes, we use the method used by Mao et al. (2009) [
8] to estimate the threshold above which a correlation can be considered significant.
Mutual Information (MI) between two random variables
x and
y is a measure of dependence between
x and
y. We use the TINGe software [
19] to construct MI network. TINGe is a parallel gene network construction method that uses a B-Spline based method to estimate MI values [
20] between every pair of genes and, then evaluates statistical significance using permutation testing. It also uses data processing inequality (DPI) to eliminate indirect relations between two genes. We refer the reader to [
19] for further details on TINGe.


