
Associations between Circulating SELENOP Level and Disorders of Glucose and Lipid Metabolism: A Meta-Analysis

 and
and
Abstract
:
1. Introduction
2. Materials and Methods
2.1. Literature Search
2.2. Study Identification and Selection
2.3. Quality Assessment and Data Extraction
2.4. Meta-Analysis
3. Results
3.1. Study Selection
3.2. Study Characteristics
3.3. Meta-Analysis
3.3.1. Relationships between SELENOP Level and GLMDs
3.3.2. Correlations between SELENOP and GLM Markers
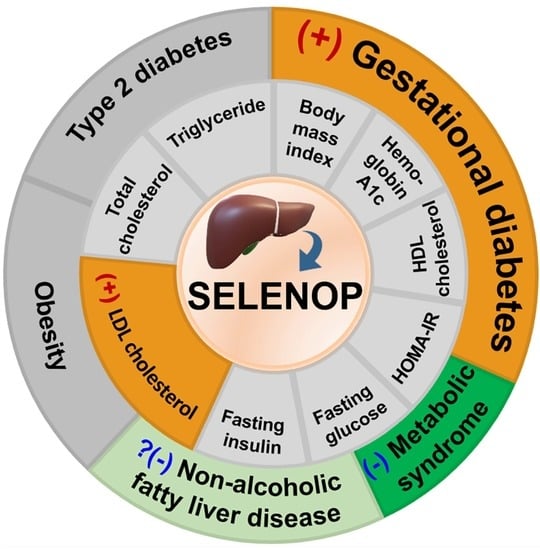
4. Discussion
4.1. GD and T2D
4.2. MetS and NAFLD
4.3. Obesity and BMI
4.4. Lipid Profiles
4.5. Glucose Metabolism
4.6. SNPs of SELENOP
4.7. Limitations and Advantages
5. Conclusions
Supplementary Materials
Author Contributions
Funding
Institutional Review Board Statement
Informed Consent Statement
Data Availability Statement
Acknowledgments
Conflicts of Interest
References
- Lazarus, J.V.; Mark, H.E.; Anstee, Q.M.; Arab, J.P.; Batterham, R.L.; Castera, L.; Cortez-Pinto, H.; Crespo, J.; Cusi, K.; Dirac, M.A.; et al. Advancing the global public health agenda for NAFLD: A consensus statement. Nat. Rev. Gastroenterol. Hepatol. 2022, 19, 60–78. [Google Scholar] [CrossRef] [PubMed]
- Hoffman, D.J.; Powell, T.L.; Barrett, E.S.; Hardy, D.B. Developmental origins of metabolic diseases. Physiol. Rev. 2021, 101, 739–795. [Google Scholar] [CrossRef] [PubMed]
- Jones, J.G. Hepatic glucose and lipid metabolism. Diabetologia 2016, 59, 1098–1103. [Google Scholar] [CrossRef] [PubMed] [Green Version]
- Misu, H. Identification of hepatokines involved in pathology of type 2 diabetes and obesity. Endocr. J. 2019, 66, 659–662. [Google Scholar] [CrossRef] [Green Version]
- Saito, Y.; Hayashi, T.; Tanaka, A.; Watanabe, Y.; Suzuki, M.; Saito, E.; Takahashi, K. Selenoprotein P in human plasma as an extracellular phospholipid hydroperoxide glutathione peroxidase—Isolation and enzymatic characterization of human selenoprotein P. J. Biol. Chem. 1999, 274, 2866–2871. [Google Scholar] [CrossRef] [Green Version]
- Takebe, G.; Yarimizu, J.; Saito, Y.; Hayashi, T.; Nakamura, H.; Yodoi, J.; Nagasawa, S.; Takahashi, K. A comparative study on the hydroperoxide and thiol specificity of the glutathione peroxidase family and selenoprotein P. J. Biol. Chem. 2002, 277, 41254–41258. [Google Scholar] [CrossRef] [Green Version]
- Burk, R.F.; Hill, K.E. Selenoprotein P-expression, f.functions, and roles in mammals. Biochim. Biophys. Acta 2009, 1790, 1441–1447. [Google Scholar] [CrossRef] [Green Version]
- Kurokawa, S.; Eriksson, S.; Rose, K.L.; Wu, S.; Motley, A.K.; Hill, S.; Winfrey, V.P.; McDonald, W.H.; Capecchi, M.R.; Atkins, J.F.; et al. Sepp1(UF) forms are N-terminal selenoprotein P truncations that have peroxidase activity when coupled with thioredoxin reductase-1. Free Radic. Biol. Med. 2014, 69, 67–76. [Google Scholar] [CrossRef] [Green Version]
- Burk, R.F.; Hill, K.E. Regulation of selenium metabolism and transport. Annu. Rev. Nutr. 2015, 35, 109–134. [Google Scholar] [CrossRef]
- Saito, Y. Selenium transport mechanism via selenoprotein P-its physiological role and related diseases. Front. Nutr. 2021, 8, 685517. [Google Scholar] [CrossRef]
- Fernandez-Ruiz, I. Selenoprotein P—A new player in PAH. Nat. Rev. Cardiol. 2018, 15, 381. [Google Scholar] [CrossRef] [PubMed]
- Schomburg, L.; Orho-Melander, M.; Struck, J.; Bergmann, A.; Melander, O. Selenoprotein-P deficiency predicts cardiovascular disease and death. Nutrients 2019, 11, 1852. [Google Scholar] [CrossRef] [PubMed] [Green Version]
- Saito, Y. Selenoprotein P as a significant regulator of pancreatic beta cell function. J. Biochem. 2020, 167, 119–124. [Google Scholar] [CrossRef] [PubMed]
- Polyzos, S.A.; Kountouras, J.; Goulas, A.; Duntas, L. Selenium and selenoprotein P in nonalcoholic fatty liver disease. Hormones 2020, 19, 61–72. [Google Scholar] [CrossRef] [PubMed]
- Cinemre, F.B.S.; Cinemre, H.; Yucel, A.; Degirmencioglu, S.; Tuten, A.; Yuksel, M.A.; Yilmaz, N.; Gulyasar, T.; Yildiz, M.; Bahtiyar, N.; et al. The role of selenoprotein P and selenium in the etiopathogenesis of gestational diabetes mellitus: Association with selenoprotein P1 gene (rs3877899) polymorphism. Trace Elem. Electroly. 2018, 35, 174–182. [Google Scholar] [CrossRef]
- Lee, S.M.; Kwak, S.H.; Koo, J.N.; Oh, I.H.; Kwon, J.E.; Kim, B.J.; Kim, S.M.; Kim, S.Y.; Kim, G.M.; Joo, S.K.; et al. Non-alcoholic fatty liver disease in the first trimester and subsequent development of gestational diabetes mellitus. Diabetologia 2019, 62, 238–248. [Google Scholar] [CrossRef] [Green Version]
- Altinova, A.E.; Iyidir, O.T.; Ozkan, C.; Ors, D.; Ozturk, M.; Gulbahar, O.; Bozkurt, N.; Toruner, F.B.; Akturk, M.; Cakir, N.; et al. Selenoprotein P is not elevated in gestational diabetes mellitus. Gynecol. Endocrinol. 2015, 31, 874–876. [Google Scholar] [CrossRef]
- Yang, S.J.; Hwang, S.Y.; Choi, H.Y.; Yoo, H.J.; Seo, J.A.; Kim, S.G.; Kim, N.H.; Baik, S.H.; Choi, D.S.; Choi, K.M. Serum selenoprotein P levels in patients with type 2 diabetes and prediabetes: Implications for insulin resistance, inflammation, and atherosclerosis. J. Clin. Endocrinol. Metab. 2011, 96, E1325–E1329. [Google Scholar] [CrossRef]
- Roman, M.; Lapolla, A.; Jitaru, P.; Sechi, A.; Cosma, C.; Cozzi, G.; Cescon, P.; Barbante, C. Plasma selenoproteins concentrations in type 2 diabetes mellitus—A pilot study. Transl. Res. 2010, 156, 242–250. [Google Scholar] [CrossRef]
- Misu, H.; Ishikura, K.; Kurita, S.; Takeshita, Y.; Ota, T.; Saito, Y.; Takahashi, K.; Kaneko, S.; Takamura, T. Inverse correlation between serum levels of selenoprotein P and adiponectin in patients with type 2 diabetes. PLoS ONE 2012, 7, e34952. [Google Scholar] [CrossRef] [Green Version]
- Choi, H.Y.; Hwang, S.Y.; Lee, C.H.; Hong, H.C.; Yang, S.J.; Yoo, H.J.; Seo, J.A.; Kim, S.G.; Kim, N.H.; Baik, S.H.; et al. Increased selenoprotein P levels in subjects with visceral obesity and nonalcoholic fatty liver disease. Diabetes Metab. J. 2013, 37, 63–71. [Google Scholar] [CrossRef] [PubMed] [Green Version]
- Chen, M.; Liu, B.; Wilkinson, D.; Hutchison, A.T.; Thompson, C.H.; Wittert, G.A.; Heilbronn, L.K. Selenoprotein P is elevated in individuals with obesity, but is not independently associated with insulin resistance. Obes. Res. Clin. Pract. 2017, 11, 227–232. [Google Scholar] [CrossRef] [PubMed]
- Sargeant, J.A.; Aithal, G.P.; Takamura, T.; Misu, H.; Takayama, H.; Douglas, J.A.; Turner, M.C.; Stensel, D.J.; Nimmo, M.A.; Webb, D.R.; et al. The influence of adiposity and acute exercise on circulating hepatokines in normal-weight and overweight/obese men. Appl. Physiol. Nutr. Metab. 2018, 43, 482–490. [Google Scholar] [CrossRef] [Green Version]
- Polyzos, S.A.; Kountouras, J.; Mavrouli, M.; Katsinelos, P.; Doulberis, M.; Gavana, E.; Duntas, L. Selenoprotein P in patients with nonalcoholic fatty liver disease. Exp. Clin. Endocrinol. Diabetes 2019, 127, 598–602. [Google Scholar] [CrossRef] [PubMed]
- Flisiak-Jackiewicz, M.; Bobrus-Chociej, A.; Wasilewska, N.; Tarasow, E.; Wojtkowska, M.; Lebensztejn, D.M. Can hepatokines be regarded as novel non-invasive serum biomarkers of intrahepatic lipid content in obese children? Adv. Med. Sci. 2019, 64, 280–284. [Google Scholar] [CrossRef]
- Cetindagli, I.; Kara, M.; Tanoglu, A.; Ozalper, V.; Aribal, S.; Hancerli, Y.; Unal, M.; Ozari, O.; Hira, S.; Kaplan, M.; et al. Evaluation of endothelial dysfunction in patients with nonalcoholic fatty liver disease: Association of selenoprotein P with carotid intima-media thickness and endothelium-dependent vasodilation. Clin. Res. Hepatol. Gastroenterol. 2017, 41, 516–524. [Google Scholar] [CrossRef]
- Vinceti, M.; Filippini, T.; Wise, L.A.; Rothman, K.J. A systematic review and dose-response meta-analysis of exposure to environmental selenium and the risk of type 2 diabetes in nonexperimental studies. Environ. Res. 2021, 197, 111210. [Google Scholar] [CrossRef]
- Vinceti, M.; Filippini, T.; Rothman, K.J. Selenium exposure and the risk of type 2 diabetes: A systematic review and meta-analysis. Eur. J. Epidemiol. 2018, 33, 789–810. [Google Scholar] [CrossRef]
- Hasani, M.; Djalalinia, S.; Sharifi, F.; Varmaghani, M.; Zarei, M.; Abdar, M.E.; Asayesh, H.; Noroozi, M.; Kasaeian, A.; Gorabi, A.M.; et al. Effect of selenium supplementation on lipid profile: A systematic review and meta-analysis. Horm. Metab. Res. 2018, 50, 715–727. [Google Scholar] [CrossRef]
- Tabrizi, R.; Akbari, M.; Moosazadeh, M.; Lankarani, K.B.; Heydari, S.T.; Kolahdooz, F.; Mohammadi, A.A.; Shabani, A.; Badehnoosh, B.; Jamilian, M.; et al. The effects of selenium supplementation on glucose metabolism and lipid profiles among patients with metabolic diseases: A systematic review and meta-analysis of randomized controlled trials. Horm. Metab. Res. 2017, 49, 826–830. [Google Scholar] [CrossRef]
- Page, M.J.; McKenzie, J.E.; Bossuyt, P.M.; Boutron, I.; Hoffmann, T.C.; Mulrow, C.D.; Shamseer, L.; Tetzlaff, J.M.; Akl, E.A.; Brennan, S.E.; et al. The PRISMA 2020 statement: An updated guideline for reporting systematic reviews. BMJ 2021, 372, n71. [Google Scholar] [CrossRef] [PubMed]
- Herzog, R.; Alvarez-Pasquin, M.J.; Diaz, C.; Del Barrio, J.L.; Estrada, J.M.; Gil, A. Are healthcare workers’ intentions to vaccinate related to their knowledge, beliefs and attitudes? A systematic review. BMC Public Health 2013, 13, 154. [Google Scholar] [CrossRef] [PubMed] [Green Version]
- Stang, A. Critical evaluation of the Newcastle-Ottawa scale for the assessment of the quality of nonrandomized studies in meta-analyses. Eur. J. Epidemiol. 2010, 25, 603–605. [Google Scholar] [CrossRef] [PubMed] [Green Version]
- Pitukweerakul, S.; Thavaraputta, S.; Prachuapthunyachart, S.; Karnchanasorn, R. Hypovitaminosis D is associated with psoriasis: A systematic review and meta-analysis. Kans. J. Med. 2019, 12, 103–108. [Google Scholar] [CrossRef]
- Higgins, J.P.T.; Thomas, J.; Chandler, J.; Cumpston, M.; Li, T.; Page, M.J.; Welch, V.A. (Eds.) Cochrane Handbook for Systematic Reviews of Interventions, 2nd ed.; John Wiley & Sons: Chichester, UK, 2019. [Google Scholar]
- Luo, D.; Wan, X.; Liu, J.; Tong, T. Optimally estimating the sample mean from the sample size, median, mid-range, and/or mid-quartile range. Stat. Methods Med. Res. 2018, 27, 1785–1805. [Google Scholar] [CrossRef] [Green Version]
- Wan, X.; Wang, W.; Liu, J.; Tong, T. Estimating the sample mean and standard deviation from the sample size, median, range and/or interquartile range. BMC Med. Res. Methodol. 2014, 14, 135. [Google Scholar] [CrossRef] [Green Version]
- Shi, J.; Luo, D.; Wan, X.; Liu, Y.; Liu, J.; Bian, Z.; Tong, T. Detecting the skewness of data from the sample size and the five-number summary. arXiv 2020, arXiv:2010.05749. [Google Scholar]
- Rupinski, M.T.; Dunlap, W.P. Approximating A basic introduction to fixed-effect. Educ. Psychol. Meas. 1996, 56, 419–429. [Google Scholar] [CrossRef]
- Leeflang, M.M.; Deeks, J.J.; Gatsonis, C.; Bossuyt, P.M.; Cochrane Diagnostic Test Accuracy Working, G. Systematic reviews of diagnostic test accuracy. Ann. Intern. Med. 2008, 149, 889–897. [Google Scholar] [CrossRef]
- Zamora, J.; Abraira, V.; Muriel, A.; Khan, K.; Coomarasamy, A. Meta-DiSc: A software for meta-analysis of test accuracy data. BMC Med. Res. Methodol. 2006, 6, 31. [Google Scholar] [CrossRef]
- Higgins, J.P.; Thompson, S.G.; Deeks, J.J.; Altman, D.G. Measuring inconsistency in meta-analyses. BMJ 2003, 327, 557–560. [Google Scholar] [CrossRef] [PubMed] [Green Version]
- Gonzalez de Vega, R.; Fernandez-Sanchez, M.L.; Fernandez, J.C.; Alvarez Menendez, F.V.; Sanz-Medel, A. Selenium levels and glutathione peroxidase activity in the plasma of patients with type II diabetes mellitus. J. Trace Elem. Med. Biol. 2016, 37, 44–49. [Google Scholar] [CrossRef] [PubMed]
- Zhang, Q.; Li, W.; Wang, J.; Hu, B.; Yun, H.; Guo, R.; Wang, L. Selenium levels in community dwellers with type 2 diabetes mellitus. Biol. Trace Elem. Res. 2019, 191, 354–362. [Google Scholar] [CrossRef]
- Oo, S.M.; Misu, H.; Saito, Y.; Tanaka, M.; Kato, S.; Kita, Y.; Takayama, H.; Takeshita, Y.; Kanamori, T.; Nagano, T.; et al. Serum selenoprotein P, but not selenium, predicts future hyperglycemia in a general Japanese population. Sci. Rep. 2018, 8, 16727. [Google Scholar] [CrossRef] [PubMed]
- Misu, H.; Takamura, T.; Takayama, H.; Hayashi, H.; Matsuzawa-Nagata, N.; Kurita, S.; Ishikura, K.; Ando, H.; Takeshita, Y.; Ota, T.; et al. A liver-derived secretory protein, selenoprotein P, causes insulin resistance. Cell Metab. 2010, 12, 483–495. [Google Scholar] [CrossRef] [PubMed] [Green Version]
- Larvie, D.Y.; Doherty, J.L.; Donati, G.L.; Armah, S.M. Relationship between selenium and hematological markers in young adults with normal weight or overweight/obesity. Antioxidants 2019, 8, 463. [Google Scholar] [CrossRef] [PubMed] [Green Version]
- Ko, B.J.; Kim, S.M.; Park, K.H.; Park, H.S.; Mantzoros, C.S. Levels of circulating selenoprotein P, fibroblast growth factor (FGF) 21 and FGF23 in relation to the metabolic syndrome in young children. Int. J. Obes. 2014, 38, 1497–1502. [Google Scholar] [CrossRef]
- Gharipour, M.; Sadeghi, M.; Salehi, M.; Behmanesh, M.; Khosravi, E.; Dianatkhah, M.; Haghjoo Javanmard, S.; Razavi, R.; Gharipour, A. Association of expression of selenoprotein P in mRNA and protein levels with metabolic syndrome in subjects with cardiovascular disease: Results of the Selenegene study. J. Gene Med. 2017, 19, e2945. [Google Scholar] [CrossRef]
- Gharipour, M.; Ouguerram, K.; Nazih, E.H.; Salehi, M.; Behmanesh, M.; Razavi, R.; Gharipour, A.; Diantkhah, M.; Sadeghi, M. Effect of single nucleotide polymorphisms in SEPS1 and SEPP1 on expression in the protein level in metabolic syndrome in subjects with cardiovascular disease. Mol. Biol. Rep. 2019, 46, 5685–5693. [Google Scholar] [CrossRef]
- El-Kafrawy, N.A.F.; Atta, A.E.B.M.; Abdelsattar, S.; Zewain, S.K.E.D. Serum selenoprotein P in lean and obese Egyptian individuals and its relation to insulin resistance. Alex. J. Med. 2021, 57, 61–69. [Google Scholar] [CrossRef]
- di Giuseppe, R.; Koch, M.; Schlesinger, S.; Borggrefe, J.; Both, M.; Muller, H.P.; Kassubek, J.; Jacobs, G.; Nothlings, U.; Lieb, W. Circulating selenoprotein P levels in relation to MRI-derived body fat volumes, liver fat content, and metabolic disorders. Obesity 2017, 25, 1128–1135. [Google Scholar] [CrossRef] [PubMed]
- Caviglia, G.P.; Rosso, C.; Armandi, A.; Gaggini, M.; Carli, F.; Abate, M.L.; Olivero, A.; Ribaldone, D.G.; Saracco, G.M.; Gastaldelli, A.; et al. Interplay between oxidative stress and metabolic derangements in non-alcoholic fatty liver disease: The role of selenoprotein P. Int. J. Mol. Sci. 2020, 21, 8838. [Google Scholar] [CrossRef] [PubMed]
- Zhang, L.; Hao, Y. Study on selenoprotein P in type 2 diabetes mellitus and non-alcoholic fatty liver disease. J. Baotou Med. 2018, 34, 95–96. [Google Scholar] [CrossRef]
- Pan, J.; Yu, H.; Lei, Z.; Han, J.; Jia, W. Selenoprotein P in type 2 diabetes mellitus and its association with insulin resistance. Natl. Med. J. Chin. 2014, 94, 1710–1713. [Google Scholar] [CrossRef]
- Jin, S.; Jin, M.; Zhang, Y. Correlation between serum selenoprotein P and renal injury and prognosis in patients with diabetic nephropathy. J. Trop. Med. 2020, 20, 1589–1592. [Google Scholar] [CrossRef]
- Jiang, L.; Dou, X.; Chen, Y. Clinical analysis of serum selenoprotein P in patients with gestational diabetes mellitus. Chin. Fore. Med. Res. 2019, 17, 7–9. [Google Scholar] [CrossRef]
- Fan, H.; Shi, B.; Li, H.; Sun, H. Correlation analysis between serum selenoprotein P and non -alcoholic fatty liver disease in elders with type 2 diabetes mellitus. Chin. J. Diabetes Mellit. 2019, 27, 250–253. [Google Scholar] [CrossRef]
- Chen, Y.; He, X.J.; Chen, X.Y.; Li, Y.M.; Ke, Y.N. SeP is elevated in NAFLD and participates in NAFLD pathogenesis through AMPK/ACC pathway. J. Cell Physiol. 2021, 236, 3800–3807. [Google Scholar] [CrossRef]
- Jung, T.W.; Ahn, S.H.; Shin, J.W.; Kim, H.C.; Park, E.S.; Abd El-Aty, A.M.; Hacimuftuoglu, A.; Song, K.H.; Jeong, J.H. Protectin DX ameliorates palmitate-induced hepatic insulin resistance through AMPK/SIRT1-mediated modulation of fetuin-A and SeP expression. Clin. Exp. Pharmacol. Physiol. 2019, 46, 898–909. [Google Scholar] [CrossRef]
- Zheng, W.Y.; He, R.; Boada, R.; Subirana, M.A.; Ginman, T.; Ottosson, H.; Valiente, M.; Zhao, Y.; Hassan, M. A general covalent binding model between cytotoxic selenocompounds and albumin revealed by mass spectrometry and X-ray absorption spectroscopy. Sci. Rep. 2020, 10, 1274. [Google Scholar] [CrossRef] [Green Version]
- Esmon, C.T.; Fukudome, K.; Mather, T.; Bode, W.; Regan, L.M.; Stearns-Kurosawa, D.J.; Kurosawa, S. Inflammation, sepsis, and coagulation. Haematologica 1999, 84, 254–259. [Google Scholar] [PubMed]
- Peretz, A.M.; Neve, J.D.; Famaey, J.P. Selenium in rheumatic diseases. Semin. Arthritis Rheum. 1991, 20, 305–316. [Google Scholar] [CrossRef]
- Saito, Y.; Sato, N.; Hirashima, M.; Takebe, G.; Nagasawa, S.; Takahashi, K. Domain structure of bi-functional selenoprotein P. Biochem. J. 2004, 381, 841–846. [Google Scholar] [CrossRef] [PubMed] [Green Version]
- Saito, Y.; Yoshida, Y.; Akazawa, T.; Takahashi, K.; Niki, E. Cell death caused by selenium deficiency and protective effect of antioxidants. J. Biol. Chem. 2003, 278, 39428–39434. [Google Scholar] [CrossRef] [Green Version]
- Hill, K.E.; Zhou, J.; McMahan, W.J.; Motley, A.K.; Atkins, J.F.; Gesteland, R.F.; Burk, R.F. Deletion of selenoprotein P alters distribution of selenium in the mouse. J. Biol. Chem. 2003, 278, 13640–13646. [Google Scholar] [CrossRef] [Green Version]
- Saito, Y.; Shichiri, M.; Hamajima, T.; Ishida, N.; Mita, Y.; Nakao, S.; Hagihara, Y.; Yoshida, Y.; Takahashi, K.; Niki, E.; et al. Enhancement of lipid peroxidation and its amelioration by vitamin E in a subject with mutations in the SBP2 gene. J. Lipid Res. 2015, 56, 2172–2182. [Google Scholar] [CrossRef] [Green Version]
- Suzuki, T.; Kelly, V.P.; Motohashi, H.; Nakajima, O.; Takahashi, S.; Nishimura, S.; Yamamoto, M. Deletion of the selenocysteine tRNA gene in macrophages and liver results in compensatory gene induction of cytoprotective enzymes by Nrf2. J. Biol. Chem. 2008, 283, 2021–2030. [Google Scholar] [CrossRef] [Green Version]
- Moghaddam, A.; Heller, R.A.; Sun, Q.; Seelig, J.; Cherkezov, A.; Seibert, L.; Hackler, J.; Seemann, P.; Diegmann, J.; Pilz, M.; et al. Selenium deficiency is associated with mortality risk from COVID-19. Nutrients 2020, 12, 2098. [Google Scholar] [CrossRef]
- Takamura, T. Hepatokine selenoprotein P-mediated reductive stress causes resistance to intracellular signal transduction. Antioxid. Redox Signal. 2020, 33, 517–524. [Google Scholar] [CrossRef]
- Mita, Y.; Nakayama, K.; Inari, S.; Nishito, Y.; Yoshioka, Y.; Sakai, N.; Sotani, K.; Nagamura, T.; Kuzuhara, Y.; Inagaki, K.; et al. Selenoprotein P-neutralizing antibodies improve insulin secretion and glucose sensitivity in type 2 diabetes mouse models. Nat. Commun. 2017, 8, 1658. [Google Scholar] [CrossRef]
- Akbaba, G.; Akbaba, E.; Sahin, C.; Kara, M. The relationship between gestational diabetes mellitus and selenoprotein-P plasma 1 (SEPP1) gene polymorphisms. Gynecol. Endocrinol. 2018, 34, 849–852. [Google Scholar] [CrossRef] [PubMed]
- Misu, H.; Takayama, H.; Saito, Y.; Mita, Y.; Kikuchi, A.; Ishii, K.; Chikamoto, K.; Kanamori, T.; Tajima, N.; Lan, F.; et al. Deficiency of the hepatokine selenoprotein P increases responsiveness to exercise in mice through upregulation of reactive oxygen species and AMP-activated protein kinase in muscle. Nat. Med. 2017, 23, 508–516. [Google Scholar] [CrossRef] [PubMed]
- Walter, P.L.; Steinbrenner, H.; Barthel, A.; Klotz, L.O. Stimulation of selenoprotein P promoter activity in hepatoma cells by FoxO1a transcription factor. Biochem. Biophys. Res. Commun. 2008, 365, 316–321. [Google Scholar] [CrossRef] [PubMed]
- Speckmann, B.; Walter, P.L.; Alili, L.; Reinehr, R.; Sies, H.; Klotz, L.O.; Steinbrenner, H. Selenoprotein P expression is controlled through interaction of the coactivator PGC-1alpha with FoxO1a and hepatocyte nuclear factor 4alpha transcription factors. Hepatology 2008, 48, 1998–2006. [Google Scholar] [CrossRef]
- Chen, J.; Berry, M.J. Selenium and selenoproteins in the brain and brain diseases. J. Neurochem. 2003, 86, 1–12. [Google Scholar] [CrossRef]
- Chen, X.; Scholl, T.O.; Leskiw, M.J.; Donaldson, M.R.; Stein, T.P. Association of glutathione peroxidase activity with insulin resistance and dietary fat intake during normal pregnancy. J. Clin. Endocrinol. Metab. 2003, 88, 5963–5968. [Google Scholar] [CrossRef] [Green Version]
- Tan, M.; Sheng, L.; Qian, Y.; Ge, Y.; Wang, Y.; Zhang, H.; Jiang, M.; Zhang, G. Changes of serum selenium in pregnant women with gestational diabetes mellitus. Biol. Trace Elem. Res. 2001, 83, 231–237. [Google Scholar] [CrossRef]
- Al-Saleh, E.; Nandakumaran, M.; Al-Shammari, M.; Al-Harouny, A. Maternal-fetal status of copper, iron, molybdenum, selenium and zinc in patients with gestational diabetes. J. Matern. Fetal Neonatal. Med. 2004, 16, 15–21. [Google Scholar] [CrossRef]
- Bo, S.; Lezo, A.; Menato, G.; Gallo, M.L.; Bardelli, C.; Signorile, A.; Berutti, C.; Massobrio, M.; Pagano, G.F. Gestational hyperglycemia, zinc, selenium, and antioxidant vitamins. Nutrition 2005, 21, 186–191. [Google Scholar] [CrossRef]
- Kilinc, M.; Guven, M.A.; Ezer, M.; Ertas, I.E.; Coskun, A. Evaluation of serum selenium levels in Turkish women with gestational diabetes mellitus, glucose intolerants, and normal controls. Biol. Trace Elem. Res. 2008, 123, 35–40. [Google Scholar] [CrossRef]
- Al-Saleh, E.; Nandakumaran, M.; Al-Rashdan, I.; Al-Harmi, J.; Al-Shammari, M. Maternal-foetal status of copper, iron, molybdenum, selenium and zinc in obese gestational diabetic pregnancies. Acta Diabetol. 2007, 44, 106–113. [Google Scholar] [CrossRef] [PubMed]
- Hamdan, H.Z.; Elbashir, L.M.; Hamdan, S.Z.; Elhassan, E.M.; Adam, I. Zinc and selenium levels in women with gestational diabetes mellitus at Medani Hospital, Sudan. J. Obstet. Gynaecol. 2014, 34, 567–570. [Google Scholar] [CrossRef] [PubMed]
- Molnar, J.; Garamvolgyi, Z.; Herold, M.; Adanyi, N.; Somogyi, A.; Rigo, J., Jr. Serum selenium concentrations correlate significantly with inflammatory biomarker high-sensitive CRP levels in Hungarian gestational diabetic and healthy pregnant women at mid-pregnancy. Biol. Trace Elem. Res. 2008, 121, 16–22. [Google Scholar] [CrossRef] [PubMed]
- Askari, G.; Iraj, B.; Salehi-Abargouei, A.; Fallah, A.A.; Jafari, T. The association between serum selenium and gestational diabetes mellitus: A systematic review and meta-analysis. J. Trace Elem. Med. Biol. 2015, 29, 195–201. [Google Scholar] [CrossRef] [PubMed]
- Kong, F.J.; Ma, L.L.; Chen, S.P.; Li, G.; Zhou, J.Q. Serum selenium level and gestational diabetes mellitus: A systematic review and meta-analysis. Nutr. J. 2016, 15, 94. [Google Scholar] [CrossRef] [Green Version]
- Cai, Z.; Yang, Y.; Zhang, J. Hepatokine levels during the first or early second trimester of pregnancy and the subsequent risk of gestational diabetes mellitus: A systematic review and meta-analysis. Biomarkers 2021, 26, 517–531. [Google Scholar] [CrossRef]
- Kohler, L.N.; Foote, J.; Kelley, C.P.; Florea, A.; Shelly, C.; Chow, H.S.; Hsu, P.; Batai, K.; Ellis, N.; Saboda, K.; et al. Selenium and type 2 diabetes: Systematic review. Nutrients 2018, 10, 1924. [Google Scholar] [CrossRef] [Green Version]
- Kim, J.; Chung, H.S.; Choi, M.K.; Roh, Y.K.; Yoo, H.J.; Park, J.H.; Kim, D.S.; Yu, J.M.; Moon, S. Association between serum selenium level and the presence of diabetes mellitus: A meta-analysis of observational studies. Diabetes Metab. J. 2019, 43, 447–460. [Google Scholar] [CrossRef]
- Wang, X.L.; Yang, T.B.; Wei, J.; Lei, G.H.; Zeng, C. Association between serum selenium level and type 2 diabetes mellitus: A non-linear dose-response meta-analysis of observational studies. Nutr. J. 2016, 15, 48. [Google Scholar] [CrossRef] [Green Version]
- Rayman, M.P. Selenium and human health. Lancet 2012, 379, 1256–1268. [Google Scholar] [CrossRef]
- Rayman, M.P.; Stranges, S. Epidemiology of selenium and type 2 diabetes: Can we make sense of it? Free Radic. Biol. Med. 2013, 65, 1557–1564. [Google Scholar] [CrossRef] [PubMed]
- Rocourt, C.R.; Cheng, W.H. Selenium supranutrition: Are the potential benefits of chemoprevention outweighed by the promotion of diabetes and insulin resistance? Nutrients 2013, 5, 1349–1365. [Google Scholar] [CrossRef] [PubMed] [Green Version]
- Cabral, M.; Kuxhaus, O.; Eichelmann, F.; Kopp, J.F.; Alker, W.; Hackler, J.; Kipp, A.P.; Schwerdtle, T.; Haase, H.; Schomburg, L.; et al. Trace element profile and incidence of type 2 diabetes, cardiovascular disease and colorectal cancer: Results from the EPIC-Potsdam cohort study. Eur. J. Nutr. 2021, 60, 3267–3278. [Google Scholar] [CrossRef] [PubMed]
- Eckel, R.H.; Alberti, K.G.; Grundy, S.M.; Zimmet, P.Z. The metabolic syndrome. Lancet 2010, 375, 181–183. [Google Scholar] [CrossRef]
- Tinkov, A.A.; Ajsuvakova, O.P.; Filippini, T.; Zhou, J.C.; Lei, X.G.; Gatiatulina, E.R.; Michalke, B.; Skalnaya, M.G.; Vinceti, M.; Aschner, M.; et al. Selenium and selenoproteins in adipose tissue physiology and obesity. Biomolecules 2020, 10, 658. [Google Scholar] [CrossRef]
- Ding, J.; Liu, Q.; Liu, Z.; Guo, H.; Liang, J.; Zhang, Y. Associations of the dietary iron, copper, and selenium level with metabolic syndrome: A meta-analysis of observational studies. Front. Nutr. 2021, 8, 810494. [Google Scholar] [CrossRef]
- di Giuseppe, R.; Plachta-Danielzik, S.; Koch, M.; Nöthlings, U.; Schlesinger, S.; Borggrefe, J.; Both, M.; Müller, H.P.; Kassubek, J.; Jacobs, G.; et al. Dietary pattern associated with selenoprotein P and MRI-derived body fat volumes, liver signal intensity, and metabolic disorders. Eur. J. Nutr. 2019, 58, 1067–1079. [Google Scholar] [CrossRef]
- Wang, S.; Zhang, J.; Zhu, L.; Song, L.L.; Meng, Z.W.; Jia, Q.; Li, X.; Liu, N.; Hu, T.P.; Zhou, P.P.; et al. Association between liver function and metabolic syndrome in Chinese men and women. Sci. Rep. 2017, 7, 44844. [Google Scholar] [CrossRef]
- Renko, K.; Hofmann, P.J.; Stoedter, M.; Hollenbach, B.; Behrends, T.; Kohrle, J.; Schweizer, U.; Schomburg, L. Down-regulation of the hepatic selenoprotein biosynthesis machinery impairs selenium metabolism during the acute phase response in mice. FASEB J. 2009, 23, 1758–1765. [Google Scholar] [CrossRef]
- Hesse-Bahr, K.; Dreher, I.; Kohrle, J. The influence of the cytokines Il-1beta and INFgamma on the expression of selenoproteins in the human hepatocarcinoma cell line HepG2. Biofactors 2000, 11, 83–85. [Google Scholar] [CrossRef]
- Dallmeier, D.; Larson, M.G.; Vasan, R.S.; Keaney, J.F.; Fontes, J.D.; Meigs, J.B.; Fox, C.S.; Benjamin, E.J. Metabolic syndrome and inflammatory biomarkers: A community-based cross-sectional study at the Framingham Heart Study. Diabetol. Metab. Syndr. 2012, 4, 28. [Google Scholar] [CrossRef] [PubMed] [Green Version]
- Day, C.P.; James, O.F. Steatohepatitis: A tale of two “hits”? Gastroenterology 1998, 114, 842–845. [Google Scholar] [CrossRef]
- Gu, L.; Zhang, Y.; Zhang, S.; Zhao, H.; Wang, Y.; Kan, D.; Zhang, Y.; Guo, L.; Lv, J.; Hao, Q.; et al. Coix lacryma-jobi seed oil reduces fat accumulation in nonalcoholic fatty liver disease by inhibiting the activation of the p-AMPK/SePP1/ApoER2 pathway. J. Oleo Sci. 2021, 70, 685–696. [Google Scholar] [CrossRef] [PubMed]
- Burk, R.F.; Hill, K.E.; Motley, A.K.; Byrne, D.W.; Norsworthy, B.K. Selenium deficiency occurs in some patients with moderate-to-severe cirrhosis and can be corrected by administration of selenate but not selenomethionine: A randomized controlled trial. Am. J. Clin. Nutr. 2015, 102, 1126–1133. [Google Scholar] [CrossRef] [Green Version]
- Grgurevic, I.; Podrug, K.; Mikolasevic, I.; Kukla, M.; Madir, A.; Tsochatzis, E.A. Natural history of nonalcoholic fatty liver disease: Implications for clinical practice and an individualized approach. Can. J. Gastroenterol. Hepatol. 2020, 2020, 9181368. [Google Scholar] [CrossRef]
- Furukawa, S.; Fujita, T.; Shimabukuro, M.; Iwaki, M.; Yamada, Y.; Nakajima, Y.; Nakayama, O.; Makishima, M.; Matsuda, M.; Shimomura, I. Increased oxidative stress in obesity and its impact on metabolic syndrome. J. Clin. Investig. 2004, 114, 1752–1761. [Google Scholar] [CrossRef]
- Rudich, A.; Kanety, H.; Bashan, N. Adipose stress-sensing kinases: Linking obesity to malfunction. Trends Endocrinol. Metab. 2007, 18, 291–299. [Google Scholar] [CrossRef]
- Fontenelle, L.C.; Cardoso de Araújo, D.S.; da Cunha Soares, T.; Clímaco Cruz, K.J.; Henriques, G.S.; Marreiro, D.D.N. Nutritional status of selenium in overweight and obesity: A systematic review and meta-analysis. Clin. Nutr. 2022, 41, 862–884. [Google Scholar] [CrossRef]
- Chooi, Y.C.; Ding, C.; Magkos, F. The epidemiology of obesity. Metabolism 2019, 92, 6–10. [Google Scholar] [CrossRef] [Green Version]
- Consultation, W.H.O.E. Appropriate body-mass index for Asian populations and its implications for policy and intervention strategies. Lancet 2004, 363, 157–163. [Google Scholar] [CrossRef]
- Zierle-Ghosh, A.; Jan, A. Physiology, Body Mass Index. In StatPearls; StatPearls Publishing: Treasure Island, FL, USA, 2021. [Google Scholar]
- Letsiou, S.; Nomikos, T.; Panagiotakos, D.B.; Pergantis, S.A.; Fragopoulou, E.; Pitsavos, C.; Stefanadis, C.; Antonopoulou, S. Gender-specific distribution of selenium to serum selenoproteins: Associations with total selenium levels, age, smoking, body mass index, and physical activity. Biofactors 2014, 40, 524–535. [Google Scholar] [CrossRef] [PubMed]
- Traulsen, H.; Steinbrenner, H.; Buchczyk, D.P.; Klotz, L.O.; Sies, H. Selenoprotein P protects low-density lipoprotein against oxidation. Free Radic. Res. 2004, 38, 123–128. [Google Scholar] [CrossRef] [PubMed]
- Arteel, G.E.; Franken, S.; Kappler, J.; Sies, H. Binding of selenoprotein P to heparin: Characterization with surface plasmon resonance. Biol. Chem. 2000, 381, 265–268. [Google Scholar] [CrossRef] [PubMed]
- Esterbauer, H.; Gebicki, J.; Puhl, H.; Jurgens, G. The role of lipid peroxidation and antioxidants in oxidative modification of LDL. Free Radic. Biol. Med. 1992, 13, 341–390. [Google Scholar] [CrossRef]
- Matsuzawa, Y. Adiponectin: Identification, physiology and clinical relevance in metabolic and vascular disease. Atheroscler. Suppl. 2005, 6, 7–14. [Google Scholar] [CrossRef]
- Wang, Y.; Rijntjes, E.; Wu, Q.; Lv, H.; Gao, C.; Shi, B.; Schomburg, L. Selenium deficiency is linearly associated with hypoglycemia in healthy adults. Redox Biol. 2020, 37, 101709. [Google Scholar] [CrossRef]
- Mao, J.; Teng, W. The relationship between selenoprotein P and glucose metabolism in experimental studies. Nutrients 2013, 5, 1937–1948. [Google Scholar] [CrossRef] [Green Version]
- American Diabetes Association. Diagnosis and classification of diabetes mellitus. Diabetes Care 2010, 33 (Suppl. 1), S62–S69. [Google Scholar] [CrossRef] [Green Version]
- Matthews, D.R.; Hosker, J.P.; Rudenski, A.S.; Naylor, B.A.; Treacher, D.F.; Turner, R.C. Homeostasis model assessment: Insulin resistance and beta-cell function from fasting plasma glucose and insulin concentrations in man. Diabetologia 1985, 28, 412–419. [Google Scholar] [CrossRef] [Green Version]
- Hellwege, J.N.; Palmer, N.D.; Ziegler, J.T.; Langefeld, C.D.; Lorenzo, C.; Norris, J.M.; Takamura, T.; Bowden, D.W. Genetic variants in selenoprotein P plasma 1 gene (SEPP1) are associated with fasting insulin and first phase insulin response in Hispanics. Gene 2014, 534, 33–39. [Google Scholar] [CrossRef] [Green Version]
- Mao, J.Y.; Vanderlelie, J.J.; Perkins, A.V.; Redman, C.W.G.; Ahmadi, K.R.; Rayman, M.P. Genetic polymorphisms that affect selenium status and response to selenium supplementation in United Kingdom pregnant women. Am. J. Clin. Nutr. 2016, 103, 100–106. [Google Scholar] [CrossRef] [PubMed] [Green Version]
- Moriguchi Watanabe, L.; Bueno, A.C.; de Lima, L.F.; Ferraz-Bannitz, R.; Dessordi, R.; Guimaraes, M.P.; Foss-Freitas, M.C.; Barbosa, F.; Navarro, A.M. Genetically determined variations of selenoprotein P are associated with antioxidant, muscular, and lipid biomarkers in response to Brazil nut consumption by patients using statins. Br. J. Nutr. 2022, 127, 679–686. [Google Scholar] [CrossRef] [PubMed]
- Borenstein, M.; Hedges, L.V.; Higgins, J.P.; Rothstein, H.R. A basic introduction to fixed-effect and random-effects models for meta-analysis. Res. Synth. Methods 2010, 1, 97–111. [Google Scholar] [CrossRef] [PubMed]
- Tsiligianni, I.; Kocks, J.; Tzanakis, N.; Siafakas, N.; van der Molen, T. Factors that influence disease-specific quality of life or health status in patients with COPD: A systematic review and meta-analysis of Pearson correlations. Prim. Care Resp. J. 2011, 20, 257–268. [Google Scholar] [CrossRef]


| Study a | Country | Disease | n | Sample (Unit) | Detection Method b | Level c | ||
|---|---|---|---|---|---|---|---|---|
| Case | Control | Case | Control | |||||
| * Altinova et al., 2015 [17] | Turkey | GD | 30 | 35 | Plasma (ng/mL) | ELISA 2 | 6.2 (4.5–8.2) ♦ | 7.9 (4.5–10.7) ♦ |
| * Caviglia et al., 2020 [53] | Italy | NAFLD | 57 | Serum (ng/mL) | ELISA 1 | T3: 11.8 | ||
| # Cetindağlı et al., 2017 [26] | Turkey | NAFLD | 93 | 37 | Plasma (ng/mL) | ELISA 9 | 1574.2 ± 972.1 ♠ | 232.7 ± 371.05 ♠ |
| * Chen et al., 2017 [22] | Australia | OW/OB | 34 | 29 | Plasma (μg/mL) | ELISA 1 | 52.3 ± 39.1 ♠ | 14.5 ± 12.8 ♠ |
| # Chen et al., 2021 [59] | China | NAFLD | 79 | 79 | Serum (μg/mL) | ELISA 1 | 13.4 ± 7.0 ♠ | 11.1 ± 7.1 ♠ |
| # Cinemre et al., 2018 [15] | Turkey | GD | 86 | 90 | Plasma (ng/mL) | ELISA 8 | 35.29 ± 3.00 ♣ | 46.98 ± 4.59 ♣ |
| * di Giuseppe et al., 2017 [52] | Germany | MetS | Q1: 225; Q2: 227; Q3: 228; Q4: 225 | Serum (mg/mL) | ELISA 2 |
Q1: 2.86 (1.96–3.70) ♦; Q2: 4.52 (3.87–5.98) ♦; Q3: 6.05 (5.3–28.47) ♦; Q4: 11.72 (8.07–15.79) ♦ | ||
| * El-Kafrawy et al., 2021 [51] | Egypt | OW/OB | 50 | 40 | Serum (mg/L) | ELISA 7 | 16.18 ± 3.99 ♠ | 4.25 ± 4.27 ♠ |
| * Fan et al., 2019 [58] | China | T2D and NAFLD | T2D and NAFLD: 79; T2D: 61 | Serum (ng/mL) | ELISA 1 | T2D and NAFLD: 1341.11 ± 290.51 ♠; T2D: 755.77 ± 184.90 ♠ | ||
| * Flisiak-Jackiewicz et al., 2019 [25] | Poland | NAFLD Obesity | 34 86 | 52 24 | Serum (pg/mL) | ELISA 1 |
19449.5 (13327–28058) ♦ 21421 (11566–28058) ♦ |
21629 (10369.5–27976) ♦ 5411 (1618–15135) ♦ |
| * Gharipour et al., 2017 [49] | Iran | MetS | 65 | 71 | Serum (ng/mL) | ELISA 3 | 41.8 ± 6.57 ♣ | 81.5 ± 15.2 ♣ |
| # Gharipour et al., 2019 [50] | Iran | MetS | rs7579 GG: 29 | 30 | Serum (ng/mL) | ELISA 3 | 55.52 ± 16.78 ♣ | 109.48 ± 29.78 ♣ |
| rs7579 GA:18 | 22 | 36.65 ± 7.41 ♣ | 59.80 ± 22.06 ♣ | |||||
| rs7579 AA: 8 | 5 | 29.45 ± 1.97 ♣ | 26.65 ± 2.51 ♣ | |||||
| rs3877899 GG: 40 | 44 | 40.37 ± 8.44 ♣ | 83.91 ± 21.33 ♣ | |||||
| rs3877899 GA: 15 | 13 | 56.92 ± 23.34 ♣ | 86.42 ± 40.99 ♣ | |||||
| rs3877899 AA: 2 | 3 | 29.70 ± 4.1 ♣ | 81.95 ± 107.03 ♣ | |||||
| # Gonzalez de Vega et al., 2016 [43] | Spain | T2D | 78 | 24 | Plasma (ppb) | HPLC + ICP-MS | 41.9 ± 12.6 ♠ | 50.5 ± 19.1 ♠ |
| # Jiang et al., 2019 [57] | China | GD | 30 | 30 | Serum (mmol/L) | ELISA 1 | 4.85 ± 1.02 ♠ | 2.43 ± 1.04 ♠ |
| # Jin et al., 2020 [56] | China | DN | 100 | 100 | Serum (ng/mL) | ELISA 1 | 673.18 ± 86.94 ♠ | 973.84 ± 132.27 ♠ |
| * Jung et al., 2019 [60] | Korea | OW/OB | 35 | 35 | Serum (μg/mL) | ELISA 2 | 2.3 ± 0.1 ♣ | 1.5 ± 0.1 ♣ |
| * Ko et al., 2014 [48] | Korea | MetS | 94 | 116 | Serum (ng/mL) | ELISA 2 | 16.7 ± 2.2 ♥ | 28.6 ± 2.0 ♥ |
| * Larvie et al., 2019 [47] | America | OW/OB | 32 | 27 | Plasma (ng/mL) | ELISA 4 | 352.13 (276, 446) ♥ | 360.77 (290, 450) ♥ |
| * Misu et al., 2010 [46] | Japan | T2D | 12 | 9 | Serum (μg/mL) | ELISA 9 | 6.7 ± 0.9 ♣ | 5.1 ± 1.7 ♣ |
| * Oo et al., 2018 [45] | Japan | HG | 76 | Serum (μg/mL) | SPIA | Baseline: 2.51 ± 0.52 ♠ | ||
| * Pan et al., 2014 [55] | China | T2D | 156 | 64 | Serum (mmol/L) | ELISA 1 | 3.77 ± 1.79 ♠ | 2.34 ± 2.30 ♠ |
| * Polyzos et al., 2019 [24] | Greece | NAFLD | 31 | 27 | Serum (mg/L) | ELISA 5 | SS: 4.2 ± 0.3 ♣; Borderline NASH: 4.1 ± 0.4 ♣; Definite NASH: 3.0 ± 0.5 ♣ | 5 ± 0.2 ♣ |
| * Roman et al., 2010 [19] | Italy | T2D | 40 | 15 | Plasma (ng/mL) | HPLC + ICP-MS | 58 ± 9 ♠ | 56 ± 8 ♠ |
| * Sargeant et al., 2017 [23] | Britain | OW/OB | 11 | 11 | Plasma (μg/mL) | SPIA | 2.81 ± 0.30 ♠ | 3.01 ± 0.39 ♠ |
| * Yang et al., 2011 [18] | Korea | T2D PreD | 40 40 | 20 | Serum (ng/mL) | ELISA 1 | 1032.4 (495.9–2149.4) ♦; 867.3 (516.3–1582.7) ♦ | 62.0 (252.5–694.5) ♦ |
| # Zhang and Hao, 2018 [54] | China | T2D NAFLD | 100 100 | 100 100 | Serum (mmol/L) | ELISA 6 | 3.05 ± 1.20 ♠ 4.42 ± 1.80 ♠ | 2.33 ± 2.30 ♠ 2.33 ± 2.30 ♠ |
| # Zhang et al., 2019 [44] | China | T2D | 176 | 142 | Serum (ng/mL) | ELISA 1 | 1811.1 ± 36.3 ♣ | 1688.2 ± 40.5 ♣ |
Publisher’s Note: MDPI stays neutral with regard to jurisdictional claims in published maps and institutional affiliations. |
© 2022 by the authors. Licensee MDPI, Basel, Switzerland. This article is an open access article distributed under the terms and conditions of the Creative Commons Attribution (CC BY) license (https://creativecommons.org/licenses/by/4.0/).
Share and Cite
Yu, R.; Wang, Z.; Ma, M.; Xu, P.; Liu, L.; Tinkov, A.A.; Lei, X.G.; Zhou, J.-C. Associations between Circulating SELENOP Level and Disorders of Glucose and Lipid Metabolism: A Meta-Analysis. Antioxidants 2022, 11, 1263. https://doi.org/10.3390/antiox11071263
Yu R, Wang Z, Ma M, Xu P, Liu L, Tinkov AA, Lei XG, Zhou J-C. Associations between Circulating SELENOP Level and Disorders of Glucose and Lipid Metabolism: A Meta-Analysis. Antioxidants. 2022; 11(7):1263. https://doi.org/10.3390/antiox11071263
Chicago/Turabian StyleYu, Ruirui, Zhoutian Wang, Miaomiao Ma, Ping Xu, Longjian Liu, Alexey A. Tinkov, Xin Gen Lei, and Ji-Chang Zhou. 2022. "Associations between Circulating SELENOP Level and Disorders of Glucose and Lipid Metabolism: A Meta-Analysis" Antioxidants 11, no. 7: 1263. https://doi.org/10.3390/antiox11071263