Article

Optimization of the Aqueous Extraction of Phenolic Compounds from Olive Leaves

by
Chloe D. Goldsmith
1,*,
Quan V. Vuong
1,
Costas E. Stathopoulos
2,
Paul D. Roach
1 and
Christopher J. Scarlett
1
1
School of Environmental & Life Sciences, University of Newcastle, Ourimbah, NSW 2258, Australia
2
Faculty of Bioscience Engineering, Ghent University Global Campus, Incheon 406-840, South Korea
*
Author to whom correspondence should be addressed.
Antioxidants 2014, 3(4), 700-712; https://doi.org/10.3390/antiox3040700
Submission received: 5 August 2014 / Revised: 27 August 2014 / Accepted: 3 September 2014 / Published: 23 October 2014
(This article belongs to the Special Issue Natural Products as Antioxidants)

Abstract

:
Olive leaves are an agricultural waste of the olive-oil industry representing up to 10% of the dry weight arriving at olive mills. Disposal of this waste adds additional expense to farmers. Olive leaves have been shown to have a high concentration of phenolic compounds. In an attempt to utilize this waste product for phenolic compounds, we optimized their extraction using water—a “green” extraction solvent that has not yet been investigated for this purpose. Experiments were carried out according to a Box Behnken design, and the best possible combination of temperature, extraction time and sample-to-solvent ratio for the extraction of phenolic compounds with a high antioxidant activity was obtained using RSM; the optimal conditions for the highest yield of phenolic compounds was 90 °C for 70 min at a sample-to-solvent ratio of 1:100 g/mL; however, at 1:60 g/mL, we retained 80% of the total phenolic compounds and maximized antioxidant capacity. Therefore the sample-to-solvent ratio of 1:60 was chosen as optimal and used for further validation. The validation test fell inside the confidence range indicated by the RSM output; hence, the statistical model was trusted. The proposed method is inexpensive, easily up-scaled to industry and shows potential as an additional source of income for olive growers.

1. Introduction

Adherence to a Mediterranean-style diet has been associated with a reduced risk for cardiovascular disease and certain types of cancers [1]. These associations have been linked, in part, to the high consumption of olive oil, more specifically, the consumption of the unique phenolic compounds found in olive oil [2,3,4]. The same compounds believed to be responsible for the health-promoting properties attributed to olive oil consumption have also been identified in olive leaves [5]. Hence, the potential applications for the health promoting compounds extracted from olive leaves are extensive. These include their use as food additives or health supplements, as well as their continued use in future research into potential anti-cancer [6], anti-inflammatory [7] or anti-fungal [8] agents. It is therefore important to optimize the extraction of these compounds. An understanding of the parameters affecting the extraction of phenolic compounds is paramount to establishing the foundations for this future work.
Mediterranean countries account for around 98% of the world’s olive cultivation (approximately ten million hectares); they produce about 1.9 million metric tonnes per annum of olive oil and 1.1 million tonnes of table olives [9]. Olive leaves are an agricultural waste of the olive oil and table olive production industry. This waste is produced as a result of pruning olive trees during the growing season, as well as accounting for approximately 10% of the weight of materials received by olive mills. Currently, this by-product is not profitable, given that in many countries, olive leaves are used as animal feed or simply burned with excess branches gathered from pruning [10,11]. Many olive oil producers even charge a fee to the olive farmer for the disposal of olive leaves.
The market for natural additives and ingredients is rapidly growing, with some natural products obtaining high prices. Moreover, the possible toxicity of certain synthetic compounds [5,12] has led to an increased interest in natural product research from the cosmetic, pharmaceutical and food additive industries. This has led to improved extraction, fractionation and purification technologies being developed in the last few years. However, these modern purification and separation technologies can be expensive and sometimes hazardous, rendering it near impossible for farmers to profit directly.
A number of methods have been proposed for the extraction of phenolic compounds from olive leaves, including the use of advanced technologies, such as microwave, pressurized liquid extraction and ultra-sonic extraction methods [13,14,15]. However, these practices can often have high energy costs and lead to the production of excessive solvent waste, which can be more hazardous to dispose of than the actual agricultural waste itself. Therefore, there is a need for the development of “green” extraction procedures. Water is a cheap, non-hazardous polar extraction solvent. It has been shown to efficiently extract a vast array of phenolic compounds with high antioxidant activities from a number of plant materials [16,17,18].
Therefore, in the present study, we aimed to optimize the extraction of phenolic compounds from olive leaves using the inexpensive, non-hazardous and easily obtainable solvent, water. The parameters of time, temperature and sample-to-solvent ratio were chosen for optimization, as they are easy for farmers or processors to control. The influence of these extraction parameters on antioxidant activity was also investigated.

2. Experimental Section

2.1. Materials and Reagents

Folin–Ciocalteu’s reagent, sodium carbonate, gallic acid, 1,1-diphenyl-2-picrylhydrazyl (DPPH), 6-hydroxy-2,5,7,8-tetramethylchroman-2-carboxylic acid (trolox), 2,4,6-Tris(2-pyridyl)-s-triazine (TPTZ), ferric chloride, sodium acetate, acetic acid, copper (II) chloride, ammonium acetate (NH4Ac), neocuproine methanol and ethanol were purchased from Sigma Aldrich (Castle Hill, Australia). Ultra-pure (type 1) de-ionized (DI) water was prepared by reverse osmosis and filtration using a Mili-Q direct 16 system (Milipore Australia Pty Ltd., North Ryde, Australia).

2.2. Sample Preparation

Corregiola olive leaves were obtained from Houndsfield Estate in the Hunter Valley of NSW Australia. The leaves were dried at 120 °C for 90 min according to [19], ground to a size of 0.1 mm and stored at −20 °C until further analysis.

2.3. Response Surface Methodology (RSM)

The RSM with the Box–Behnken design was then employed to design the experiment to investigate the influence of three independent parameters, temperature, time and sample-to-solvent ratio, on the extraction of total phenolic compounds (TPC) and on the antioxidant activity of the resultant extracts. The optimal ranges of temperature (70–90 °C), time (50–70 min) and sample-to-solvent ratio (1:10–1:100 g/mL) were determined based on preliminary experiments. The independent variables and their code variable levels are shown in Table 1. To express the TPC or antioxidant capacity as a function of the independent variables, a second-order polynomial equation was used as follows and as previously described by Vuong et al. [20]: Y = β 0 + i = 1 k β i X i + i = 1 k = 1 j k β i j X i X j +   i = 1 k β i i X i 2 , where various Xi values are independent variables affecting the response Y; β0, βi, βii, and βij are the regression coefficients for the intercept and the linear, quadratic and interaction terms, respectively, and k is the number of variables.

2.4. Total Phenolic Compounds

The TPC was determined according to Thaipong et al. [21]. Briefly, the appropriately diluted samples (300 μL) were added to Folin–Ciocalteu’s reagent (300 μL) and left to equilibrate for 2 min before adding 2.4 mL of 5% sodium carbonate solution and incubating in the dark for 1 h. Absorbance was then read at 760 nm using a UV spectrophotometer (Varian, Melbourne, Australia). Gallic acid was used as the standard, and results were expressed as mg of gallic acid equivalents per g of sample (mg GAE/g).
Table 1. Values of the independent parameters and their coded forms with their symbols employed in RSM for optimization of olive leaf extraction using water.
Independent ParametersSymbols of the ParametersOriginal Values of the ParametersParameter Coded Forms *
Temperature (°C)X170
800
90+
Time (min)X250
600
70+
Ratio (mg/mL)X310
550
100+
* Parameter coded forms −, 0 and + are the minimum point, centre point and maximum point (respectively) for the independent parameters temperature, time and ratio.

2.5. Antioxidant Activity Assays

Three assays were employed in order to assess the antioxidant activity of the olive leaf extracts:
For the ferric reducing antioxidant power (FRAP) assay, the extract was diluted within the appropriate range, and then, their ferric ion reducing capacity was determined according to Thaipong et al. [21].
Stock solutions were: (1) 300 mM acetate buffer; (2) 10 mM TPTZ solution in 40 mM HCL; (3) 20 mM FeCl3 solution. The fresh working solution was prepared by mixing 25 mL acetate buffer, 2.5 mL TPTZ solution and 2.5 mL FeCl3 and then warming to 37 °C. Olive leaf extracts, standards and blanks (150 µL) were then added to 2.85 mL of the working FRAP solution and left to incubate in the dark at 37 °C for 30 min. Absorbance was read at 593 nm. Results were expressed as mg trolox equivalents per gram of sample dry weight (mg Trolox Equivalents (TE)/g).
For the cupric reducing antioxidant capacity (CUPRAC) assay, the extracts were diluted within the appropriate range, and their cupric ion reducing capacity was determined as described by Apak et al. [22].
The stock solutions were: (1) 10 mM CuCl2 solution; (2) ammonium acetate buffer at pH 7.0; (3) 7.5 mM neocuproine (Nc) solution in 95% ethanol. A working solution of the three reagents (1:1:1 v/v) was prepared, 3 mL of which was added to 1.1 mL of the diluted extracts, standards and blanks and left to react in the dark for 1 hour. Absorbance was read at 450 nm. Results were expressed as mg of trolox equivalents per gram of sample dry weight (mg TE/g).
The DPPH free radical scavenging activity of the extracts was analysed using the 1,1-diphenyl-2-picrylhydrazyl (DPPH) assay, as described by Vuong et al. [23]. Briefly, the appropriately diluted samples, standards and blank (150 µL) were added to 2.85 mL of DPPH working solution (made to an absorbance of 1.1 ± 0.01 at 760 nm) and left to react in a dark at room temperature for 3 h. Trolox was used as a standard. The results were expressed as mg of trolox equivalents per g of sample dry weight (mg TE/g).

2.6. Statistical Analysis

The RSM experimental design and analysis was conducted using JMP software (Version 11, SAS, Cary, NC, USA). The software was also used to establish the model equation, graph the 3D plot with 2D contour of the responses and to predict the optimum values for the three response variables in order to obtain the maximum TPC level. All experiments were carried out in triplicate.

3. Results and Discussion

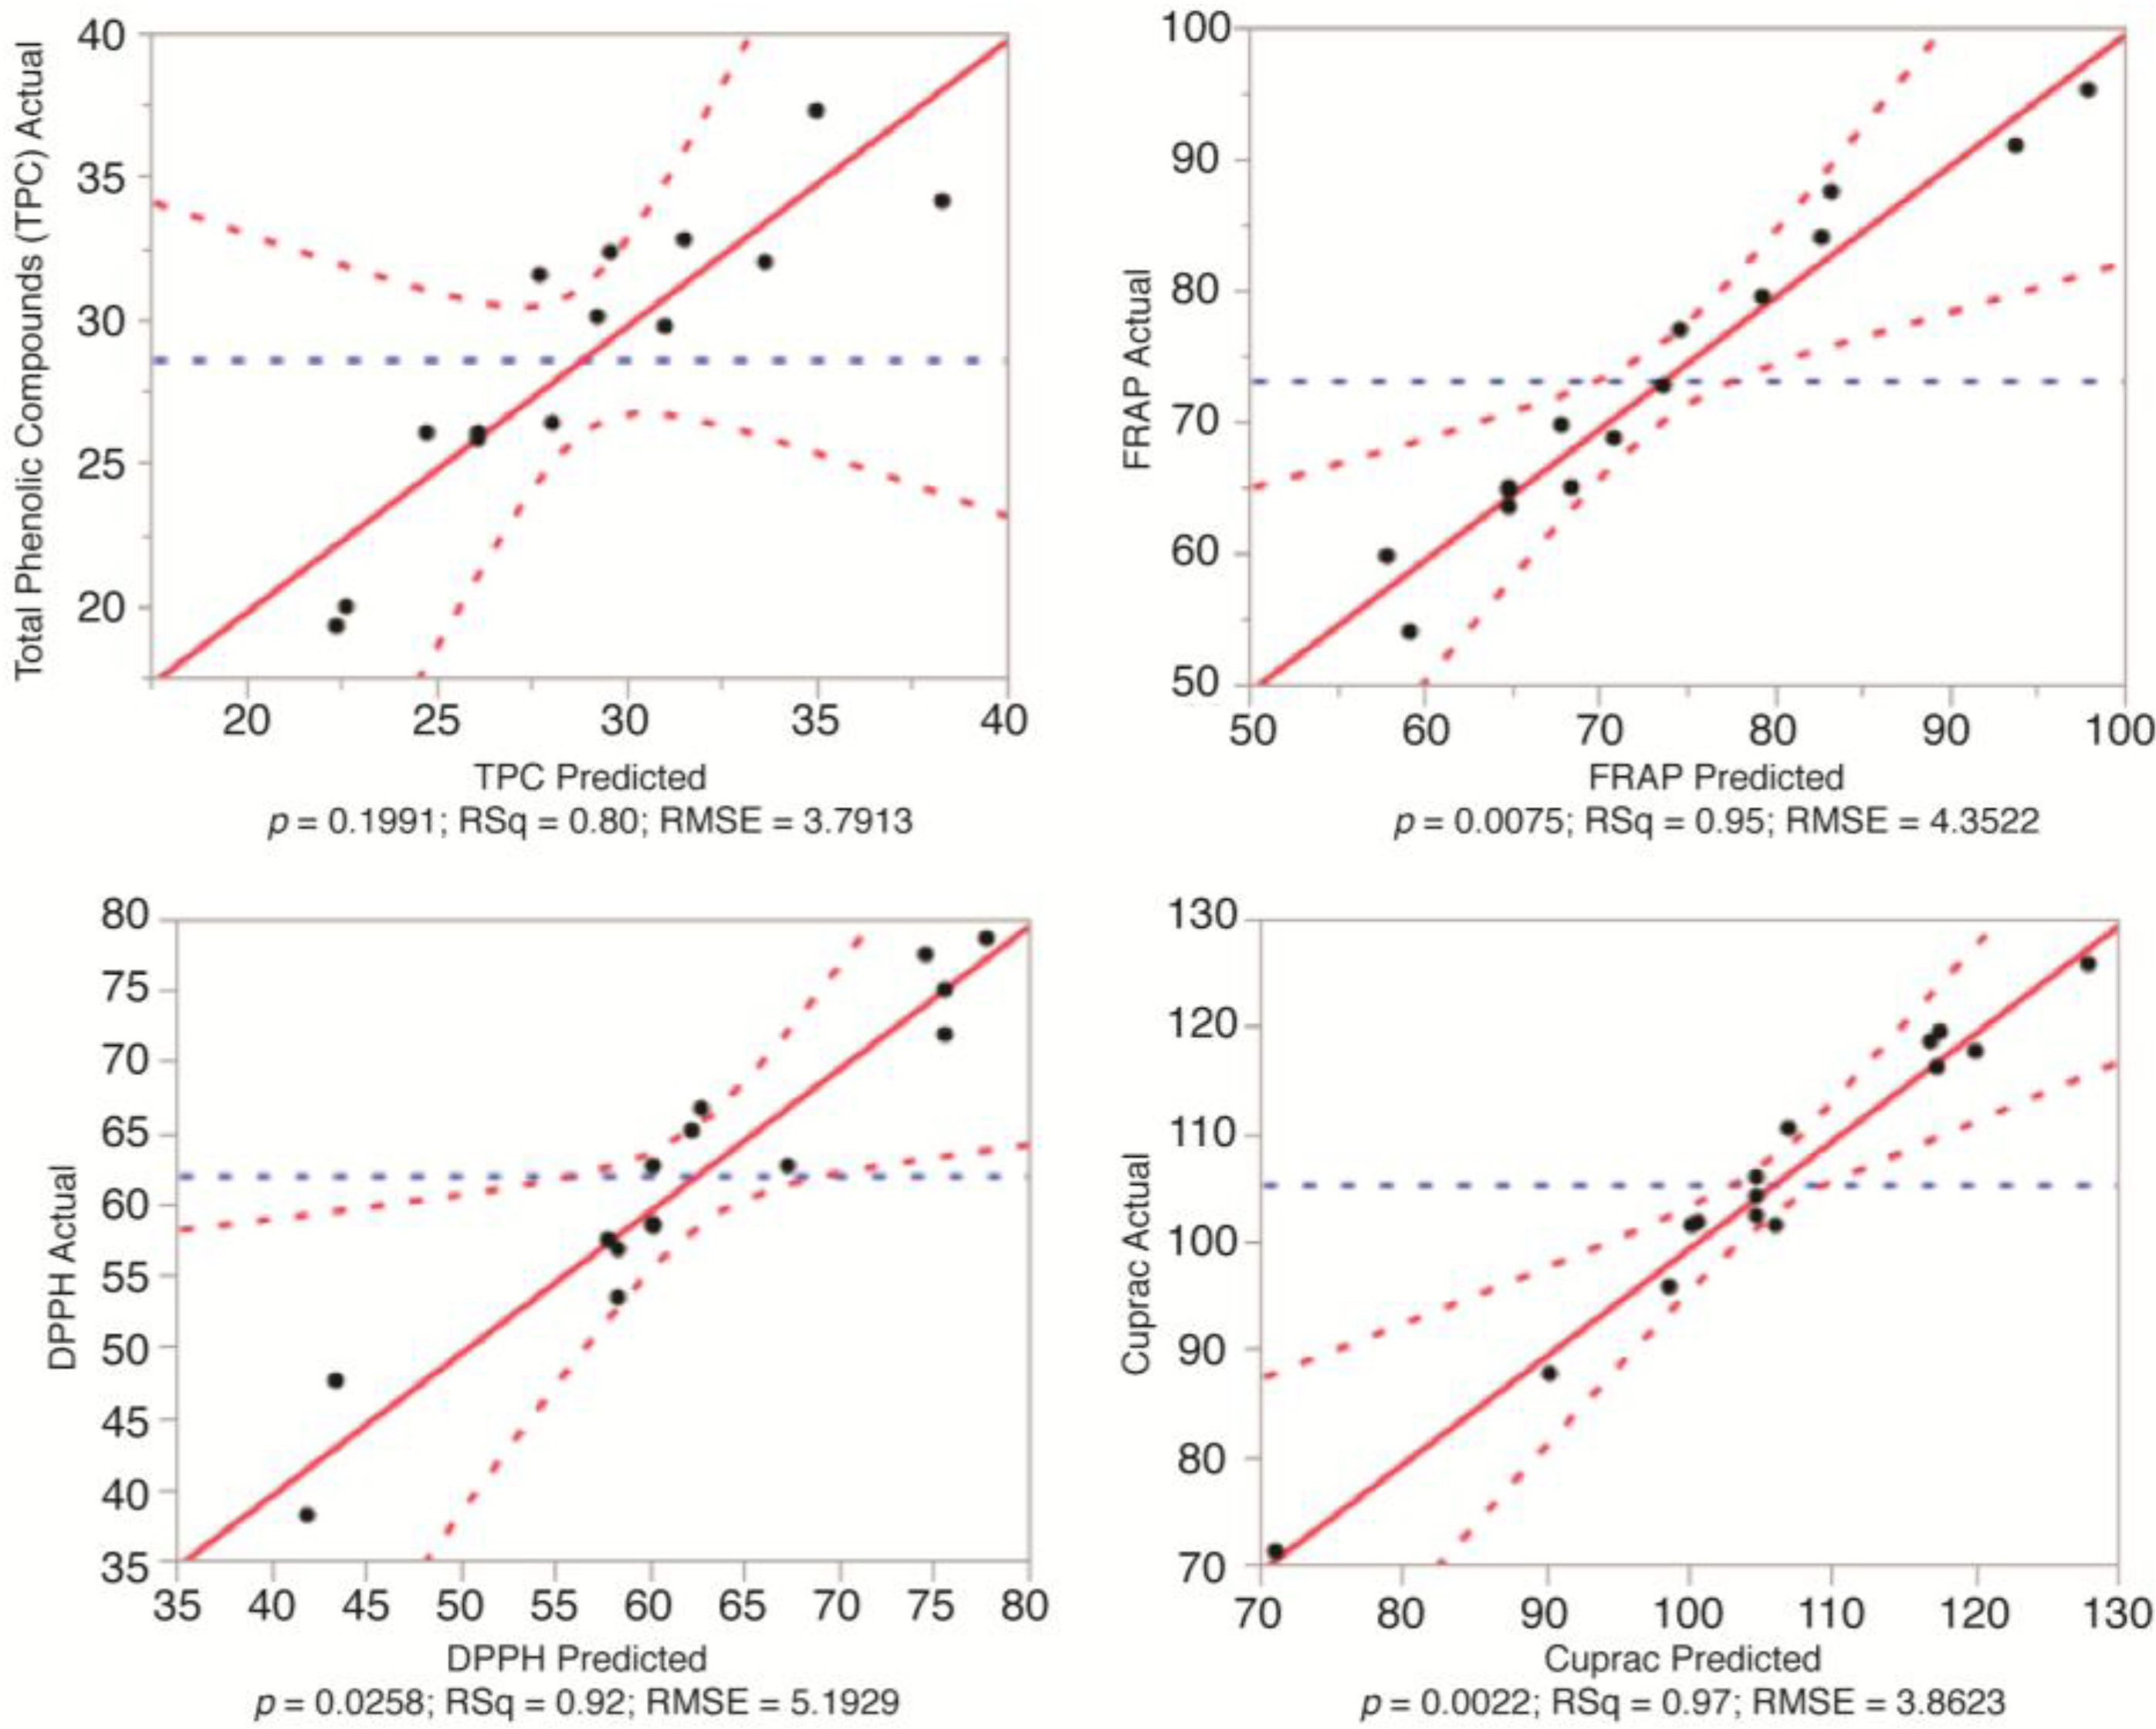
3.1. Fitting the Models for the Prediction of Total Phenolic Compounds and Antioxidant Capacity

The experimental design is presented in Table 1, while Table 2 indicates the effects of temperature, time and the ratio of sample-to-solvent on the extraction of TPC from olive leaves using water. The predicted yield of TPC ranged from 22.36 to 38.25 mg GAE/g depending on the combination of extraction parameters.
Table 2. Analysis of variance for the determination of the fit of the model. TPC, total phenolic compounds; FRAP, ferric reducing antioxidant power; CUPRAC, cupric reducing antioxidant capacity; PRESS, predicted residual sum of squares.
Sources of VariationTPCAntioxidant Capacity
FRAPCUPRACDPPH
Lack of fit (p-value)0.19910.0168 *0.13690.1377
R20.80.950.970.92
Adjusted R20.440.870.920.78
PRESS1149.11500.721097.51988.1
F-ratio of model2.202511.5419.66.639
p of model > F0.19910.0075 *0.0022 *0.0258 *
* Significant difference with p < 0.05.
Table 2 shows the reliability of the RSM mathematical model in predicting optimal variances and accurately representing the real interrelationships between the selected parameters. The results for the analysis of variances of the Box–Behnken design are shown in Table 2. Figure 1 indicates the correlation between the predicted and experimental values.
Figure 1 and Table 2 indicate that there was no significant difference between the actual and predicted values for TPC (p > 0.05). Furthermore, the coefficient of determination (R2) value for the correlation between the predicted and actual values was 0.8, indicating that the model can predict 80% of the actual data for TPC. Table 2 also showed that the “lack of fit” for the model was also not significant (p = 0.1991). In addition, the PRESS (predicted residual sum of squares) was 1149.1 and the F-ratio was 2.2025. PRESS is a measure of how well each point fits into the experimental design, further identifying the appropriateness of the model’s fit.
It was therefore concluded that the second-order polynomial equation for the following three independent variables could be used: temperature (X1), time (X2) and sample-to-solvent ratio (X3). The predictive equation for the response of total phenolic compounds (Y) was as follows:
Y = 26.02 + 1.31 X1 + 0.42 X2 + 4.88 X3 − 0.14 X1 X2 + 1.42 X1 X3 + 1.91 X2 X3 + (0.09 X1)2 + (3.79 X2)2 + (1.23 X3)2
Figure 1. Prediction profiler plots for the effects of the test parameters on the extraction of phenolic compounds from olive leaves.
Antioxidants 03 00700 g001
The model fit for the antioxidant activity of the olive leaf extract was also investigated. Figure 2, Figure 3 and Figure 4 show the relationship between the actual and predicted values, while Table 2 represents the analysis of variance results for the determination of the fit of the model. The p-values for the model fit were 0.0168, 0.1369 and 0.1377 for FRAP, CUPRAC and DPPH, respectively. This shows that there was no difference between actual and predicted values for CUPRAC and DPPH. However, there was a significant difference between the actual and predicted values for FRAP.
The coefficients of determination were 0.95, 0.97 and 0.92 for FRAP, CUPRAC and DPPH, respectively. This highlighted the close correlation between the actual and predicted values. This relationship is further supported with the values for PRESS and the F-ratios of the model: 1500.72 and 11.54 for FRAP, 1097.5 and 19.6 for CUPRAC and 1988.1 and 6.639 for DPPH, respectively. This indicated that the mathematical models were reliable predictors of the antioxidant activity of the olive leaf water extracts. Therefore, the following second order polynomials could be used:
FRAP:
Y = 64.66+ 10.51 X1 + 4.58 X2 + 7.45 X3 + 3.05 X1X2 + 2.16 X1X3 − 2.66 X2X3 + (7.39 X1)2 + (7.64 X2)2 + (1.4 X3)2
CUPRAC:
Y = 104.53+ 11.76 X1 + 1.91 X2 + 11.31 X3 + 2.06 X1 X2 − 6.14 X1 X3 − 2.27 X2 X3 + (1.01 X1)2 + (6.45 X2)2 − (5.33 X3)2
DPPH:
Y = 60.08+ 9.29 X1 + 0.39 X2 + 7.02 X3 + 0.68 X1 X2 − 3.4 X1 X3 − 8.98 X2 X3 + (4.43 X1)2 + (2.71 X2)2 − (3.03 X3)2
Figure 2. Correlation between the actual and the predicted values for the total phenolic compounds (TPC) and antioxidant capacity of olive leaf water extract (FRAP, DPPH and CUPRAC).
Antioxidants 03 00700 g002
Figure 3. 3D response surface and 2D contour plots for the effects of the test parameters on total phenolic compounds.
Antioxidants 03 00700 g003
Figure 4. 3D response surface and 2D contour plots for the effects of the test parameters on antioxidant activity.
Antioxidants 03 00700 g004

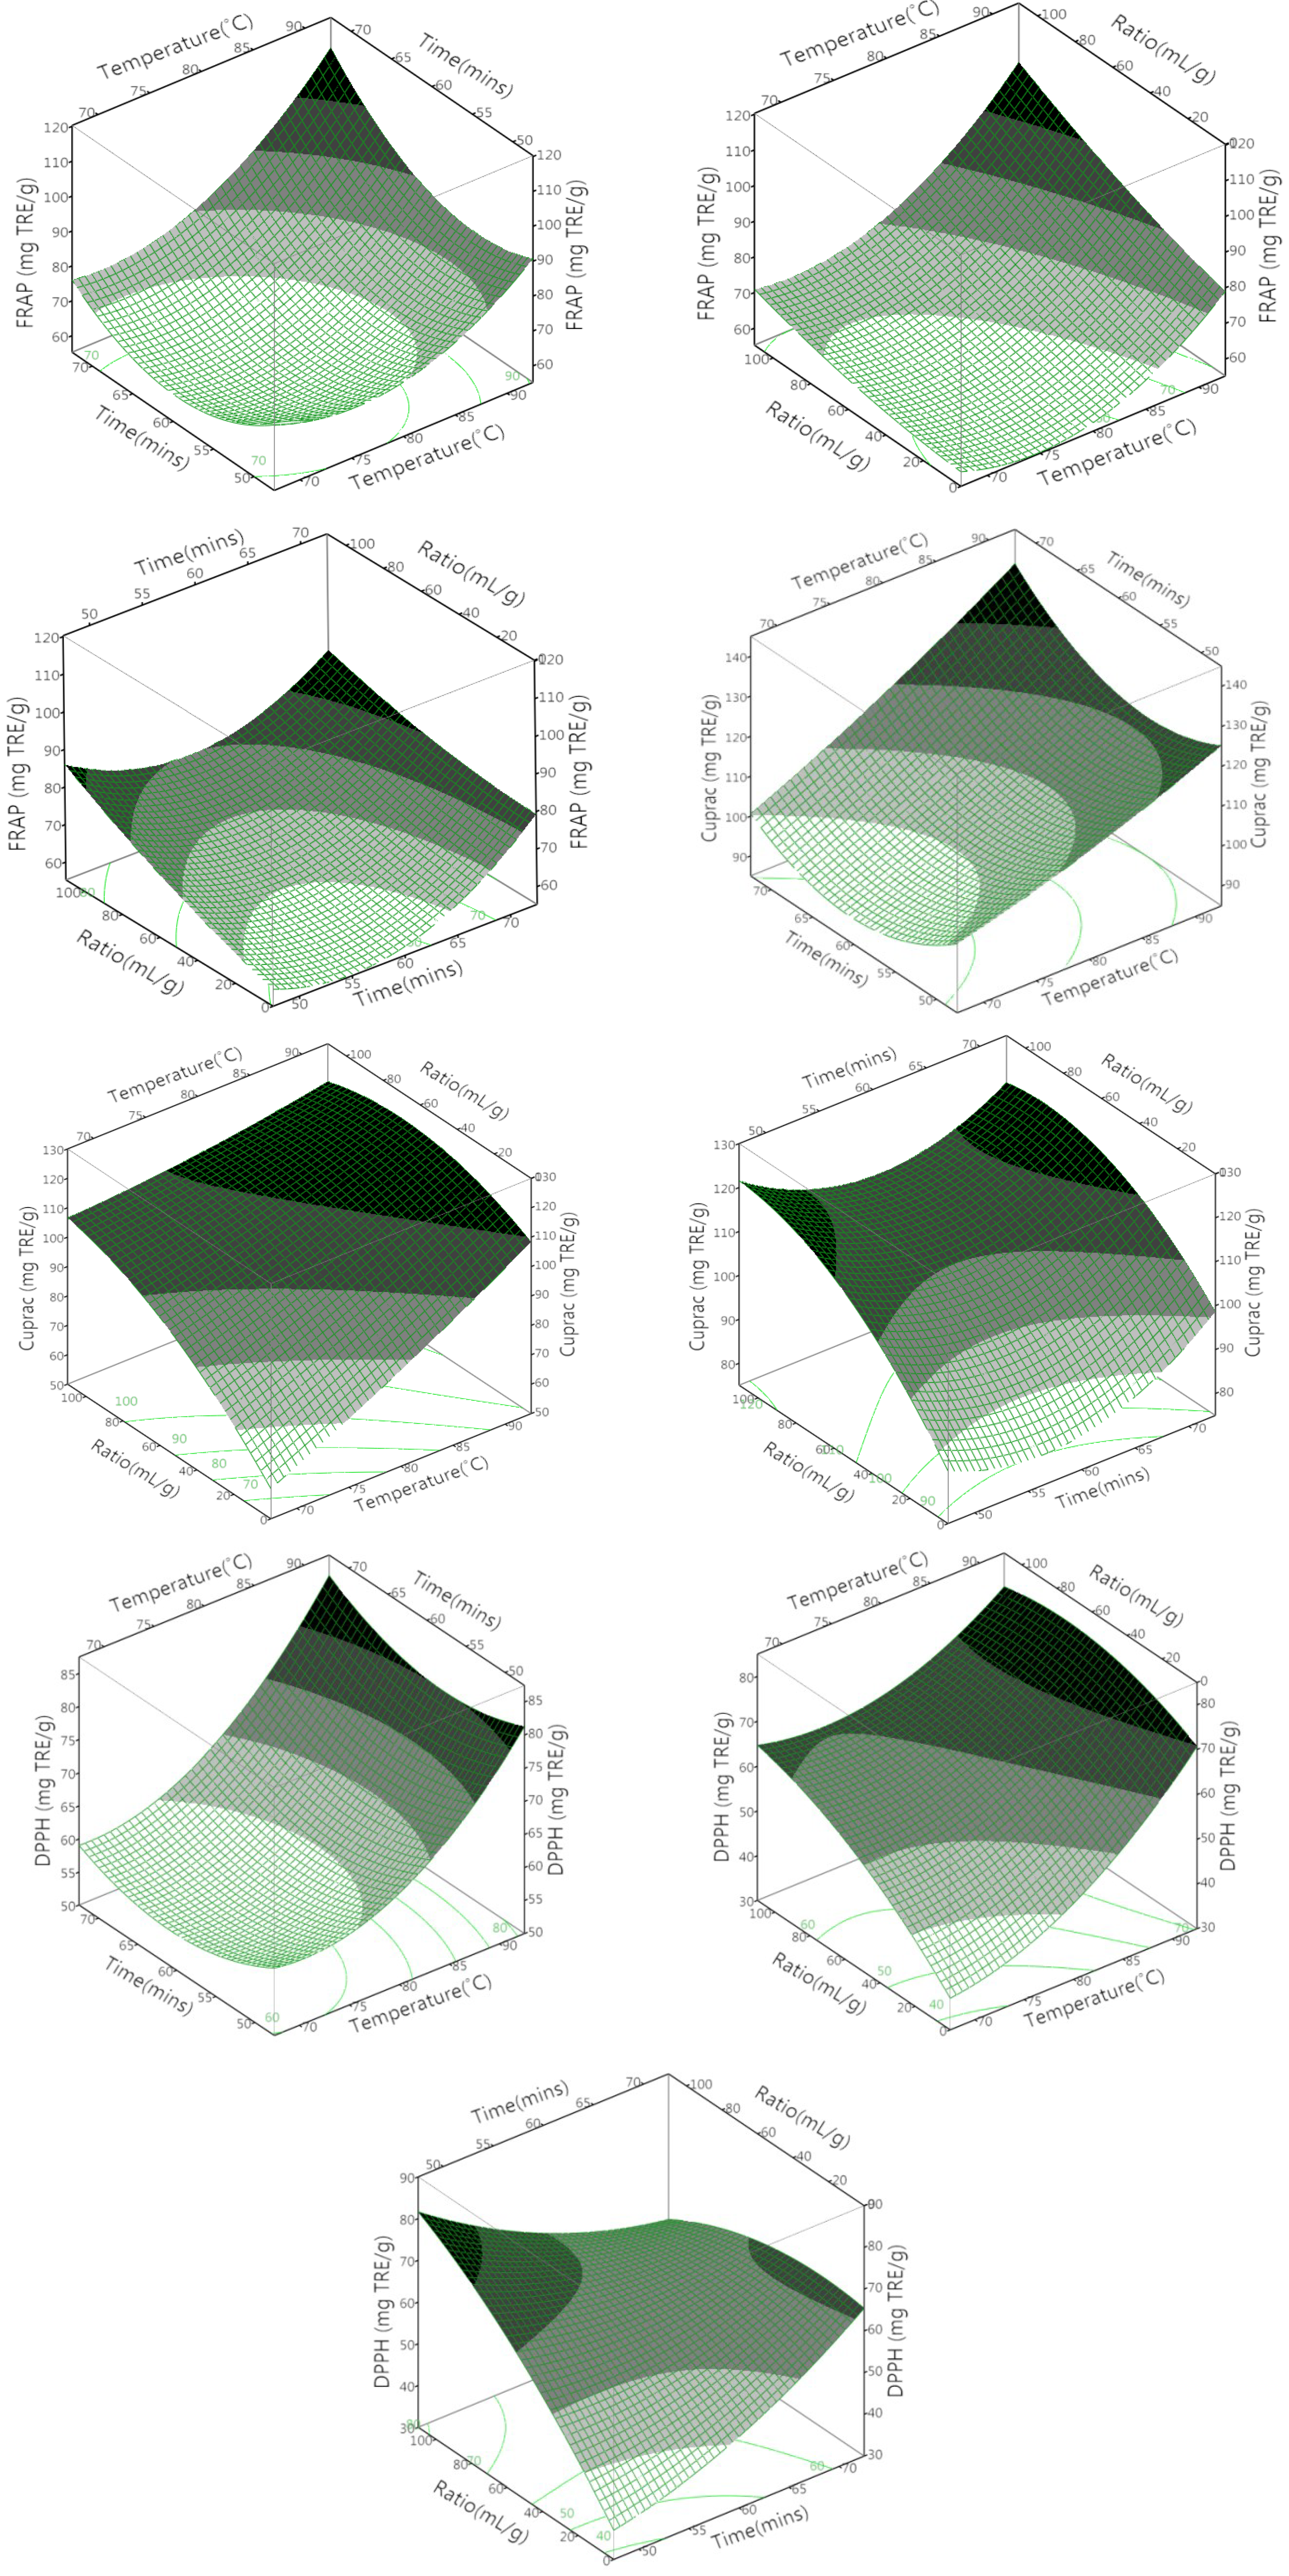
3.2. The Effect of the Different Variables on the Total Phenolic Compounds

Table 3 presents the linear regression coefficients and indicates their statistical significance. Temperature, time and ratio were all shown to have a positive influence on the extraction of TPC. However, the only parameter to significantly affect the extraction efficiency was the sample-to-solvent ratio (p = 0.01). Temperature and time had no significant effect on TPC (p > 0.05), nor did any of the various combinations of factors (temperature × time, temperature × ratio or time × ratio) (Table 3). This was unexpected, since time has previously been shown to have a significant effect on the extraction of TPC from olive leaves when using ultrasonic assistance [15]. Extraction time has also been identified as a significant extraction parameter for the extraction of natural polyphenols from wheat bran [24]. However, in both of these studies, the use of advanced technologies could account for the observed differences.
Table 3. The analysis of variance for the experimental results.
ParameterDFTPCAntioxidant Capacity
FrapDPPHCUPRAC
FProb > FFProb > FFProb > FFProb > F
β0126.02<0.000164.66<0.000160.08<0.0001104.53<0.0001
β111.310.3710.510.001 *9.290.004 *11.760.0003 *
β210.420.774.580.031 *0.390.841.910.22
β314.880.01 *7.450.005 *7.020.01 *11.310.0004 *
β121−0.140.943.050.220.680.82.060.34
β1311.420.492.160.37−3.40.25−6.140.02 *
β2311.910.36−2.660.28−8.980.02 *−2.270.29
β1110.090.967.390.02 *4.430.161.010.63
β2213.790.117.640.02 *2.710.366.450.02 *
β3311.230.561.40.56−3.030.31−5.33<0.05 *
* Significantly difference with p < 0.05; β0: intercept; β1, β2 and β3: linear regression coefficients for temperature, time and ratio; β12, β13 and β23: regression coefficients for interaction between temperature × time, temperature × ratio and time × ratio; β11, β22 and β33: quadratic regression coefficients for temperature × temperature, time × time and ratio × ratio; Prob = probability.
The sample-to-solvent ratio was shown to have a significant effect on the extraction of TPC. This is consistent with mass transfer principles, which outline that the concentration gradient (the driving force) is higher when there is more solvent present, leading to higher diffusion rates.

3.3. The Effect of the Different Variables on Antioxidant Activity

The temperature and ratio were both found to significantly impact the antioxidant activity of the olive leaf extract measured via FRAP, CUPRAC and DPPH (p = 0.001, 0.004, 0.0003, respectively). However, time was only shown to significantly affect the antioxidant capacity measured via FRAP. The temperature × ratio had a negative influence on the DPPH measurements (p < 0.05).

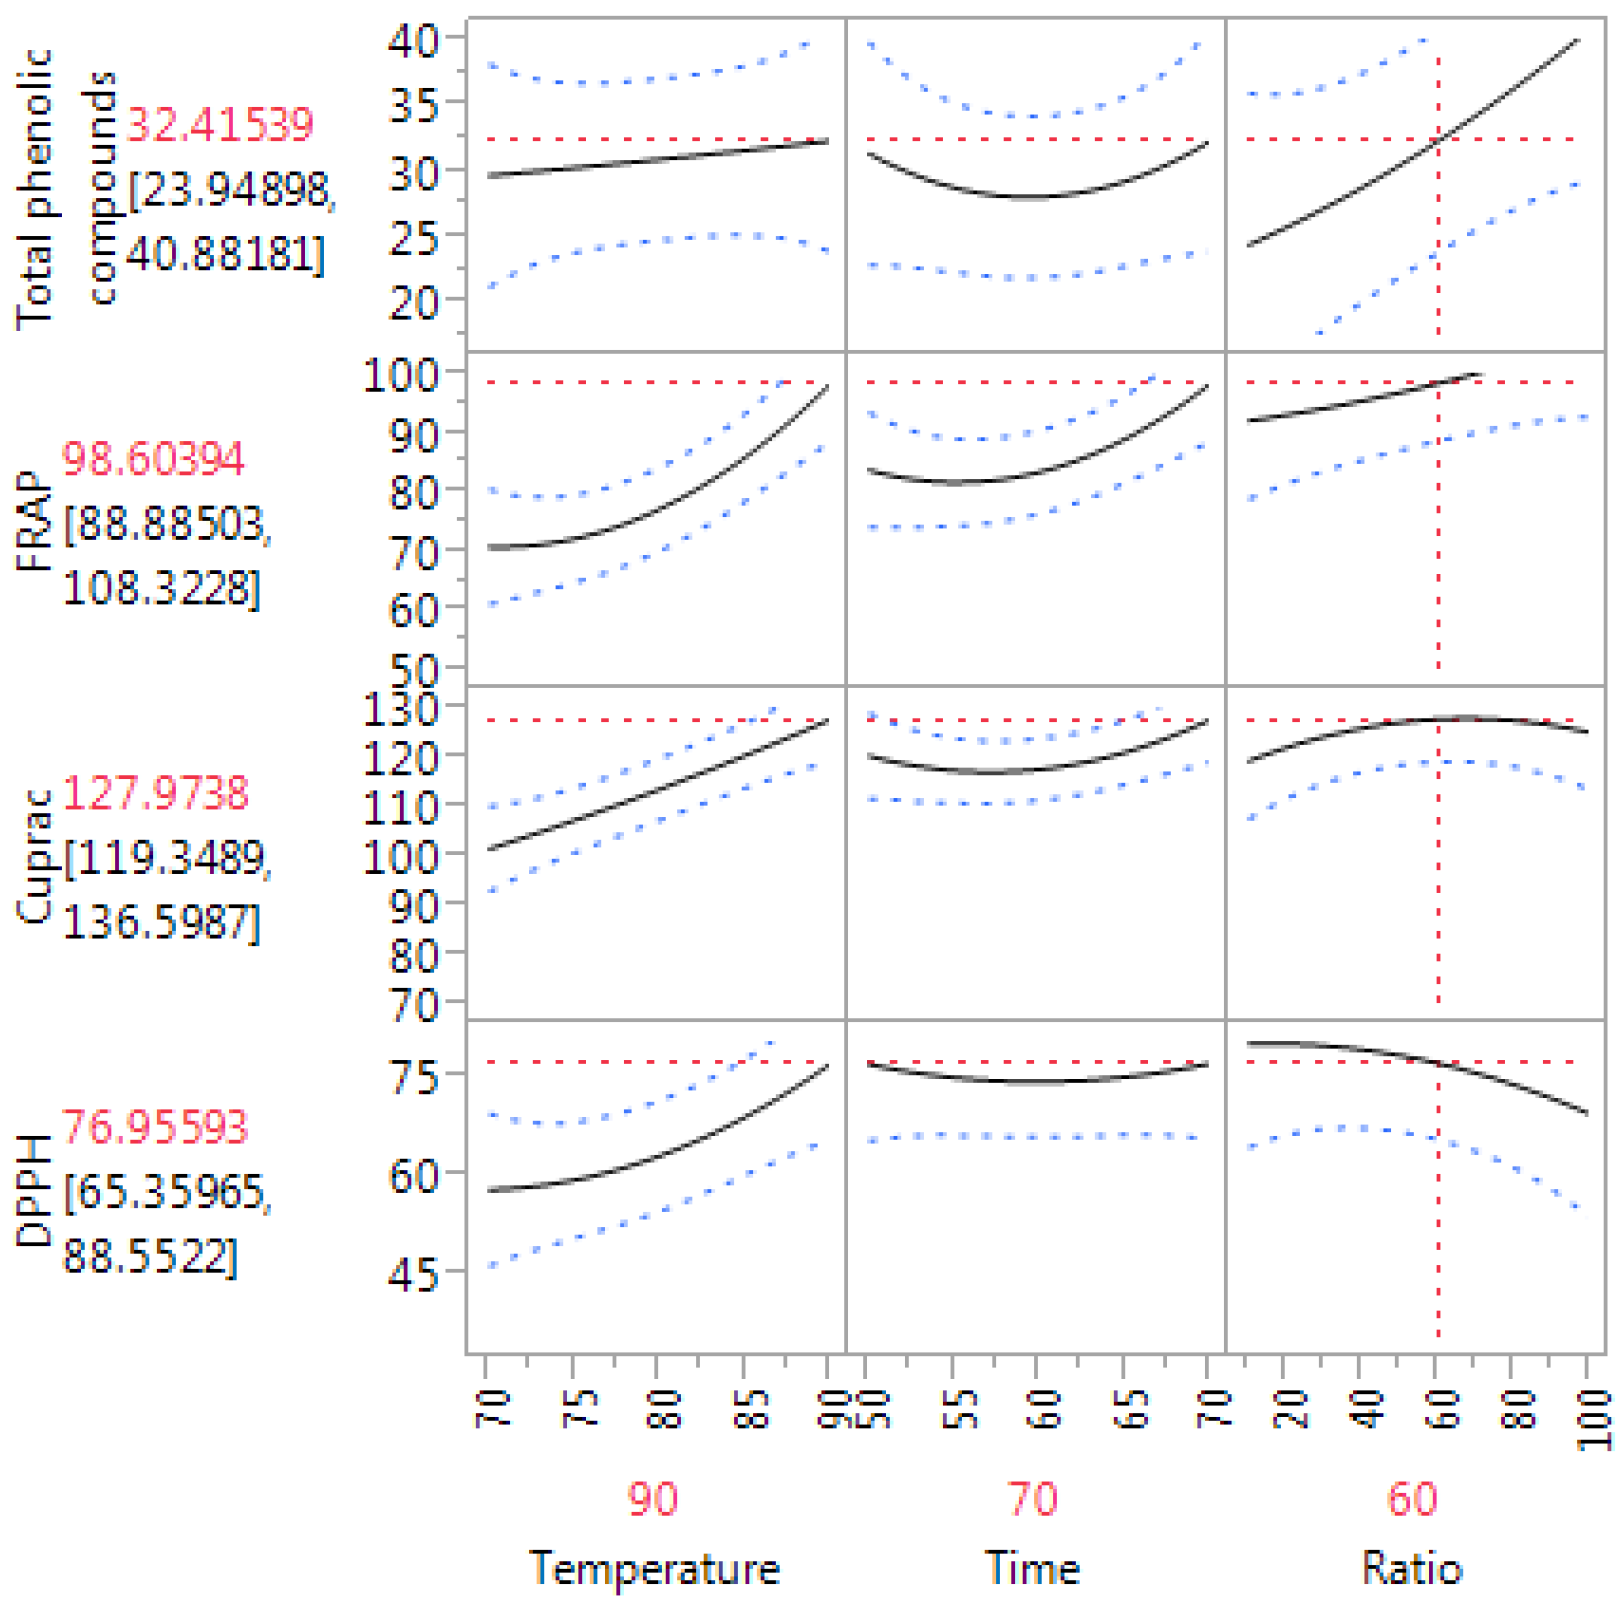
3.4. Optimization of Aqueous Extraction Conditions for Maximizing the Total Phenolic Content and Antioxidant Capacity of Olive Leaf Extract

Based on the predictive models shown in Figure 3 and Figure 4 the optimal conditions for the aqueous extraction of phenolic compounds were a temperature of 90 °C for 70 min at a sample-to-solvent ratio of 1:100 g/mL. These conditions were the same for the optimization of antioxidant capacity via FRAP. However, the optimal conditions for CUPRAC and DPPH varied slightly (CUPRAC: temperature 90 °C, time 70 min, sample-to-solvent ratio of 1:60 g/mL, DPPH: temperature 90 °C, time 70 min, sample-to-solvent ratio of 1:20 g/mL). Therefore, the extraction conditions of a temperature at 90 °C for 70 min and at a sample-to-solvent ratio of 1:60 g/mL were chosen for the extraction of phenolic compounds, as the extracts also displayed a high level of antioxidant activity. Furthermore, consuming less extraction solvent is practical from an economic point of view. For this reason, the sample-to-solvent ratio of 1:60 g/mL was used for validation. Increases in antioxidant activity with increasing temperature have previously been linked to the thermal degradation of higher molecular weight compounds into lower molecular weight ones [25,26]. This is one example of the non-specificity of the Folin–Ciocalteu method.
In order to validate the conditions predicted by the models, these extraction conditions (temperature 90 °C, time 70 min, sample-to-solvent ratio of 1:60 g/mL) were tested. The resulting values fell inside of the predicted ranges for TPC and all three antioxidant capacity assays (Table 4). These conditions are therefore proposed as optimal for the aqueous extraction of phenolic compounds with a high antioxidant capacity from olive leaves.
Table 4. Validation of the experimental model. GAE, gallic acid equivalents.
AssayValues of TPC and Antioxidant Capacity
PredictedExperimental (n = 3)
TPC (mg GAE/g)32.42 ± 8.6632.4 ± 2.06
FRAP (mg TE/g)98.6 ± 9.7191.03 ± 6.13
DPPH (mg TE/g)76.96 ± 11.5685.26 ± 3.54
CUPRAC (mg TE/g)127.97 ± 8.62121.97 ± 5.45

4. Conclusions

The optimal conditions for the aqueous extraction of phenolic compounds from olive leaves were proposed to be at 90 °C for 70 min at a sample-to-solvent ratio of 1:60 g/mL. Using olive leaves as a starting material for the extraction of phenolic compounds via this simple and inexpensive method constitutes a viable use for this agricultural waste product and may potentially serve as an additional source of income for olive growers/olive oil producers.

Acknowledgments

We acknowledge the following funding support: Ramaciotti Foundation (ES2012/0104); Cancer Australia and Cure Cancer Australia Foundation (1033781); The University of Newcastle; Terrigal Trotters; and special thanks to Christine and Jo Ashcroft for providing all samples.

Author Contributions

Chloe Goldsmith participated in the experimental design and completion, as well as interpretation, manuscript design and preparation. Quan Vuong and Costas Stathopoulos participated in the experimental design and data interpretation. Chris Scarlett and Paul Roach participated in manuscript design and preparation. All authors read and approved the final manuscript.

Conflicts of Interest

The authors declare no conflict of interest.

References

  1. Trichopoulou, A.; Lagiou, P.; Kuper, H.; Trichopoulos, D. Cancer and Mediterranean dietary traditions. Cancer Epidemiol. Biomark. Prev. 2000, 9, 869–873. [Google Scholar]
  2. Covas, M.I. Olive oil and the cardiovascular system. Pharmacol. Res. 2007, 55, 175–186. [Google Scholar] [CrossRef] [PubMed]
  3. Cicerale, S.; Conlan, X.A.; Sinclair, A.J.; Keast, R.S. Chemistry and health of olive oil phenolics. Crit. Rev. Food Sci. Nutr. 2009, 49, 218–236. [Google Scholar] [CrossRef] [PubMed]
  4. Bogani, P.; Galli, C.; Villa, M.; Visiolia, F. Postprandial anti-inflammatory and antioxidant effects of extra virgin olive oil. Atherosclerosis 2007, 190, 181–186. [Google Scholar] [CrossRef] [PubMed]
  5. Goulas, V.; Exarchou, V.; Troganis, A.N.; Psomiadou, E.; Fotsis, T.; Briasoulis, E.; Gerothanassis, I.P. Phytochemicals in olive-leaf extracts and their antiproliferative activity against cancer and endothelial cells. Mol. Nutr. Food Res. 2009, 53, 600–608. [Google Scholar] [CrossRef] [PubMed]
  6. Fabiani, R.; de Bartolomeo, A.; Rosignoli, P.; Servili, M.; Montedoro, G.F.; Morozzi, G. Cancer chemoprevention by hydroxytyrosol isolated from virgin olive oil through G1 cell cycle arrest and apoptosis. Eur. J. Cancer Prev. 2002, 11, 351–358. [Google Scholar] [CrossRef] [PubMed]
  7. Beauchamp, G.K.; Keast, R.S.J.; Morel, D.; Lin, J.; Pika, J.; Han, Q.; Lee, C.-H.; Smith, A.B.; Breslin, P.A.S. Phytochemistry: Ibuprofen-like activity in extra-virgin olive oil. Nature 2005, 437, 45–46. [Google Scholar] [CrossRef] [PubMed]
  8. Bisignano, G.; Tomaino, A.; Lo Cascio, R.; Crisafi, G.; Uccella, N.; Saija, A. On the in vitro antimicrobial activity of oleuropein and hydroxytyrosol. J. Pharm. Pharmacol. 1999, 51, 971–974. [Google Scholar] [CrossRef] [PubMed]
  9. Hashim, Y.Z.; Rowland, I.R.; McGlynn, H.; Servili, M.; Selvaggini, R.; Taticchi, A.; Esposto, S.; Montedoro, G.; Kaisalo, L.; Wähälä, K.; et al. Inhibitory effects of olive oil phenolics on invasion in human colon adenocarcinoma cells in vitro. Int. J. Cancer 2008, 122, 495–500. [Google Scholar] [CrossRef] [PubMed]
  10. Tsatsanis, C.; Androulidaki, A.; Venihaki, M.; Margioris, A.N. Signalling networks regulating cyclooxygenase-2. Int. J. Biochem. Cell Biol. 2006, 38, 1654–1661. [Google Scholar] [CrossRef] [PubMed]
  11. Sebolt-Leopold, J.S.; Herrera, R. Targeting the mitogen-activated protein kinase cascade to treat cancer. Nat. Rev. Cancer 2004, 4, 937–947. [Google Scholar] [CrossRef] [PubMed]
  12. Femia, A.P.; Dolara, P.; Servili, M.; Esposto, S.; Taticchi, A.; Urbani, S.; Giannini, A.; Salvadori, M.; Caderni, G. No effects of olive oils with different phenolic content compared to corn oil on 1,2-dimethylhydrazine-induced colon carcinogenesis in rats. Eur. J. Nutr. 2008, 47, 329–334. [Google Scholar] [CrossRef] [PubMed]
  13. Xynos, N.; Papaefstathioua, G.; Gikasb, E.; Argyropouloua, A.; Aligiannisa, N.; Skaltsounisa, A.-L. Design optimization study of the extraction of olive leaves performed with pressurized liquid extraction using response surface methodology. Sep. Purif. Technol. 2014, 122, 323–330. [Google Scholar] [CrossRef]
  14. Taamalli, A.; Arráez-Román, D.; Ibañez, E.; Zarrouk, M.; Segura-Carretero, A.; Fernández-Gutiérrez, A. Optimization of microwave-assisted extraction for the characterization of olive leaf phenolic compounds by using HPLC-ESI-TOF-MS/IT-MS2. J. Agric. Food Chem. 2012, 60, 791–798. [Google Scholar] [CrossRef] [PubMed]
  15. Şahin, S.; Şamlı, R. Optimization of olive leaf extract obtained by ultrasound-assisted extraction with response surface methodology. Ultrason. Sonochem. 2013, 20, 595–602. [Google Scholar] [CrossRef] [PubMed]
  16. Robards, K.; Obied, H.K.; Bedgood, D.R., Jr.; Prenzler, P.D. Bioscreening of Australian olive mill waste extracts: Biophenol content, antioxidant, antimicrobial and molluscicidal activities. Food Chem. Toxicol. 2007, 45, 1238–1248. [Google Scholar] [CrossRef] [PubMed]
  17. Busnena, B.A.; Foudah, A.I.; Melancon, T.; El Sayed, K.A. Olive secoiridoids and semisynthetic bioisostere analogues for the control of metastatic breast cancer. Bioorg. Med. Chem. 2013, 21, 2117–2127. [Google Scholar] [CrossRef] [PubMed]
  18. Scotece, M.; Gómez, R.; Conde, J.; Lopez, V.; Gómez-Reino, J.J.; Lago, F.; Smith, A.B., III; Gualillo, O. Oleocanthal inhibits proliferation and MIP-1α expression in human multiple myeloma cells. Curr. Med. Chem. 2013, 20, 2467–2475. [Google Scholar] [CrossRef]
  19. Malik, N.S.; Bradford, J.M. Recovery and stability of oleuropein and other phenolic compounds during extraction and processing of olive (Olea europaea L.) leaves. J. Food Agric. Environ. 2008, 6, 8–13. [Google Scholar]
  20. Vuong, Q.V.; Stathopoulos, C.E.; Golding, J.B.; Nguyen, M.H.; Roach, P.D. Optimum conditions for the water extraction of l-theanine from green tea. J. Sep. Sci. 2011, 34, 2468–2474. [Google Scholar] [CrossRef] [PubMed]
  21. Thaipong, K.; Boonprakob, U.; Crosby, K.; Cisneros-Zevallos, L.; Byrne, D.H. Comparison of ABTS, DPPH, FRAP, and ORAC assays for estimating antioxidant activity from guava fruit extracts. J. Food Compos. Anal. 2006, 19, 669–675. [Google Scholar] [CrossRef]
  22. Apak, R.; Güçlü, K.; Özyürek, M.; Karademir, S.E. Novel total antioxidant capacity index for dietary polyphenols and vitamins C and E, using their cupric ion reducing capability in the presence of neocuproine: CUPRAC method. J. Agric. Food Chem. 2004, 52, 7970–7981. [Google Scholar] [CrossRef]
  23. Vuong, Q.V.; Hiruna, S.; Roach, P.D.; Bowyer, M.C.; Phillips, P.A.; Scarletta, C.J. Effect of extraction conditions on total phenolic compounds and antioxidant activities of Carica papaya leaf aqueous extracts. J. Herb. Med. 2013, 3, 104–111. [Google Scholar] [CrossRef]
  24. Wang, J.; Sun, B.; Cao, Y.; Tian, Y; Li, X. Optimisation of ultrasound-assisted extraction of phenolic compounds from wheat bran. Food Chem. 2008, 106, 804–810. [Google Scholar] [CrossRef]
  25. Goldsmith, C.D.; Stathopoulos, C.E.; Golding, J.B.; Roach, P.D. Fate of phenolic compounds during olive oil production with the traditional press method. I. Food Res. J. 2014, 21, 101–109. [Google Scholar]
  26. Klen, T.J.; Vodopivec, B.M. The fate of olive fruit phenols during commercial olive oil processing: Traditional press versus continuous two- and three-phase centrifuge. LWT-Food Sci. Technol. 2012, 49, 267–274. [Google Scholar] [CrossRef]

