Chemical Analysis of Astragali Complanati Semen and Its Hypocholesterolemic Effect Using Serum Metabolomics Based on Gas Chromatography-Mass Spectrometry

 , ,
, ,
Abstract
:1. Introduction
2. Materials and Methods
2.1. Chemical and Solvents
2.2. Preparation of Extract of Astragali Complanati Semen (ACS)
2.3. Total Phenolic Quantification
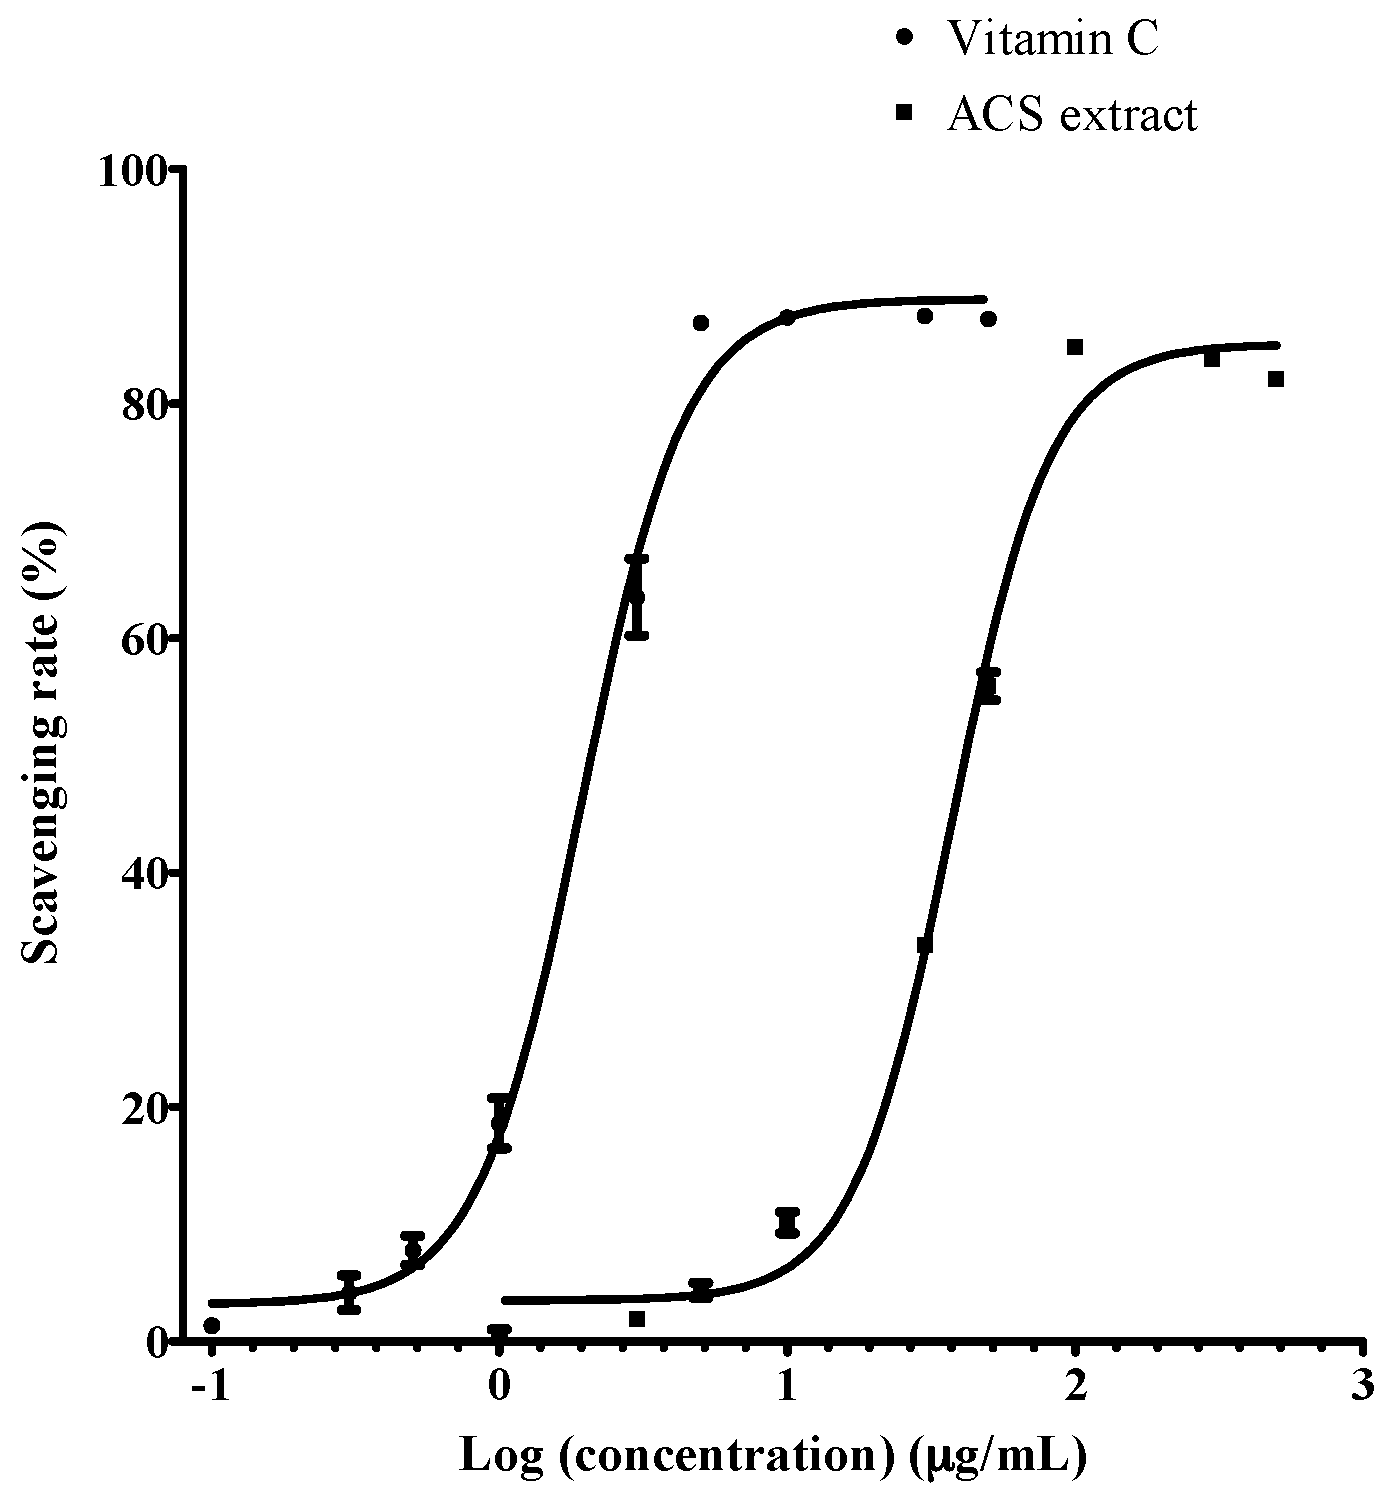
2.4. DPPH Free Radical Scavenging Activity
2.5. Chemical Analysis of ACS by Ultra-Performance Liquid Chromatography Coupled with Electrospray Ionization-Orbitrap-Mass Spectrometry (UPLC-ESI-Orbitrap-MS)
2.6. Animals and Experimental Treatment
2.7. Analysis of Serum Lipid Profiles
2.8. Metabolomics Analysis
2.8.1. GC-MS Sample Preparation Method
2.8.2. GC-MS Condition
2.8.3. Data Processing and Analysis
2.9. Western Blot Immunoreactivity Assay
2.10. Statistical Analysis
3. Results
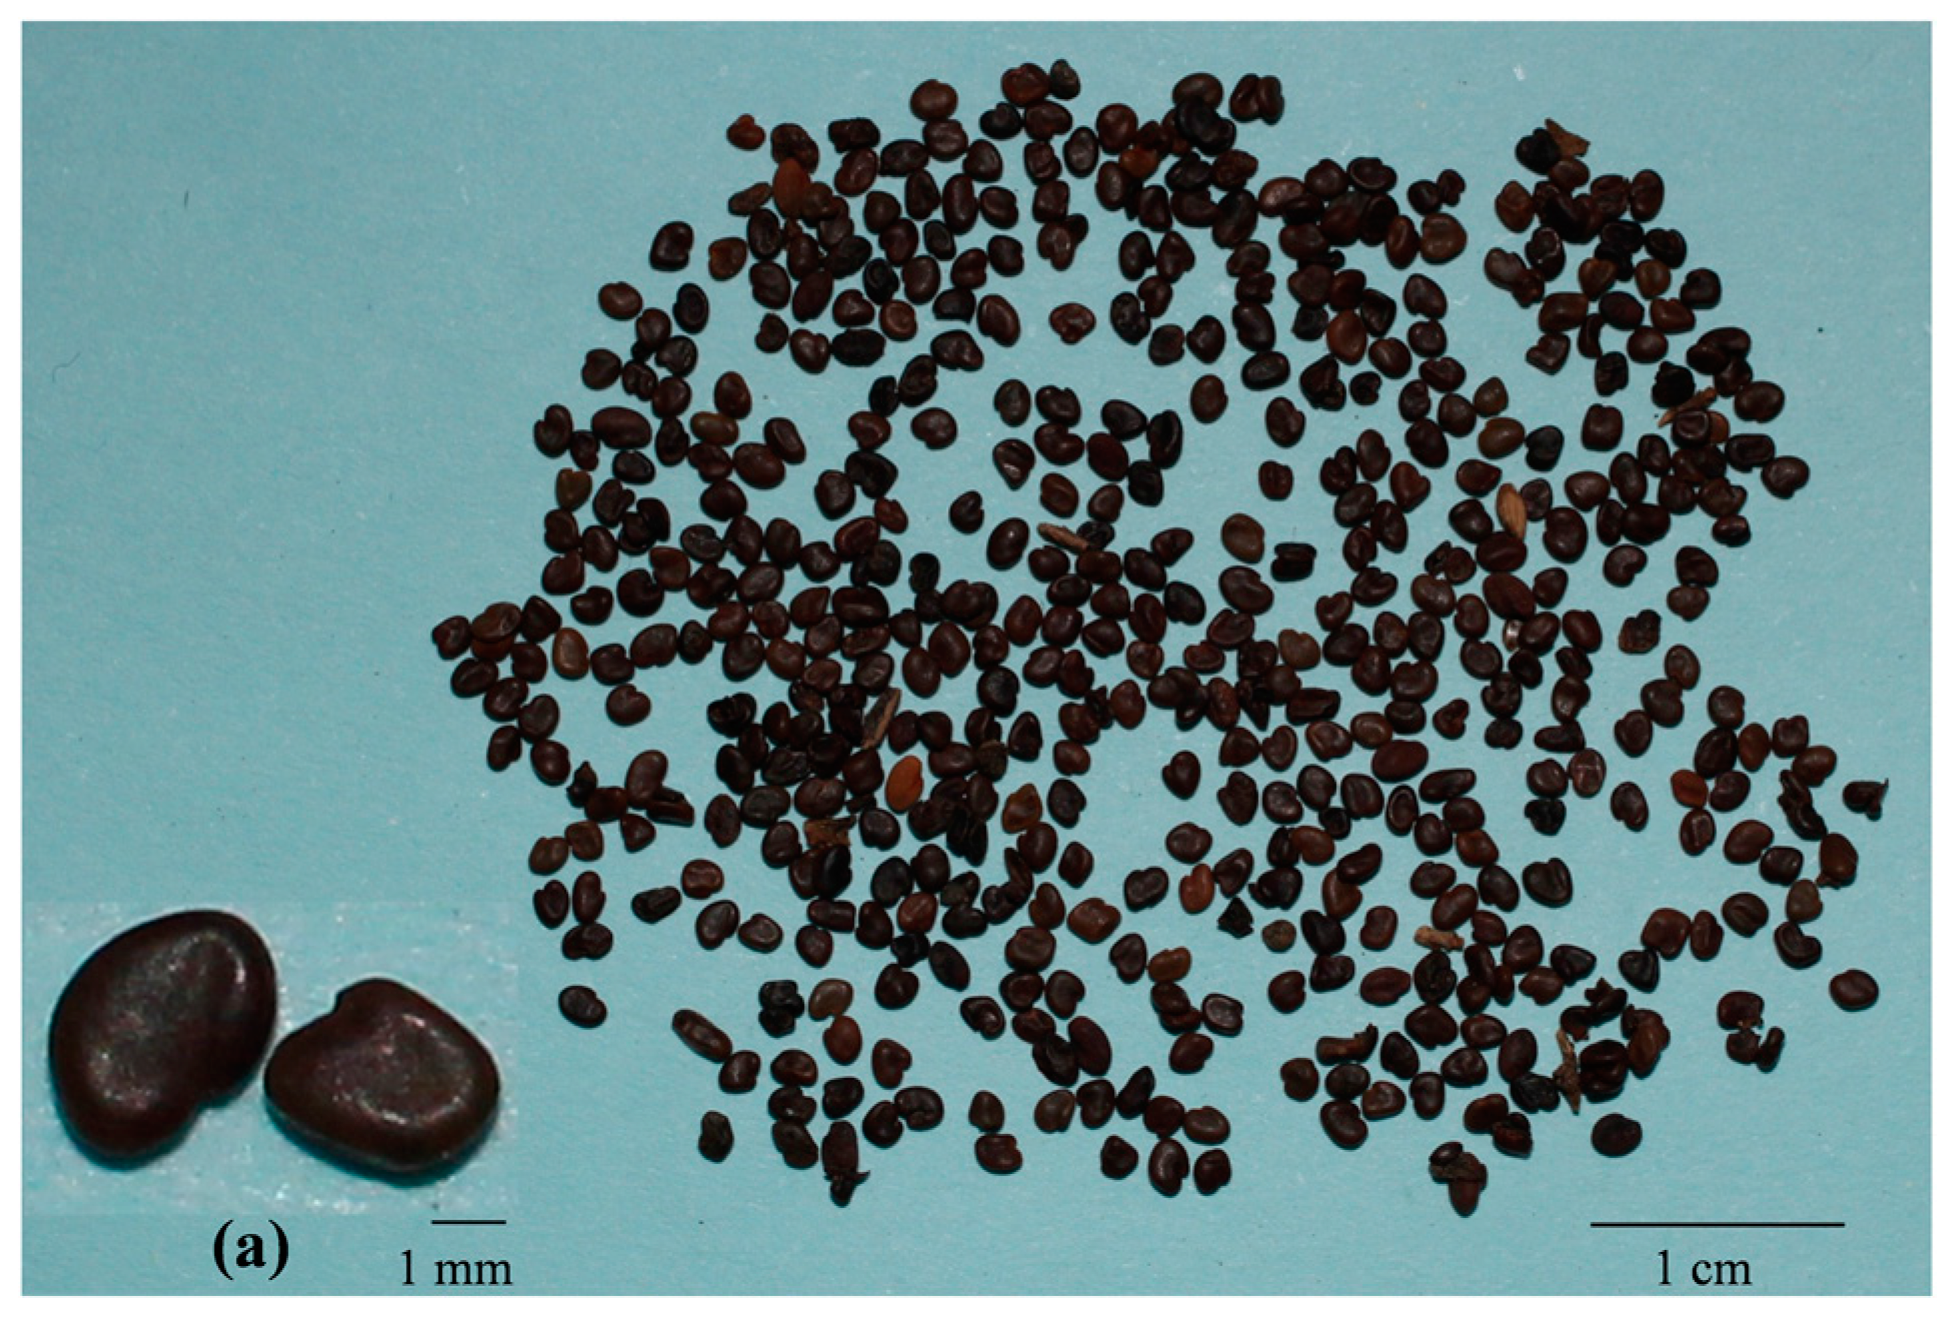
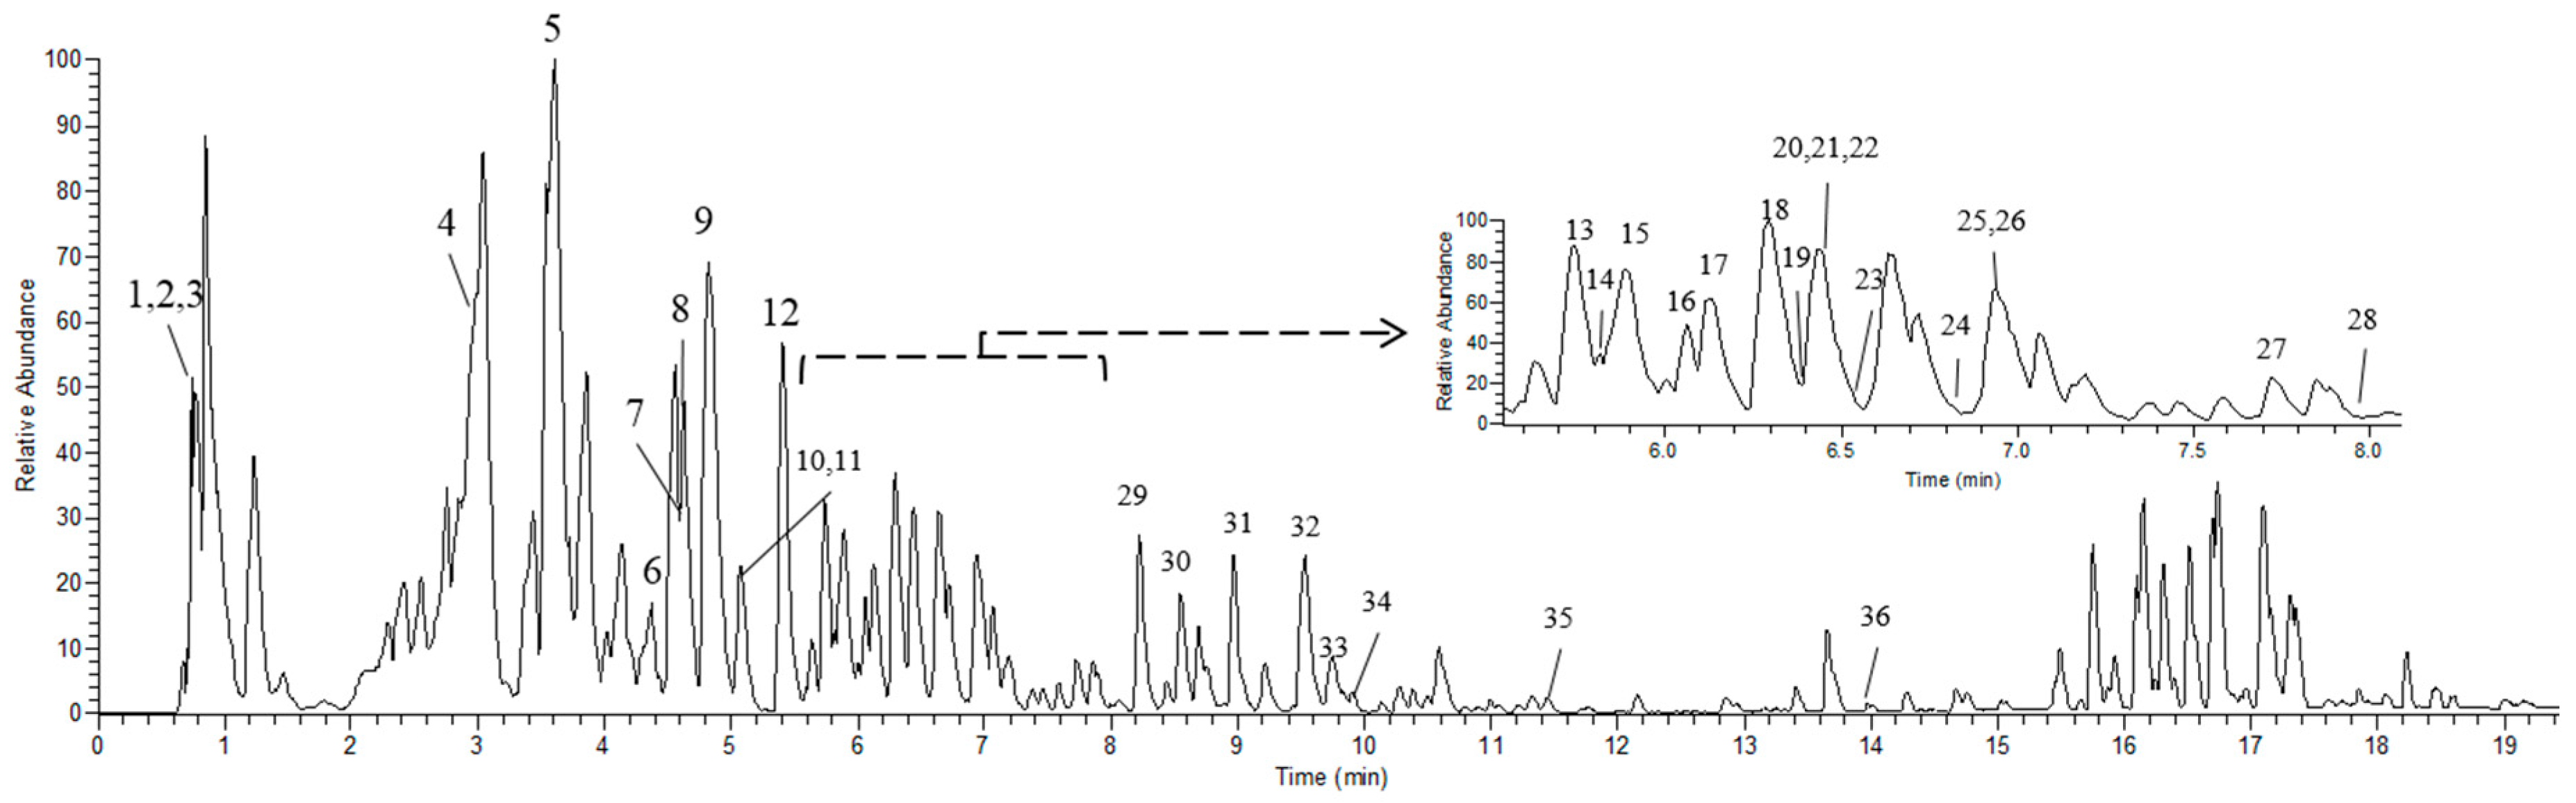
3.1. Chemical Constituents of ACS Extract
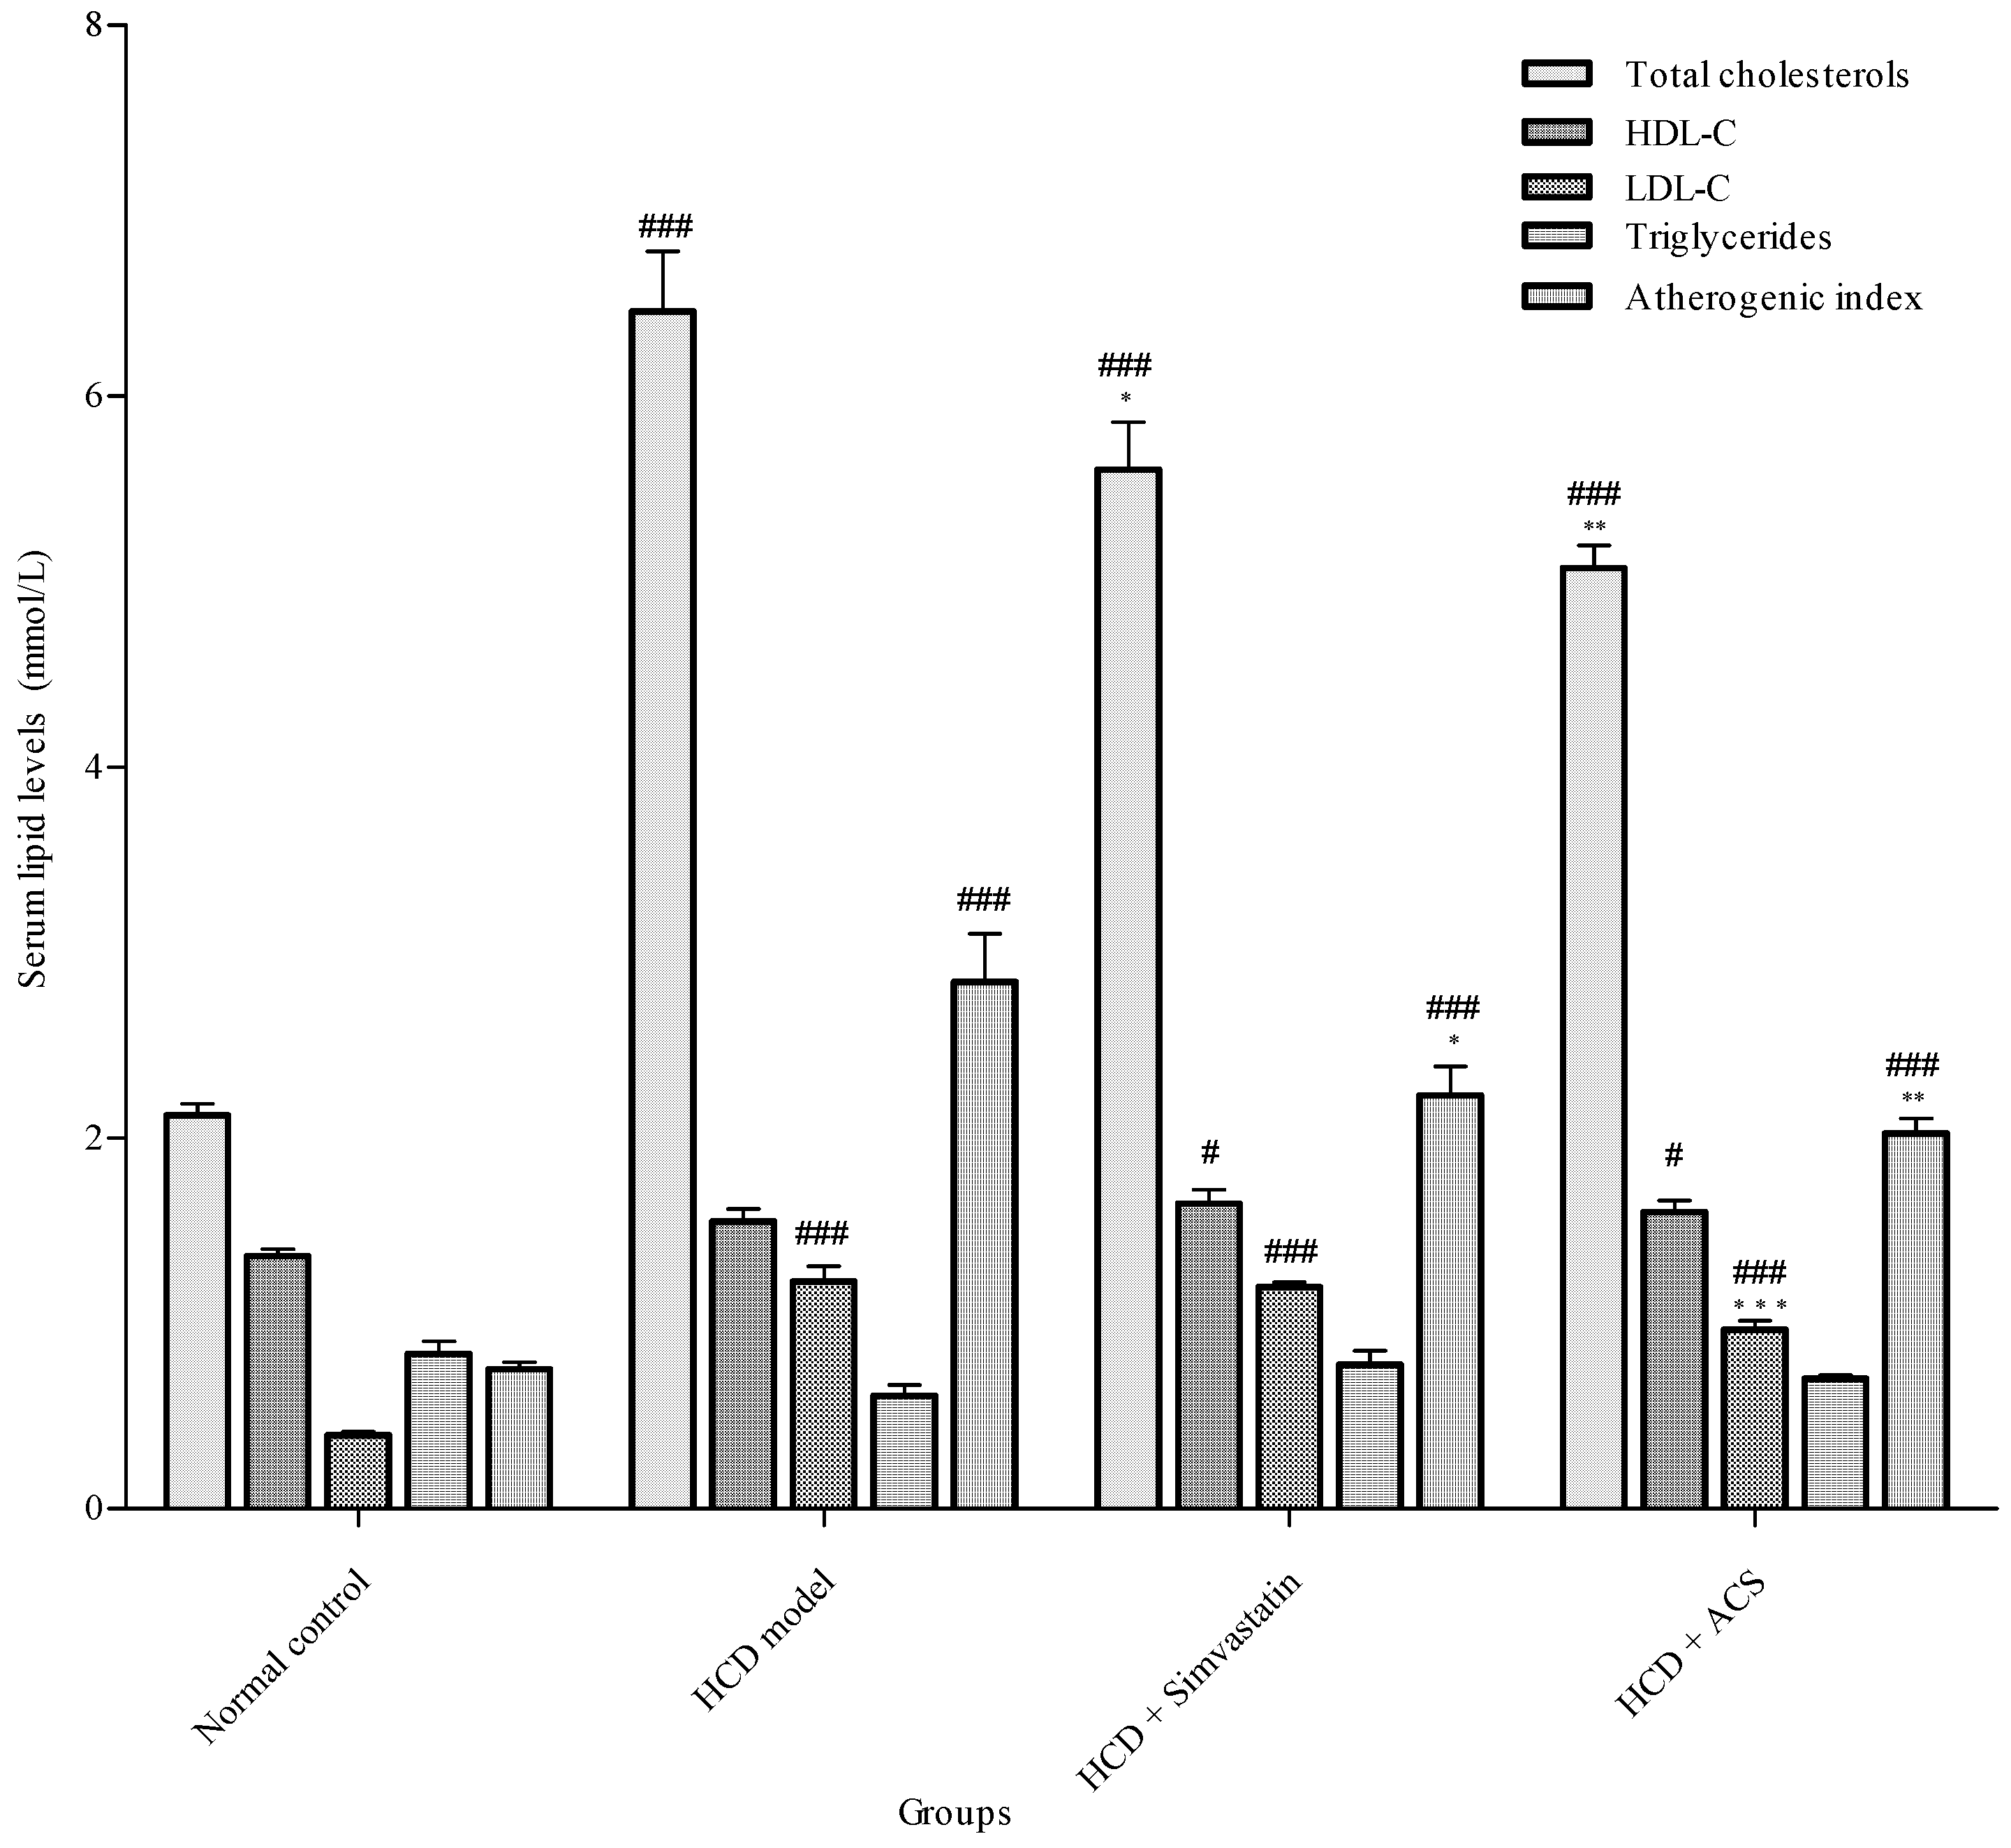
3.2. Effect on Serum Lipid Profiles
3.3. Stability of Metabolomics Platform
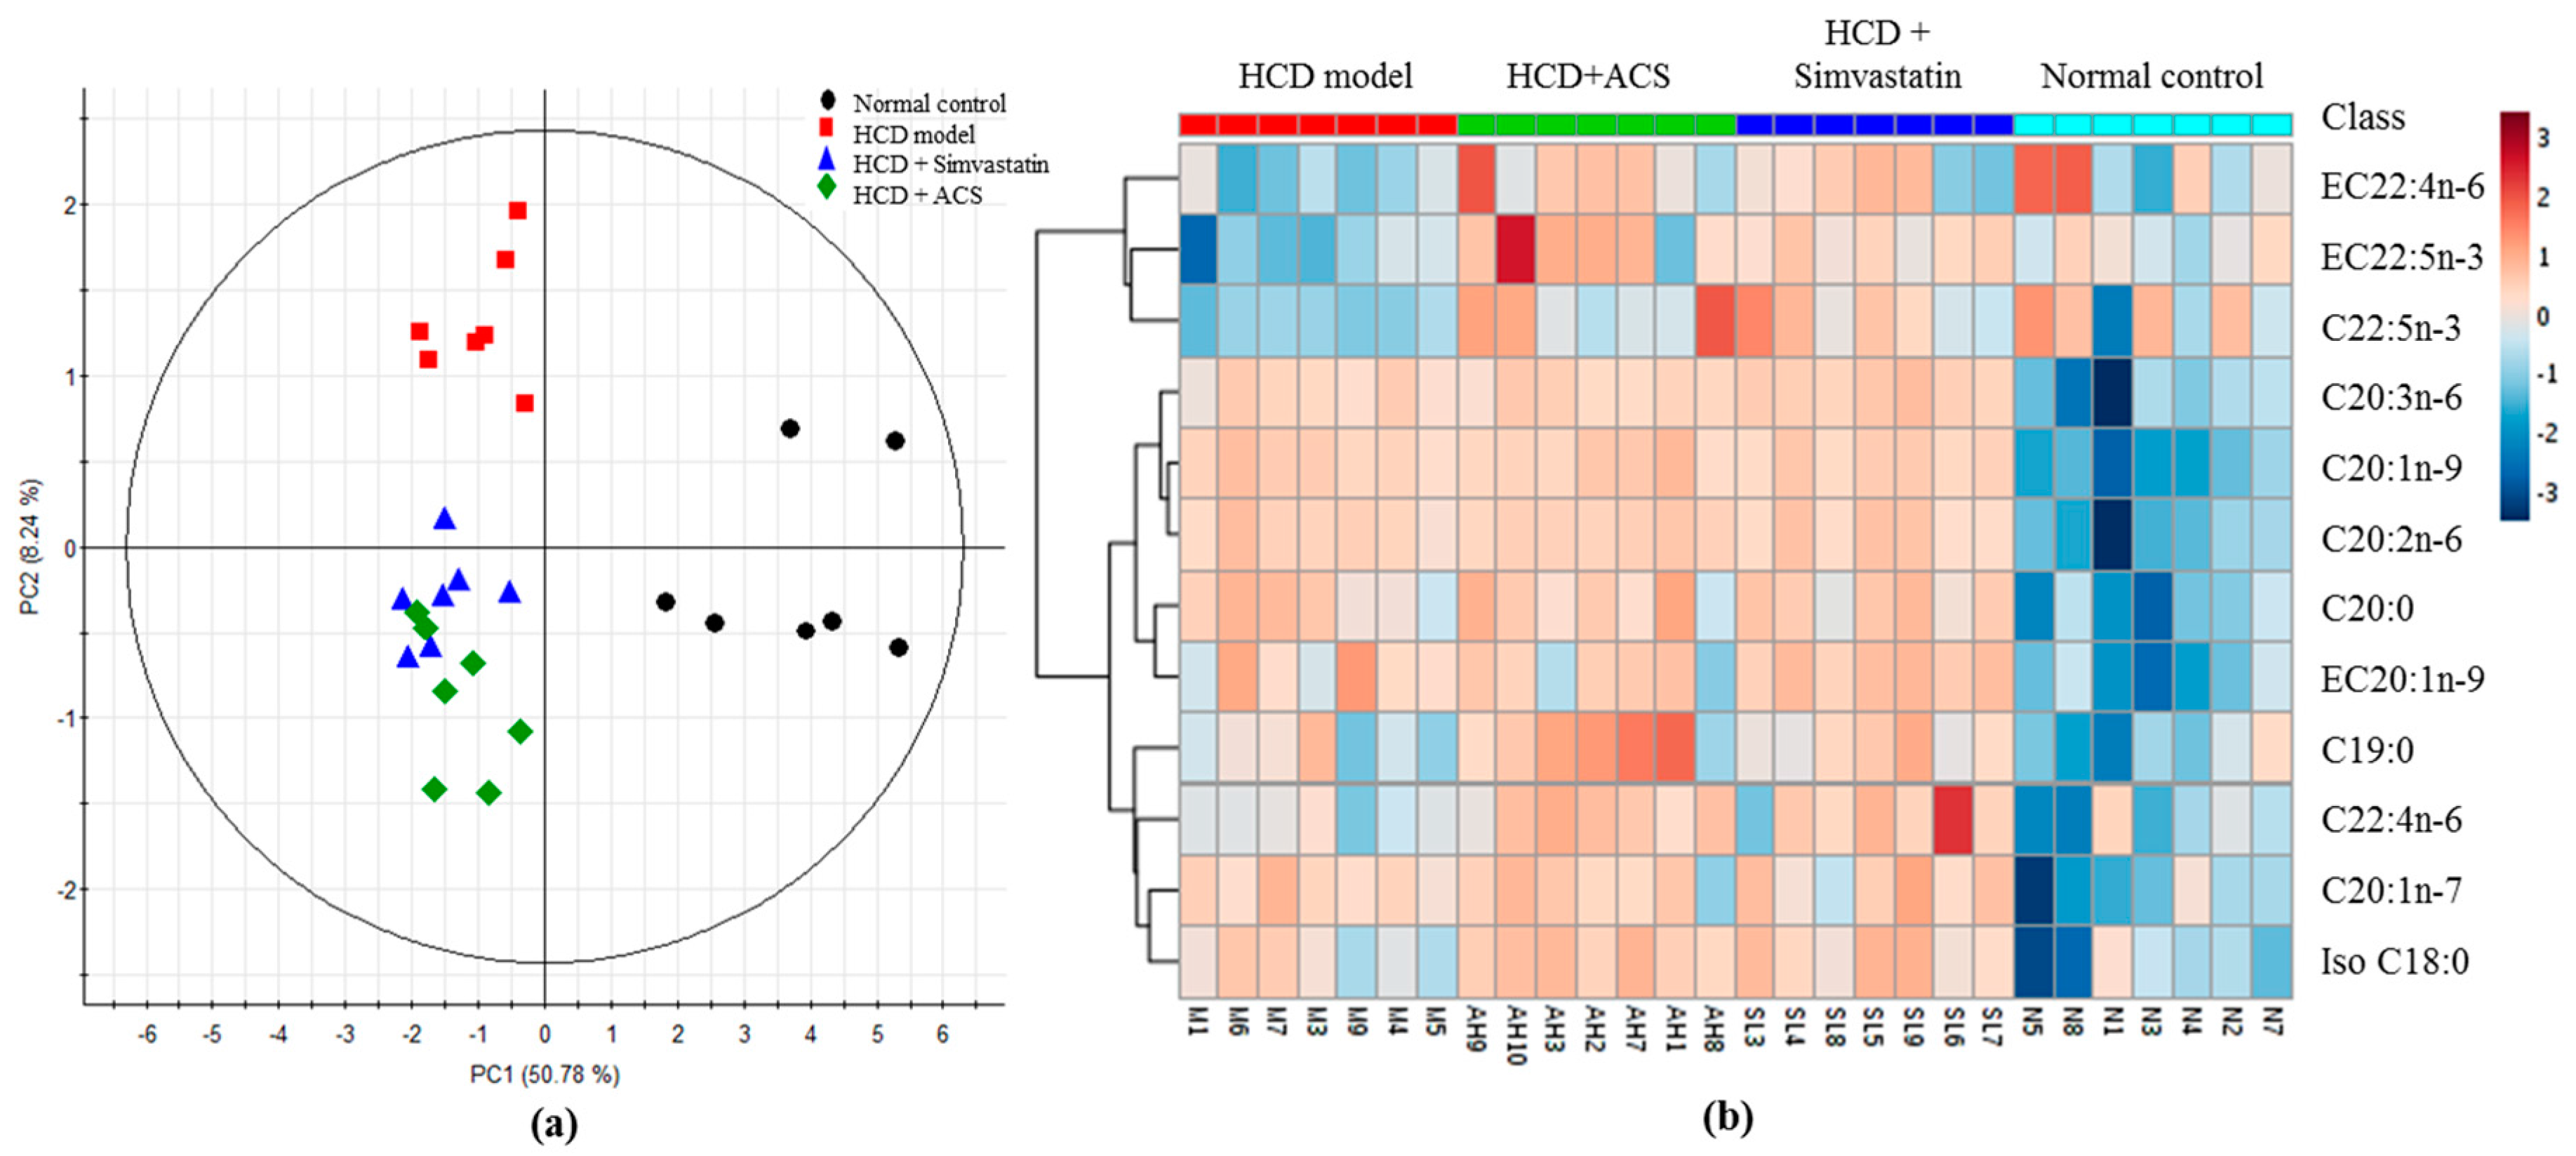
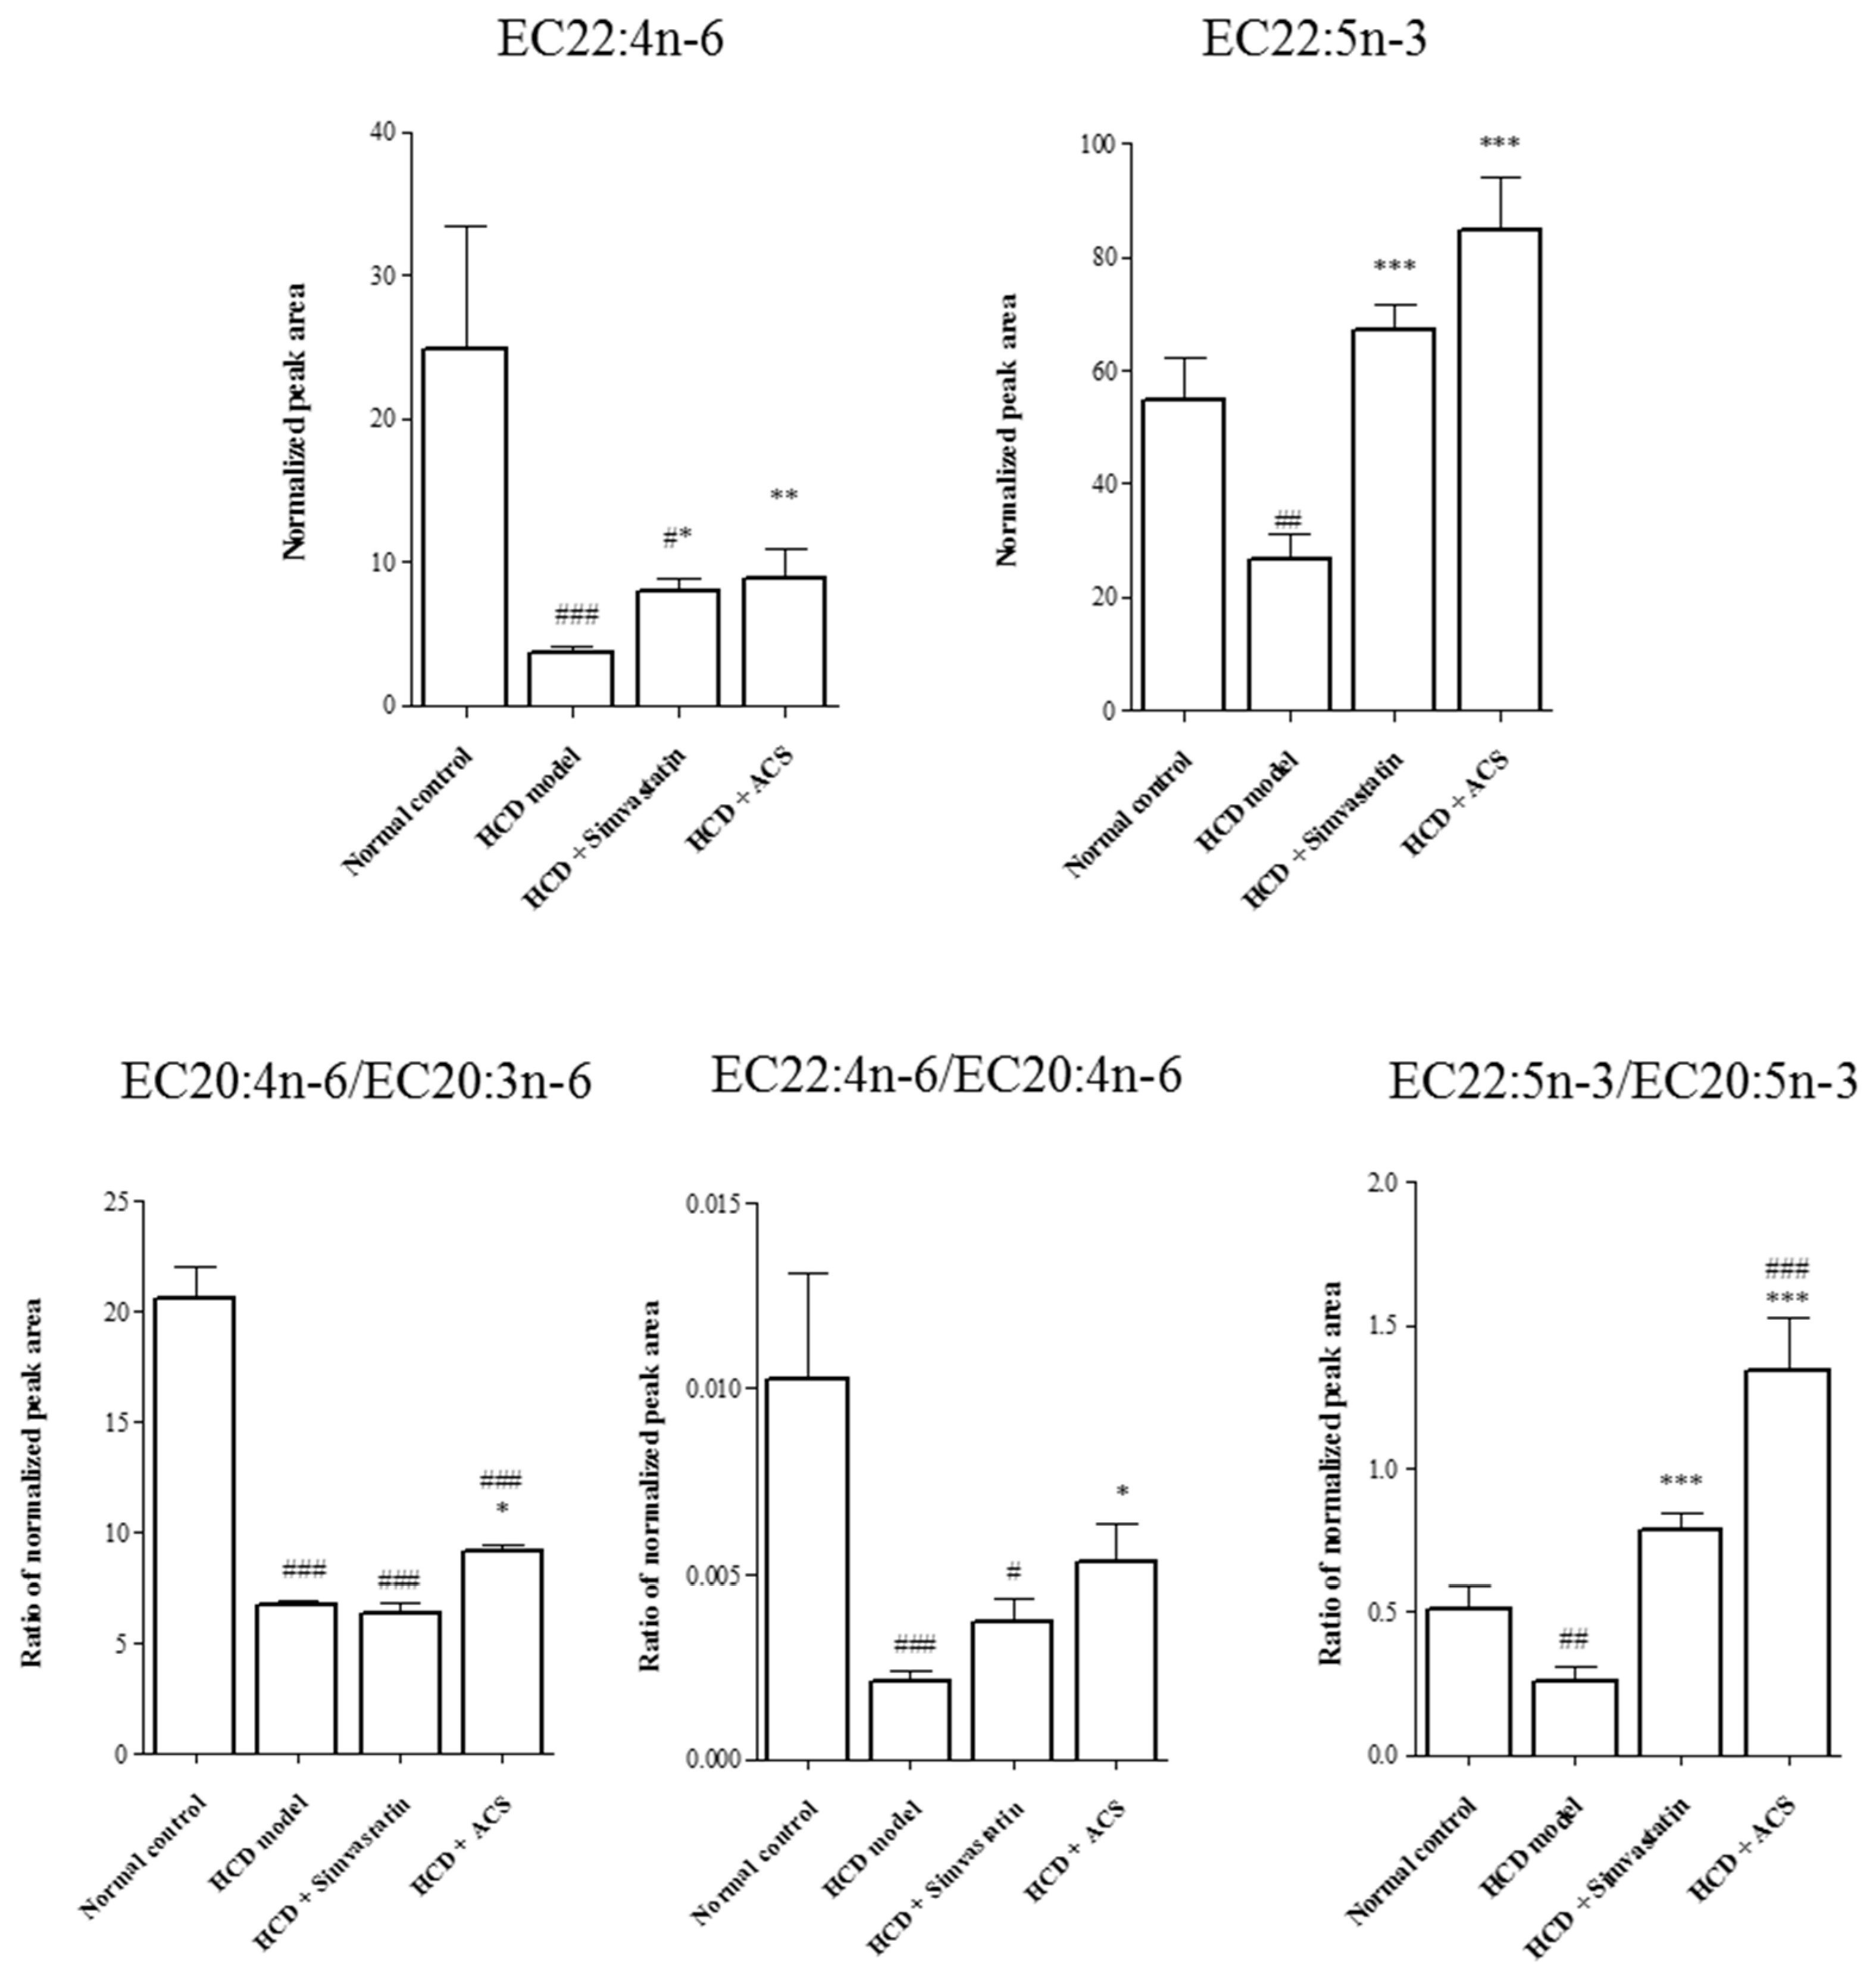
3.4. Effects on Metabolite Changes
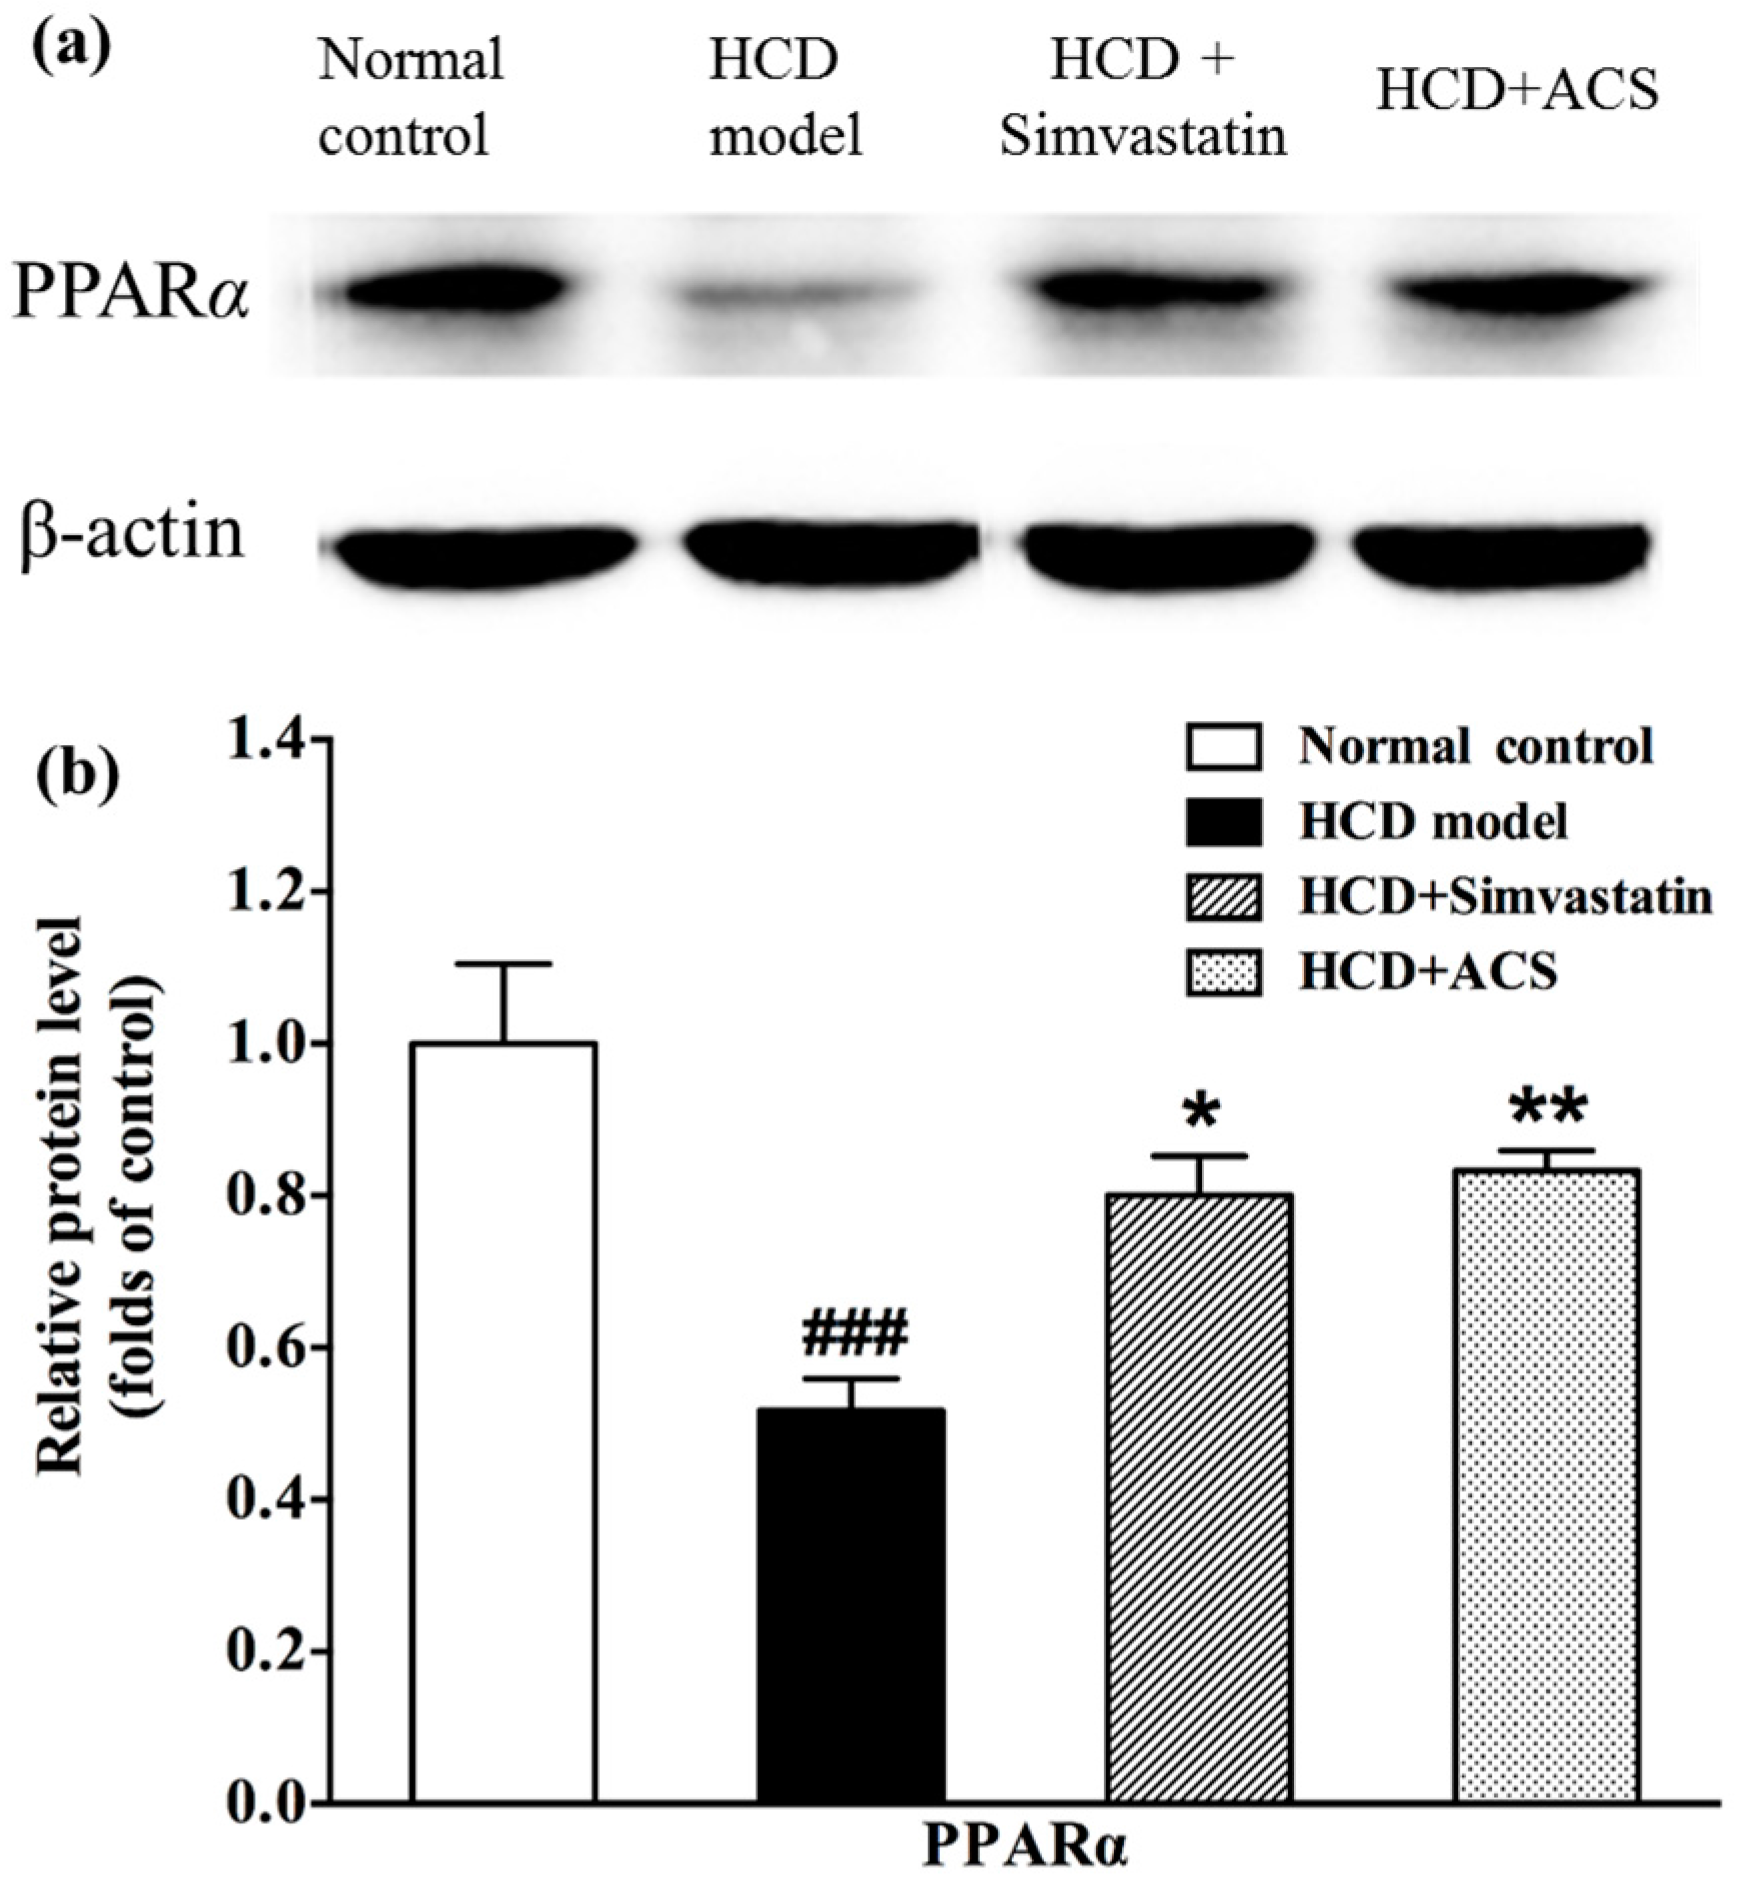
3.5. Effects on the Protein Expression of PPARα in the Liver
4. Discussion
5. Conclusions
Acknowledgments
Author Contributions
Conflicts of Interest
References
- Ng, Y.F.; Tang, P.C.T.; Sham, T.T.; Lam, W.S.; Mok, D.K.W.; Chan, S.W. Semen Astragali Complanati: An ethnopharmacological, phytochemical and pharmacological review. J. Ethnopharmacol. 2014, 155, 39–53. [Google Scholar] [CrossRef] [PubMed]
- Chinese Pharmacopoeia Commission. Pharmacopoeia of the People’s Republic of China; Chinese Medical Science Press: Beijing, China, 2015; Volume 1. [Google Scholar]
- Hong Kong Chinese Materia Medica Standards Office. Hong Kong Chinese Materia Medica Standards—Astragali Complanati Semen; Chinese Medicine Division, Department of Health, HKSAR Goverment: Hong Kong, China, 2013; Volume 6.
- Xue, B.; Li, J.; Chai, Q.; Liu, Z.; Chen, L. Effect of total flavonoid fraction of Astragalus complanatus R. Brown on angiotensin II-induced portal-vein contraction in hypertensive rats. Phytomedicine 2008, 15, 759–762. [Google Scholar] [CrossRef] [PubMed]
- Liu, C.Y.; Gu, Z.L.; Zhou, W.X.; Guo, C.Y. Effect of Astragalus complanatus flavonoid on anti-liver fibrosis in rats. World J. Gastroenterol. 2005, 11, 5782–5786. [Google Scholar] [CrossRef] [PubMed]
- Zhang, Q.A.; Fan, X.H.; Zhang, Z.Q.; Li, T.; Zhu, C.P.; Zhang, X.R.; Song, W. Extraction, antioxidant capacity and identification of Semen Astragali Complanati (Astragalus complanatus R. Br.) phenolics. Food Chem. 2013, 141, 1295–1300. [Google Scholar] [CrossRef] [PubMed]
- Gorrochategui, E.; Jaumot, J.; Lacorte, S.; Tauler, R. Data analysis strategies for targeted and untargeted LC-MS metabolomic studies: Overview and workflow. TrAC Trends Anal. Chem. 2016, 82, 425–442. [Google Scholar] [CrossRef]
- Nagana Gowda, G.A.; Raftery, D. Recent Advances in NMR-Based Metabolomics. Anal. Chem. 2017, 89, 490–510. [Google Scholar] [CrossRef] [PubMed]
- Ussher, J.R.; Elmariah, S.; Gerszten, R.E.; Dyck, J.R.B. The Emerging Role of Metabolomics in the Diagnosis and Prognosis of Cardiovascular Disease. J. Am. Coll. Cardiol. 2016, 68, 2850–2870. [Google Scholar] [CrossRef] [PubMed]
- Guo, L.; Milburn, M.V.; Ryals, J.A.; Lonergan, S.C.; Mitchell, M.W.; Wulff, J.E.; Alexander, D.C.; Evans, A.M.; Bridgewater, B.; Miller, L.; et al. Plasma metabolomic profiles enhance precision medicine for volunteers of normal health. Proc. Natl. Acad. Sci. USA 2015, 112, E4901–E4910. [Google Scholar] [CrossRef] [PubMed]
- Hu, C.; Xu, G. Metabolomics and traditional Chinese medicine. Trends Anal. Chem. 2014, 61, 207–214. [Google Scholar] [CrossRef]
- Hocher, B.; Adamski, J. Metabolomics for clinical use and research in chronic kidney disease. Nat. Rev. Nephrol. 2017, 13, 269–284. [Google Scholar] [CrossRef] [PubMed]
- Pallares-Méndez, R.; Aguilar-Salinas, C.A.; Cruz-Bautista, I.; del Bosque-Plata, L. Metabolomics in diabetes, a review. Ann. Med. 2016, 48, 89–102. [Google Scholar] [CrossRef] [PubMed]
- Navar-Boggan, A.M.; Peterson, E.D.; D’Agostino, R.B.; Neely, B.; Sniderman, A.D.; Pencina, M.J. Hyperlipidemia in Early Adulthood Increases Long-Term Risk of Coronary Heart Disease. Circulation 2015, 131, 451–458. [Google Scholar] [CrossRef] [PubMed]
- Kazdova, L. Relationship of Circulating Fatty Acid Profile to Metabolic Disorders Associated with Insulin Resistance. EBioMedicine 2015, 2, 1308–1309. [Google Scholar] [CrossRef] [PubMed]
- Kusunoki, J.; Kanatani, A.; Moller, D.E. Modulation of fatty acid metabolism as a potential approach to the treatment of obesity and the metabolic syndrome. Endocrine 2006, 29, 91–100. [Google Scholar] [CrossRef]
- Boden, G.; Shulman, G.I. Free fatty acids in obesity and type 2 diabetes: defining their role in the development of insulin resistance and β-cell dysfunction. Eur. J. Clin. Investig. 2002, 32, 14. [Google Scholar] [CrossRef]
- Boden, G. Obesity, insulin resistance and free fatty acids. Curr. Opin. Endocrinol. Diabetes Obes. 2011, 18, 139–143. [Google Scholar] [CrossRef] [PubMed]
- Singleton, V.L.; Orthofer, R.; Lamuela-Raventós, R.M. Analysis of total phenols and other oxidation substrates and antioxidants by means of folin-ciocalteu reagent. In Methods in Enzymology; Lester, P., Ed.; Academic Press: San Diego, CA, USA, 1999; Volume 299, pp. 152–178. [Google Scholar]
- Guo, D.J.; Cheng, H.L.; Chan, S.W.; Yu, P.H.F. Antioxidative activities and the total phenolic contents of tonic Chinese Medicinal Herbs. Inflammopharmacology 2008, 16, 201–207. [Google Scholar] [CrossRef] [PubMed]
- Kwok, C.-Y.; Wong, C.N.-Y.; Yau, M.Y.-C.; Yu, P.H.-F.; Au, A.L.S.; Poon, C.C.-W.; Seto, S.-W.; Lam, T.-Y.; Kwan, Y.-W.; Chan, S.-W. Consumption of dried fruit of Crataegus pinnatifida (hawthorn) suppresses high-cholesterol diet-induced hypercholesterolemia in rats. J. Funct. Foods 2010, 2, 179–186. [Google Scholar] [CrossRef]
- Li, M.; Zhou, L.; Yang, D.; Li, T.; Li, W. Biochemical composition and antioxidant capacity of extracts from Podophyllum hexandrum rhizome. BMC Complement. Altern. Med. 2012, 12, 1472–6882. [Google Scholar] [CrossRef] [PubMed]
- Yi, L.Z.; He, J.; Liang, Y.Z.; Yuan, D.L.; Chau, F.T. Plasma fatty acid metabolic profiling and biomarkers of type 2 diabetes mellitus based on GC/MS and PLS-LDA. FEBS Lett. 2006, 580, 6837–6845. [Google Scholar] [CrossRef] [PubMed]
- Li, Y.; Wang, C.; Li, H.; Yu, T.; Tan, L. Simultaneous Determination of Formononetin, Calycosin and Rhamnocitrin from Astragalus Complanatus by UHPLC–MS-MS in Rat Plasma: Application to a Pharmacokinetic Study. J. Chromatogr. Sci. 2016, 54, 1605–1612. [Google Scholar] [CrossRef] [PubMed]
- Zhang, Q.A.; Fan, X.H.; Li, T.; Zhang, Z.Q.; Liu, Y.K.; Li, X.P. Optimisation of ultrasound extraction for flavonoids from Semen Astragali Complanati and its identification by HPLC-DAD-MS/MS. Int. J. Food Sci. Technol. 2013, 48, 1970–1976. [Google Scholar] [CrossRef]
- Ónody, A.; Csonka, C.; Giricz, Z.; Ferdinandy, P. Hyperlipidemia induced by a cholesterol-rich diet leads to enhanced peroxynitrite formation in rat hearts. Cardiovasc. Res. 2003, 58, 663–670. [Google Scholar] [CrossRef]
- Chu, S.-M.; Shih, W.-T.; Yang, Y.-H.; Chen, P.-C.; Chu, Y.-H. Use of traditional Chinese medicine in patients with hyperlipidemia: A population-based study in Taiwan. J. Ethnopharmacol. 2015, 168, 129–135. [Google Scholar] [CrossRef] [PubMed]
- Xie, W.; Zhao, Y.; Du, L. Emerging approaches of traditional Chinese medicine formulas for the treatment of hyperlipidemia. J. Ethnopharmacol. 2012, 140, 345–367. [Google Scholar] [CrossRef] [PubMed]
- Sham, T.T.; Chan, C.O.; Wang, Y.H.; Yang, J.M.; Mok, D.K.W.; Chan, S.-W. A Review on the Traditional Chinese Medicinal Herbs and Formulae with Hypolipidemic Effect. BioMed Res. Int. 2014, 2014, 925302. [Google Scholar] [CrossRef] [PubMed]
- Xie, W.; Wang, M.; Chen, C.; Zhang, X.; Melzig, M.F. Hepatoprotective effect of isoquercitrin against acetaminophen-induced liver injury. Life Sci. 2016, 152, 180–189. [Google Scholar] [CrossRef] [PubMed]
- Wang, Z.-B.; Zhai, Y.-D.; Ma, Z.-P.; Yang, C.-J.; Pan, R.; Yu, J.-L.; Wang, Q.-H.; Yang, B.-Y.; Kuang, H.-X. Triterpenoids and Flavonoids from the Leaves of Astragalus membranaceus and Their Inhibitory Effects on Nitric Oxide Production. Chem. Biodivers. 2015, 12, 1575–1584. [Google Scholar] [CrossRef] [PubMed]
- Porras, D.; Nistal, E.; Martínez-Flórez, S.; Pisonero-Vaquero, S.; Olcoz, J.L.; Jover, R.; González-Gallego, J.; García-Mediavilla, M.V.; Sánchez-Campos, S. Protective effect of quercetin on high-fat diet-induced non-alcoholic fatty liver disease in mice is mediated by modulating intestinal microbiota imbalance and related gut-liver axis activation. Free Radic. Biol. Med. 2017, 102, 188–202. [Google Scholar] [CrossRef] [PubMed]
- Levin, G.; Duffin, K.L.; Obukowicz, M.G.; Hummert, S.L.; Fujiwara, H.; Needleman, P.; Raz, A. Differential metabolism of dihomo-γ-linolenic acid and arachidonic acid by cyclo-oxygenase-1 and cyclo-oxygenase-2: Implications for cellular synthesis of prostaglandin E1 and prostaglandin E2. Biochem. J. 2002, 365, 489–496. [Google Scholar] [CrossRef] [PubMed]
- Iversen, L.; Fogh, K.; Kragballe, K. Effect of dihomogammalinolenic acid and its 15-lipoxygenase metabolite on eicosanoid metabolism by human mononuclear leukocytes in vitro: selective inhibition of the 5-lipoxygenase pathway. Arch. Dermatol. Res. 1992, 284, 222–226. [Google Scholar] [CrossRef] [PubMed]
- Calder, P.C. Mechanisms of Action of (n-3) Fatty Acids. J. Nutr. 2012, 142, 592S–599S. [Google Scholar] [CrossRef] [PubMed]
- Echeverría, F.; Ortiz, M.; Valenzuela, R.; Videla, L.A. Long-chain polyunsaturated fatty acids regulation of PPARs, signaling: Relationship to tissue development and aging. Prostaglandins Leukot. Essent. Fat. Acids 2016, 114, 28–34. [Google Scholar] [CrossRef] [PubMed]
- Mishra, A.; Chaudhary, A.; Sethi, S. Oxidized Omega-3 Fatty Acids Inhibit NF-κB Activation via a PPARα-Dependent Pathway. Arterioscler. Thromb. Vasc. Biol. 2004, 24, 1621–1627. [Google Scholar] [CrossRef] [PubMed]


| Peak Number | Retention Time (min) | Identity (Common Name) | Theoretical m/z | Detected m/z | Mass Error (ppm) | Adduct | Molecular Formula | Mass Fragments |
|---|---|---|---|---|---|---|---|---|
| 1 | 0.72 | l-Arginine * | 173.1044 | 173.1042 | −1.4 | [M−H]− | C6H14N4O2 | 131.0823, 156.0773 |
| 2 | 0.76 | l-Aspartic acid * | 132.0302 | 132.0298 | −2.7 | [M−H]− | C4H7NO4 | 115.0032 |
| 3 | 0.77 | l-Glutamic acid * | 146.0459 | 146.0456 | −2.2 | [M−H]− | C5H9NO4 | 128.0348 |
| 4 | 2.90 | Myricetin 3,4′-diglucopyranoside (Complanatoside A) | 641.1359 | 641.1358 | −0.2 | [M−H]− | C27H30O18 | 317.0296, 479.0825, 623.1239 |
| 5 | 3.61 | Myricetin-3-O-β-d-glucopyranoside isomer | 479.0831 | 479.0833 | 0.5 | [M−H]− | C21H20O13 | 151.0031, 178.9981, 316.02197 |
| 6 | 4.37 | Calycosin 7-O-β-d-glucopyranoside/Calycosin 7-β-d-galactopyranoside | 491.1195 | 491.1193 | −0.4 | [M+HCOO]− | C22H22O10 | 268.0375, 283.0611, 329.1140, 447.1292 |
| 7 | 4.58 | Quercetin-3-O-β-d-glucopyranoside (Isoquercitrin) * | 463.0882 | 463.0881 | −0.2 | [M−H]− | C21H20O12 | 151.0031, 178.9981, 271.0244, 300.0271 |
| 8 | 4.63 | Laricitrin 3-O-β-d-glucopyranoside/Myricomplanoside | 493.0988 | 493.0987 | −0.3 | [M−H]− | C22H22O13 | 151.0031, 178.9981, 315.0142, 330.0377 |
| 9 | 4.82 | Myricetin-3-O-β-d-glucopyranoside/Myricetin 5′-O-β-d-glucopyranoside/isomer | 479.0831 | 479.0831 | 0.0 | [M−H]− | C21H20O13 | 151.0031, 178.9981, 299.0190, 317.0298 |
| 10 | 5.07 | Kaempferol 3-O-β-rutinoside (Nicotiflorin)/Kaempferol 3-neohesperidoside/isomer | 593.1512 | 593.1510 | −0.3 | [M−H]− | C27H30O15 | 151.0032, 178.9982, 285.0400, 447.1192 |
| 11 | 5.07 | Quercetin 3-O-α-l-arabinopyranoside | 433.0776 | 433.0774 | −0.4 | [M−H]− | C20H18O11 | 151.0031, 178.9982, 255.0294, 271.0244, 300.271 |
| 12 | 5.41 | Kaempferol 3-O-β-d-glucopyranoside (Astragalin) | 447.0933 | 447.0933 | −0.1 | [M−H]− | C21H20O11 | 227.0344, 255.0295,284.0322 |
| 13 | 5.74 | Kaempferol 3-O-α-l-arabinopyranoside | 417.0827 | 417.0827 | −0.1 | [M−H]− | C20H18O10 | 151.0032, 178.9980, 227.0344, 255.0294, 284.0322 |
| 14 | 5.84 | Kaempferide/Rhamnocitrin | 299.0561 | 299.0557 | −1.2 | [M−H]− | C16H12O6 | 271.0247, 284.0322 |
| 15 | 5.88 | Calycosin | 283.0612 | 283.0611 | −0.4 | [M−H]− | C16H12O5 | 211.0396, 224.0474, 268.0374 |
| 16 | 6.06 | Myricetin | 317.0303 | 317.0299 | −1.3 | [M−H]− | C15H10O8 | 151.0032, 165.0189, 178.9981, 271.0244, 289.0244, 299.0195 |
| 17 | 6.12 | Kaempferol 3-O-β-rutinoside isomer | 593.1512 | 593.1510 | −0.4 | [M−H]− | C27H30O15 | 283.0245, 298.0480 |
| 18 | 6.29 | Laricitrin 3-O-β-d-glucopyranoside/Myricomplanoside | 493.0988 | 493.0987 | −0.1 | [M−H]− | C22H22O13 | 151.0031, 178.998, 316.0219, 331.0455 |
| 19 | 6.39 | Quercetin-4′-O-β-d-glucopyranoside/6-Hydroxykaempferol 7-glucopyranoside/isomer | 463.0882 | 463.0879 | −0.7 | [M−H]− | C21H20O12 | 151.0031,178.9981, 301.0349 |
| 20 | 6.44 | Rhamnocitrin-3-O-β-d-glucopyranoside/Kaempferide 7-O-β-d-glucopyranoside | 461.1089 | 461.1088 | −0.2 | [M−H]− | C22H22O11 | 165.0189, 271.0609, 299.0557, 341.0662 |
| 21 | 6.44 | Rhamnocitrin-3,4′-O-diglucopyranoside (Complanatuside) * | 669.1672 | 669.1673 | 0.1 | [M+HCOO]− | C28H32O16 | 299.0557, 461.1085 |
| 22 | 6.45 | 623.1618 | 623.1617 | −0.1 | [M−H]− | C28H32O16 | 299.0559, 461.1082 | |
| 23 | 6.51 | Calycosin 7-β-d-glucopyranoside/Calycosin 7-galactopyranoside | 445.1140 | 445.1137 | −0.7 | [M−H]− | C22H22O10 | 283.0606 |
| 24 | 6.82 | Calycosin 7-β-d-glucopyranoside/Calycosin 7-galactopyranoside | 445.1140 | 445.1137 | −0.6 | [M−H]− | C22H22O10 | 283.0606 |
| 25 | 6.94 | Rhamnocitrin-3-O-β-d-glucopyranoside/Kaempferide 7-O-β-d-glucopyranoside | 461.1089 | 461.1087 | −0.4 | [M−H]− | C22H22O11 | 165.0187, 299.0564 |
| 26 | 6.94 | Neocomplanoside/6″-O-acetyl-kaempferide-7-O-β-d-glucopyranoside/6″-O-acetyl-pratensein-7-O-β-d-glucopyranoside | 503.1195 | 503.1193 | −0.4 | [M−H]− | C24H24O12 | 283.0245, 299.0555, 461.1088 |
| 27 | 7.72 | Calycosin 7-β-d-glucopyranoside/Calycosin 7-galactoside | 445.114 | 445.1137 | −0.7 | [M−H]− | C22H22O10 | 283.0606 |
| 28 | 7.97 | Quercetin * | 301.0350 | 301.0350 | −1.3 | [M−H]− | C15H10O7 | 121.0290, 151.0032, 178.9981, 273.0403 |
| 29 | 8.22 | Kaempferol 3-O-β-rutinoside isomer | 593.1512 | 593.1513 | 0.1 | [M−H]− | C27H30O15 | 283.0243, 298.0478 |
| 30 | 8.55 | Formononetin 7-O-(6″-acetylglucoside)/ isomer | 517.1351 | 517.1351 | 0.0 | [M+HCOO]− | C24H24O10 | 252.0422, 267.0659 |
| 31 | 8.97 | Rhamnocitrin-3-O-β-d-glucopyranoside/Kaempferide 7-O-β-d-glucopyranoside | 461.1089 | 461.1090 | 0.3 | [M−H]− | C22H22O11 | 299.0555 |
| 32 | 9.53 | Neocomplanoside/6″-O-acetyl-kaempferide-7-O-β-d-glucoside/6″-O-acetyl-pratensein-7-O-β-d-glucoside | 503.1195 | 503.1194 | −0.1 | [M−H]− | C24H24O12 | 283.0244, 299.0555, 461.1096 |
| 33 | 9.72 | Kaempferol * | 285.0405 | 285.0405 | −0.1 | [M−H]− | C15H10O6 | 185.0602, 229.0514, 257.0457 |
| 34 | 9.89 | Formononetin 7-O-(6″-acetylglucoside)/isomer | 517.1351 | 517.1348 | −0.6 | [M+HCOO]− | C24H24O10 | 252.0423, 267.0659 |
| 35 | 11.48 | Formononetin * | 267.0663 | 267.0663 | 0.0 | [M−H]− | C16H12O4 | 223.0397, 252.0424 |
| 36 | 13.96 | Kaempferide/Rhamnocitrin/Isokaempferide | 299.0561 | 299.0559 | −0.6 | [M−H]− | C16H12O6 | 165.0188, 271.0608, 284.0321 |
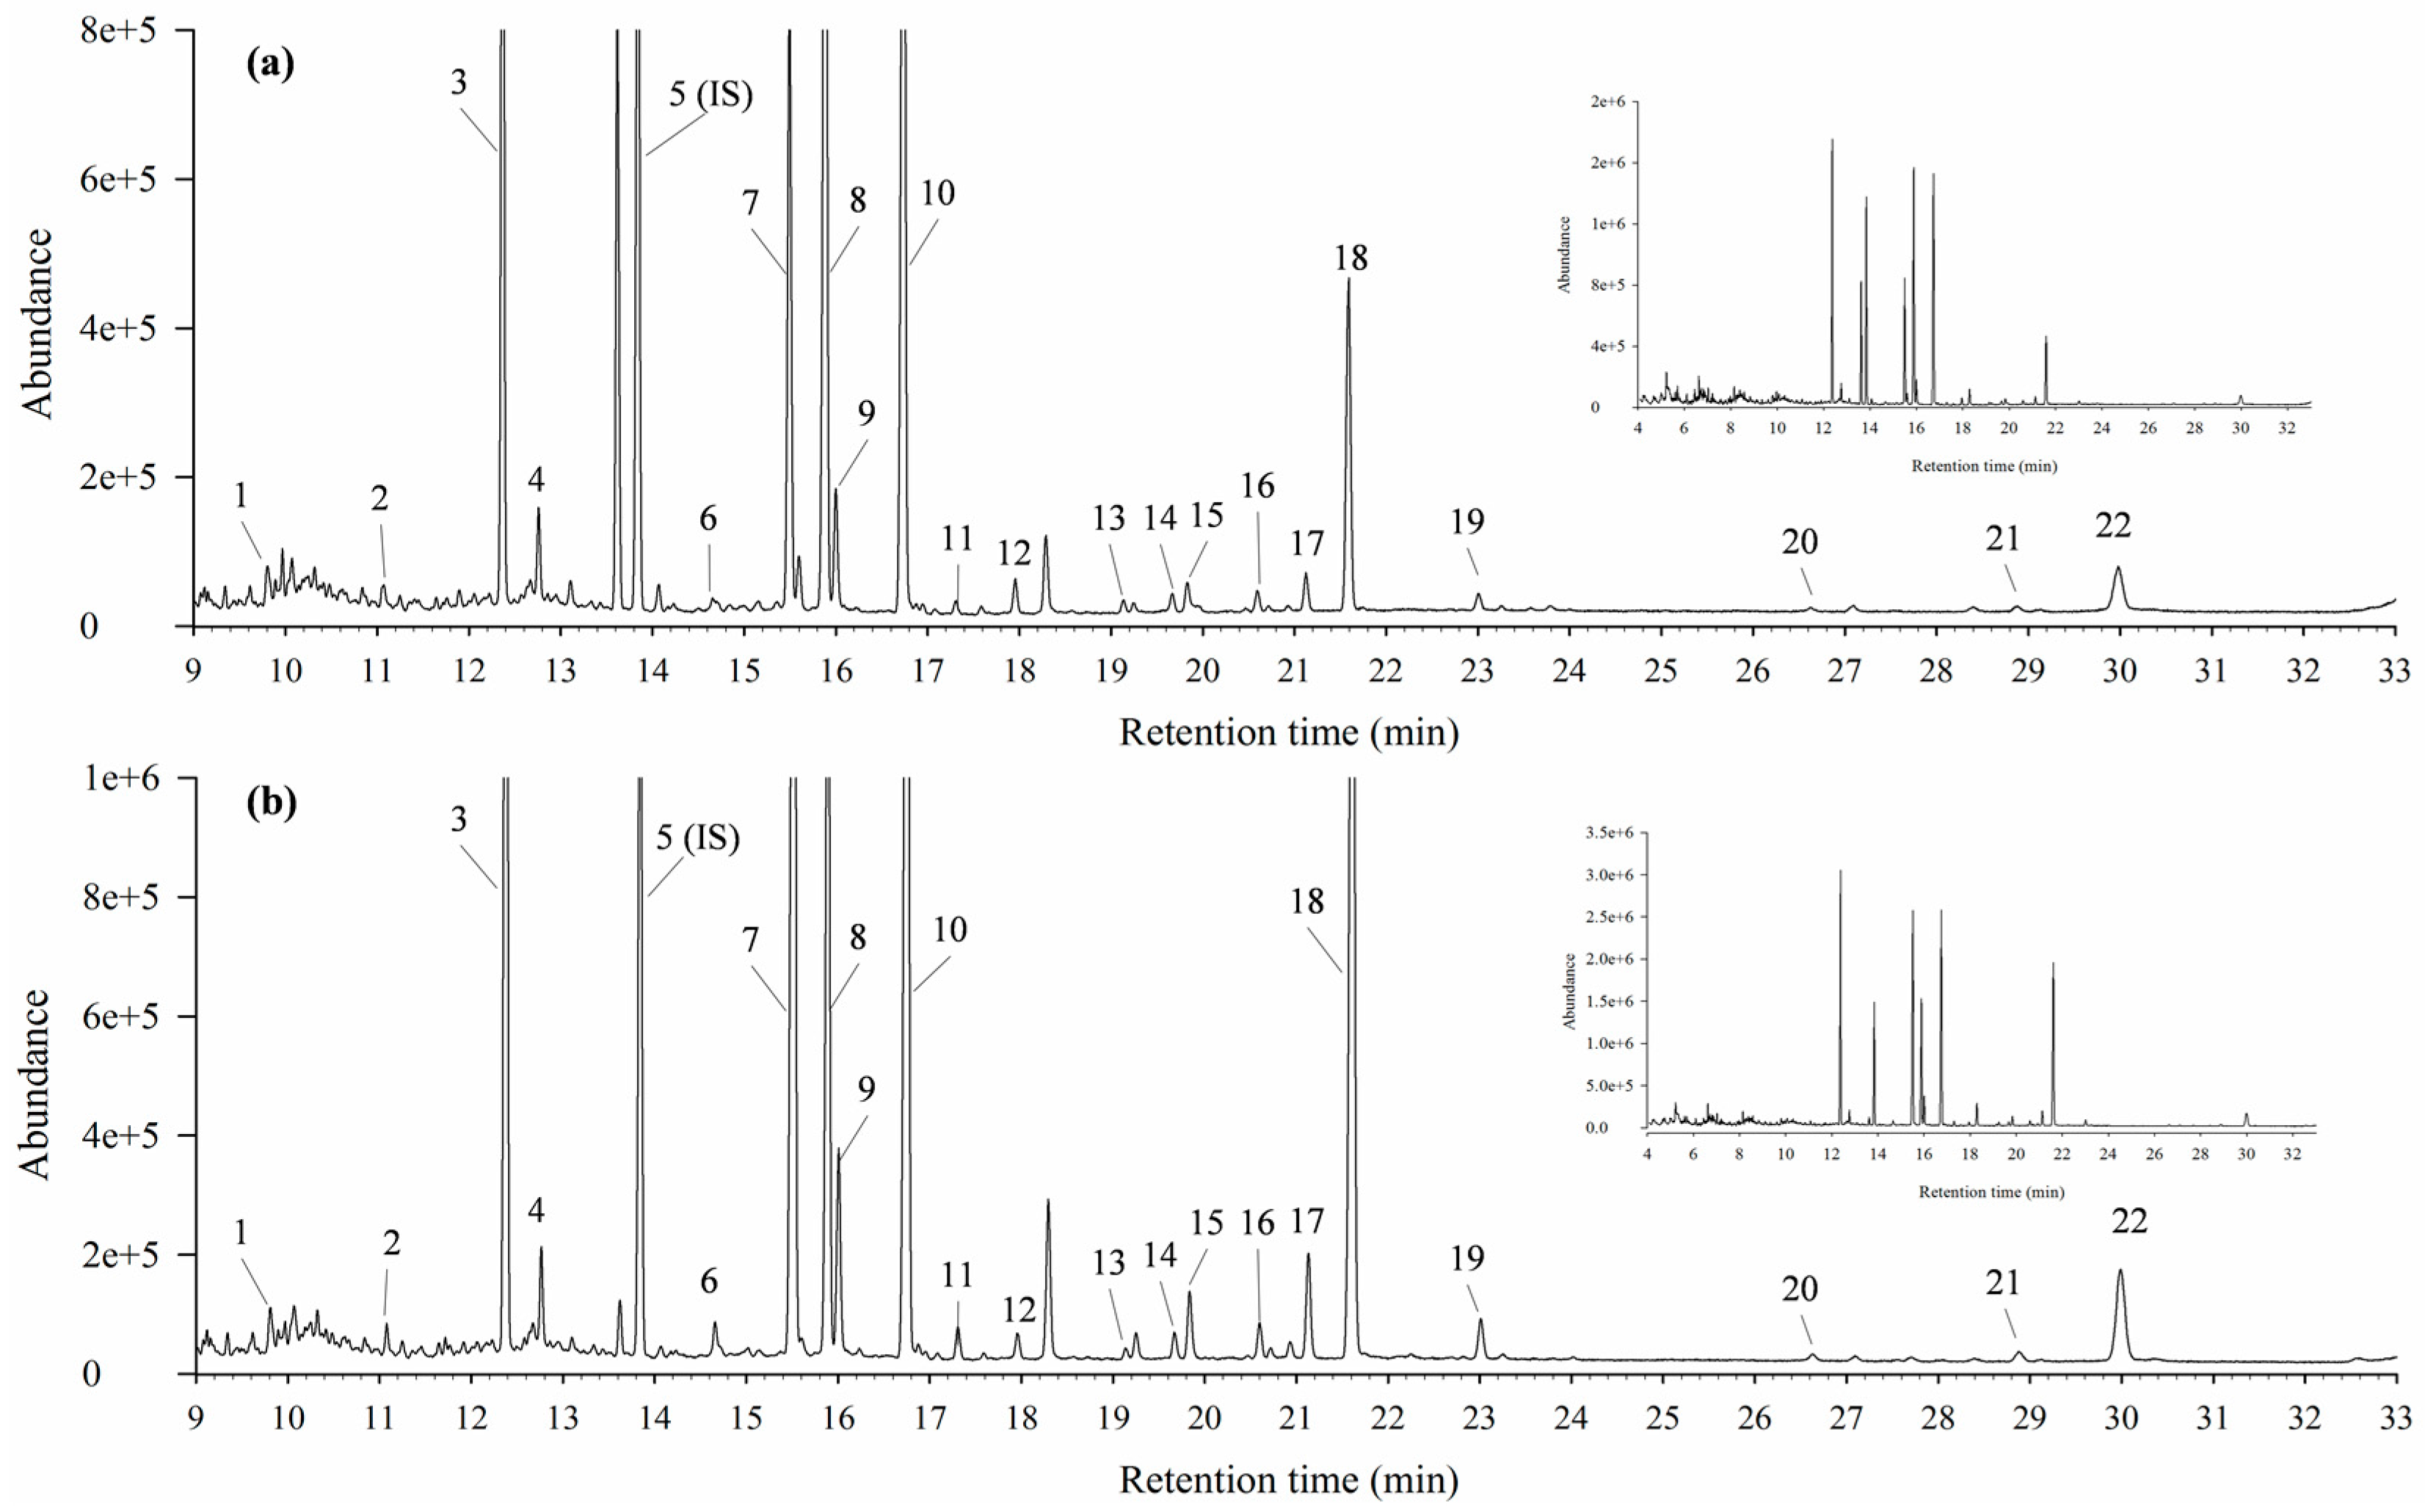
| Peak Number | Retention Time (min) | Abbreviation | Identity (Common Name) | Molecular Formula | |
|---|---|---|---|---|---|
| FFA | EFA | ||||
| 1 | 9.97 | C14:0 | EC14:0 | Methyl n-tetradecanoate (Myristic acid methyl ester) | C15H30O2 |
| 2 | 11.08 | C15:0 | EC15:0 | Methyl n-pentadecanoate | C16H32O2 |
| 3 | 12.37 | C16:0 | EC16:0 | methyl hexadecanoate (Palmitic acid methyl ester) | C17H34O2 |
| 4 | 12.77 | C16:1n-7 | EC16:1n-7 | Methyl cis-9-hexadecenoate (Palmitoleic acid methyl ester) | C17H32O2 |
| 5 (internal standard) | 13.84 | C17:0 | EC17:0 | Methyl heptadecanoate | C18H36O2 |
| 6 | 14.66 | iso C18:0 | iso EC18:0 | Methyl 16-methylheptadecanoate (Iso-stearic acid methyl ester) | C19H38O2 |
| 7 | 15.49 | C18:0 | EC18:0 | Methyl octadecanoate (Stearic acid methyl ester) | C19H38O2 |
| 8 | 15.89 | C18:1n-9 | EC18:1n-9 | Methyl cis-9-octadecenoate (Oleic acid methyl ester) | C19H36O2 |
| 9 | 16.01 | C18:1n-7 | EC18:1n-7 | Methyl cis-11-octadecenoate (cis-Vaccenic acid methyl ester) | C19H36O2 |
| 10 | 16.74 | C18:2n-6 | EC18:2n-6 | Methyl cis-9,12-octadecadienoate (Linoleic acid methyl ester) | C19H34O2 |
| 11 | 17.30 | C19:0 | EC19:0 | Methyl nonadecanoate | C20H40O2 |
| 12 | 17.96 | C18:3n-3 | EC18:3n-3 | Methyl all-cis-9,12,15-octadecatrienoate (α-Linolenic acid methyl ester) | C19H32O2 |
| 13 | 19.24 | C20:0 | EC20:0 | Methyl eicosanoate (Arachidic acid methyl ester) | C21H42O2 |
| 14 | 19.67 | C20:1n-9 | EC20:1n-9 | Methyl cis-11-eicosenoate | C21H40O2 |
| 15 | 19.83 | C20:1n-7 | EC20:1n-7 | Methyl cis-13-eicosenoate | C21H40O2 |
| 16 | 20.60 | C20:2n-6 | EC20:2n-6 | Methyl cis-11,14-eicosadienoate | C21H38O2 |
| 17 | 21.13 | C20:3n-6 | EC20:3n-6 | Methyl cis-8,11,14-eicosatrienoate (Dihomo-γ-linolenic acid methyl ester) | C21H36O2 |
| 18 | 21.59 | C20:4n-6 | EC20:4n-6 | Mehyl cis-5,8,11,14-eicosatetraenoate (Arachidonic acid methyl ester) | C21H34O2 |
| 19 | 23.01 | C20:5n-3 | EC20:5n-3 | methyl cis-5,8,11,14,17-eicosapentaenoate | C21H32O2 |
| 20 | 26.64 | C22:4n-6 | EC22:4n-6 | methyl cis-7,10,13,16-docosatetraenoate (Adrenic acid methyl ester) | C23H38O2 |
| 21 | 28.88 | C22:5n-3 | EC22:5n-3 | methyl cis-7,10,13,16,19-docosapentaenoate | C23H36O2 |
| 22 | 29.98 | C22:6n-3 | EC22:6n-3 | methyl cis-4,7,10,13,16,19-docosahexaenoate | C23H34O2 |
© 2017 by the authors. Licensee MDPI, Basel, Switzerland. This article is an open access article distributed under the terms and conditions of the Creative Commons Attribution (CC BY) license (http://creativecommons.org/licenses/by/4.0/).
Share and Cite
Sham, T.T.; Zhang, H.; Mok, D.K.W.; Chan, S.W.; Wu, J.; Tang, S.; Chan, C.O. Chemical Analysis of Astragali Complanati Semen and Its Hypocholesterolemic Effect Using Serum Metabolomics Based on Gas Chromatography-Mass Spectrometry. Antioxidants 2017, 6, 57. https://doi.org/10.3390/antiox6030057
Sham TT, Zhang H, Mok DKW, Chan SW, Wu J, Tang S, Chan CO. Chemical Analysis of Astragali Complanati Semen and Its Hypocholesterolemic Effect Using Serum Metabolomics Based on Gas Chromatography-Mass Spectrometry. Antioxidants. 2017; 6(3):57. https://doi.org/10.3390/antiox6030057
Chicago/Turabian StyleSham, Tung Ting, Huan Zhang, Daniel Kam Wah Mok, Shun Wan Chan, Jianhong Wu, Songyun Tang, and Chi On Chan. 2017. "Chemical Analysis of Astragali Complanati Semen and Its Hypocholesterolemic Effect Using Serum Metabolomics Based on Gas Chromatography-Mass Spectrometry" Antioxidants 6, no. 3: 57. https://doi.org/10.3390/antiox6030057
APA StyleSham, T. T., Zhang, H., Mok, D. K. W., Chan, S. W., Wu, J., Tang, S., & Chan, C. O. (2017). Chemical Analysis of Astragali Complanati Semen and Its Hypocholesterolemic Effect Using Serum Metabolomics Based on Gas Chromatography-Mass Spectrometry. Antioxidants, 6(3), 57. https://doi.org/10.3390/antiox6030057