Phenolic Profile and Antioxidant Activity of Italian Monovarietal Extra Virgin Olive Oils

 ,
, 
 ,
,  ,
,  ,
,  ,
, 

Abstract
1. Introduction
2. Materials and Methods
2.1. Plant Material and Oil Production
2.2. Chemicals
2.3. Phenolic Compounds: Extraction, Identification, and Quantification
2.4. Antioxidant Activity
2.5. Statistical Analysis
3. Results
4. Discussion
5. Conclusions
Author Contributions
Funding
Conflicts of Interest
References
- Servili, M.; Montedoro, G.F. Contribution of phenolic compounds to virgin olive oil quality. Eur. J. Lipid Sci. Technol. 2002, 104, 602–613. [Google Scholar] [CrossRef]
- Carrasco Pancorbo, A.; Neusub, C.; Pelzing, M.; Segura Carrettero, A.; Fernandez Gutierrez, A. CE-and HPLC-TOF-MS for the characterization of phenolic compounds in olive oil. Electrophoresis 2007, 28, 806–821. [Google Scholar] [CrossRef] [PubMed]
- Vitaglione, P.; Savarese, M.; Paduano, A.; Scalfi, L.; Fogliano, V.; Sacchi, R. Healthy Virgin Olive Oil: A Matter of Bitterness. Crit. Rev. Food Sci. Nutr. 2015, 55, 1808–1818. [Google Scholar] [CrossRef] [PubMed]
- Capriotti, A.L.; Cavaliere, C.; Crescenzi, C.; Foglia, P.; Nescatelli, R.; Samperi, R.; Laganà, A. Comparison of extraction methods for the identification and quantification of polyphenols in virgin olive oil by ultra-HPLC-QTOF mass spectrometry. Food Chem. 2014, 158, 392–400. [Google Scholar] [CrossRef] [PubMed]
- Gorzynik-Debicka, M.; Przychodzen, P.; Cappello, F.; Kuban-Jankowska, A.; Marino Gammazza, A.; Knap, N.; Wozniakand, M.; Gorska-Ponikowska, M. Potential Health Benefits of Olive Oil and Plant Polyphenols. Int. J. Mol. Sci. 2018, 19, 686. [Google Scholar] [CrossRef] [PubMed]
- Carrasco Pancorbo, A.; Cerretani, L.; Bendini, A.; Segura-Carrettero, A.; Del Carlo, M.; Gallina-Toschi, T.; Lercker, G.; Compagnone, D.; Fernandez-Gutierrez, A. Evaluation of the antioxidant capacity of individual phenolic compounds in virgin olive oil. J. Agric. Food Chem. 2005, 53, 8918–8925. [Google Scholar] [CrossRef] [PubMed]
- Ninfali, P.; Aluigi, G.; Bacchiocca, M.; Magnani, M. Antioxidant capacity of extra-virgin olive oils. J. Am. Oil Chem. Soc. 2001, 78, 243–247. [Google Scholar] [CrossRef]
- Bendini, A.; Cerretani, L.; Carrasco-Pancorbo, A.; Gomez-Caravaca, A.; Segura-Cerretero, A.; Fernandez-Gutierrez, A.; Lercker, G. Phenolic molecules in virgin olive oils: A survey of their sensory properties, health effects, antioxidant activity and analytical methods. An overview of the last decade. Molecules 2007, 12, 1679–1719. [Google Scholar] [CrossRef]
- Khanal, P.; Oh, W.; Yun, H.J.; Namgoong, G.M.; Ahn, S.; Kwon, S.; Choi, H.; Choi, H.S. p-HPEA-EDA, a phenolic compound of virgin olive oil, activates AMP-activated protein kinase to inhibit carcinogenesis. Carcinogen 2011, 32, 545–553. [Google Scholar] [CrossRef]
- Cioffi, G.; Pesca, S.M.; De Caprariis, P.; Braca, A.; Severino, L.; De Tommasi, N. Phenolic compounds in olive oil and olive pomace from Cilento (Campania, Italy) and their antioxidant activity. Food Chem. 2010, 121, 105–111. [Google Scholar] [CrossRef]
- Houshia, O.J.; Qutit, A. Determination of total polyphenolic antioxidants contents in west-bank olive oil. J. Nat. Sci. Res. 2014, 4, 71–76. [Google Scholar]
- Cicerale, S.; Lucas, L.J. Antimicrobial, antioxidant and anti-inflammatory phenolic activities in extra virgin olive oil. Curr. Opin. Biotechnol. 2012, 23, 129–135. [Google Scholar] [CrossRef] [PubMed]
- Weinbrenner, T.; Fito, M.; De la Torre, R.; Saez, G.; Rijken, P.; Tormos, C.; Coolen, S.; Albaladejo, M.F.; Abanades, S.; Schroder, H.; et al. Olive oils high in phenolic compounds modulate oxidative/antioxidative status in men. Nutr. Metab. 2004, 134, 2314–2321. [Google Scholar] [CrossRef] [PubMed]
- Visioli, F.; Caruso, D.; Grande, S.; Bosisio, R.; Villa, M.; Galli, M.; Sirtori, C.; Galli, C. Virgin olive oil study (VOLOS): Vasoprotective potential of extra virgin olive oil in mildly dyslipidemic patients. Eur. J. Nutr. 2005, 44, 121–127. [Google Scholar] [CrossRef] [PubMed]
- Fito, M.; De la Torre, R.; Marti, J.; Alcantara, M.; Pujadas-Bastardes, M.; Marrugat, J.; Bruguera, J.; Lopez-Sabater, M.C.; Vila, J.; Covas, M.I. Antioxidant effect of virgin olive oil in patients with stable coronary heart disease: A randomized, crossover, controlled, clinical study. Atherosclerosis 2005, 181, 149–159. [Google Scholar] [CrossRef] [PubMed]
- Covas, M.I.; Nyyssonen, K.; Poulsen, H.E.; Kaikkonen, J.; Zunft, H.J.F.; Kiesewetter, H.; Gaddi, A.; De la Torre, R.; Mursu, J.; Baumler, H.; et al. The effect of polyphenols in olive oil on heart disease risk factor. Ann. Int. Med. 2006, 145, 333–341. [Google Scholar] [CrossRef]
- Salvini, S.; Sera, F.; Caruso, D.; Giovannelli, L.; Visioli, F.; Saivena, C.; Masala, G.; Ceroti, M.; Giovacchini, V.; Pitozzi, V.; et al. Daily consumption of a high-phenol extra-virgin olive oil reduces oxidative DNA damage in postmenopausal women. Br. J. Nutr. 2006, 95, 742–751. [Google Scholar] [CrossRef]
- Bogani, P.; Galli, C.; Villa, M.; Visioli, F. Postprandial anti-inflammatory and antioxidant effects of extra virgin olive oil. Atherosclerosis 2007, 190, 181–186. [Google Scholar] [CrossRef]
- Garcia, J.F.; Bullo, M.; Canudas, S.; Martinez-Gonzales, M.A.; Estruch, R.; Giardina, S.; Fito, M.; Corella, D.; Ros, E.; Salas-Salvado, J. Extra virgin olive oil consumption reduces the risk of osteoporotic fractures in the PREDIMED trial. Clin. Nutr. 2018, 37, 329–335. [Google Scholar] [CrossRef]
- Francisco, V.; Ruiz-Fernández, C.; Lahera, V.; Lago, F.; Pino, J.; Skaltsounis, L.; González-Gay, M.A.; Mobasheri, A.; Gómez, R.; Scotece, M.; et al. Natural Molecules for Healthy Lifestyles: Oleocanthal from Extra Virgin Olive Oil. J. Agric. Food Chem. 2019, 67, 3845–3853. [Google Scholar] [CrossRef]
- FDA Completes Review of Qualified Health Claim Petition for Oleic Acid and the Risk of Coronary Heart Disease. Available online: https://www.fda.gov/Food/NewsEvents/ConstituentUpdates/ucm624758.htm (accessed on 4 April 2019).
- Commission Regulation (EU) No 432/2012 of 16 May 2012. Establishing a List of Permitted Health Claims Made on Foods, other than those Referring to the Reduction of Disease Risk and to Children’s Development and Health. Available online: https://eur-lex.europa.eu/eli/reg/2012/432/oj (accessed on 4 April 2019).
- Ricciutelli, M.; Marconi, S.; Boarelli, M.C.; Caprioli, G.; Sagratini, G.; Ballini, R.; Fiorini, D. Olive oil polyphenols: A quantitative method by high-performance-liquid-chromatography-diode-array detection for their determination and the assessment of the related health claim. J. Chromatogr. A 2017, 1481, 53–63. [Google Scholar] [CrossRef] [PubMed]
- Bajoub, A.; Carrasco-Pancorbo, A.; Ajaal, E.A.; Ouazzani, N. Potential of LC-MS phenolic profiling combined with multivariate analysis as an approach for the determination of the geographical origin of north Moroccan virgin olive oil. Food Chem. 2015, 166, 292–300. [Google Scholar] [CrossRef] [PubMed]
- Loubiri, A.; Taamalli, A.; Talhaoui, N.; Mohamed, S.N.; Carretero, A.; Zarrrouk, M. Usefulness of phenolic profile in the classification of extra virgin olive oils from autochthonous and introduced cultivars in Tunisia. Eur. Food Res. Technol. 2016, 3, 467–479. [Google Scholar] [CrossRef]
- Giuffre, A.M.; Piscopo, A.; Sicari, V.; Poiana, M. The effects of harvesting on phenolic compounds and fatty acids content in virgin olive oil (cv Roggianella). La Riv. Ital. Delle Sostanze Grasse 2010, 87, 14–23. [Google Scholar]
- Garcia-Villalba, R.; Carrasco Pancorbo, A.; Vazquez-Martin, A.; Olivera-Ferraros, C.; Menendez, J.A.; Segura Carrettero, A.; Fernandez Gutierrez, A. A 2-D-HPLC-CE platform coupled to ESI-TOF-MS to characterize the phenolic fraction in olive oil. Electrophoresis 2009, 30, 2688–2701. [Google Scholar] [CrossRef] [PubMed]
- Guzman, E.; Baeten, V.; Fernandez Pierna, J.A.; Garcia-Mesa, J.A. Determination of the olive maturity index of intact fruits using image analysis. J. Food Sci. Technol. 2015, 52, 1462–1470. [Google Scholar] [CrossRef] [PubMed]
- Singleton, V.L.; Rossi, J.A. Colorimetry of total phenolics with phosphomolybdic-phosphotungstic acid reagents. Am. J. Enol. Vitic. 1965, 16, 144–158. [Google Scholar]
- Bondet, V.; Brand-Williams, W.; Berset, C. Kinetics and Mechanisms of Antioxidant Activity Using the DPPH• free Radical Method. LWT Food Sci. Technol. 1997, 30, 609–615. [Google Scholar] [CrossRef]
- Ou, B.; Hampsch-Woodill, M.; Prior, R.L. Development and Validation of an Improved Oxygen Radical Absorbance Capacity Assay Using Fluorescein as the Fluorescent Probe. J. Agric. Food Chem. 2001, 49, 4619–4626. [Google Scholar] [CrossRef] [PubMed]
- Metsalu, T.; Vilo, J. Clustvis: A web tool for visualizing clustering of multivariate data using Principal Component Analysis and heatmap. Nucl. Acids Res. 2015, 43, W566–W570. [Google Scholar] [CrossRef] [PubMed]
- Baiano, A.; Gambacorta, G.; Terracone, C.; Previtali, M.A.; Lamacchia, C.; La Notte, E. Changes in phenolic content and antioxidant activity of Italian extra-virgin olive oils during storage. Food Chem. 2009, 74, 177–183. [Google Scholar] [CrossRef] [PubMed]
- Fuentes, E.; Paucar, F.; Tapia, F.; Ortiz, J.; Jimenez, P.; Romero, N. Effect of the composition of extra virgin olive oils on the differentiation and antioxidant capacities of twelve monovariatals. Food Chem. 2018, 243, 285–294. [Google Scholar] [CrossRef] [PubMed]
- Bakhouche, A.; Lozano-Sanchez, J.; Beltran-Debon, R.; Joven, J.; Segura Carretero, A.; Fernandez-Gutierrez, A. Phenolic characterization and geographical classification of commercial Arbequina extra-virgin olive oils produced in southern Catalonia. Food Res. Int. 2013, 50, 401–408. [Google Scholar] [CrossRef]
- Kalogeropoulos, N.; Tsimidou, M.Z. Antioxidants in Greek Virgin Olive Oils. Antioxidants 2014, 3, 387–413. [Google Scholar] [CrossRef] [PubMed]
- Olmo-García, L.; Fernández-Fernández, C.; Hidalgo, A.; Vílchez, P.; Fernández-Gutiérrez, A.; Marchal, R.; Carrasco-Pancorbo, A. Evaluating the reliability of specific and global methods to assess the phenolic content of virgin olive oil: Do they drive to equivalent results? J. Chromatogr. A 2019, 1585, 56–69. [Google Scholar] [CrossRef] [PubMed]
- Özcan, M.M.; Fındık, S.; AlJuhaimi, F.; Ghafoor, K.; Babiker, E.E.; Adiamo, L. The effect of harvest time and varieties on total phenolics, antioxidant activity and phenolic compounds of olive fruit and leaves. J. Food Sci. Technol. 2019, 56, 2373–2385. [Google Scholar] [CrossRef]
- Parkinson, L.; Keast, R. Oleocanthal, a phenolic derived from virgin olive oil: A review of the beneficial effects on inflammatory disease. Int. J. Mol. Sci. 2014, 15, 12323–12334. [Google Scholar] [CrossRef] [PubMed]
- Pang, K.; Chin, K. The biological activities of oleocanthal from a molecular perspective. Nutrients 2018, 10, 570. [Google Scholar] [CrossRef]
- Baccouri, O.; Cerretani, L.; Bendini, A.; Caboni, M.F.; Zarrouk, M.; Pirrone, L.; Miled, D.D.B. Preliminary chemical characterization of Tunisian monovarietal virgin olive oils and comparison with Sicilian ones. Eur. J. Sci. Technol. 2007, 109, 1208–1217. [Google Scholar] [CrossRef]
- Robles-Almaza, M.; Pulido-Moran, M.; Moreno-Fernandez, J.; Ramirez-Tortosa, C.; Rodriguez-Garcia, C.; Quiles, J.L.; Ramirez-Tortosa, M.C. Hydroxytyrosol: Bioavailability, toxicity, and clinical applications. Food Res. Int. 2018, 105, 654–667. [Google Scholar] [CrossRef]
- Sanchez, C.S.; Troncoso Gonzalez, A.M.; Garcia-Parilla, M.C.; Quesada Granados, J.J.; Lopez Garcia de la Serrana, H.; Lopez Martinez, M.C. Different radical scavenging tests in virgin olive oil and their relation to the total phenol content. An. Act. 2007, 593, 103–107. [Google Scholar] [CrossRef] [PubMed]
- Roche, M.; Dufour, C.; Mora, N.; Dangles, O. Antioxidant activity of olive phenols: Mechanistic investigation and characterization of oxidation products by mass spectrometry. Org. Biomol. Chem. 2005, 3, 423–430. [Google Scholar] [CrossRef] [PubMed]
- Presti, G.; Guarrasi, V.; Gullotta, E.; Provenzano, F.; Provenzano, A.; Giuliano, S.; Monfreda, M.; Mangione, M.R.; Passantino, R.; San Biagio, P.L.; et al. Bioactive compounds from extra virgin olive oils: Correlation between phenolic content and oxidative stress cell protection. Biophys. Chem. 2017, 230, 109–116. [Google Scholar] [CrossRef] [PubMed]
- Lavelli, V. Comparison of the antioxidant activities of extra virgin olive oils. J. Agric. Food Chem. 2002, 50, 7704–7708. [Google Scholar] [CrossRef] [PubMed]
- Loizzo, M.; Di Lecce, G.; Boselli, E.; Menichini, F.; Frega, N.G. Radical scavenging, total antioxidant capacity and antiproliferative activity of phenolic extracts from extra virgin olive oil by cultivar frantoio. Int. J. Food Prod. 2012, 15, 1345–1357. [Google Scholar] [CrossRef]
- Ninfali, P.; Bacchiocca, M.; Biagiotti, E.; Servili, M.; Montedoro, G. Validation of the oxygen radical absorbance capacity (ORAC) parameter as new index of quality and stability of virgin olive oil. J. Am. Oil Chem. Soc. 2002, 79, 977–981. [Google Scholar] [CrossRef]
- Galvano, F.; La Fauci, L.; Graziani, G.; Ferracane, R.; Masella, R.; Di Giacomo, C.; Scacco, A.; D’archivio, M.; Vanella, L.; Galvano, G. Phenolic compounds and antioxidant activity of Italian extravirgin olive oil Monti Iblei. J. Med. Food 2007, 10, 650–656. [Google Scholar] [CrossRef] [PubMed]


| Genotype |
|---|
| Colozzese |
| Barone di Monteprofico |
| Cellina di Nardò |
| Cornola |
| Ogliarola di Lecce |
| Orniella |
| Oliva Grossa |
| Spina |
| Genotype | Total Phenolic Content (mg GAE/kg oil) |
|---|---|
| Colozzese | 251 ± 12 a |
| Barone di Monteprofico | 202 ± 14 b |
| Cellina di Nardò | 253 ± 7 a |
| Cornola | 189 ± 10 b |
| Ogliarola di Lecce | 278 ± 9 a |
| Orniella | 198 ± 3 b |
| Oliva Grossa | 273 ± 3 a |
| Spina | 138 ± 7 b |
| Peak | Compound | (M-H)− | m/z Exp | m/z Calc | Diff. (ppm) | Score | Ref. | Co | Ba | Ce | Cr | Og | Or | Oo | Sp |
|---|---|---|---|---|---|---|---|---|---|---|---|---|---|---|---|
| 1 | *Quinic acid | C7H11O6 | 191.0561 | 191.0563 | 1.1 | 94.02 | 25 | + | + | + | + | + | + | + | + |
| 2 | *Hydroxytyrosol | C8H9O3 | 153.0563 | 153.0557 | −2.90 | 81.59 | 2, 4 | + | + | + | + | + | + | + | + |
| 3 | Deoxyelenoic acid | C11H14O5 | 225.0783 | 225.0768 | −6.36 | 91.50 | 2, 25 | + | + | + | + | + | + | + | + |
| 4 | Hydroxytyrosol acetate | C10H11O4 | 195.0647 | 195.0663 | 8.07 | 86.46 | 4 | + | + | − | + | + | + | + | + |
| 5 | *Vanillic acid | C8H8O4 | 167.0353 | 167.0345 | 3.0 | 87.23 | 25 | + | − | + | + | + | + | + | − |
| 6 | Elenoic acid is. 1 | C11H14O6 | 241.0731 | 241.0718 | −5.71 | 90.20 | 2, 25 | + | + | + | + | + | + | + | + |
| 7 | Tyrosol | C8H10O2 | 137.0610 | 137.0605 | 3.64 | 87.23 | 25 | + | + | + | + | + | + | + | + |
| 8 | *Cumaric acid | C9H15O4 | 163.0398 | 163.0401 | −3.93 | 92.50 | 2, 25 | + | − | + | + | + | + | + | + |
| 9 | Unknow | − | 299.0555 | − | − | − | + | − | − | + | + | + | + | + | |
| 10 | Elenoic acid is. 2 | C11H14O6 | 241.0731 | 241.0718 | −5.71 | 89.52 | 2, 4 | + | + | + | + | + | + | + | + |
| 11 | Deoxyelenoic acid is. 2 | C11H14O5 | 225.0783 | 225.0768 | −6.36 | 91.50 | 2, 4 | + | − | + | − | + | + | + | + |
| 12 | Elenoic acid is. 3 | C11H14O6 | 241.0731 | 241.0718 | −5.71 | 89.52 | 2, 4 | + | + | − | + | + | + | + | + |
| 13 | *Ferulic acid | C10H9O4 | 193.0507 | 193.0506 | 0.51 | 90.21 | 4 | + | + | + | − | + | + | + | + |
| 14 | Decarboxymethyl oleuropein aglycone | C17H19O6 | 319.1313 | 319.1187 | −7.96 | 88.20 | 4, 25 | + | + | + | + | + | + | + | + |
| 15 | Decarboxymethyl 10-Hydroxy oleuropein aglycone | C17H19O7 | 335.1163 | 335.1136 | −7.85 | 87.70 | 2, 4 | + | + | + | − | + | + | + | + |
| 16 | Oleuropein aglycone is. 1 | C19H21O8 | 377.1266 | 377.1242 | −6.34 | 86.70 | 2 | + | + | + | + | + | + | + | + |
| 17 | *Pinoresinol | C20H21O6 | 357.1338 | 357.1344 | 1.68 | 85.32 | 25 | + | + | + | + | + | + | + | + |
| 18 | Decarboxymethyl ligstroside aglycone | C17H19O5 | 303.1252 | 303.1238 | −4.51 | 90 | 4 | + | + | + | + | + | + | + | + |
| 19 | Oleuropein aglycone is. 2 | C19H21O8 | 377.1269 | 377.1242 | −7.09 | 86.60 | 2, 4 | + | + | + | + | + | + | + | + |
| 20 | Hydroxymethyl decarboxymethyl ligstroside aglycone | C18H21O6 | 333.1360 | 333.1344 | −5 | 88.69 | 4 | + | + | + | − | + | + | + | + |
| 21 | Ligstroside is. 1 | C19H21O7 | 361.1319 | 361.1351 | 9.08 | 87.00 | 2, 4 | + | + | + | + | + | + | + | + |
| 22 | *Luteolin | C15H9O6 | 285.0432 | 285.0485 | −9.78 | 88.00 | 2, 4 | + | + | + | + | + | + | + | + |
| 23 | Acetoxypinoresinol | C22H23O8 | 415.1404 | 415.1398 | −1.42 | 98.94 | 4, 25 | + | + | + | + | + | + | + | + |
| 24 | Oleuropein aglycone is. 3 | C19H21O8 | 377.1271 | 377.1242 | −7.77 | 85.60 | 2 | + | + | + | + | + | + | + | + |
| 25 | Oleuropein aglycone is. 4 | C19H21O8 | 377.1261 | 377.1242 | −1.90 | 86.40 | 2 | + | + | + | + | + | + | + | + |
| 26 | Ligstroside is. 2 | C19H21O7 | 361.1316 | 361.1293 | −2.30 | 86.70 | 2, 4 | + | + | + | + | + | + | + | + |
| 27 | Methyloleuropein aglycone | C20H23O8 | 391.1408 | 391.1398 | −2.49 | 92.63 | 4 | + | + | + | + | + | + | + | − |
| 28 | *Apigenin | C15H9O5 | 269.0459 | 269.0455 | −1.39 | 86.80 | 2, 4 | + | + | + | + | + | + | + | + |
| 29 | Ligstroside is. 3 | C19H21O7 | 361.1321 | 361.1293 | −7.78 | 86.20 | 2, 4 | + | + | + | + | + | + | + | + |
| 30 | Ligstroside is. 4 | C19H21O7 | 361.1321 | 361.1293 | −7.78 | 86.20 | 2, 4 | + | + | + | + | + | + | + | + |
| 31 | 10-Hydroxy oleuropein aglycone | C19H21O9 | 393.1205 | 393.1191 | −3.66 | 89.95 | 2 | + | + | + | + | + | + | + | + |
| 32 | Unknown | − | 319.1210 | − | − | − | − | + | + | + | + | + | + | + | + |
| 33 | Unknown | − | 389.2140 | − | − | − | − | + | + | + | + | + | + | + | + |
| 34 | Unknown | − | 346.0352 | − | − | − | − | + | + | + | + | + | + | + | + |
| Peak | Compound | Colozzese | Barone di Monteprofico | Cellina di Nardò | Cornola | Ogliarola di Lecce | Orniella | Oliva Grossa | Spina |
|---|---|---|---|---|---|---|---|---|---|
| 1 | Quinic acid | 0.6 ± 0.1 c | 0.7 ± 0.1 b | 1.1 ± 0.1 a | 0.2 ± 0.1 e | 1.1 ± 0.1 a | 0.1 ± 0.1 d | 1.0 ± 0.1 a | 0.1 ± 0.1 d |
| 2 | Hydroxytyrosol | 16.1 ± 0.1 a | 0.5 ± 0.1 d | 1.4 ± 0.2 d | 1.37 ± 0.35 d | 3.1 ± 0.2 c | 4.2 ± 0.7 c | 8.8 ± 0.5 b | 0.2 ± 0.1 d |
| 3 | Deoxyelenoic acid | 4.5 ± 0.2 a | 1.6 ± 0.4 c | 1.1 ± 0.4 c | 1.6 ± 0.3 c | 1.0 ± 0.1 c | 1.1± 0.4 c | 2.7 ± 0.2 b | 1.0 ± 0.4 c |
| 6 | 1 Elenoic acid is. 1 | 25.8 ± 0.6 a | 9.5 ± 0.8 c | 6.9 ± 0.9 d | 1.8 ± 0.4 e | 6.6 ± 0.8 d | 7.1 ± 0.1 d | 12.1 ± 0.5 b | 0.9 ± 0.5 e |
| 14 | 2 D-oleuropein aglycone* | 39.0 ± 0.7 d | 7.9 ± 0.1 g | 73.6 ± 0.5 b | 11.7 ± 0.2 f | 64.9 ± 0.6 c | 13.2 ± 0.5 f | 124.4 ± 0.5 a | 19.4 ± 0.3 e |
| 16 | 2 Oleuropein aglycone is. 1 | 4.2 ± 0.4 b | 3.9 ± 0.4 b | 0.3 ± 0.4 d | 1.0 ± 0.1 d | 9.7 ± 0.6 a | 2.3 ± 0.3 c | 10.1 ± 0.6 a | 8.3 ± 0.2 a |
| 17 | Pinoresinol | 6.5 ± 0.4 b | 18.6 ± 0.1 b | 1.4 ± 0.4 d | 1.6 ± 0.2 d | 4.6 ± 0.6 bc | 1.6 ± 0.4 d | 21.9 ± 0.6 a | 3.4 ± 0.5 c |
| 18 | 2 D-ligstroside aglycone** | 75.4 ± 0.2 b | 4.3 ± 0.2 h | 68.3 ± 0.5 d | 10.2 ± 0.6 f | 64.5 ± 0.8 e | 6.7 ± 0.7 g | 103.4 ± 0.8 a | 12.4 ± 0.8 f |
| 19 | Oleuropein aglycone is. 2 | 28.2 ± 0.7 c | 4.3 ± 0.5 e | 15.3 ± 0.2 d | 33.1 ± 0.7 b | 24.1 ± 0.4 c | 26.2 ± 0.8 c | 34.3 ± 0.8 b | 52.6 ± 0.6 a |
| 21 | 2Ligstroside is. 1 | 2.2 ± 0.5 e | 3.3 ± 0.3 de | 13.7 ± 0.2 b | 23.2 ± 0.6 a | 4.2 ± 0.4 d | 6.6 ± 0.3 c | 14.1 ± 0.3 b | 2.7 ± 0.1 e |
| 22 | Luteolin | 7.6 ± 0.4 d | 9.9 ± 0.7 c | 8.0 ± 0.7 cd | 2.2 ± 0.5 e | 7.6 ± 0.3 d | 13.2 ± 0.2 b | 16.7 ± 0.6 a | 7.8 ± 0.5 d |
| 23 | 3 Acetoxypinoresinol | 5.6 ± 0.3 b | 2.5 ± 0.5 c | 2.8 ± 0.8 c | 7.4 ± 0.1 a | 3.2 ± 0.5 c | 1.5 ± 0.5 d | 0.8 ± 0.2 e | 3.1 ± 0.2 c |
| 24 | 2 Oleuropein aglycone is. 3 | 93.7 ± 0.4 b | 63.6 ± 0.2 e | 48.5 ± 0.8 f | 8.6 ± 0.1 g | 84.6 ± 0.1 c | 5.3 ± 0.1 h | 107.9 ± 0.7 a | 77.5 ± 0.5 d |
| 26 | 2 Ligstroside is. 2 | 0.8 ± 0.6 e | 1.0 ± 0.1 e | 31.2 ± 0.7 b | 21.4 ± 0.8 d | 51.1 ± 0.1 a | 1.2 ± 0.1 e | 27.1 ± 0.1 c | 21.4 ± 0.1 d |
| 28 | Apigenin | 6.5 ± 0.3 b | 5.8 ± 0.6 b | 0.2 ± 0.3 d | 9.2 ± 0.3 a | 0.2 ± 0.1 d | 3.9 ± 0.2 c | 3.8 ± 0.3 c | 4.3 ± 0.4 c |
| 31 | 210-Hydroxy oleuropein aglycone | 53.5 ± 0.8 c | 41.3 ± 0.3 d | 12.4 ± 0.2 g | 52.3 ± 0.9 c | 118.3 ± 0.2 b | 21.1 ± 0.7 e | 29.6 ± 0.8 f | 123.0 ± 0.7 a |
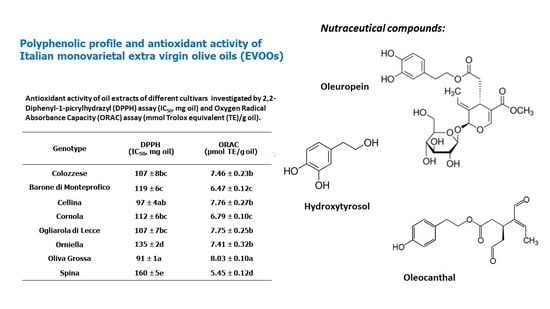
| Genotype | DPPH (IC50, mg oil) | ORAC (µmol TE/g oil) |
|---|---|---|
| Colozzese | 107 ± 8 bc | 7.5 ± 0.2 b |
| Barone di Monteprofico | 119 ± 6 c | 6.5 ± 0.1 c |
| Cellina di Nardò | 97 ± 4 ab | 7.8 ± 0.3 b |
| Cornola | 112 ± 6 bc | 6.8 ± 0.1 c |
| Ogliarola di Lecce | 107 ± 7 bc | 7.7 ± 0.2 b |
| Orniella | 135 ± 2 d | 7.4 ± 0.3 b |
| Oliva Grossa | 91 ± 1 a | 8.0 ± 0.1 a |
| Spina | 160 ± 5 e | 5.4 ± 0.1 d |
| Compound | Pearson Correlation Coefficient | |
|---|---|---|
| DPPH Test | ORAC Test | |
| Quinic acid | −0.81 | 0.65 |
| Hydroxytyrosol | −0.39 | 0.48 |
| Deoxyelenoic acid | −0.39 | 0.28 |
| Elenoic acid is. 1 | −0.44 | 0.44 |
| D-oleuropein aglycone* | −0.68 | 0.69 |
| Oleuropein aglycone is. 1 | 0.05 | 0.00 |
| Pinoresinol | −0.35 | 0.14 |
| D-ligstroside aglycone** | −0.74 | 0.74 |
| Oleuropein aglycone is. 2 | 0.49 | −0.38 |
| Ligstroside is. 1 | −0.44 | 0.25 |
| Luteolin | −0.13 | 0.38 |
| Acetoxypinoresinol | −0.02 | −0.23 |
| Oleuropein aglycone is. 3 | −0.26 | 0.14 |
| Ligstroside is. 2 | −0.31 | 0.29 |
| Apigenin | 0.19 | −0.42 |
| Hydroleuropein aglycone | 0.49 | −0.49 |
© 2019 by the authors. Licensee MDPI, Basel, Switzerland. This article is an open access article distributed under the terms and conditions of the Creative Commons Attribution (CC BY) license (http://creativecommons.org/licenses/by/4.0/).
Share and Cite
Negro, C.; Aprile, A.; Luvisi, A.; Nicolì, F.; Nutricati, E.; Vergine, M.; Miceli, A.; Blando, F.; Sabella, E.; De Bellis, L. Phenolic Profile and Antioxidant Activity of Italian Monovarietal Extra Virgin Olive Oils. Antioxidants 2019, 8, 161. https://doi.org/10.3390/antiox8060161
Negro C, Aprile A, Luvisi A, Nicolì F, Nutricati E, Vergine M, Miceli A, Blando F, Sabella E, De Bellis L. Phenolic Profile and Antioxidant Activity of Italian Monovarietal Extra Virgin Olive Oils. Antioxidants. 2019; 8(6):161. https://doi.org/10.3390/antiox8060161
Chicago/Turabian StyleNegro, Carmine, Alessio Aprile, Andrea Luvisi, Francesca Nicolì, Eliana Nutricati, Marzia Vergine, Antonio Miceli, Federica Blando, Erika Sabella, and Luigi De Bellis. 2019. "Phenolic Profile and Antioxidant Activity of Italian Monovarietal Extra Virgin Olive Oils" Antioxidants 8, no. 6: 161. https://doi.org/10.3390/antiox8060161
APA StyleNegro, C., Aprile, A., Luvisi, A., Nicolì, F., Nutricati, E., Vergine, M., Miceli, A., Blando, F., Sabella, E., & De Bellis, L. (2019). Phenolic Profile and Antioxidant Activity of Italian Monovarietal Extra Virgin Olive Oils. Antioxidants, 8(6), 161. https://doi.org/10.3390/antiox8060161