1. Introduction
Current concern about climate change has generated large efforts to reduce CO
2 emissions. Hydrogen selective membranes are envisaged as a key enabling technology in various processes to lower energy consumption and for capturing CO
2. Notably, inorganic hydrogen separation membranes have been studied for a long time for applications in so-called pre-combustion decarburization (PCDC) processes in power generation with CO
2 capture. Since the various types of hydrogen separation membranes cover an operation window from ambient to ~1000 °C, tailor-making of process schemes, conditions and membrane properties are both a challenge and a great possibility for improving energy efficiency and creating sustainable operation. One may currently find various conceptual integration possibilities aiming to bridge the gap between process operation window and membrane properties [
1,
2]. An important aspect of this integration is to ensure sufficient driving force for the flux. For dense metallic or porous hydrogen separation membranes, the driving force for flux is proportional to
![Membranes 02 00665 i009]()
where f and p refer respectively to the feed and permeate side, and
n is typically between 0.5 and 1 for dense metal membranes and 1 for porous membranes. For these, the driving force is the magnitude in the difference between the two pressures, dominated by the largest one, at the feed side. For dense ceramic membranes, however, the flux can be various functions of the hydrogen partial pressures over the membrane, commonly proportional to
![Membranes 02 00665 i010]()
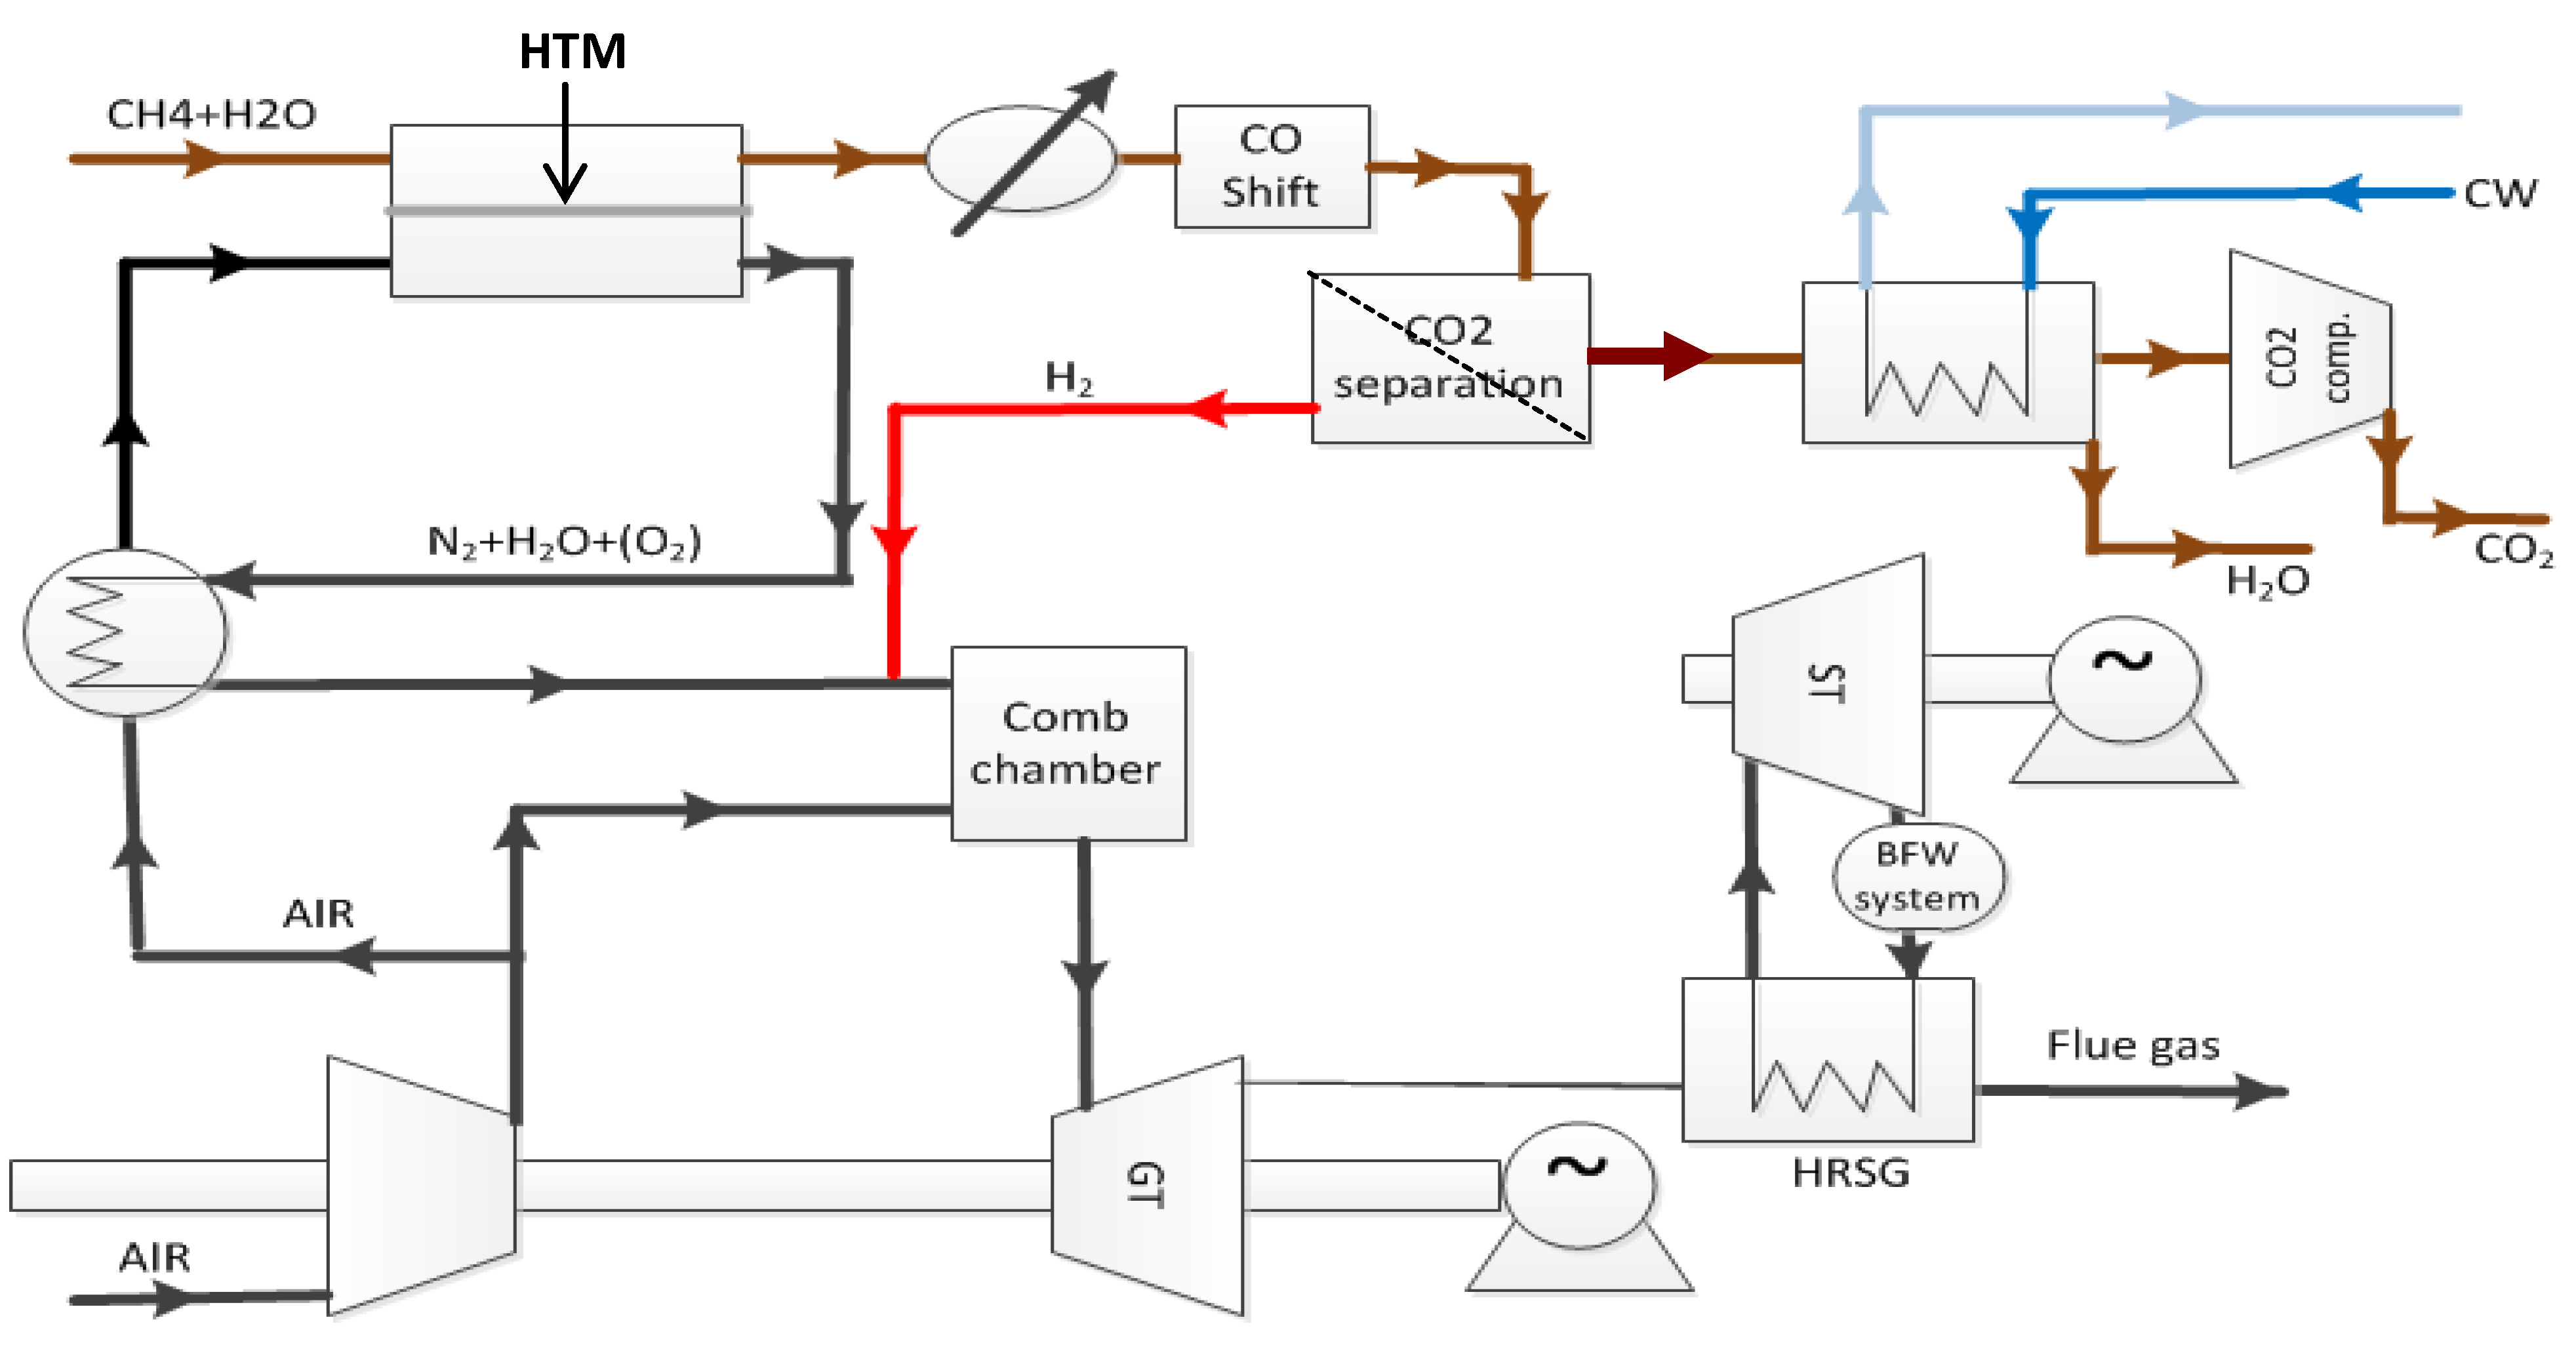
, and in this case, it is beneficial to generate the highest possible ratio of the partial pressures of hydrogen over the membrane. Surface limiting effects may change these relationships and decrease the flux. In the concept of Norsk Hydro (now merged with Statoil), see
Figure 1, a ceramic mixed conductor membrane for hydrogen separation is integrated at high temperature (900–1000 °C) in the reforming reaction, where a high driving force is sustained by keeping the permeate side at a very low partial pressure of hydrogen by reaction with oxygen in air [
3]. The purpose of the membrane is three-fold: (i) The membrane separates the two gas streams of natural gas (feed side) and air (permeate side). Hydrogen is transported from the feed side to the permeate side where it reacts with oxygen to generate heat to sustain the endothermic reforming process. The oxidation of hydrogen keeps the hydrogen partial pressure very low at the permeate side, which, as mentioned above, is particularly beneficial for the driving force for flux. (ii) Only the required amount of air required for heat generation is used, thus the permeate stream leaving the reactor is rich in N
2. Hence, the membrane process enables N
2 co-production that is required to dilute the hydrogen fuel for the subsequent gas turbine combustion process. (iii) Finally, the thin membrane acts as a heat exchanger material.
Figure 1.
PCDC process suggested by Statoil with integrated ceramic mixed conductor membrane [
3].
Figure 1.
PCDC process suggested by Statoil with integrated ceramic mixed conductor membrane [
3].
In dense ceramic hydrogen transport membranes (HTMs), one utilizes the mixed conductivity by electrons and protons to make the material permeable to hydrogen gas. The main difficulty for industrial deployment of HTMs lies in the identification of materials combining high proton concentrations and mobility at high temperature, high electron conductivity, and stability towards CO
2 [
4,
5]. To tackle these criteria, one may look for materials with mixed valence and modest band gaps in order to have electronic defects. But, first and foremost, one must look at proton concentration in terms of hydration thermodynamics. Nowadays, computational chemistry can predict hydration enthalpies quite reliably [
6]. Moreover, there are some empirical correlations for classes of oxides. Hence, perovskites are shown to exhibit more favorable hydration thermodynamics the lower their structural tolerance factors and the more similar the electronegativities are of the A and B site cations [
7,
8,
9,
10]. In other words: the more stable the perovskite structure, the fewer the protons at high temperature; the material prefers oxygen vacancies as positive charge carriers charge compensating acceptor dopants, and exhibits essentially oxide ion transport.
The prime candidates for HTMs early on were based on SrCeO
3 [
11] and related perovskites. Their composites with metals, such as Pt (for higher electronic transport) have also been investigated. As SrCeO
3 and related perovskites show poor thermodynamic stability and high reactivity with CO
2, there has been a long search for new and more stable materials, preferably without Sr or Ba as main components, in order to have sufficient stability towards acidic gases like CO
2 [
5]. At present, a few new materials have emerged as promising candidates, such as La
6WO
12, with stable compositions in the range La
6−xWO
12−3x/2 (6−
x = 5.3−5.7) [
12].
In the search of potential materials for their PCDC process, Statoil patented a range of alternative, stable perovskites as HTMs [
13] and suggested how they could be used in natural gas-fired power plants with carbon capture [
14]. One of the materials was based on LaCrO
3. The choice may be surprising because this perovskite should contain few protons according to the aforementioned correlations, which predict LaCrO
3 to have an endothermic hydration enthalpy of 12 kJ/mol. The argument in favor of this oxide was that the three d-electrons in Cr
3+ make this ion particularly stable in an octahedral crystal field, favoring a filled oxygen lattice with protons (as OH
− ions) over oxygen vacancies to a larger extent than expected from the general trend. Statoil optimized the composition for sinterability, developed porous tubular supports with dense thin layers of the material, and tested their use for hydrogen extraction. The hydration and hydrogen transport were investigated in collaborative projects with the University of Oslo and SINTEF over a number of years. During the work, it has become clear that the transport properties utilized in the PCDC process are more complex than anticipated. The ionic transport in the material appears to have contributions both from oxide ions and protons. This feature adds an interesting side effect of the membrane related to the operation condition in
Figure 1; namely that the membrane also contributes to partial oxidation and steam generation at the feed side by transporting oxygen from the permeate side, creating heat on the reforming side as well. The significance of this effect has not yet been fully explored, and should be a subject of a separate study; but it is interesting to note that the effect could reduce the need for the addition of steam to the feed stream since it is internally generated.
In this study, the transport properties, including hydrogen species of ceramic membranes of Sr-substituted LaCrO3 (LSC), are reported for the first time. We summarize the work done with LSC membranes—including hydrogen permeation as well as concentration and mobility of protons—based on formerly undisclosed results and new measurements. We shall see that LSC does indeed dissolve modest amounts of protons and exhibits proton conductivity mixed with p-type electronic and oxide ion conductivities, all depending on temperature, pO2, and pH2O. Production of hydrogen using such a material as a membrane towards a hydrogen-rich mixture stems partly from mixed protonic-electronic conduction, but may have a contribution from splitting of any water vapor in the permeate sweep gas, based on mixed oxide ion-electron conduction, and the two phenomena may be difficult to distinguish.
3. Results and Discussion
3.1. Conductivity vs. pH2O
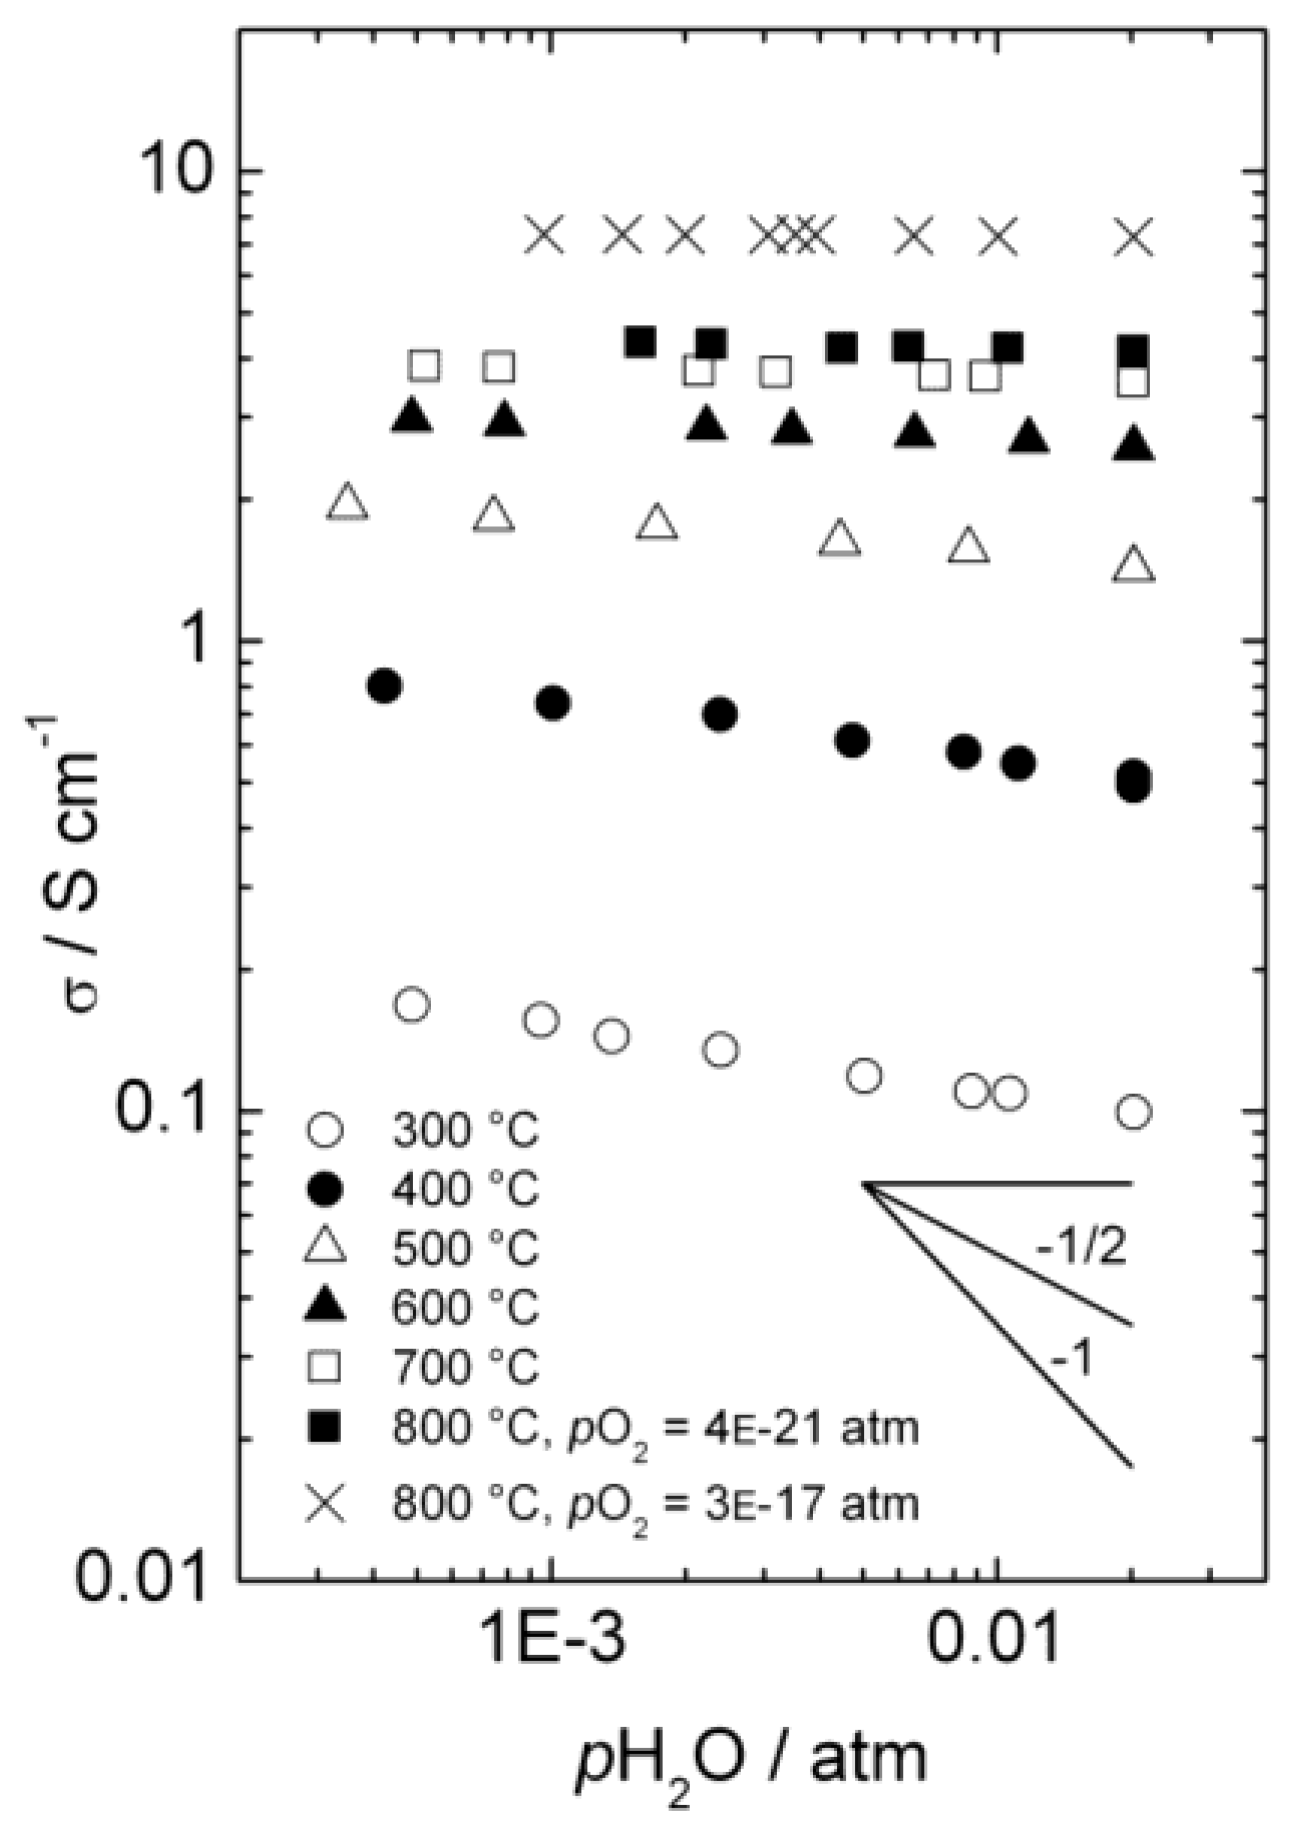
Figure 4 presents the total a.c. conductivity of La
0.9Sr
0.1CrO
3−δ as a function of
pH
2O in reducing atmospheres at temperatures from 300 to 800 °C. Each isotherm is made by diluting a mixture with fixed
pH
2/
pH
2O ratio with dry Ar, thus keeping
pO
2 essentially constant, while changing
pH
2O (and
pH
2). The values of
pO
2 vary from 3 × 10
−17 and 4 × 10
−21 atm (depending of
pH
2/
pH
2O ratio) at 800 °C to 2 × 10
−42 atm at 300 °C, and under these conditions we may assume that the acceptor dopant is, to a first approximation, charge-compensated by oxygen vacancies. This assumption is in agreement with the higher p-type electronic conductivity observed at
pO
2 = 3 × 10
−17 than at
pO
2 = 4 × 10
−21 atm at 800 °C, as the concentration of electron holes will increase with increasing
pO
2 when in the minority. Still, electron holes dominate the total conductivity, due to higher mobility than for ionic defects.
Figure 4.
Total a.c. conductivity as a function of water vapor partial pressure for La0.9Sr0.1CrO3−δ in reducing atmospheres.
Figure 4.
Total a.c. conductivity as a function of water vapor partial pressure for La0.9Sr0.1CrO3−δ in reducing atmospheres.
Below approximately 600 °C, the conductivity decreases with increasing pH2O, reflecting a decrease in the concentration of electron holes as protonic defects are introduced in significant numbers compared to the dominating oxygen vacancies.
By assuming that oxygen vacancies and protons are the dominating charge compensators (
![Membranes 02 00665 i014]()
), the equilibrium constant of Equation (3),
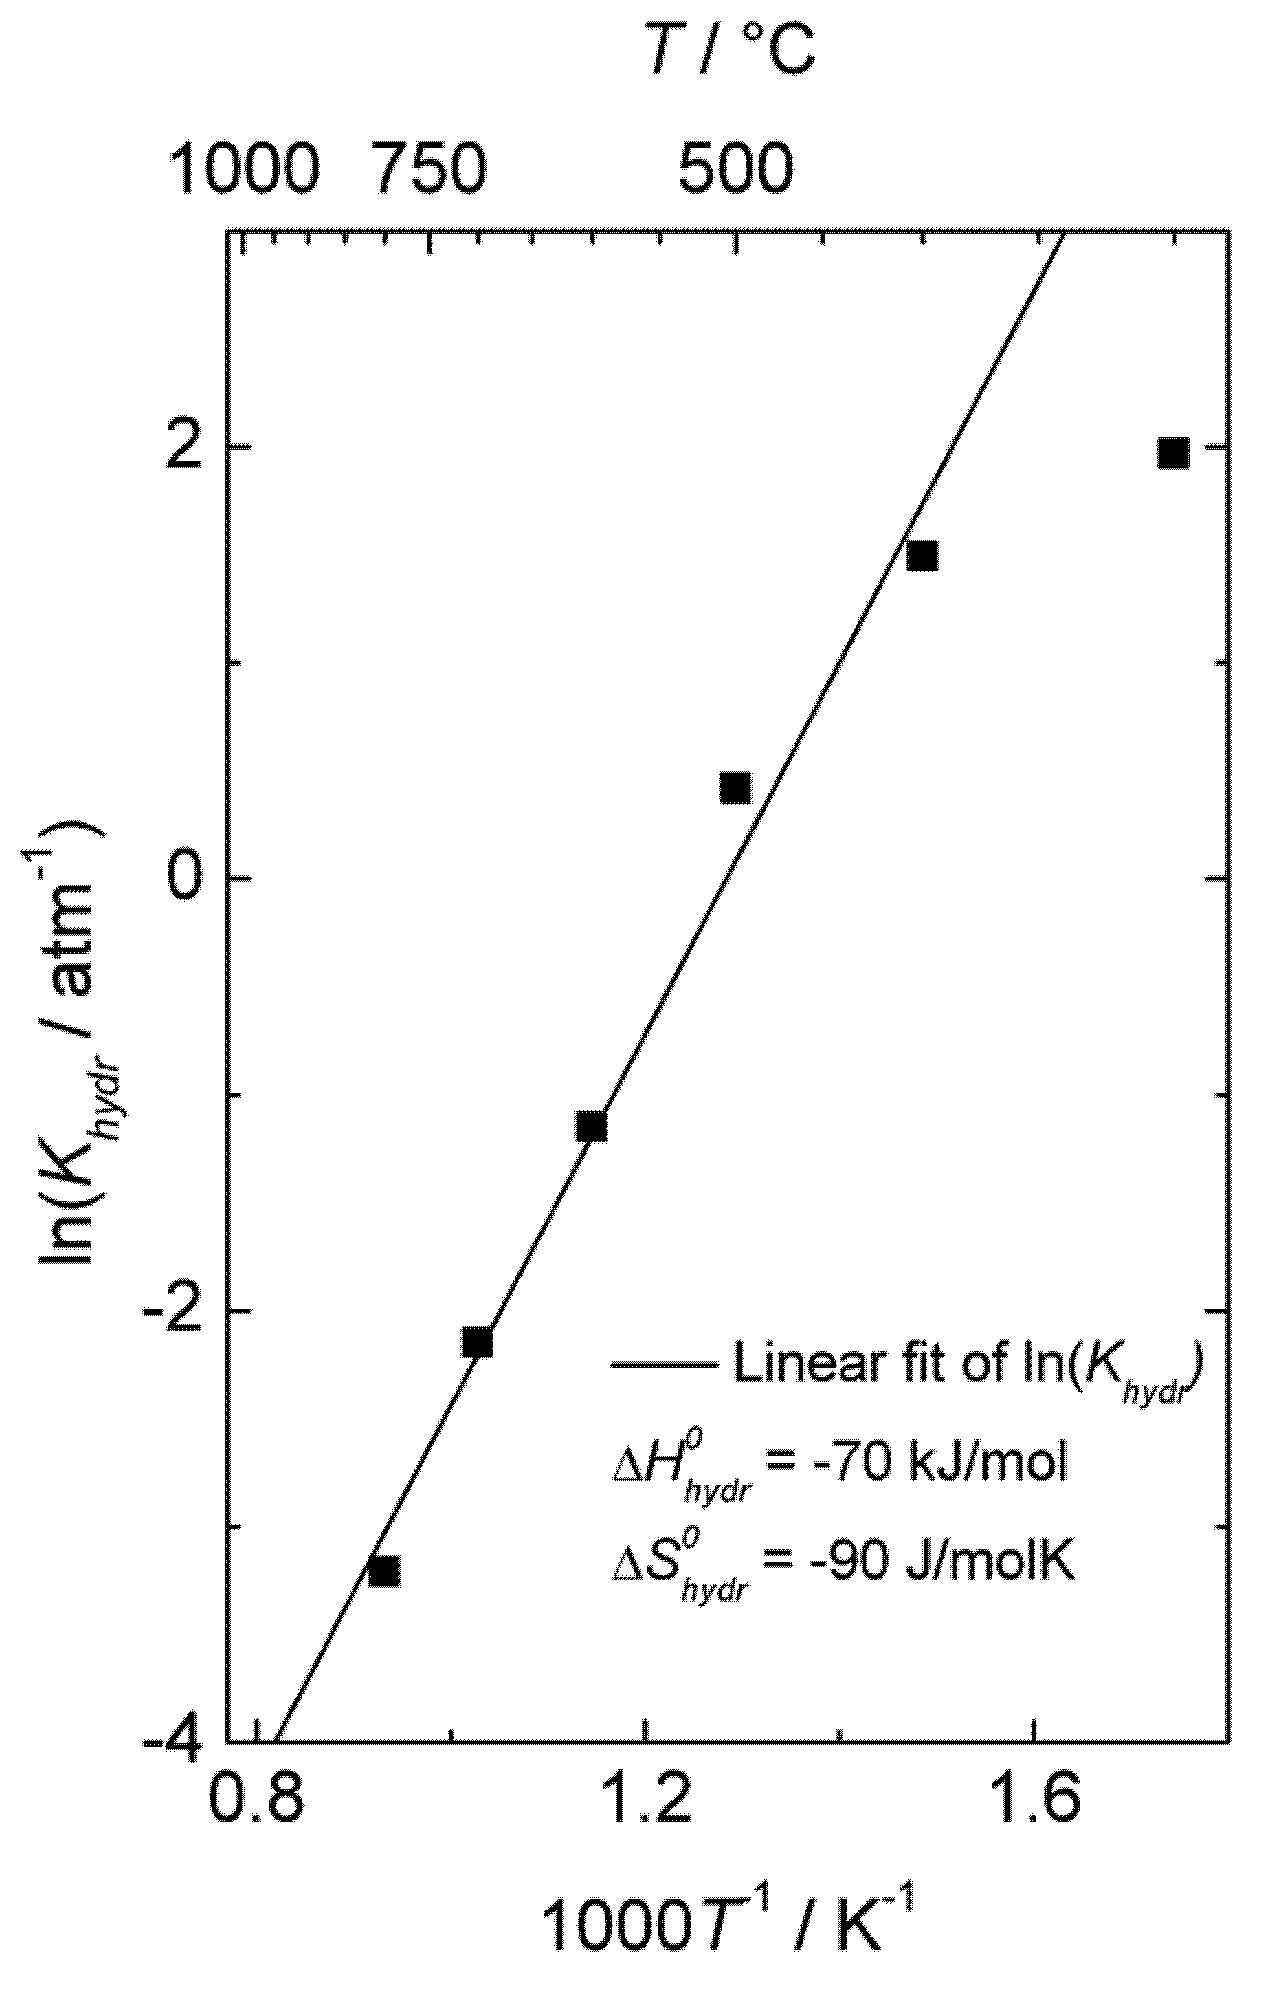
Khydr, was extracted from the fit of the conductivity curves for each temperature. The results are presented in a van 't Hoff plot (
Figure 5), and linear regression of ln
Khydr as a function of 1/
T yields standard enthalpy and entropy changes of the hydration reaction of −70 kJ/mol and −90 KJ/mol, respectively. The equilibrium constant extracted from conductivity measurements at 300 °C was excluded in this fitting, due to significant deviation from the values obtained at higher temperatures, likely a consequence of slow kinetics. The exothermic hydration enthalpy of −70 kJ/mol for La
0.9Sr
0.1CrO
3−δ is far from the endothermic expected, based on the already mentioned empirical correlation [
7,
8,
9,
10], and the aforementioned crystal field stabilization of the d-electrons in fully
vs. only partially occupied octahedra of the perovskites is an interesting input to understanding this and the many other variations from the correlation.
Figure 5.
Van 't Hoff plot of hydration equilibrium constant
Khydr for La
0.9Sr
0.1CrO
3−δ corresponding to conductivity data of
Figure 4.
Figure 5.
Van 't Hoff plot of hydration equilibrium constant
Khydr for La
0.9Sr
0.1CrO
3−δ corresponding to conductivity data of
Figure 4.
3.2. Estimated Defect Concentrations and Partial Conductivities
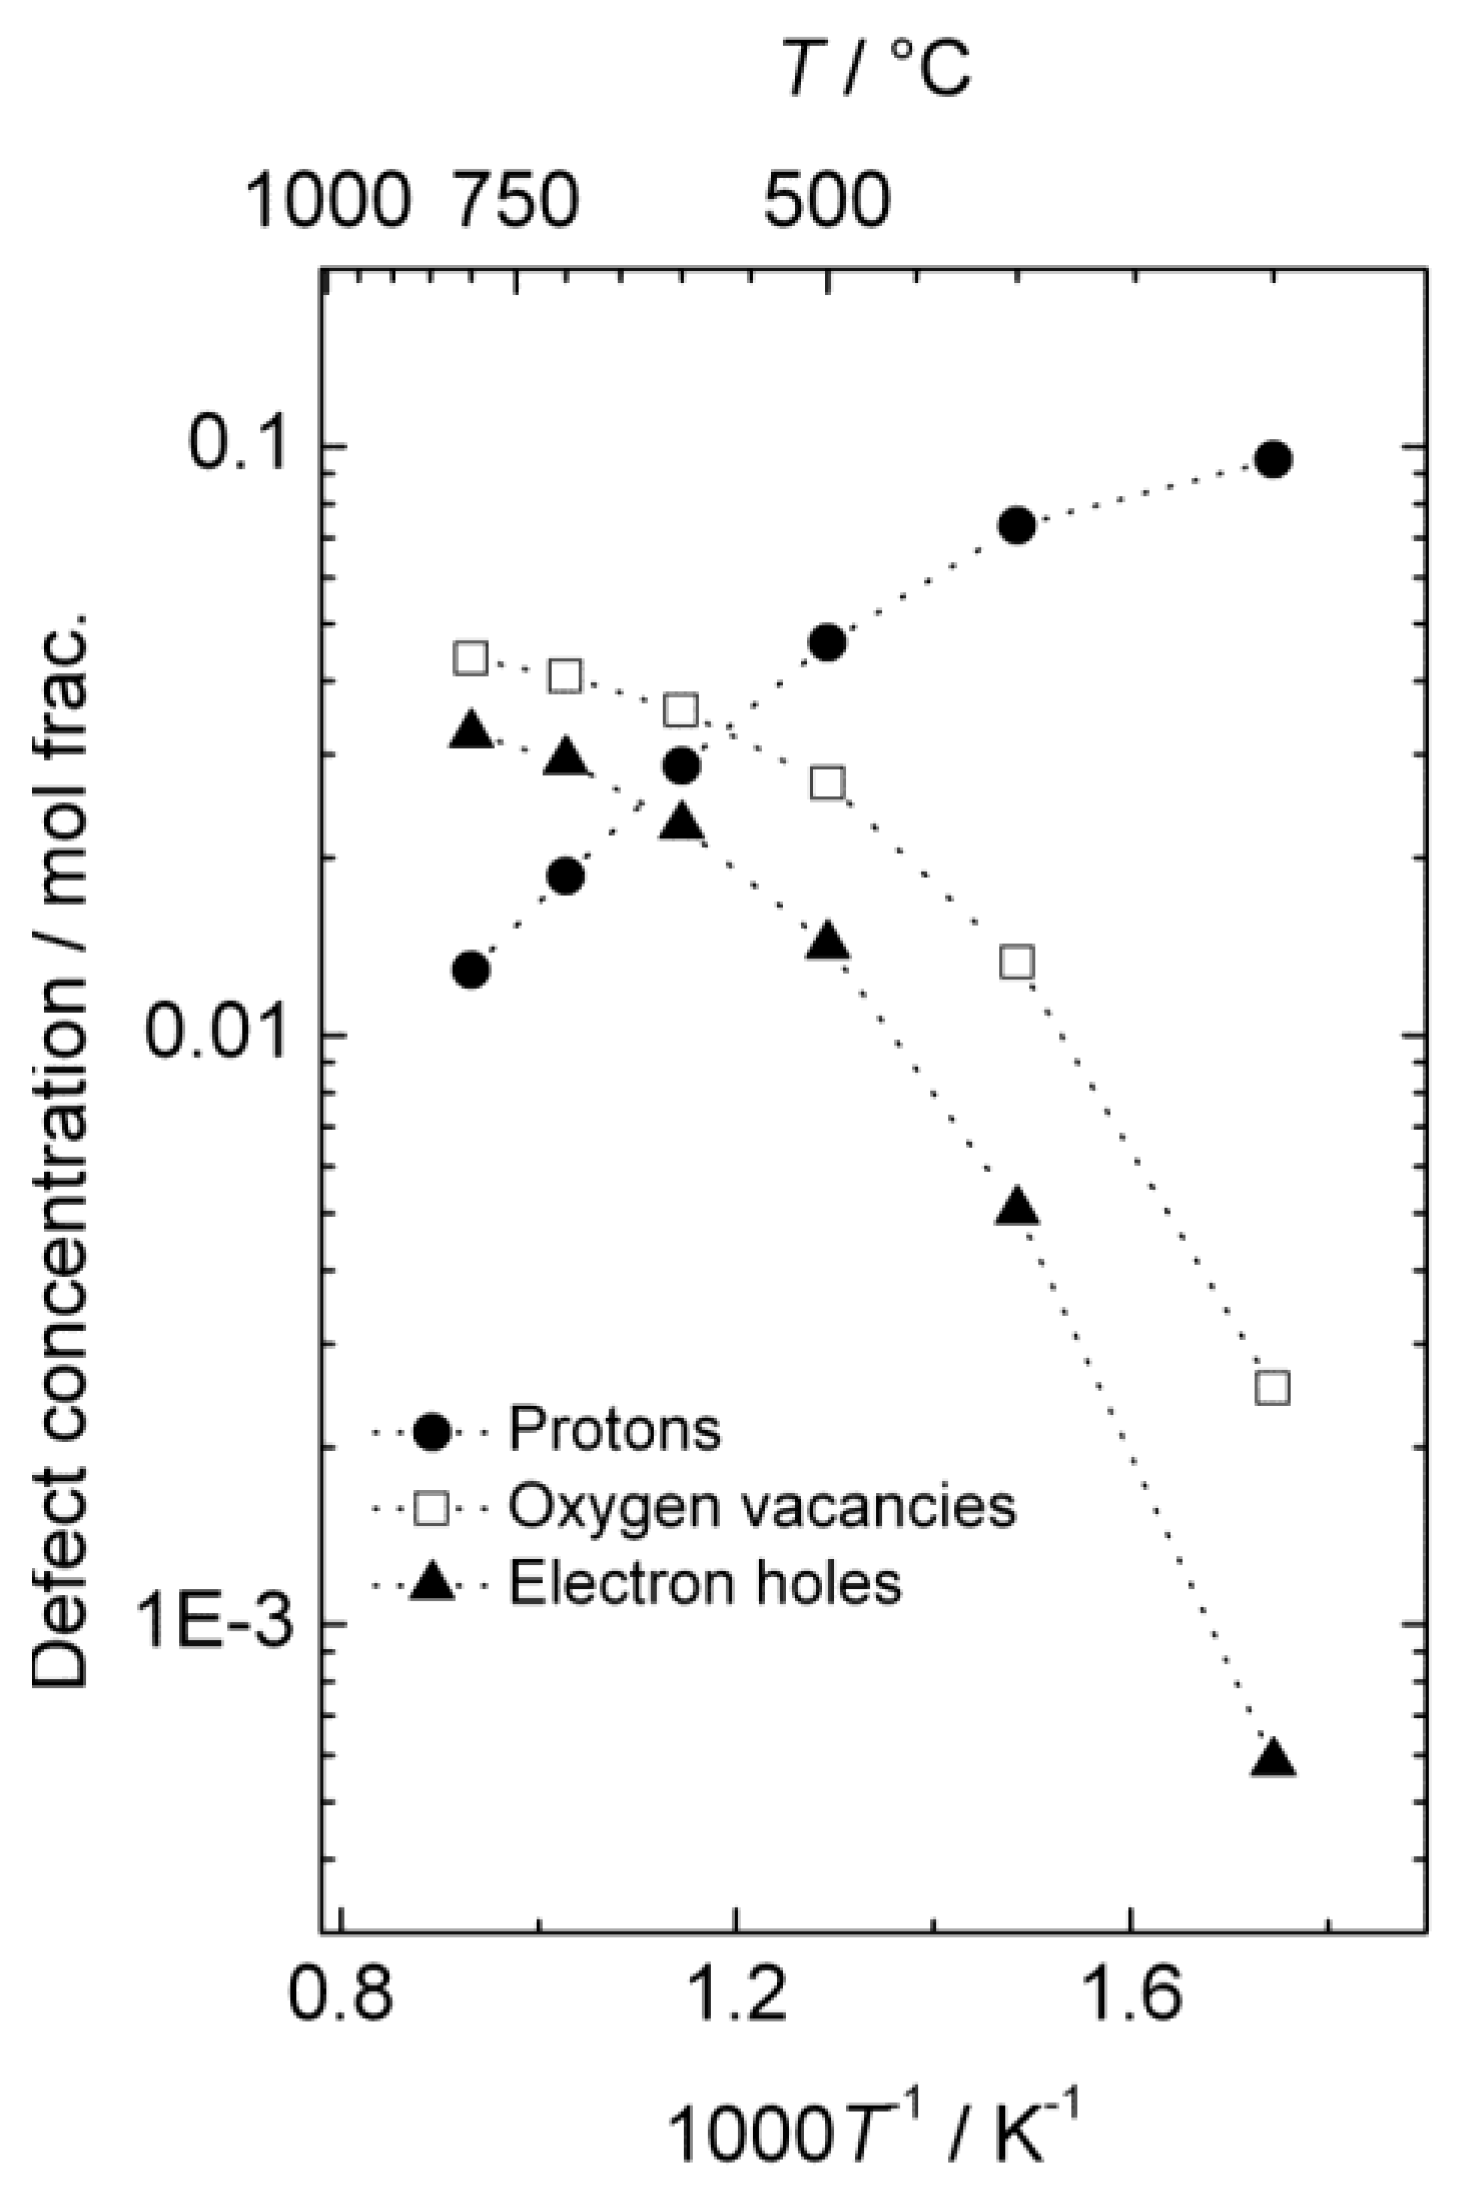
With the parameters obtained by curve-fitting of the hydration equilibrium constant, we have estimated the concentrations of the defects in La
0.9Sr
0.1CrO
3−δ in wet reducing atmospheres (
i.e.,
pH
2O = 0.025 atm,
pH
2 = 1 atm). All charge carriers were assumed to follow an activated transport process,
i.e.,
![Membranes 02 00665 i015]()
. For oxygen vacancies, the pre-exponential factor of mobility,
u0,vo, and the enthalpy of mobility, Δ
Hmob,vo, were set to 200 cm
2 K/Vs and 90 kJ/mol, respectively, in accordance with oxygen vacancy diffusion coefficients obtained at temperatures from 950–1100 °C for La
0.8Sr
0.2Cr
0.95Ni
0.05O
3−δ [
30]. For protons, the pre-exponential factor of mobility,
u0,OH, was set to 13 cm
2K/Vs, in accordance with values obtained for similar perovskite oxides from [
9] and the data set of [
8], and the enthalpy of mobility, Δ
Hmob,OH, was set to 60 kJ/mol, from the empirical 2/3 of the value for oxygen vacancies [
8]. The pre-exponential factor of hole mobility,
u0,h, and the enthalpy of hole mobility, Δ
Hmob,h, were set in accordance with Weber
et al. [
35] to 200 cm
2K/Vs and 12.5 kJ/mol, respectively. Furthermore, it was assumed that the nominal Sr acceptor level was effective.
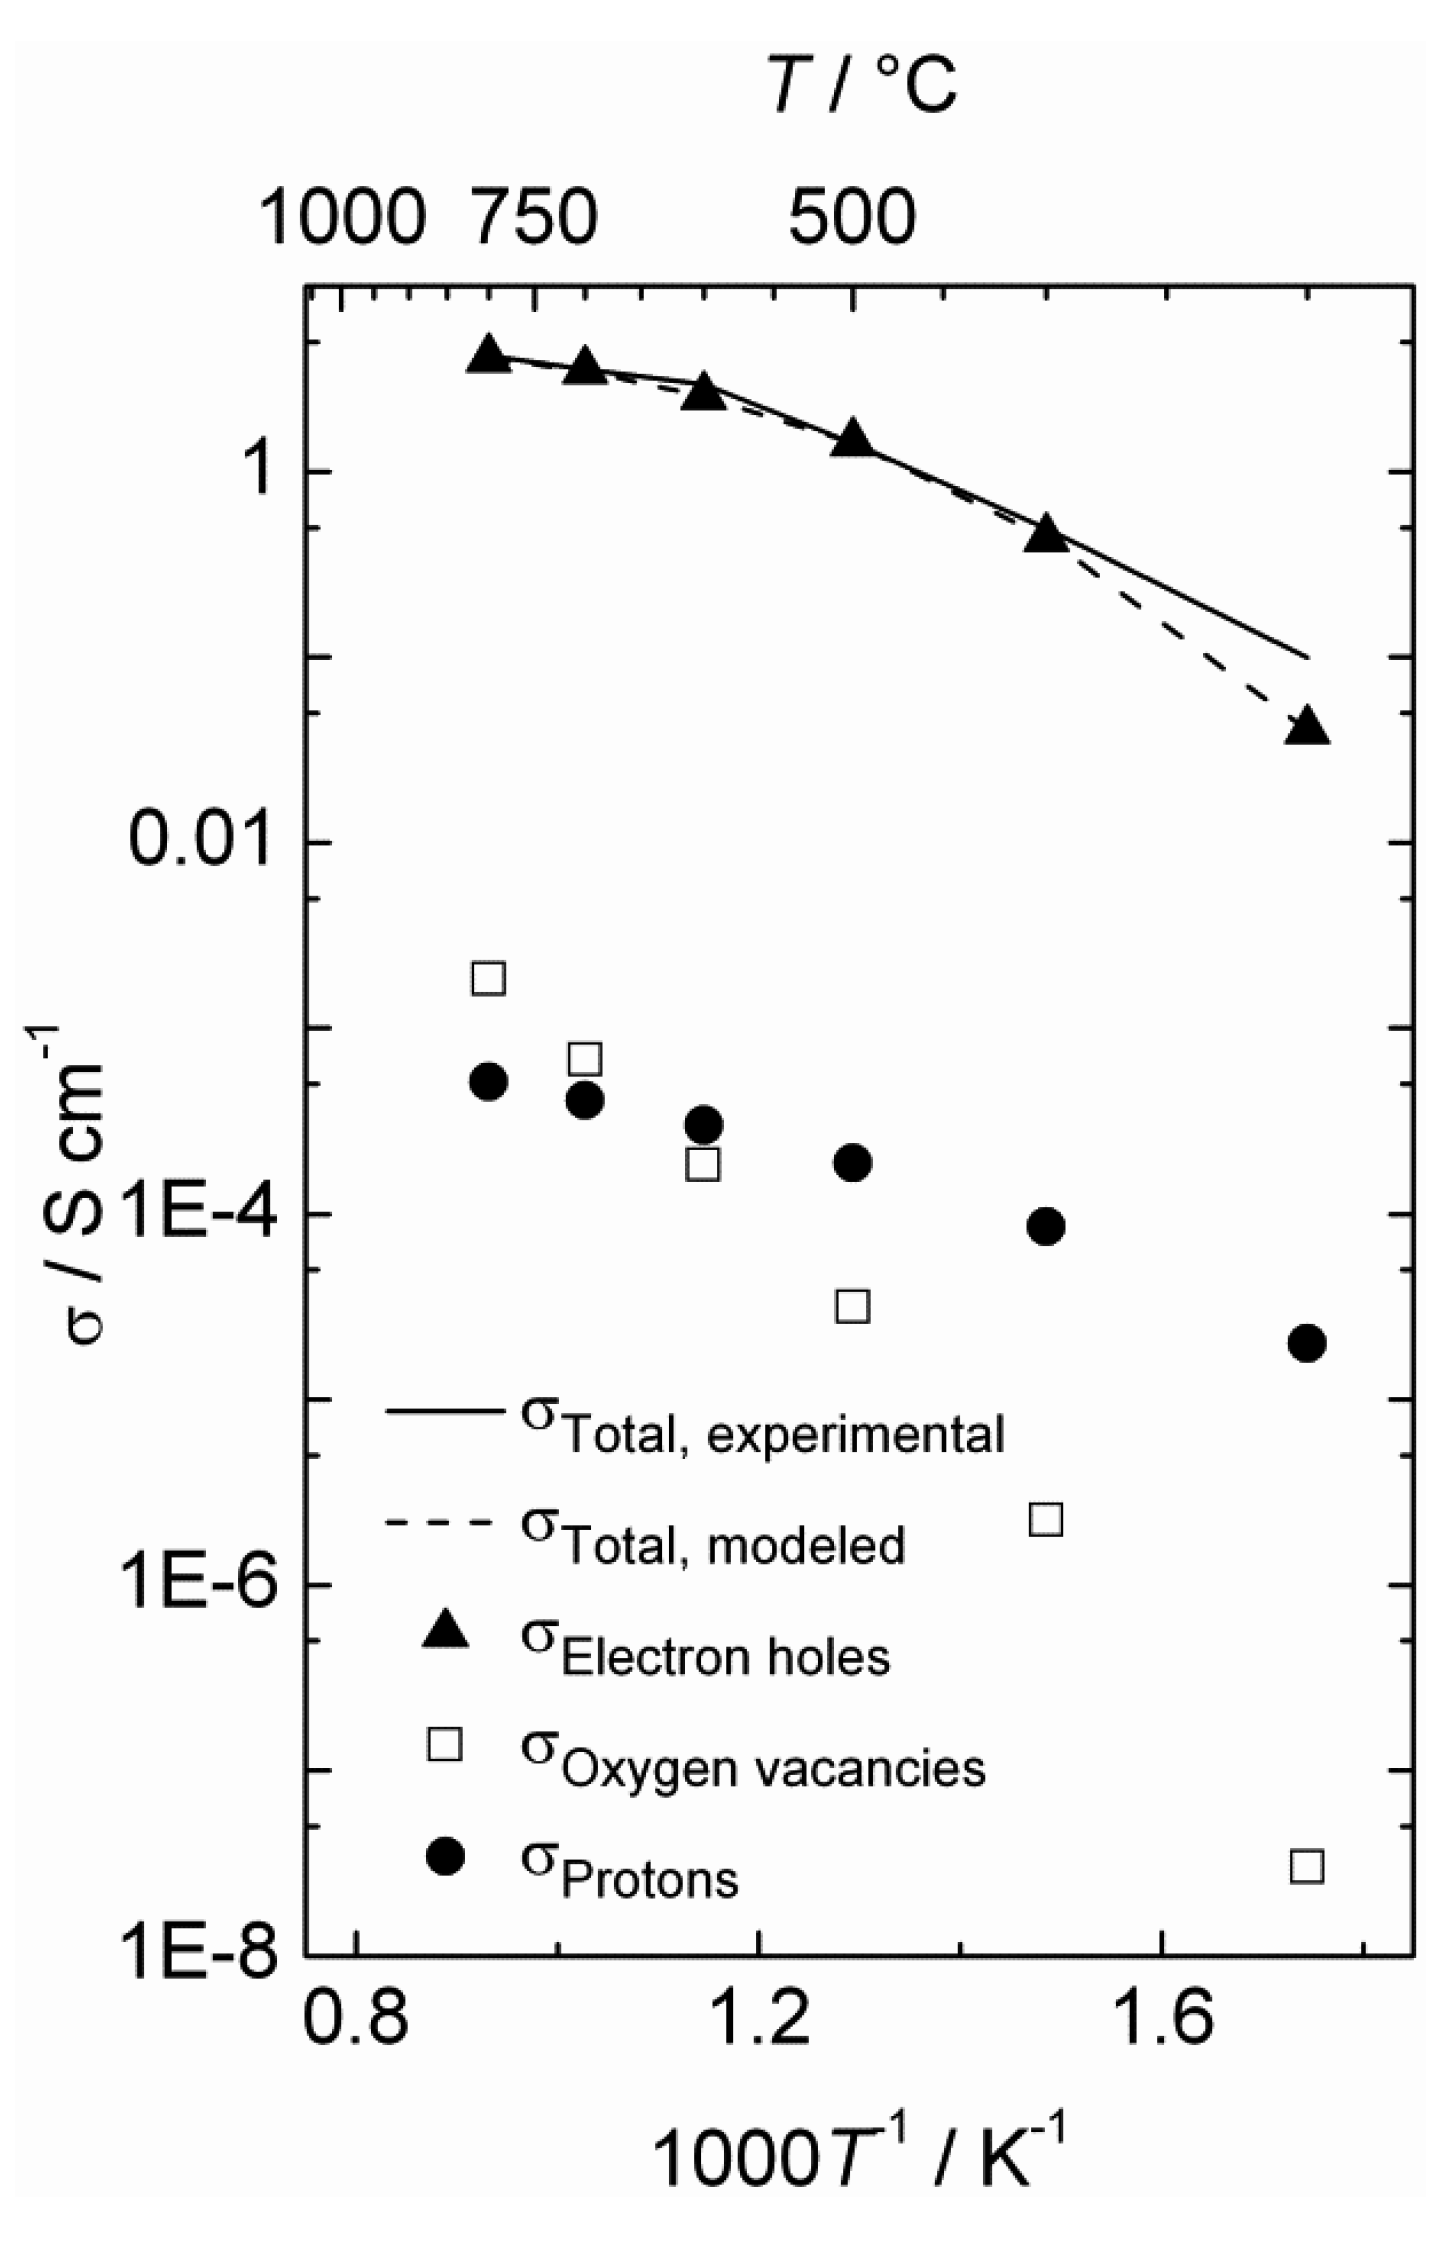
The estimated defect concentrations and partial conductivities are presented as a function of inverse temperature in
Figure 6 and
Figure 7, respectively.
The estimated proton conductivity reaches approximately 5 × 10
−4 S/cm at 800 °C, while the oxygen vacancies reach a conductivity in the order of 10
−3 S/cm.
Figure 7 also illustrates that the electron hole conductivity dominates the total conductivity, even when electron holes are minority defects under reducing conditions. The bends in the conductivity curves are the result of the changeover to a proton-dominated defect structure at lower temperatures.
Figure 6.
Estimated defect concentrations as a function of inverse temperature for La0.9Sr0.1CrO3−δ in wet, reducing atmospheres (pH2 = 1 atm, pH2O = 0.025 atm).
Figure 6.
Estimated defect concentrations as a function of inverse temperature for La0.9Sr0.1CrO3−δ in wet, reducing atmospheres (pH2 = 1 atm, pH2O = 0.025 atm).
Figure 7.
Estimated total and partial conductivities as a function of inverse temperature for La0.9Sr0.1CrO3−δ in wet reducing atmospheres (pH2 = 1 atm, pH2O = 0.025 atm).
Figure 7.
Estimated total and partial conductivities as a function of inverse temperature for La0.9Sr0.1CrO3−δ in wet reducing atmospheres (pH2 = 1 atm, pH2O = 0.025 atm).
Based on the estimated partial conductivities, we may estimate the ambipolar proton-hole conductivity of La
0.9Sr
0.1CrO
3−δ from
and it is limited by the lower of the two partial conductivities. In LSC, proton conductivity is orders of magnitude lower than that of electron holes, thereby limiting this ambipolar conductivity.
3.3. Measurements of Hydrogen Production with Disk-Shaped Membranes
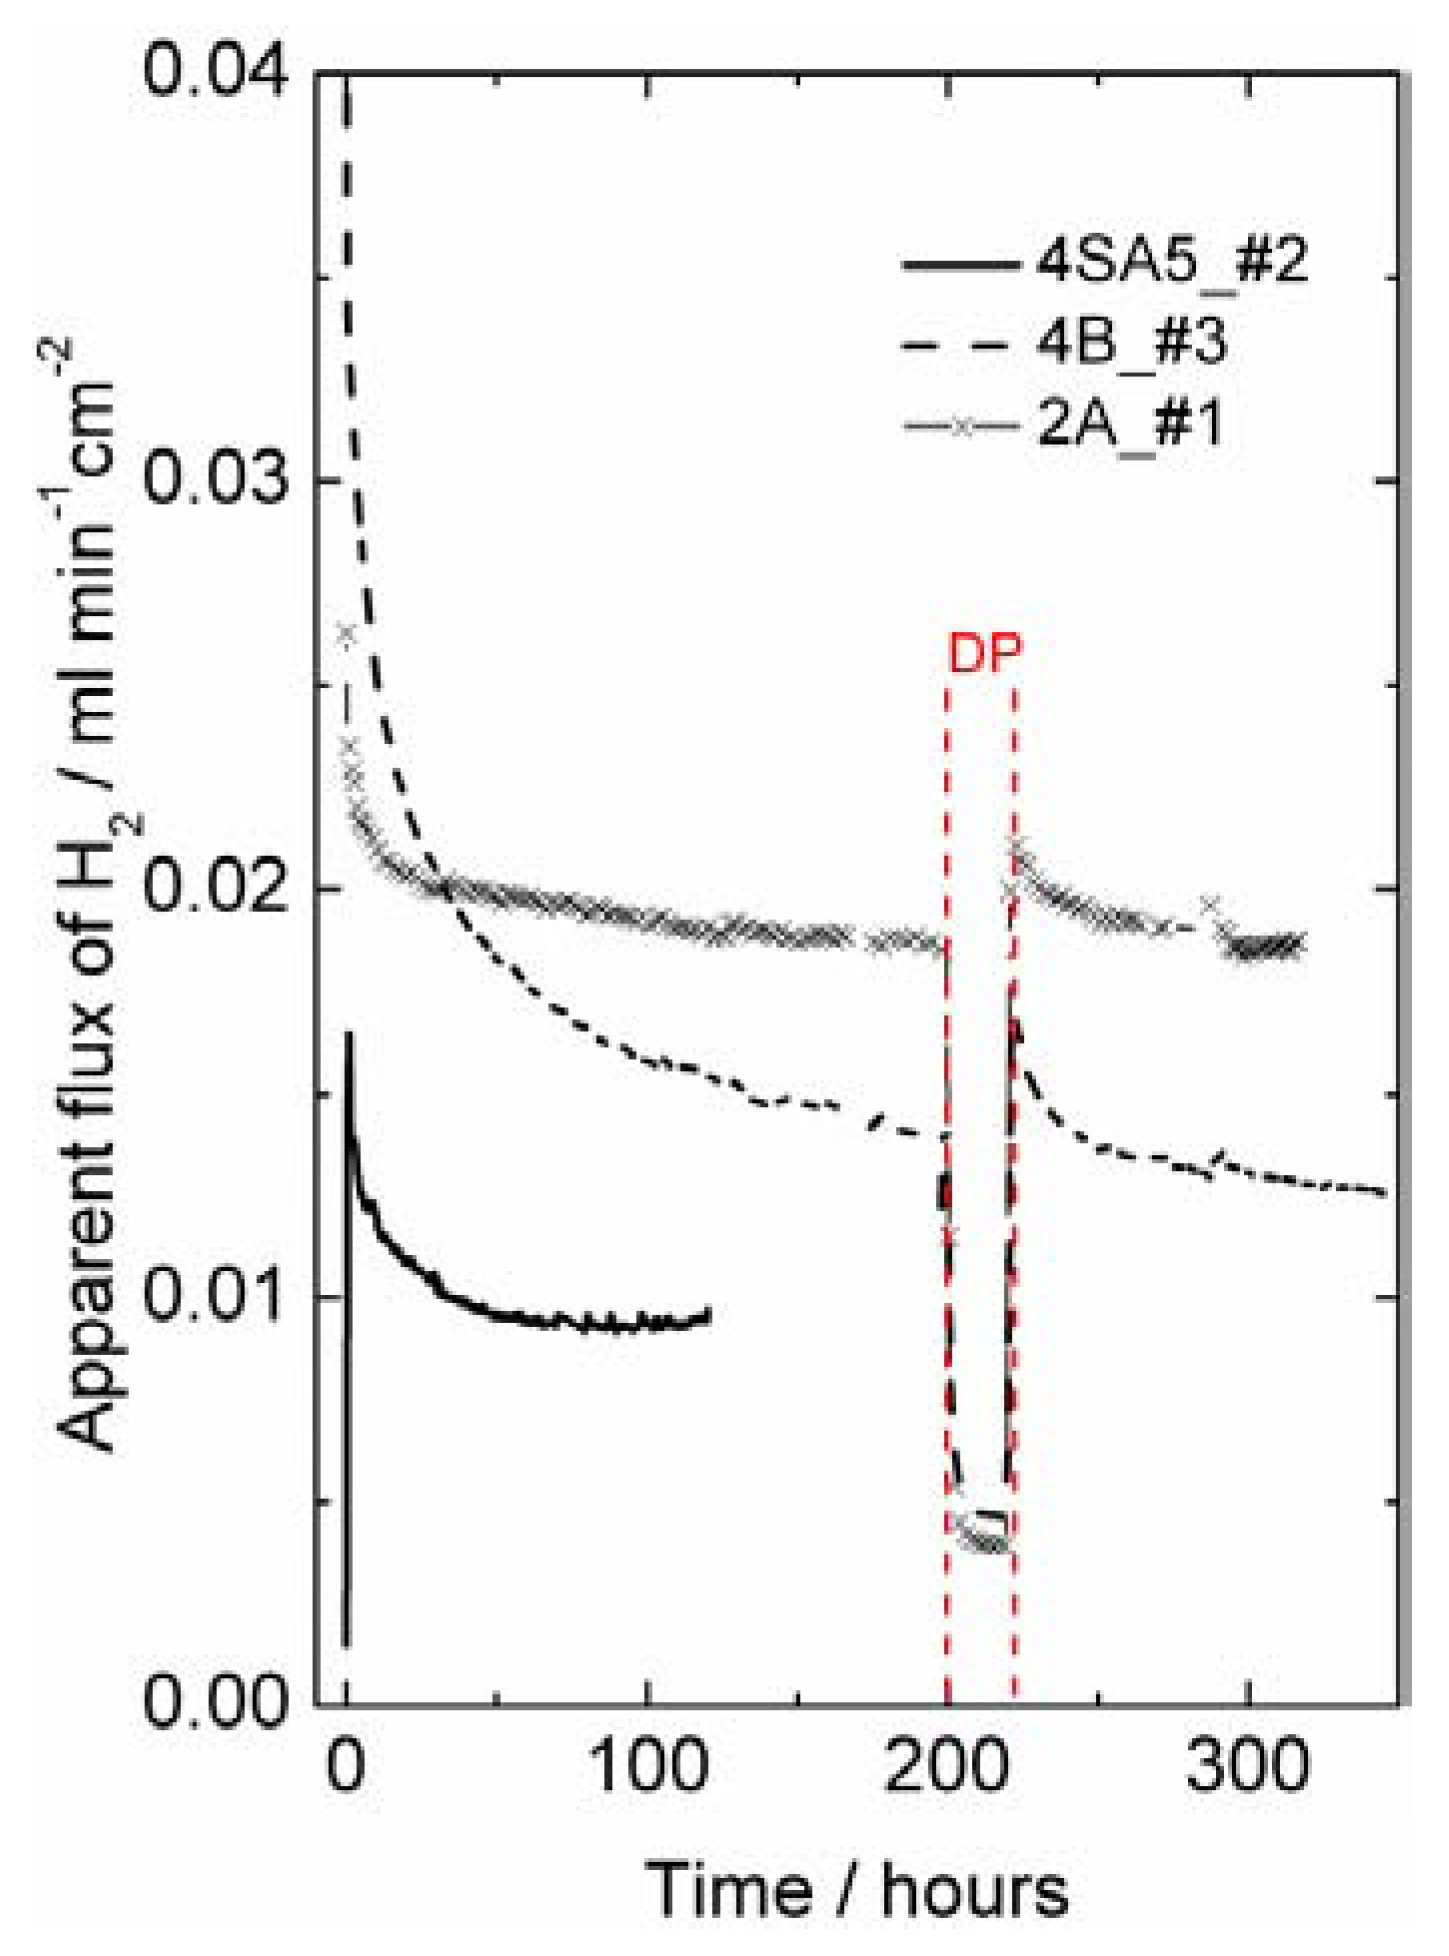
Hydrogen production measurements—interpreted as apparent hydrogen flux—were performed on disk-shaped LSC membranes of approximately 0.5 mm thickness, prepared with various sintering agents (see
Table 1). They showed an initial apparent flux of 0.04–0.02 mL min
−1cm
−2, which decreased over some 50–200 h at 1000 °C to final values of 0.02–0.01 mL min
−1cm
−2 at 1000 °C in 50% humidified H
2 on the feed side and humidified argon at the permeate side (see
Figure 8). The initially high apparent flux may be related to an initially high concentration of intrinsic defects created under the very high sintering temperature. The decrease in apparent flux may alternatively be related to the relaxation and decrease in surface catalytic activity of the polished surfaces during initial operation at elevated temperatures.
Figure 8.
Hydrogen production plotted as apparent hydrogen (H
2) flux (leakage corrected) as a function of time at 1000 °C using 50% wet H
2 as feed gas for different LSC samples of thickness around 0.5 mm (see
Table 1). Wet permeate gas is used for most of the experiment, except for a short period with dry permeate (DP), with a steep decrease in the hydrogen production rate.
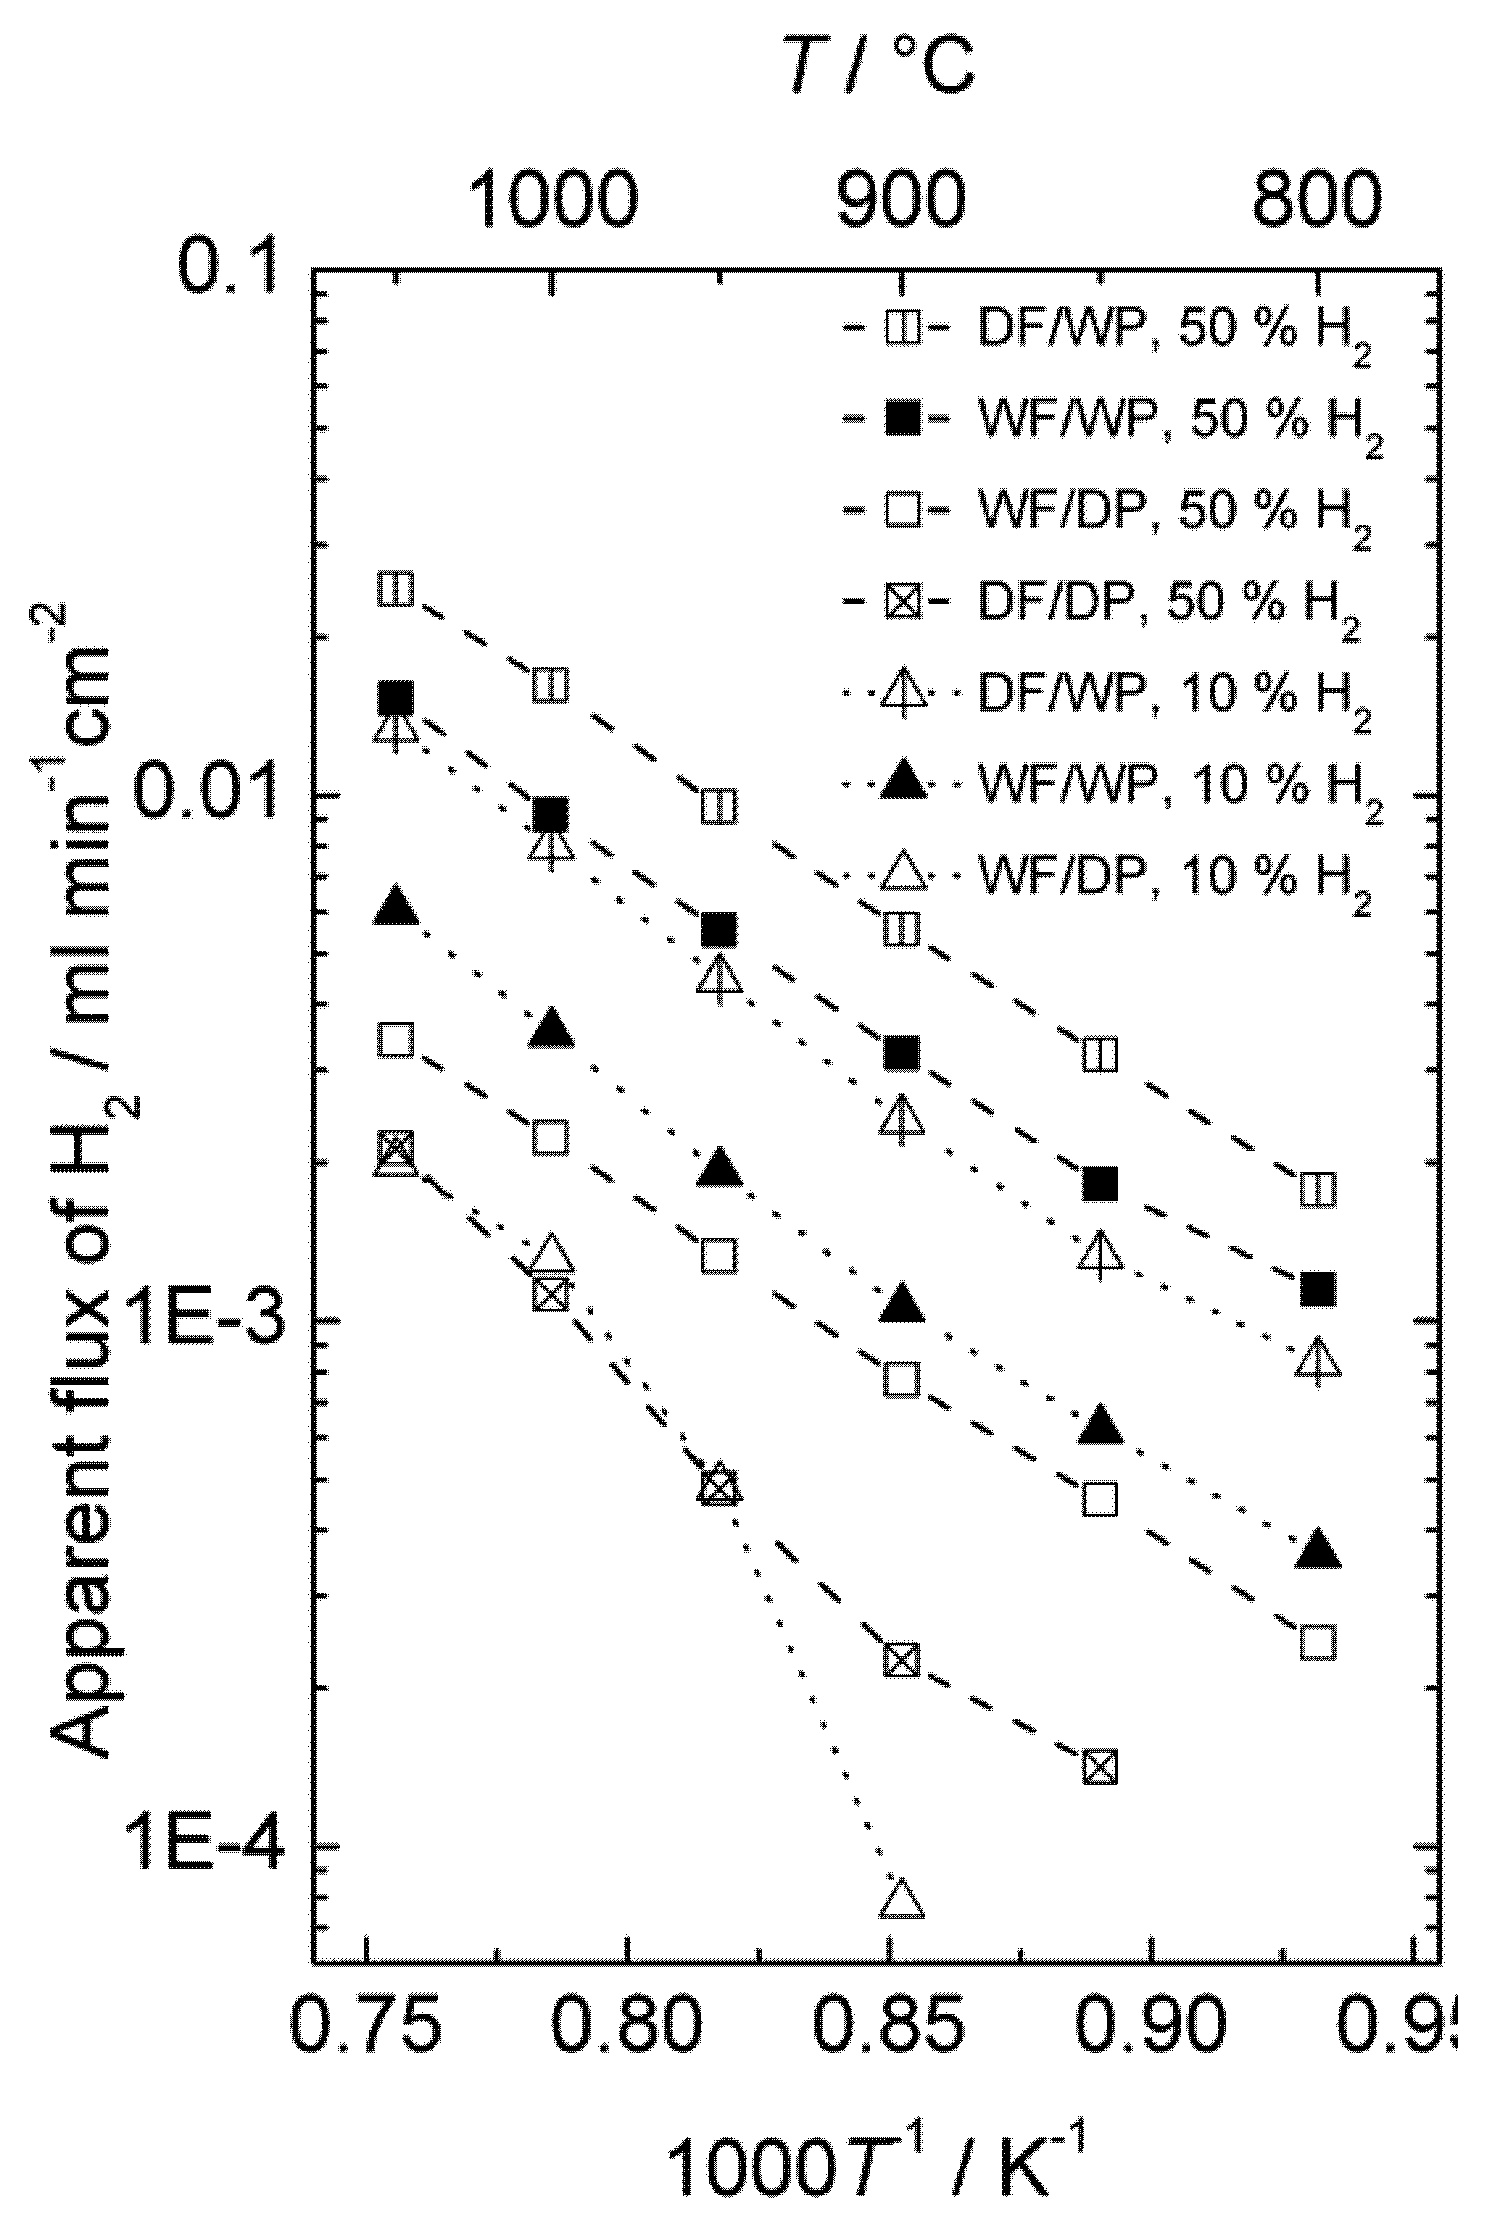
The effect of different types of gradients was further investigated in order to separate situations with only hydrogen (proton-hole) transport and cases where oxygen transport, and hence water splitting, contribute to the hydrogen production. Four different gradients are shown in
Figure 9, where all have 50% or 10% hydrogen on the feed side and argon on the permeate side. The only difference is that the gases are either wet or dry. Accordingly, the following effects can be seen:
Dry feed/Wet permeate (DF/WP) gives the highest hydrogen production. This can be attributed to a high level of water splitting on the permeate side, combined with a high driving force for transport of oxygen from permeate to feed. Wet feed/wet permeate (WF/WP) gives a slightly lower hydrogen production. One can expect the driving force for water splitting to be lower, since the difference in p(O2) is less. Wet feed/dry permeate (WF/DP) gives yet lower hydrogen production. In this case we have no possibility of water splitting and the hydrogen must come from ambipolar proton transport. Dry feed/dry permeate (DF/DP) gives the lowest hydrogen production when comparing cases with equally amounts of hydrogen on the feed side. Here, we are probably additionally limited by the hydration and concentration of protons in the oxide.
It is noteworthy that what we believe is water splitting from ambipolar oxygen transport and what we believe is ambipolar hydrogen transport both appear to have similar and rather high activation energies. As we shall see later, this is possibly related to both being limited by surface kinetics of the polished disk samples used.
Figure 9.
Hydrogen production plotted in terms of an apparent hydrogen (H2) flux as a function of inverse temperature for sample 4SA5_#2 in 4 different gradients using dry (D) or Wet (W) Feed (F) and Permeate (P) gas.
Figure 9.
Hydrogen production plotted in terms of an apparent hydrogen (H2) flux as a function of inverse temperature for sample 4SA5_#2 in 4 different gradients using dry (D) or Wet (W) Feed (F) and Permeate (P) gas.
3.4. Measurements of Hydrogen Production with Disk-Shaped Membranes under Pressurized Conditions
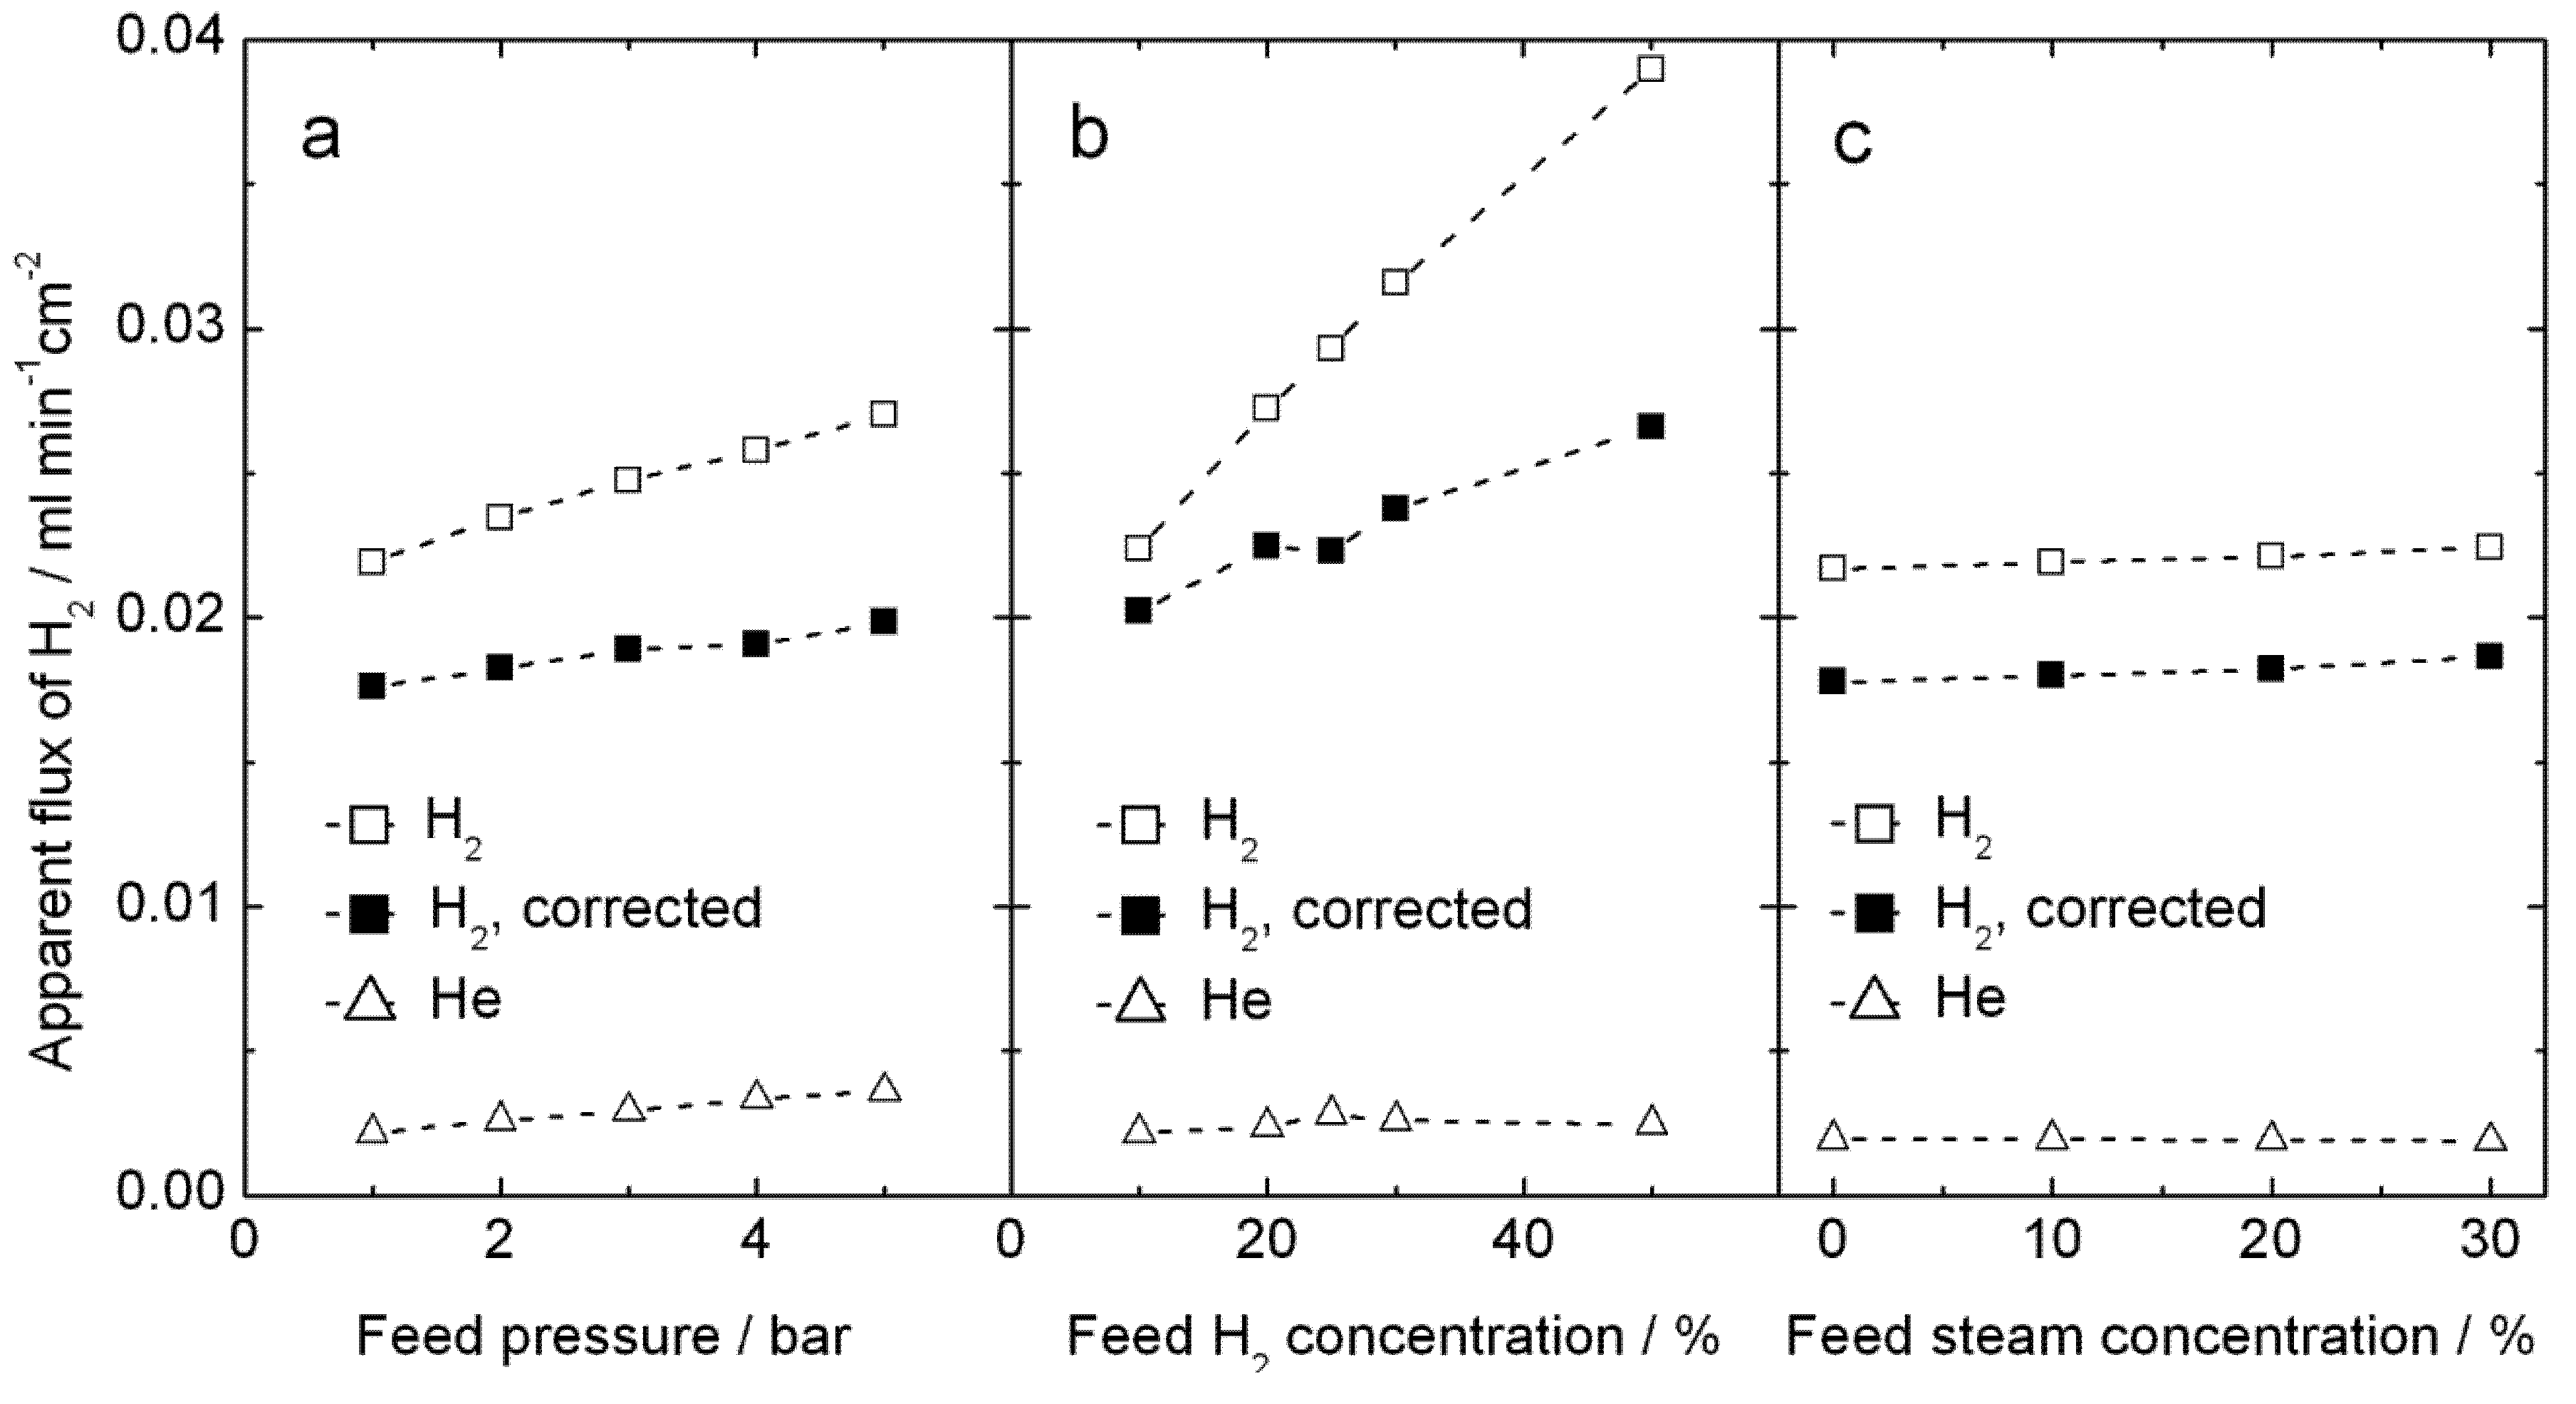
Hydrogen production measurements were performed up to 5 bars on both feed and permeate sides, using high steam contents on both sides, in order to increase the proton concentration and reduce the vacancy concentration in LSC by water incorporation, according to Equation (3). Results for 1000 °C are plotted on
Figure 10. The apparent hydrogen flux is largely independent of total pressure and of steam content, see
Figure 10a, c, and instead the amount of hydrogen in the feed plays a somewhat larger role—see
Figure 10b. These observations do not immediately lend support to either proton or oxygen transport; the hydrogen production can well come from both hydrogen flux and water splitting. We note, however, that the values of apparent flux are qualitatively similar to those done at atmospheric pressure and normal wet gases above.
Figure 10.
Measured apparent H2 flux, and the same corrected for leakage using the measured He flux, for sample 4B_#3 at 1000 °C, plotted as a function of (a) total feed pressure using H2/He/N2/steam = 20:10:50:20 on the feed side and Ar/steam = 80:20 on the permeate side,(b) feed hydrogen content x with H2/He/N2/steam = x:10:70 − x:20 on the feed side at 5 bar and Ar/steam = 80:20 on the permeate side at 4.9 bar, and (c) feed steam content y with H2/He/N2/steam = 20:10:50 − y:y on the feed side at 5 bar and Ar/steam = 80:20 on the permeate side at 4.9 bars.
3.5. Measurements of Hydrogen Production with Monolith Module under Pressurized Conditions
The hydrogen production of an LSC monolith module was also tested at 1000–800 °C and 20 bars pressure in moist hydrogen. The monolith had 37 active channels: 21 for feed gas and 16 for permeate sweep gas. The dense membrane was applied on the porous walls in the monolith on the sweep channel side and had a thickness of 50 μm. The concentration of hydrogen in the permeate gas was 19%–22%.
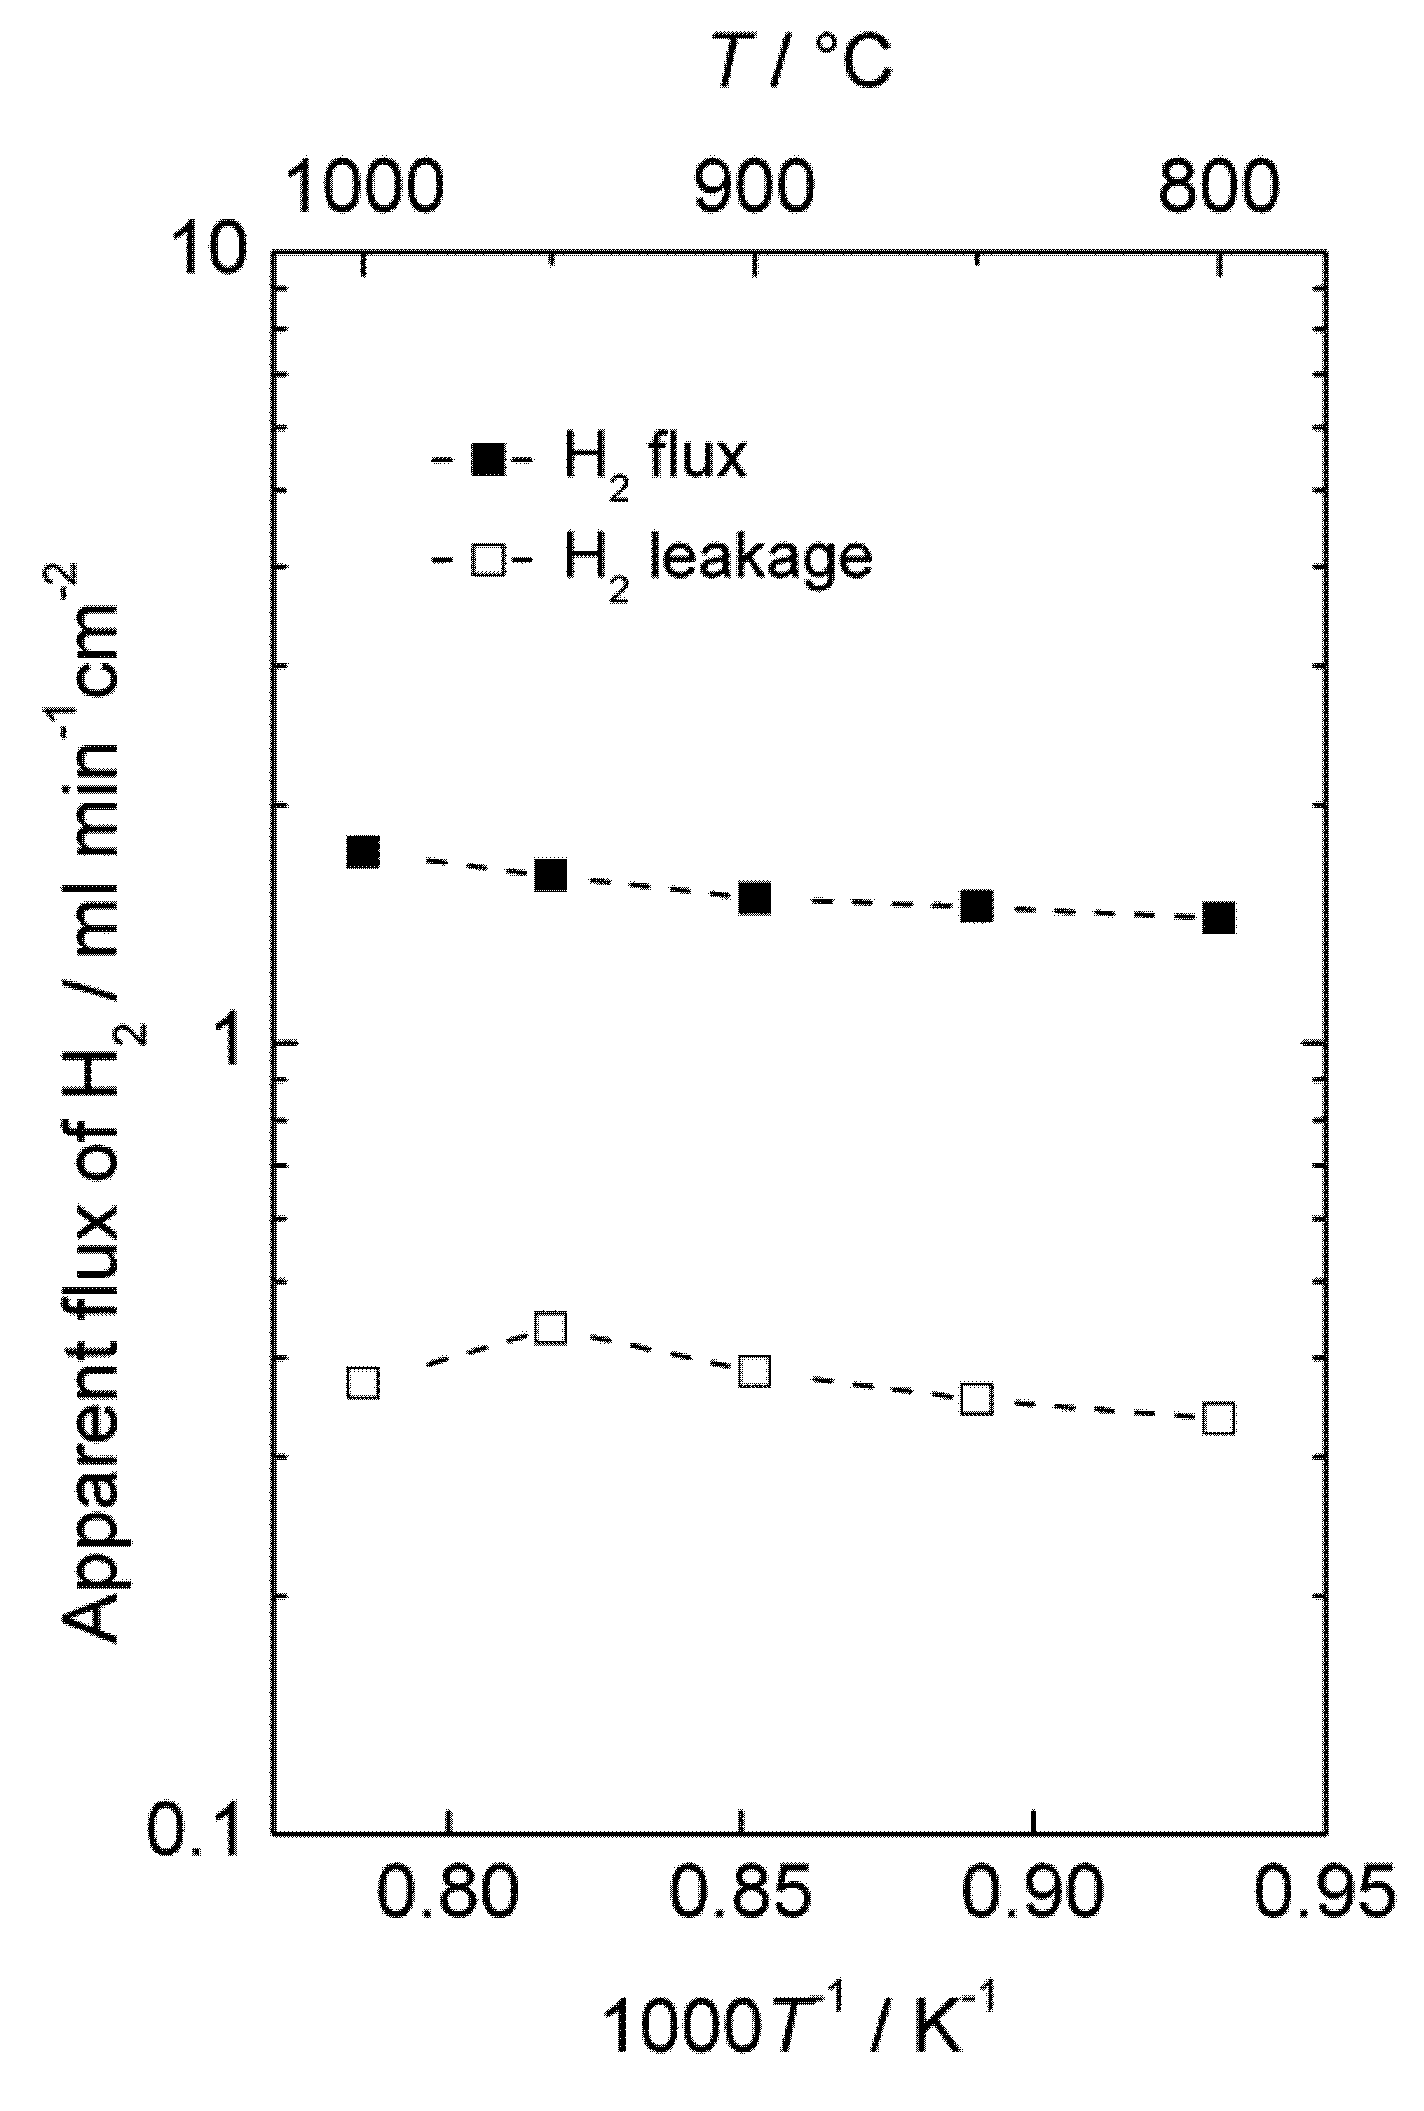
Figure 11 shows the area specific hydrogen leakage and apparent hydrogen flux.
Accordingly, there is a considerable apparent flux through the membrane, and the leakage is low compared to the calculated apparent hydrogen flux. The measurements were performed with co-current flow of feed and sweep gas, rapidly decreasing the driving force for hydrogen permeation, and the gas feeding rate (1000 mL/min) was also low compared to the high apparent flux and membrane area (86 cm2). Besides, the performance of the module was not tested with air on the sweep side, which would have served to maintain a high driving force throughout the monolith and increase the permeation of hydrogen, as mentioned in the introduction for the selected PCDC process. It is therefore expected that the module would perform even better under realistic conditions, e.g., counter-current flow regime with air at the sweep side. There is also room for decreasing the thickness of the membrane well below 50 µm. A hydrogen production rate of the order of 10 mL cm−2 min−1 under real operating conditions seems therefore to be within reach with this material.
Figure 11.
Apparent hydrogen flux and leakage of the monolith module at 20 bars pressure.
Figure 11.
Apparent hydrogen flux and leakage of the monolith module at 20 bars pressure.
It may still be added that this experiment may also have had a large portion of the hydrogen produced coming from water splitting. The leakages were large enough to prevent a detailed analysis of the mass balances that could have answered this question.
We note that the apparent flux densities are now some two orders of magnitude larger than in the case of the polished disk samples and that the temperature dependency, i.e., activation energy, is now small. We speculate that the surface of the membrane applied inside the monolith channels is catalytically active compared to the polished disk surfaces, and that the results of the monolith reflect bulk limited diffusion, while those of the disk samples reflect surface kinetics limitations.
3.6. Flux Measurements Using D2 and D2O
In order to unambiguously prove diffusion of hydrogen and perhaps quantify the possible contribution from water splitting on the permeate side of the membrane to the produced hydrogen, permeation measurements were carried out using D
2 and D
2O on the feed side of the membranes. Mass spectrometry was used to analyze the permeate gas exiting the cell. Results are plotted in
Figure 12.
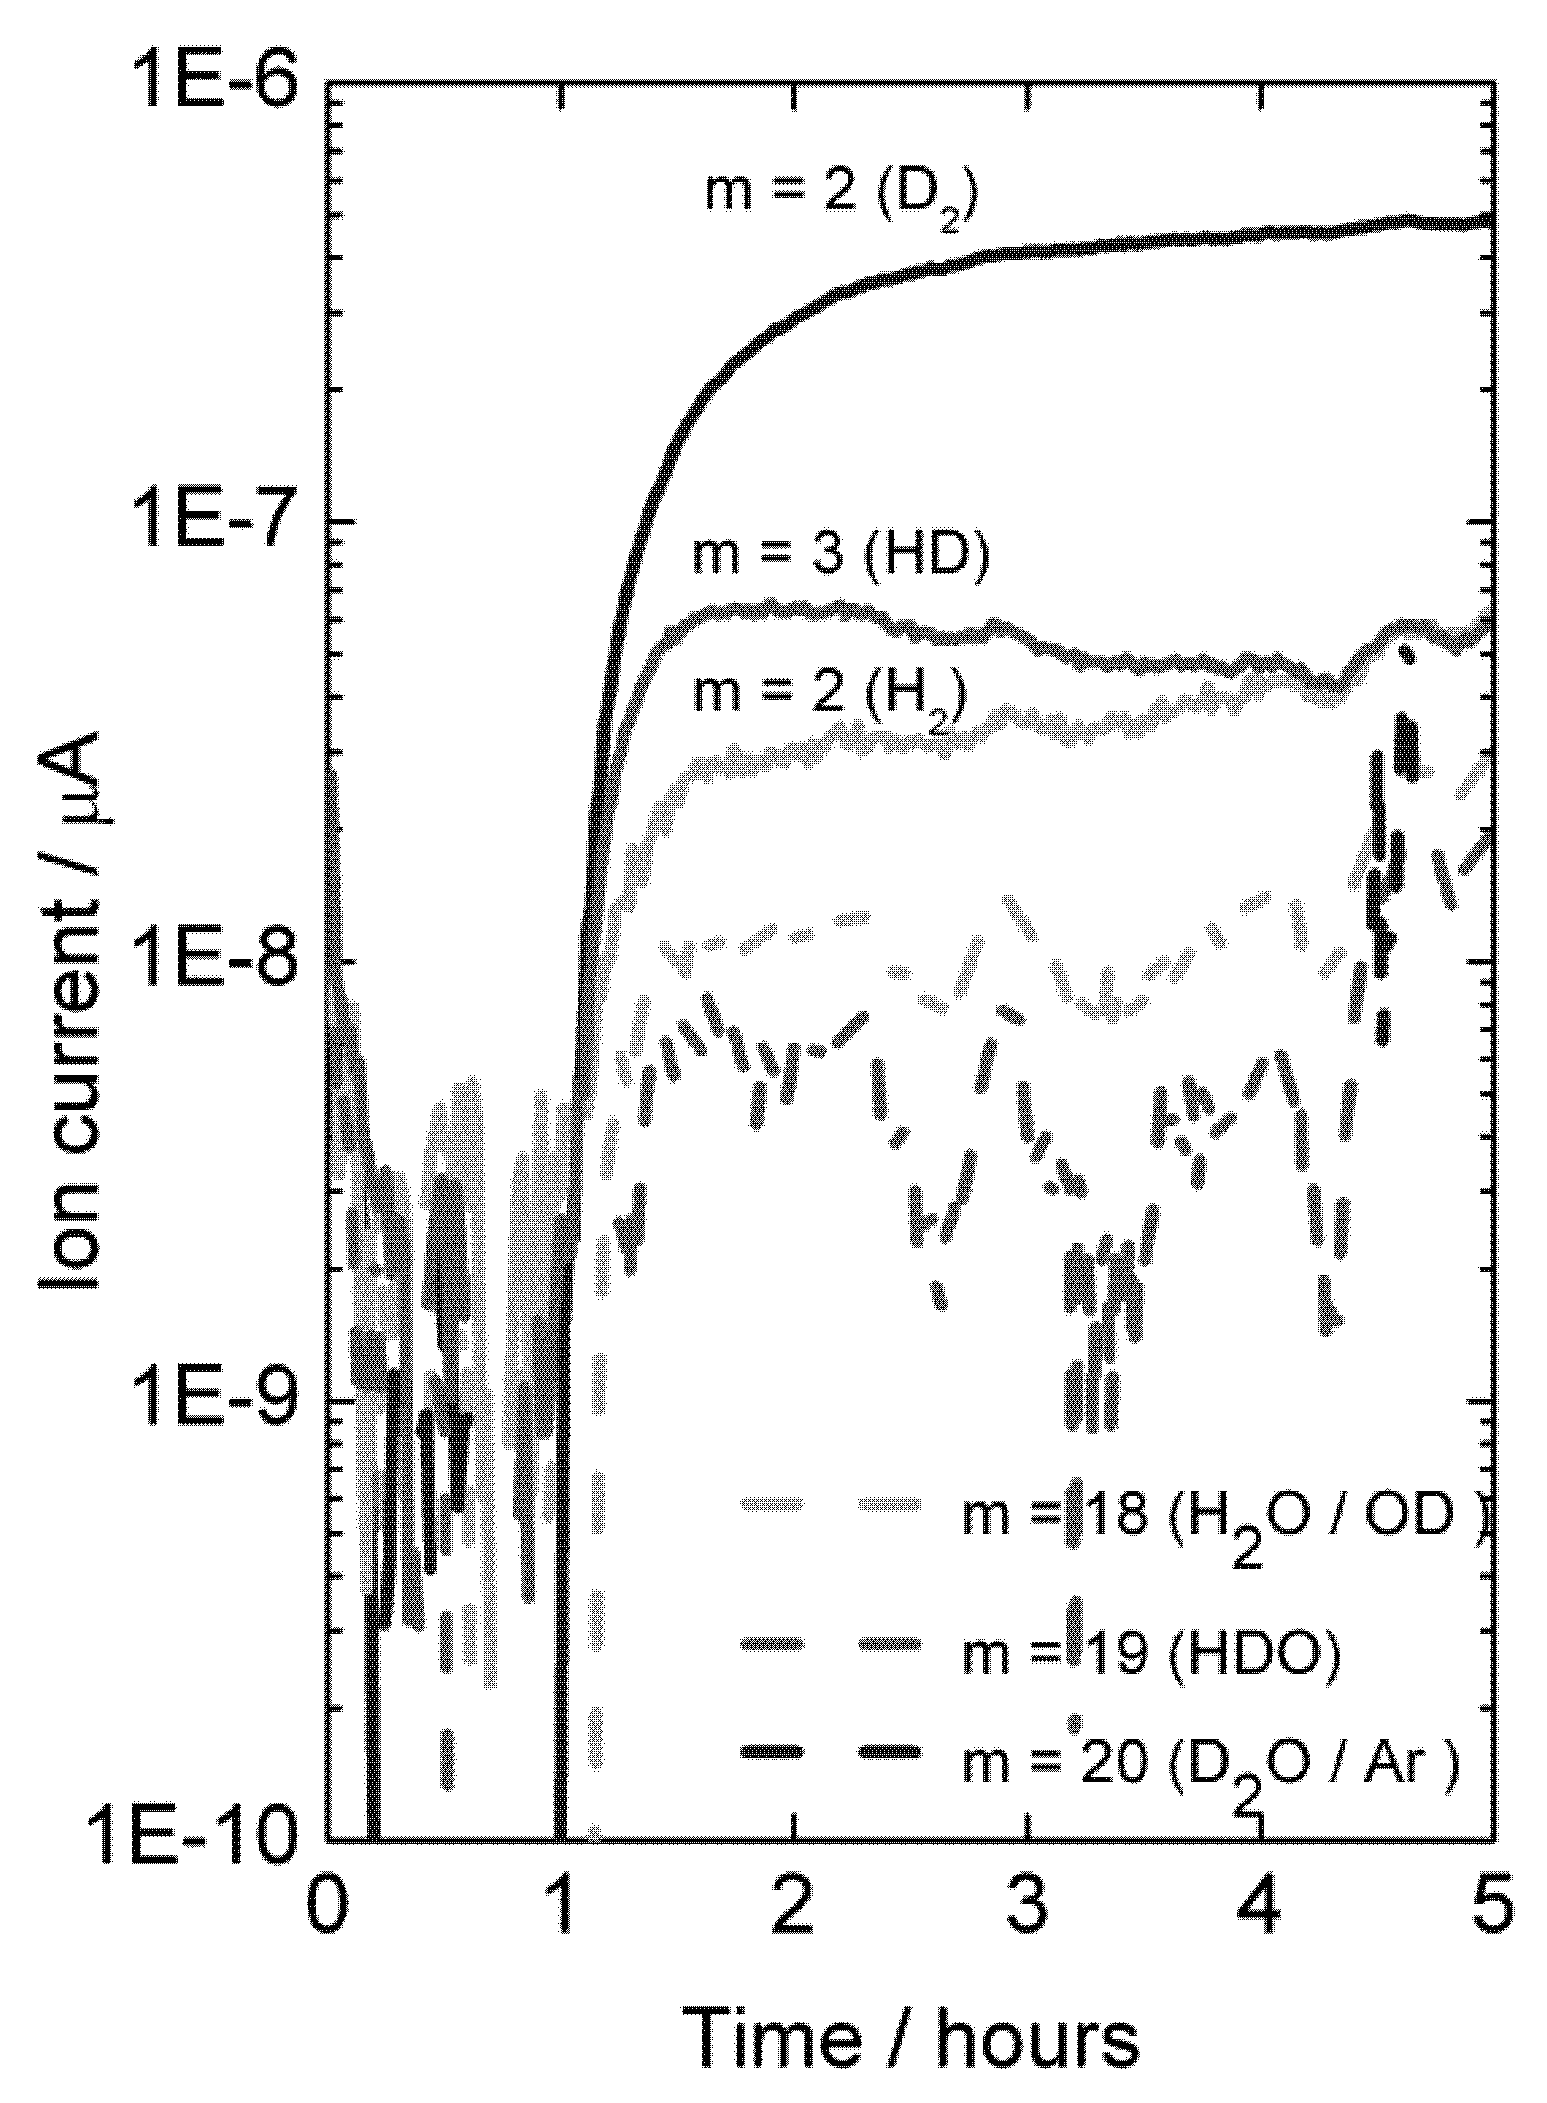
With dry permeate gas, the presence of only D
2O on the feed side gives rise to very little D-containing species in the permeate, showing that there is little D
2O flux from ambipolar proton (here deuteron) and oxide ion transport, see
Figure 12 (first hour). Introduction of D
2 on the feed side gives a driving force for ambipolar deuteron-electron hole transport, and a large and dominating increase in the D
2 content on the permeate side results. This proves unambiguously the presence of hydrogen flux due to ambipolar proton (here deuteron) and electron hole transport.
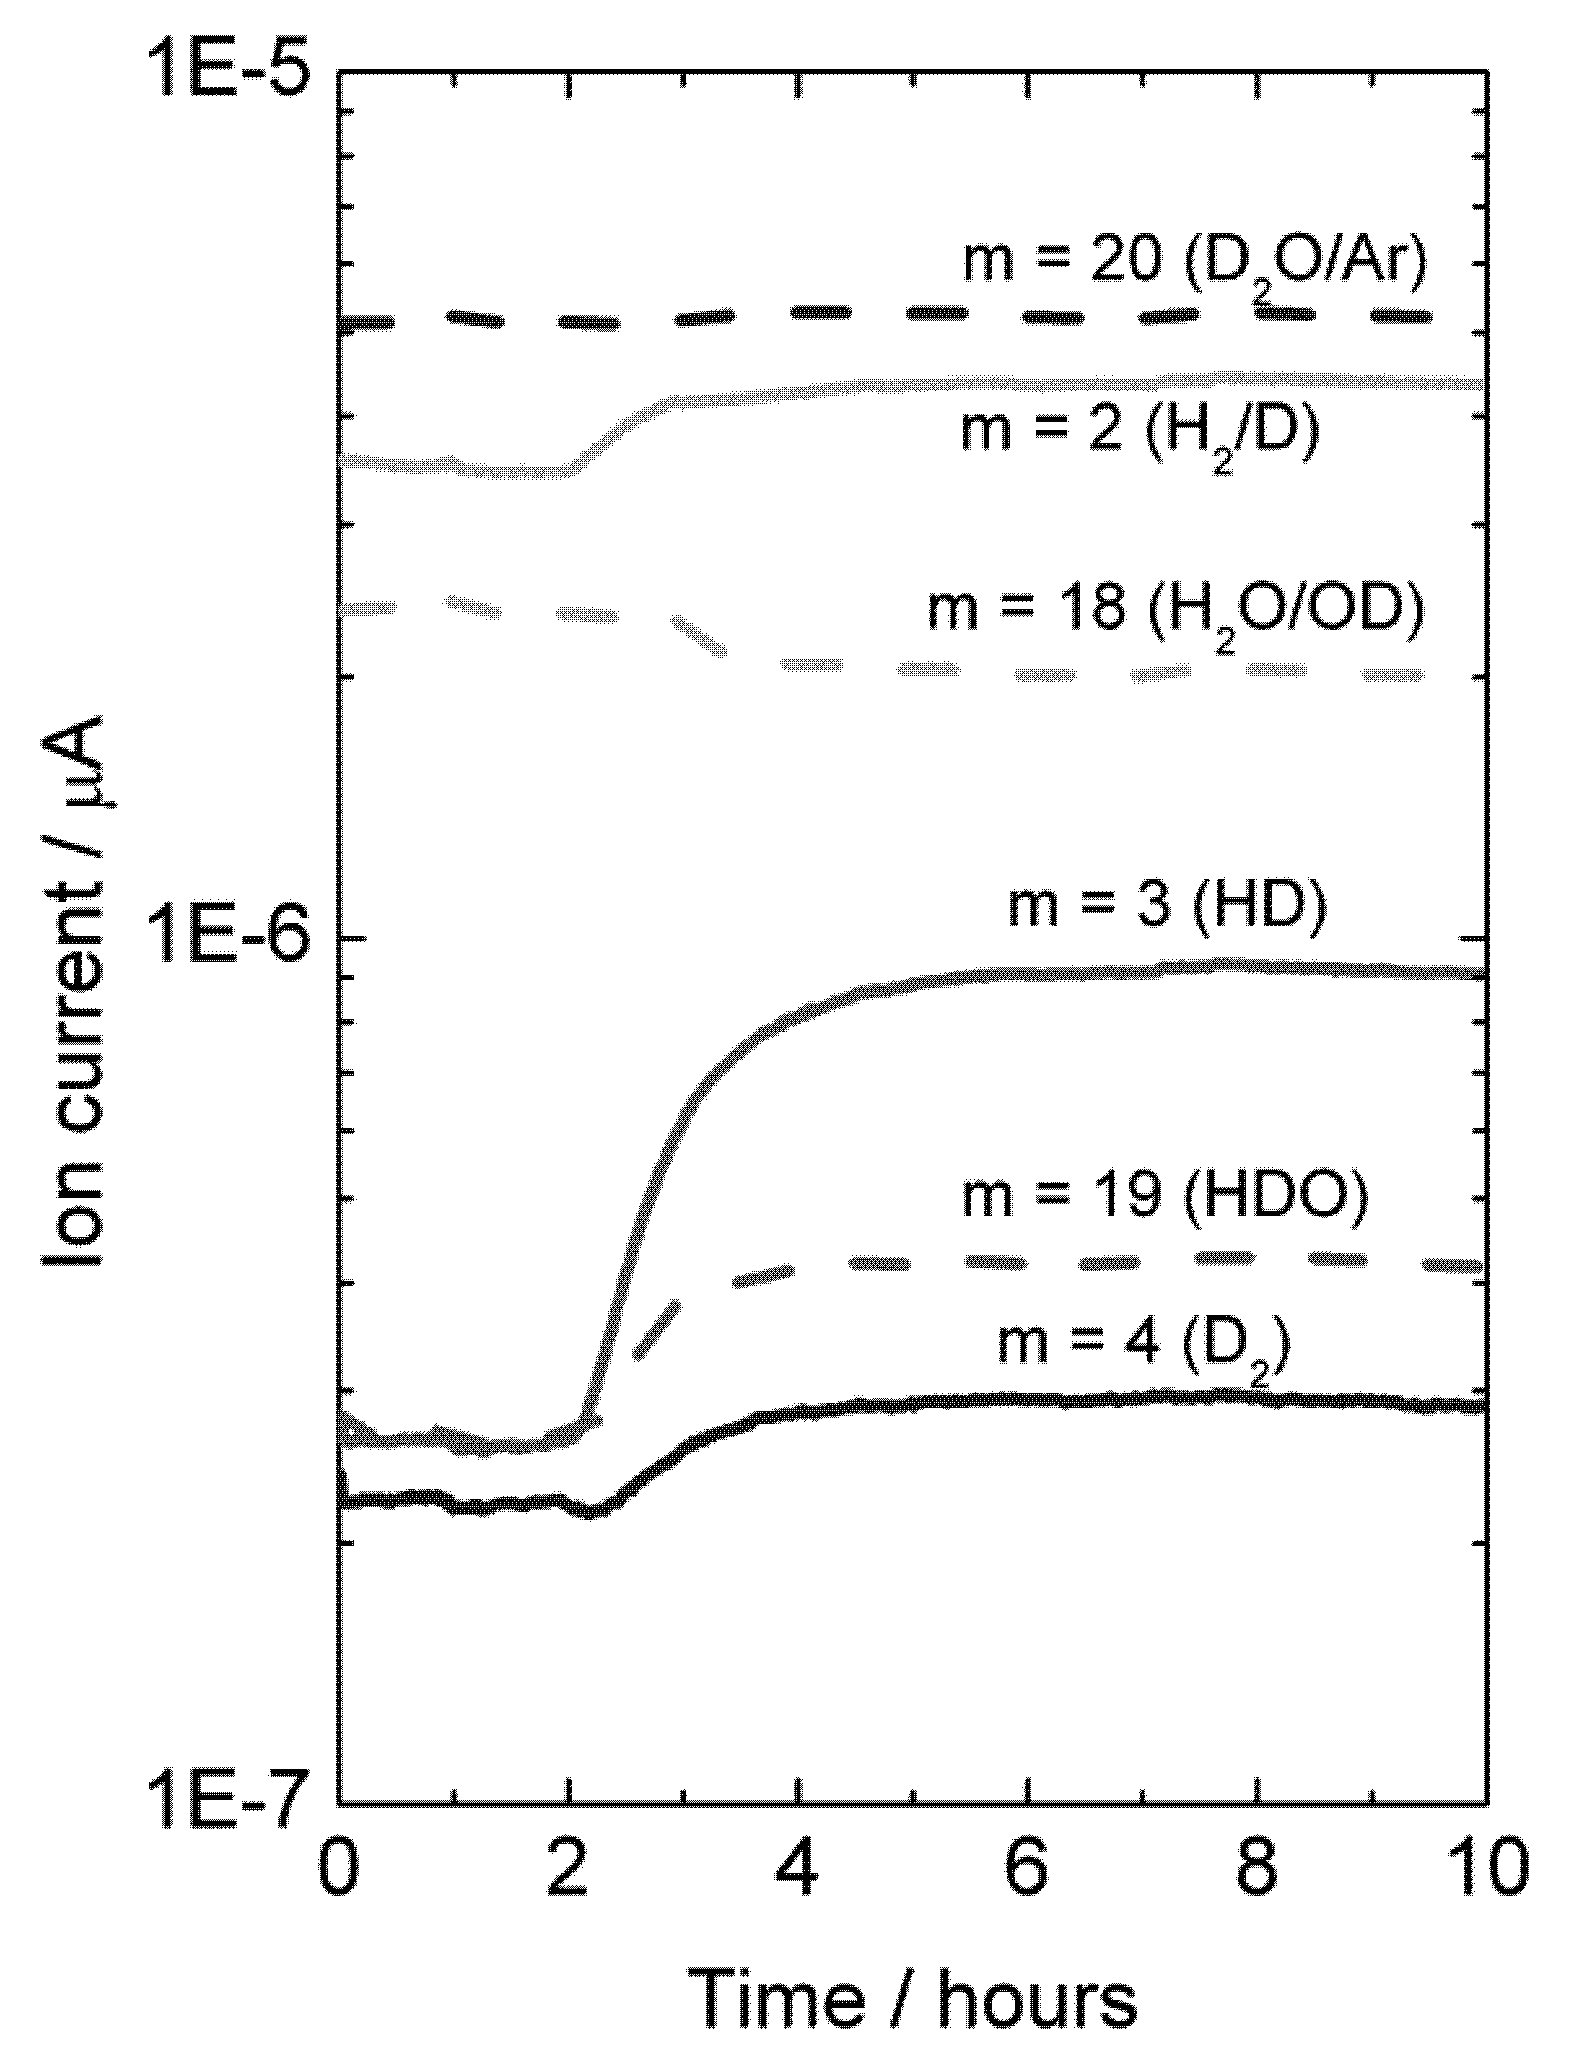
Experiments were also made with H
2O-wetted permeate gas. In this case, D
2 in the permeate, originated from flux, will isotopically mix with H
2O, resulting in an increase in the concentration of species HD, HDO, H
2 and D
2O, and a decrease in the concentration of H
2O, see
Figure 13.
Figure 12.
Mass spectrometer signal from various masses vs. time, indicative of deuterium flux through LSC disk membrane at 1040 °C when changing the feed gas from He + 2.5% D2O to D2 + 2.5% D2O after approximately 1 hour.
Figure 12.
Mass spectrometer signal from various masses vs. time, indicative of deuterium flux through LSC disk membrane at 1040 °C when changing the feed gas from He + 2.5% D2O to D2 + 2.5% D2O after approximately 1 hour.
Figure 13.
Mass spectrometer signal from various masses vs. time, indicative of deuterium flux through LSC disk membrane at 1040 °C when changing the feed gas from He + 2.5% D2O to D2 + 2.5% D2O after approximately 2 hours. Permeate gas is Ar + 2.5% H2O.
Figure 13.
Mass spectrometer signal from various masses vs. time, indicative of deuterium flux through LSC disk membrane at 1040 °C when changing the feed gas from He + 2.5% D2O to D2 + 2.5% D2O after approximately 2 hours. Permeate gas is Ar + 2.5% H2O.
A mass balance analysis of the permeate flue gas for this experiment at 1040 °C results in around 80% of the hydrogen (here hydrogen and deuterium) produced comes from hydrogen (here deuterium) flux and that 20% comes from water splitting.
It may be noted that the sample used here was again a polished disk membrane. The high level of hydrogen flux compared to water splitting suggests that although both processes may be surface kinetics limited, the water splitting is more limited by surface kinetics than the hydrogen flux is.
3.7. Comparison of Data from Different Techniques
Figure 14 presents the ambipolar proton-electron hole and oxygen vacancy-electron hole conductivities as a function of inverse temperature estimated from electrical measurements, the ambipolar proton-electron hole conductivity extracted from the measurements of hydrogen production with the disk membrane (wet and dry permeate gas), and the ambipolar proton-electron hole conductivity extracted from the measurements of hydrogen production with the monolith module (wet permeate gas).
Figure 14.
Ambipolar proton-electron hole and oxygen vacancy-electron hole conductivity as a function of inverse temperature for La0.9Sr0.1CrO3−δ, estimated from conductivity measurements, compared with conductivities extracted from measurements of hydrogen production with disk membrane in two different gradients and with the monolith module. All proton conductivities are extrapolated to 0.025 atm H2O.
Two different models were used to describe the hydrogen flux and relate it to ambipolar conductivity for wet and dry permeate gas. Both assume that the transport number for electron holes is unity, so that ambipolar conductivity equals proton conductivity. For wet permeate gas (and wet feed gas) we assume that the hydration level and thus proton concentration is constant throughout the membrane. The difference in
pH
2 is the only driving force for hydrogen (proton) flux, and the following model is applied:
Here, the proton conductivity is the one valid for the pH2O used in the measurement, L is the membrane thickness, and the other symbols have their usual meanings.
From the dry permeate case, we assume that the
pH
2/
pH
2O ratio is constant throughout the membrane, which is attained to a first approximation through ambipolar water flux accompanying the hydrogen flux. The proton conductivity is thus not constant throughout the membrane, and the following model is applied:
Here
![Membranes 02 00665 i016]()
the
pH
2/
pH
2O used. It may be noted that both models yield proton conductivities that are valid for a given water vapor content, which may be recalculated for another one assuming that the protons are minority defects and their concentration proportional to
pH
2O
1/2, and this has been applied in plotting
Figure 14.
While the models are uncertain, the choice of model does not dramatically alter the resulting proton conductivity.
Based on the knowledge of the defect structure and transport properties of LSC, the conductivity measurements, the D2 flux measurements and isotope exchange data, and the hydrogen production measurements from disk and monolith membranes, we may now tentatively conclude the following from our studies so far:
From the changes in p-type electronic conductivity with
pH
2O, we know that LSC hydrates significantly and contains considerable concentrations of protons. The thermodynamics of hydration can be extracted, and we can make a first guess of the proton conductivity in LSC in wet atmospheres as a function of temperature and compare this with an estimate of the oxide ion conductivity which is based on more solid data (
Figure 14). From this and the dominating p-type electronic conductivity we can predict that LSC will be permeable to hydrogen, oxygen, and water in gradients of
pH
2,
pO
2, and
pH
2O. The two first can be used respectively for hydrogen production by hydrogen flux and water splitting.
The D2 flux measurements prove unambiguously that there is in fact hydrogen flux in the material. Moreover, they suggest that hydrogen flux and water splitting contribute within the same order of magnitude to the hydrogen production (80% and 20%, respectively, for a disk sample at 1040 °C in wet gases).
Hydrogen production measurements using a monolithic membrane module with large area at high pressures and high steam contents yield a high output, one order of magnitude higher than estimated from the guessed proton conductivity, and with a small temperature dependency as predicted for hydrogen flux limited by bulk transport, see
Figure 14. All in all, we suggest that this is to a large extent hydrogen flux, and that the protons therefore may have a higher mobility than guessed.
Hydrogen production measurements using polished disk samples show variations with atmosphere composition that support the simultaneous presence of hydrogen flux and water splitting. The activation energies are, however, consistently higher and the apparent flux lower than expected from the ambipolar conductivities (see
Figure 14). This suggests that these samples are severely limited by surface kinetics. Based on this, the activation energy for surface kinetics is similar for both hydrogen flux and water splitting, although details in the results from the various experiments can be interpreted to reflect that water splitting is more limited by surface kinetics than hydrogen permeation.
The monolith module demonstrated promising flux densities and hydrogen production rates, and appears to have been produced with relatively active surfaces.
Future studies of LSC membranes for hydrogen production must focus on the kinetics and engineering of its surfaces.
4. Experimental Section
4.1. Samples Preparation
The LSC powders were prepared by spray pyrolysis at 750 °C of an aqueous nitrate solution with chromium, strontium and lanthanum concentrations according to the perovskite stoichiometry. The solution contained 1 mole metal ions per liter, corresponding to approximately 115 g perovskite per liter. To retain maximum sintering activity and suppress the concentration and evaporation of carcinogenic Cr(VI), the powder was calcined in vacuum (1 mbar) at 850 °C. The powder was finally milled in a steel attrition mill for 120 min at 300 rpm with 3 kg distilled water to 2 kg LSC. To increase sinterability, small additions (2–4 mol%) of various partly-proprietary sintering aids were added during milling. Dilatometer studies of a powder batch with 2 mol% CaMnO
3 demonstrated densities of >95% by sintering in air at 1700 °C or in 4% H
2 in N
2 at 1600 °C. The latter condition was used for sample preparation, where the LSC powder with various sintering aids (
Table 1) was pressed into green bodies and sintered to dense pellets.
Table 1.
Overview of samples.
Table 1.
Overview of samples.
| Short name | Composition | Sintering aid mol% | Thickness [mm] | Diameter [mm] |
|---|
| 2A_#1 | La0.87Sr0.13CrO3 | 2 ("A") | 0.435 | 20 |
| 4B_#3 | La0.87Sr0.13CrO3 | 4 ("B") | 0.445 | 20 |
| 4SA5_#2 | La0.87Sr0.13CrO3 | 4 (CaMnO3) | 0.550 | 20 |
LSC powder with 2 mol% CaMnO3 was also used for fabrication of the small asymmetric monolithic membrane module. The support structure was a circular porous monolith, extruded from a mixture of LSC and pore former (20 wt % cellulose fiber) with binder (methyl cellulose), plasticizer (polyethylene glycol) and water. The extruded monoliths were dried at 40 °C, while a fan maintained air circulation through the channels. To remove the organic components, the dry monoliths were heated to 500 °C at a low rate of 0.1°/min to avoid overheating and cracking. After a final pre-sintering of the support monolith at 1200 °C, the LSC membrane was applied by dip coating with access to each second monolith channel in a chess pattern. After sintering in dilute hydrogen at 1700 °C, the dense membrane layer was 50 µm thick, and proved gas impervious at room temperature, while the channel width and wall thickness were 1.7 and 0.4 mm, respectively.
Pictures of the membranes and the monolith have been published elsewhere [
3]. The monolith had 37 active channels: 21 for feed gas and 16 for sweep gas. The membrane was applied in the sweep channels. The module was made from a 90 mm long monolith with 86 cm
2 membrane area. To distribute feed and sweep gas in the appropriate channels, manifolds were sealed to the monolith at each end. Each manifold was made from a dense choke plate and gas distributor in LSC and a hat in yttrium stabilized zirconia. The components were sealed to each other by a glass ceramic with thermal expansion profile matching LSC. The module also had 2 gas baffles in platinum around the monolith, matching the inner diameter of the test reactor. During testing, the hats were sealed to Al
2O
3 support tubes by gold rings. Thus, the feed side of the membrane module was available from the inside of the supply tubes, while the sweep channels were available from the outside through the side holes of the gas distributor.
4.2. Electrical Conductivity and Measurements of Hydrogen Production
Electrical conductivity measurements in controlled atmospheres were performed on a La0.9Sr0.1CrO3-sample in a ProboStatTM cell (NorECs AS, Norway). The sample was rather porous—only 82% dense—in order to get a fast response with changes of atmosphere. An alternating current (a.c.), van der Pauw four point method, was used to measure the conductivity as a function of temperature and concentration of water vapor. The measurements were performed using a Solartron SI 1260 Frequency Response Analyzer operating at 1590 Hz and 1 V amplitude. The conductivity was not corrected for porosity, as this is a minor effect, and has no consequence for the interpretations used here. Different hydrogen-argon mixtures were used and the gas composition was controlled by gas mixing and wetting stages. The conductivity measurements were done under atmospheric pressure.
Measurements of hydrogen production of disk-shaped membranes were performed in a ProboStatTM cell, using planar polished samples and gold rings as seals. The support tubes were also polished, in order to improve the sealing process. Helium was used to verify successful sealing, indicated by <0.01 mol% detection of He using a gas chromatograph. Measurements were performed by using a humidified He:H2 mixture (50:50 and 90:10) on the feed side (with a total of 50 mL/min gas flow) and humidified Ar on the permeate side (with a gas flow of 25 mL/min). For pressurized measurements to 5 bars, the normal flow was multiplied by the pressure. Both He and H2 concentrations were measured with a calibrated Varian 4900 µ-GC. The apparent fluxes were calculated from the measured permeate H2 concentration and the calibrated flow of Ar sweep gas after correcting for He leak using a Knudsen ratio. For the pressurized flux measurements, a metal mantel was used on the ProboStatTM cell, which allowed measurement up to 30 bars at 900 °C or 10 bars at 1000 °C. For mass spectrometry measurements, the permeate gas was analyzed with a Pfeiffer PrismaPlus QMG 220, and the spectrometer ion current converted to relative concentrations of species in the gas, based on several background and calibration runs of known gas mixtures.
Measurements of hydrogen production of the module were carried out in a different rig. The module was made from a 9 cm-long monolith, which gave a total of 86 cm2 membrane area. It was installed in a reactor of Paralloy CR39W steel alloy, which is suited for test conditions involving high pressure, temperature and hydrogen activity. The feed gas was a mixture of 70% H2, 20% steam, and 10% N2, while the sweep gas was 80% Ar and 20% steam. At each side, the total flow rate was 1000 mL/min. After sealing the monolith module to the test reactor at 1000 °C, only 0.5% nitrogen was detected in the sweep side flue gas in the entire temperature range.
 where f and p refer respectively to the feed and permeate side, and n is typically between 0.5 and 1 for dense metal membranes and 1 for porous membranes. For these, the driving force is the magnitude in the difference between the two pressures, dominated by the largest one, at the feed side. For dense ceramic membranes, however, the flux can be various functions of the hydrogen partial pressures over the membrane, commonly proportional to
  , and in this case, it is beneficial to generate the highest possible ratio of the partial pressures of hydrogen over the membrane. Surface limiting effects may change these relationships and decrease the flux. In the concept of Norsk Hydro (now merged with Statoil), see Figure 1, a ceramic mixed conductor membrane for hydrogen separation is integrated at high temperature (900–1000 °C) in the reforming reaction, where a high driving force is sustained by keeping the permeate side at a very low partial pressure of hydrogen by reaction with oxygen in air [3]. The purpose of the membrane is three-fold: (i) The membrane separates the two gas streams of natural gas (feed side) and air (permeate side). Hydrogen is transported from the feed side to the permeate side where it reacts with oxygen to generate heat to sustain the endothermic reforming process. The oxidation of hydrogen keeps the hydrogen partial pressure very low at the permeate side, which, as mentioned above, is particularly beneficial for the driving force for flux. (ii) Only the required amount of air required for heat generation is used, thus the permeate stream leaving the reactor is rich in N2. Hence, the membrane process enables N2 co-production that is required to dilute the hydrogen fuel for the subsequent gas turbine combustion process. (iii) Finally, the thin membrane acts as a heat exchanger material.
 ) and oxygen vacancies (i.e.,
  ), respectively. Moreover, the limiting pO2, at which oxygen vacancies and electron holes are equally dominant, shifts to higher pO2 with increasing doping levels and temperatures. The formation of oxygen vacancies at the cost of electron holes can, in Kröger-Vink notation, be written:


 ), and in the region where the holes are dominating and their concentration given by the constant concentration of acceptors, Ea, is given only by that of the mobility. Karim and Aldred [31] reported that the electrical conductivity of La1-xSrxCrO3 increased from the order of 10−2 S/cm at temperatures above 1000 °C and pO2 = 1 atm for x = 0, to values two orders of magnitude higher for high values of x up to the maximum level (x = 0.4). The electron hole activation energy was estimated at 0.192 eV for the undoped chromite (x = 0), and decreased with increasing acceptor-concentrations to 0.113 eV for x = 0.4.
 ), the equilibrium constant of Equation (3), Khydr, was extracted from the fit of the conductivity curves for each temperature. The results are presented in a van 't Hoff plot (Figure 5), and linear regression of lnKhydr as a function of 1/T yields standard enthalpy and entropy changes of the hydration reaction of −70 kJ/mol and −90 KJ/mol, respectively. The equilibrium constant extracted from conductivity measurements at 300 °C was excluded in this fitting, due to significant deviation from the values obtained at higher temperatures, likely a consequence of slow kinetics. The exothermic hydration enthalpy of −70 kJ/mol for La0.9Sr0.1CrO3−δ is far from the endothermic expected, based on the already mentioned empirical correlation [7,8,9,10], and the aforementioned crystal field stabilization of the d-electrons in fully vs. only partially occupied octahedra of the perovskites is an interesting input to understanding this and the many other variations from the correlation.
 . For oxygen vacancies, the pre-exponential factor of mobility, u0,vo, and the enthalpy of mobility, ΔHmob,vo, were set to 200 cm2 K/Vs and 90 kJ/mol, respectively, in accordance with oxygen vacancy diffusion coefficients obtained at temperatures from 950–1100 °C for La0.8Sr0.2Cr0.95Ni0.05O3−δ [30]. For protons, the pre-exponential factor of mobility, u0,OH, was set to 13 cm2K/Vs, in accordance with values obtained for similar perovskite oxides from [9] and the data set of [8], and the enthalpy of mobility, ΔHmob,OH, was set to 60 kJ/mol, from the empirical 2/3 of the value for oxygen vacancies [8]. The pre-exponential factor of hole mobility, u0,h, and the enthalpy of hole mobility, ΔHmob,h, were set in accordance with Weber et al. [35] to 200 cm2K/Vs and 12.5 kJ/mol, respectively. Furthermore, it was assumed that the nominal Sr acceptor level was effective.



 the pH2/pH2O used. It may be noted that both models yield proton conductivities that are valid for a given water vapor content, which may be recalculated for another one assuming that the protons are minority defects and their concentration proportional to pH2O1/2, and this has been applied in plotting Figure 14.


