Article

Influence of STAT4 Genetic Variants and Serum Levels on Multiple Sclerosis Occurrence in the Lithuanian Population

by
Akvile Bruzaite
1,*,
Greta Gedvilaite
1,
Renata Balnyte
2,
Loresa Kriauciuniene
1 and
Rasa Liutkeviciene
1
1
Ophthalmology Laboratory, Neuroscience Institute, Medical Academy, Lithuanian University of Health Sciences, Eiveniu Street 2, LT-50161 Kaunas, Lithuania
2
Department of Neurology, Medical Academy, Lithuanian University of Health Sciences, Eiveniu Street 2, LT-50161 Kaunas, Lithuania
*
Author to whom correspondence should be addressed.
J. Clin. Med. 2024, 13(8), 2385; https://doi.org/10.3390/jcm13082385
Submission received: 20 March 2024 / Revised: 10 April 2024 / Accepted: 13 April 2024 / Published: 19 April 2024

Abstract

:
Background: Multiple sclerosis (MS) is an autoimmune disease involving demyelination, inflammation, gliosis, and the loss of neurons. MS is a growing global health problem most likely caused by genetic, immunological, and environmental factors. However, the exact etiology of the disease is still unknown. Since MS is related to a dysregulation of the immune system, it could be linked to signal transducer and activator of transcription 4 (STAT4). To fully comprehend the significance of the STAT4 gene and STAT4 serum levels in MS, further research is required. Methods: A total of 200 MS patients and 200 healthy controls participated in the study. Deoxyribonucleic acid (DNA) was extracted using silica-based membrane technology. Polymerase chain reaction was used in real time for genotyping. Using the ELISA technique, serum levels were measured. Results: STAT4 rs7601754 AA genotype and the A allele were statistically significantly less frequent in MS patients (p = 0.003). Also, rs7601754 was associated with 1.9-fold increased odds of MS occurrence (p = 0.004). The rs7601754 AG genotype was more common in males with MS (p = 0.011) and was associated with 2.5-fold increased odds of MS occurrence in males (p = 0.012). STAT4 serum levels were statistically significantly lower in MS patients compared to the control group (p = 0.007). Conclusions: STAT4 rs7601754 increases the odds of MS occurrence. STAT4 serum levels were statistically significantly lower in MS patients compared to the control group.

1. Introduction

Multiple sclerosis (MS) is an autoimmune disorder that impacts the central nervous system (CNS) and is characterized by gliosis, demyelination, the inflammation process, and the degeneration of nerve cells [1]. The accumulation of demyelinating lesions in the grey and white matter of the brain/spinal cord is the pathological hallmark of MS [2]. Young adults with MS, typically between the ages of 20 and 30, present with unilateral optic neuritis, partial myelitis, sensory abnormalities, or brainstem syndromes such as internuclear ophthalmoplegia. Worldwide, between 5 and 300 cases of MS per 100,000 people are reported, with a higher incidence in higher latitudes. The overall life expectancy is shorter than the population average (75.9 years vs. 83.4 years), and the risk of developing MS is higher in females than in males (approximately a 3:1 distribution between the genders) [3]. An autoimmune process has long been hypothesized as a mediating factor in MS. Research on experimental autoimmune encephalomyelitis (EAE), an animal model for MS, has suggested a crucial role for T helper lymphocytes. Researchers have studied how activated T cell subtypes contribute to the pathogenesis of MS, focusing on the genetic factors linked to the major histocompatibility complex (MHC) class II locus and the inflammatory response in the affected area [4]. Also, serum levels of interleukin-12 (IL-2), interleukin-4 (IL-4), interleukin-6 (IL-6), interleukin-13 (IL-13), interleukin-17 (IL-17), interleukin-21 (IL-21), interleukin-22 (IL-22), and interleukin-33 (IL-33) tend to be higher in MS patients in the active disease phase than in healthy controls and patients in remission, although interleukin-10 (IL-10) seems to help slow the disease’s progression. Moreover, certain gene variants of interleukin-2 receptor (IL-2R), IL-4, IL-6, IL-13, and IL-22 have been linked to the development of MS [5].
MS is defined as an immune system malfunction resulting in immune cells infiltrating the CNS [6]. After being activated outside the CNS, autoreactive T cells cross the blood–brain barrier (BBB) and are reactivated by nearby antigen-presenting cells. The release of proinflammatory cytokines activates microglia and astrocytes, attracts further inflammatory cells, and induces plasma cells to produce antibodies. This inflammatory process ultimately damages the tissue within the plaque [7].
MS and signal transducer and activator of transcription 4 (STAT4) may be related since MS has been linked to immune system dysfunction [
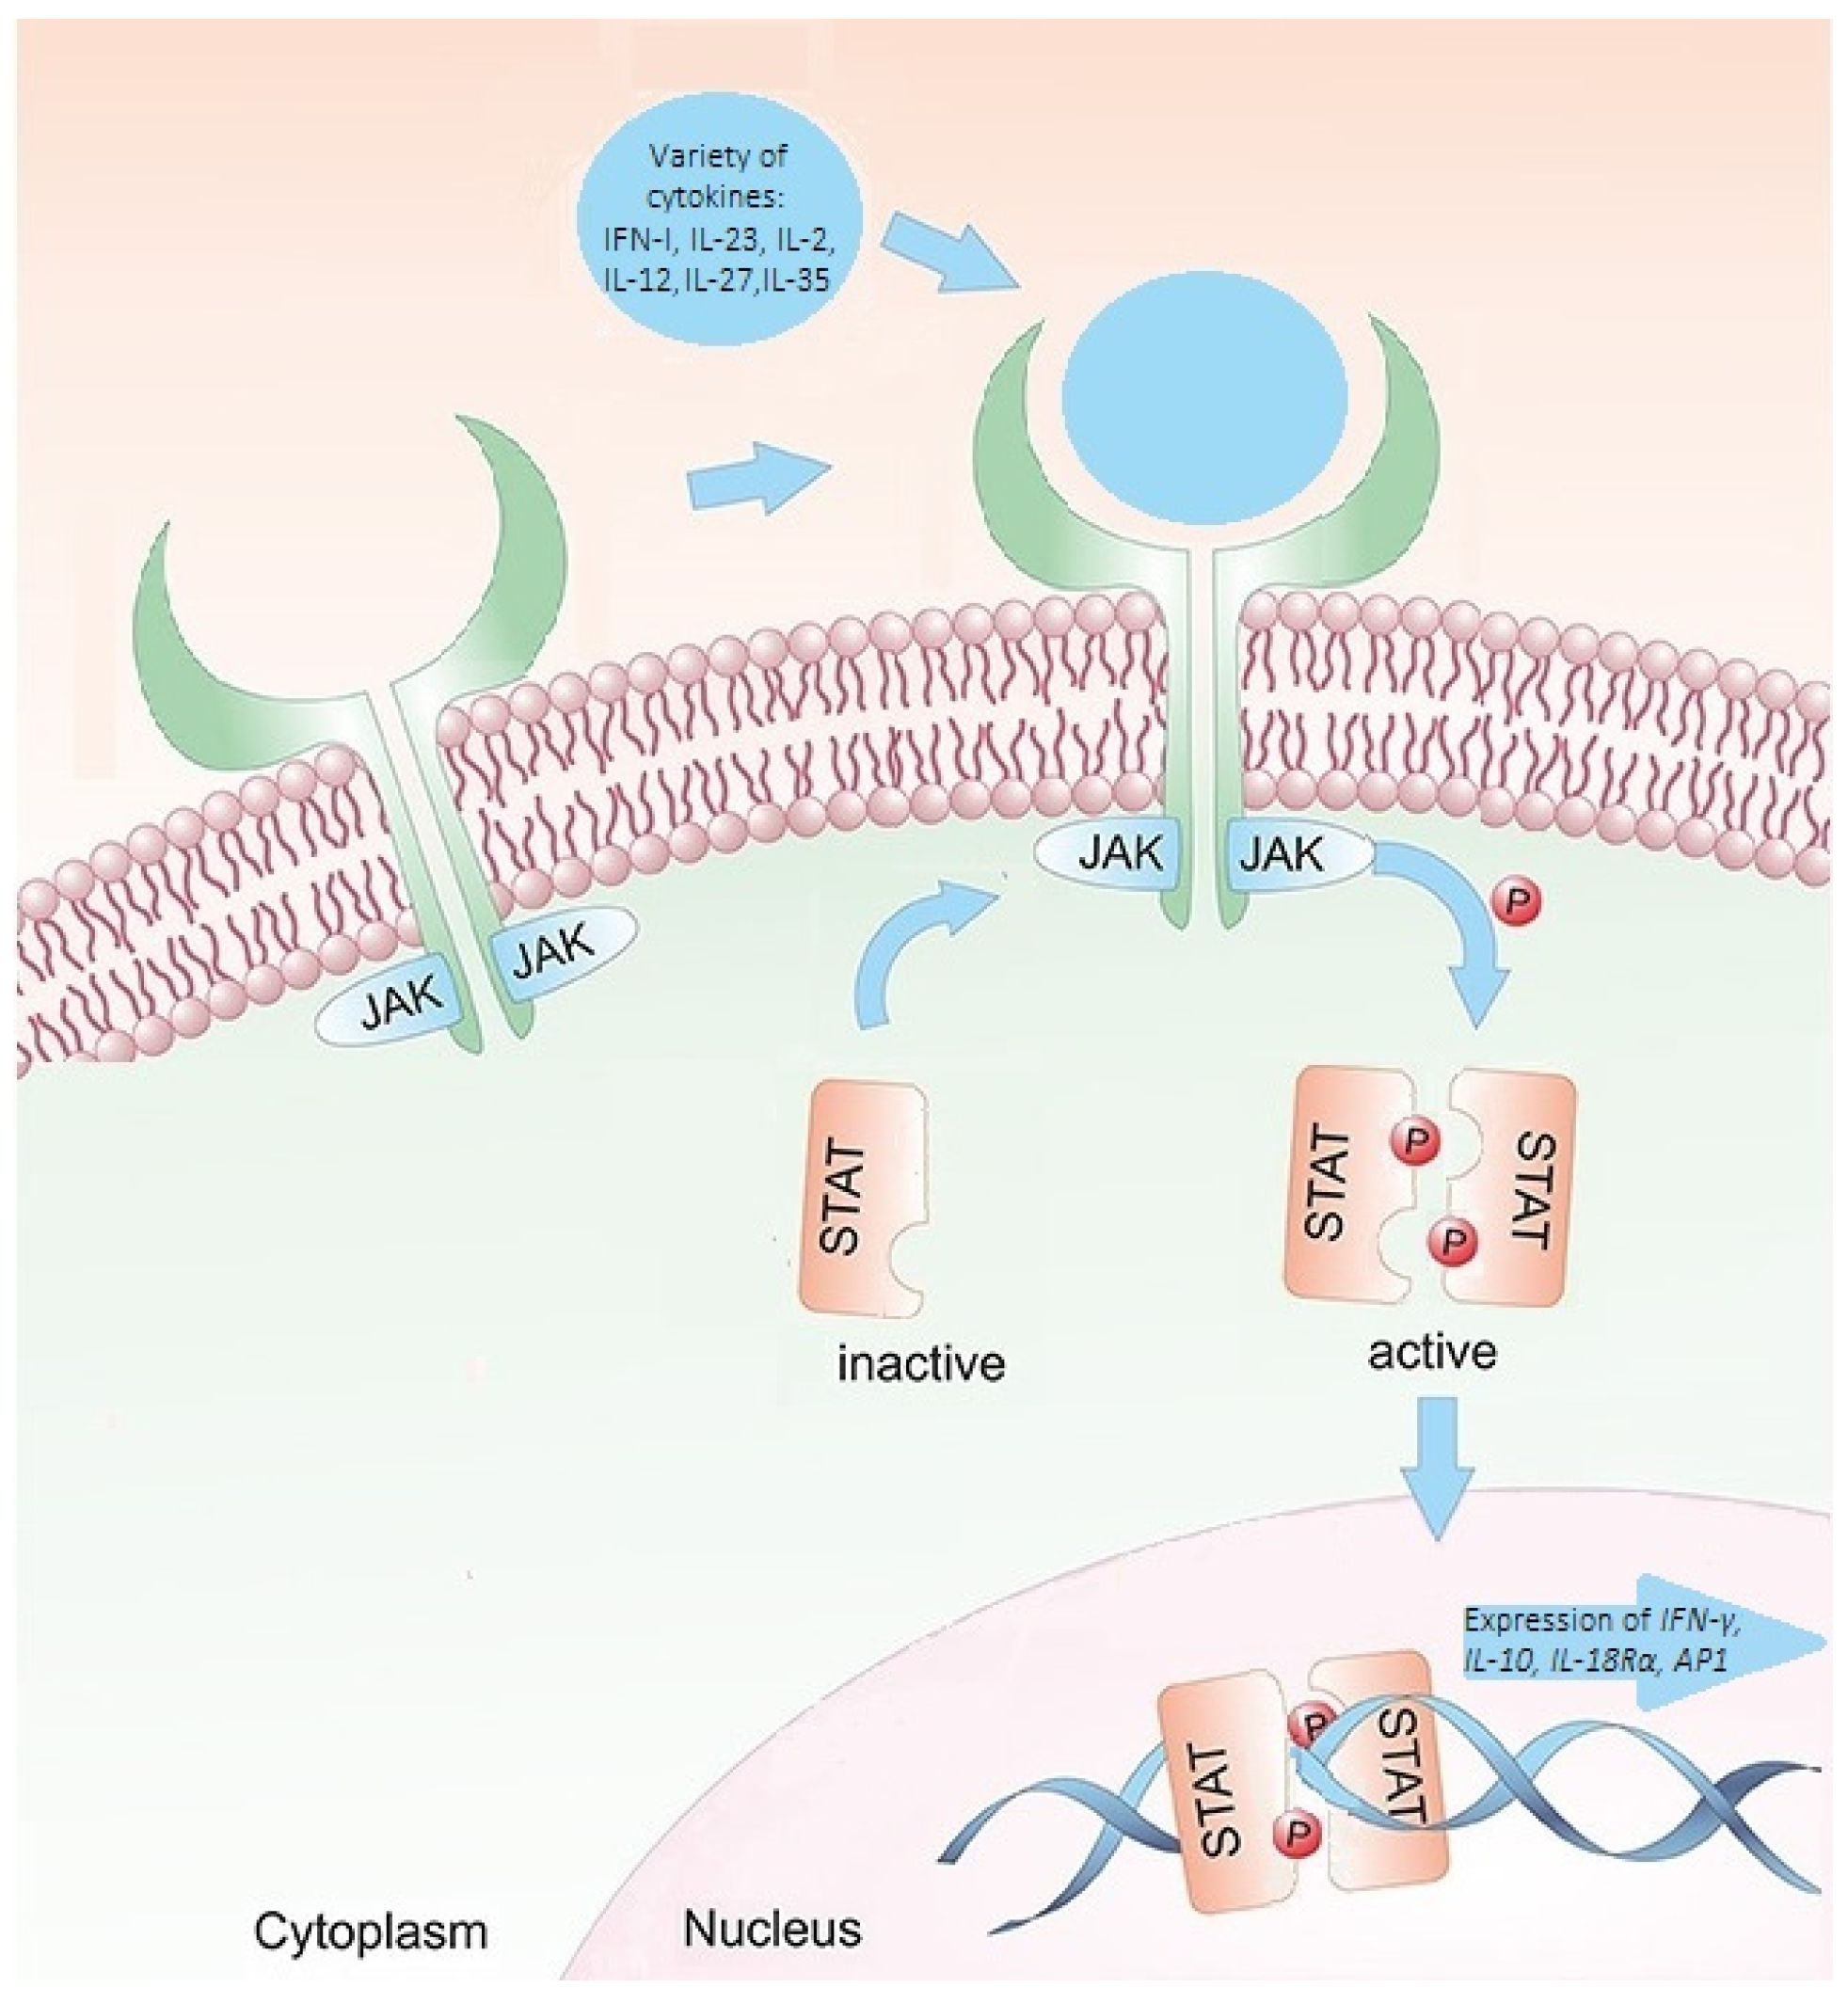
6]. Janus kinases (JAKs) are the proteins through which members of class I and class II cytokine receptor families deliver their signals. Activated JAKs phosphorylate the STATs. After phosphorylation, the STAT proteins undergo cytoplasmic dimerization before migrating to the nucleus, where they bind to deoxyribonucleic acid (DNA) regulatory elements and initiate gene transcription. The STAT signaling cascade is highly selective. A specific subset of genes dependent on STAT proteins is transcribed by any cytokine or combination of cytokines that exerts an effect [8,9]. Consequently, a variation in STAT4 expression or activity might impact the regular immune system’s response and function, resulting in immunosuppression or autoimmune disorders. STAT4 is a crucial modulator of the immunological response (Figure 1) [8]. In addition, the STAT4 gene is responsible for relaying signals from interleukin-12 (IL-12), interleukin-23 (IL-23), and interferon type 1 (INF-1) in T cells and monocytes. These signals ultimately lead to the differentiation of type 1 T helper cells and type 17 T helper cells, monocyte activation, and the production of interferon-gamma (IFN-γ) [10]. It is hypothesized that STAT4 variants may influence the occurrence and function of immune cells involved in the pathogenesis of MS [11].
It is important to note that genetic factors alone cannot explain the occurrence of MS, as environmental factors also play a significant role in the development of the disorder [6,14]. In addition, a positive family history increases the risk of MS for siblings of affected patients by around 30% compared to the general population. More than 200 genetic loci have been linked to MS by genome-wide association study (GWAS) [15]. The epidemiology of MS suggests that smoking, low serum vitamin D levels, childhood obesity, and Epstein–Barr virus infection may contribute to the onset of the disease [16]. Research on the connection between genetic and environmental factors in MS is ongoing to develop new prevention and therapeutic strategies. Overall, the link between the STAT4 gene and MS suggests that dysregulation of the immune system plays a significant role in disease development [6]. The basis of traditional MS treatment is immunomodulatory and anti-inflammatory medications. However, these measures cannot stop the degeneration of the nerve tissue. Neurologists should be aware of the latest findings on the development, pathophysiology, diagnosis, and treatment of MS [17]. Further research is essential to fully clarify the role of the STAT4 gene and STAT4 serum levels in MS and ascertain whether focusing on this gene could be an effective treatment strategy.

2. Materials and Methods

2.1. Patients and Ethical Requirements

This research was authorized by the Kaunas Regional Biomedical Research Ethics Committee at the Lithuanian University of Health Sciences (LUHS) (No. BE-2-/61, approval date: 11 October 2017) and adhered to the Declaration of Helsinki’s criteria. The objective and procedure of the study were explained to each participant. Before participating, all 400 study individuals gave their written informed consent. The MS group was formed with 200 individuals. Criteria for inclusion in the MS group:
  • Patients diagnosed with MS. The diagnosis of MS was confirmed using the 2017 diagnostic criteria, which include positive oligoclonal bands, typical demyelinating lesions on brain/spinal cord magnetic resonance imaging (MRI) scans (per the Magnetic Resonance Imaging in MS (MAGNIMS) criteria), and clinical symptoms/relapses [18,19].
  • Males and females aged between 18 and 99 years.
Exclusion criteria for the MS group:
  • Patients younger than 18 years.
  • The patient has received a transfusion of blood or blood components within the last four weeks.
  • The patient has received treatment with growth factors that counteract blood production in the last four weeks.
The control group included 200 patients. The control group comprised healthy individuals who matched the age and gender distribution of the MS group and who attended LSMUL, KK, the Neurology Clinic, and the Eye Clinic for a preventive examination. Criteria for inclusion in the control group:
  • Healthy subjects without MS.
  • Males and females aged between 18 and 99 years.
Exclusion criteria for the control group:
  • Patients with subjective neurological complaints.
  • Patients having spinal anesthesia.
  • Patients with other neurological diseases without abnormalities in the demyelinating disorder of the brain and/or spinal cord.
After the subject groups were formed, the single-nucleotide polymorphisms (SNPs) STAT4 rs10181656, rs7574865, rs7601754, and rs10168266 were analyzed. The MS group consisted of 200 people: 88 males (44%) and 112 females (56%). The patients’ median age was 38 years (IQR = 15). The control group consisted of 200 people: 79 males (39.5%) and 121 females (60.5%). The control group’s median age was 33 (IQR = 21). No statistically significant differences between gender and age were found within the control and MS groups. Table 1 presents the subjects’ demographic information.

2.2. SNP Selection

Encoding a transcription factor belonging to the STAT family, the STAT4 gene is found on human chromosome 2q32.3 [7]. The STAT4 rs7574865, rs10181656, rs7601754, and rs10168266 were chosen for genotyping based on prior research on other autoimmune diseases. The SNP substitutions, SNP regions, chromosomal positions, and primer sequences are listed in Table 2.
The STAT4 gene is thought to be linked to several autoimmune disorders; however, distinct susceptibility to the disease may result from different SNPs. The molecular mechanism of the STAT4 gene’s involvement in the etiology of MS is still unknown because all mutations identified in this study are found in introns and do not directly affect STAT4 transcription or translation [20].

2.3. DNA Extraction and Genotyping

Each participant’s blood was collected into tubes with ethylenediaminetetraacetic acid (EDTA) Following the manufacturer’s instructions, a genomic DNA extraction kit based on silica-based membrane technology (Thermo Fisher Scientific, Vilnius, Lithuania) was used in the Laboratory of Ophthalmology, Neuroscience Institute, LUHS, to extract DNA. UV spectrophotometry (Agilent Technologies (Andover, MA, USA), Cary 60 UV-Vis) was used to determine the DNA concentrations and purity index in each blood sample as a ratio of absorbance 260/280 nm. Each sample displayed a purity index of 1.8 to 2.0. RT-PCR is a technique used to amplify and quantify DNA in real time, allowing for detecting and quantifying specific DNA sequences in a sample. The RT-PCR method comprised the following steps:
  • Primer design: Specific primers were designed to amplify the target DNA sequence. Primer sequences [VIC/FAM] are shown in Table 3.
  • Probe design: A fluorescent probe was designed to detect the amplified DNA sequence.
  • PCR reaction setup: The extracted DNA was mixed with the primers, probe, and other reagents needed for PCR amplification.
  • PCR amplification: The PCR reaction runs through cycles of denaturation, annealing, and extension, resulting in the exponential amplification of the target DNA sequence.
  • To ensure consistency of the genotyping process and accuracy of the results, a random sample comprising 5% (n = 20) of the total DNA samples was retested.
  • The data obtained from the RT-PCR were analyzed.

2.4. ELISA

Blood from peripheral vessels was collected to prepare serum. After 30 min of room temperature incubation, the blood samples were centrifuged. Following the pellet’s extraction, the serum was transferred into 2 mL tubes, refrigerated, and kept at −80 °C until analysis. The STAT4 serum levels of the control and MS patient groups were measured using the enzymatic immunoassay (ELISA) for human STAT4 (Human STAT4 ELISA Kit, Abbexa, Cambridge, UK) based on the conventional sandwich ELISA technique. The measurements were taken according to the manufacturer’s specifications. The optical density at 450 nm was measured using a microplate reader (Multiskan FC microplate photometer, Thermo Scientific, Waltham, MA, USA). The STAT4 serum levels were determined using the standard curve. The standard curve displayed a sensitivity of < 0.12 ng/mL and a range of 0.312–20 ng/mL.

2.5. Statistical Analysis

SPSS/W 29.0 (Statistical Package for the Social Sciences for Windows, Inc., Chicago, IL, USA) was the software used for the statistical analysis. The Kolmogorov–Smirnov test was used to determine whether the age was normally distributed. Continuous variables were shown as the median with the interquartile range (IQR) for data that were not normally distributed. To compare the two groups, the Mann–Whitney U test was performed. The chi-square (χ2) test examined the allele distributions, genotype, and gender differences between the MS and control groups. The categorical data were presented as absolute numbers with percentages. The binary logistic regression analysis was used to evaluate the effect of SNPs on MS. An odds ratio (OR) with a 95% confidence interval (CI) were provided for the results. Statistical genetic models were used to present the results of logistic regression. The best genetic model was identified using the Akaike information criterion (AIC). We evaluated four SNPs in the STAT4 gene, and a two-tailed test with a value of less than 0.05 was considered statistically significant. The Bonferroni adjustment was used to modify the significance level for multiple comparisons (p = 0.0125 (0.05/4)). Serum STAT4 levels were compared between groups of MS patients and healthy individuals using the Mann–Whitney U test.

3. Results

3.1. STAT4 Variants Associations with MS Occurrence

After analyzing the genotypes and alleles of STAT4 rs10181656, rs7574865, rs7601754, and rs10168266, we found that the STAT4 rs7601754 AA genotype and the A allele were statistically significantly less frequent in MS patients compared to the control group (63.0% vs. 76.5%, p = 0.003, 79.0% vs. 87.0%, p = 0.003, respectively). No statistically significant differences were found between the distribution of genotypes and alleles of STAT4 rs10181656, rs7574865, and rs10168266 in patients with MS and the control group (Table 4).
After analyzing the influence of MS occurence, binary logistic regression revealed that STAT4 rs7601754 was statistically significantly associated with 1.9-fold increased odds of MS occurrence in the dominant model (OR = 1.912; 95% CI: 1.237–2.954; p = 0.004) and each G allele was associated with 1.7-fold increased odds of MS occurrence in the additive model (OR = 1.732; 95% CI: 1.193–2.516; p = 0.004), which were the best fit according to the AIC value, even after Bonferroni correction. The binary logistic regression analysis of the other SNPs showed no statistically significant results (Table 5).

3.2. STAT4 Variants Associations with MS Occurrence in Females

The pathogenesis of MS can be differentiated by gender; based on these data, we performed SNP analyses in males and females separately. The study revealed no statistically significant results after the Bonferroni correction (Table 6).
Furthermore, we used binary logistic regression analysis to assess how these SNPs affected females with MS. After the Bonferroni correction, no statistically significant results were found (Table 7).

3.3. STAT4 Variants Associations with MS Occurrence in Males

The analysis of STAT4 rs10181656, rs7574865, rs7601754, and rs10168266 SNPs in males showed that, after strict Bonferroni correction, the rs7601754 AG genotype is more frequent in males with MS than in the control group (35.2% vs. 17.7%, p = 0.011) (Table 8).
After strict Bonferroni correction, binary logistic regression analysis in males revealed that only STAT4 rs7601754 is associated with 2.5-fold increased odds of MS occurrence in males under the overdominant model (OR: 2.525; CI: 1.224–5.211; p = 0.012) (Table 9).

3.4. STAT4 Variants Associations with MS Occurrence in Patients Younger Than 37 Years

The genotype and allele distribution of STAT4 genetic variant rs7601754 significantly differed between younger-than-37-year-old MS patients and the control group. However, when we applied Bonferroni’s corrected significance threshold, no statistically significant results were found (Table 10).
Binary logistic regression of STAT4 rs10181656, rs7574865, rs7601754, and rs10168266 in younger than 37 years MS patients showed no statistically significant results (Table 11).

3.5. STAT4 Variants Associations with MS Occurrence in Patients Older Than 37 Years

The analysis showed no statistically significant results after the Bonferroni correction (Table 12).
We performed binary logistic regression analysis to evaluate the effects of these SNPs on MS patients older than 37 years. After Bonferroni corrections, no statistically significant results were found (Table 13).

3.6. STAT4 Serum Levels

Throughout the investigation, the blood serum concentration of STAT4 in the MS patient and healthy individual groups was measured. It was found that STAT4 serum concentration was statistically significantly lower in MS patients compared with the control group (median (IQR): 0.16 (0.09) vs. 0.26 (0.42), p = 0.007) (Figure 2).

4. Discussion

STAT4 is a transcription factor that plays a crucial role in developing autoimmune diseases [22]. It encodes an essential transcription factor that carries signals from specific cytokines linked to autoimmune disorders [8]. Since MS is an autoimmune disease, we looked for associations between STAT4 SNPs, STAT4 serum levels, and MS. Even though STAT4 has been linked to a variety of autoimmune disorders—neuromyelitis optica (NMO), systemic lupus erythematosus (SLE), rheumatoid arthritis (RA) systemic sclerosis (SS), MS [11,23,24,25,26]—this is, as far as we know, the first study to investigate the relationship between the STAT4 (rs10181656, rs7574865, rs7601754, and rs10168266), STAT4 serum levels, and the occurrence of MS in the Lithuanian population.
To our knowledge, there is only one study that has investigated an association between an STAT4 variant and MS. Nageeb et al. hypothesized that STAT4 rs7582694 gene polymorphism contributes to autoimmune diseases. The results showed that the CC genotype was statistically significantly more frequent in MS patients compared to the control group. Furthermore, the C allele was statistically significantly higher in patients with MS compared to controls [26].
The demyelinating condition known as NMO is a neurological disorder that matches many clinical characteristics with MS and fulfills all the requirements for an autoimmune origin [23]. Like MS, NMO causes episodes of optic neuritis and transverse myelitis. In both cases, a person’s immune system sees a healthy part of their body as a threat and attacks it. Shi et al. investigated the association between STAT4 rs7601754 and NMO. The study showed that the G allele protects against NMO spectrum disorders (p = 0.006) [20]. Another autoimmune disease that can damage the CNS is SLE, characterized by various immunological abnormalities [24]. Several genetic studies have looked into the link between STAT4 SNPs and SLE risk in different populations, but the results are inconsistent. A meta-analysis showed that STAT4 rs7601754 and rs7574865 are significantly associated with SLE in European and African populations (p < 0.001) [27]. Another meta-analysis conducted by Wang and co-authors confirmed a strong association between the STAT4 rs7574865 and rs10168266 and susceptibility to SLE (p < 0.001, p < 0.001, respectively). This study included 17,389 patients with SLE and 29,273 control subjects [28]. Ebrahimiyan et al. found that the STAT4 rs7601754 A allele was significantly associated with a 0.679 lower susceptibility to SLE (OR = 0.679; 95% CI: 0.610–0.747, p < 0.001) [22]. Another study showed that the STAT4 rs7574865 TT genotype and T allele are significant molecular risk markers for predicting susceptibility to SLE and that the GG genotype is a valuable marker against SLE risk [29]. Analysis of rs10168266 revealed that only the minor allele T was significantly associated with SLE in the Malaysian population (OR = 1.435; 95% CI: 1.143–1.802; p = 0.014) [30]. However, another study conducted by Salmaninejad et al. showed that both alleles A and G and the genotypes of rs7601754 did not show statistically significant differences between juvenile SLE patients and the control group [31].
As the studies show controversial results, we found that the A allele of rs7601754 is significantly associated with higher odds of MS occurrence according to the dominant model (OR = 1.912; 95% CI: 1.237–2.954; p = 0.004) and the additive model (OR = 1.732; 95% CI: 1.193–2.516; p = 0.004) after Bonferroni correction. In addition, the rs7601754 AG genotype is more common in males with MS than in the control group (35.2% vs. 17.7%, p = 0.011). Binary logistic regression analysis in males also revealed that only rs7601754 was associated with 2.5-fold increased odds of MS in males under the overdominant model (OR: 2.525; CI: 1.224–5.211; p = 0.012).
A great model for investigating how the immune system controls neural activity is MS. Accordingly, there is increasing evidence that pro-inflammatory mediators at high levels can seriously disrupt synaptic processes, neuronal excitability in general, and synaptic plasticity [32]. STAT4 is known for its regulatory role in proinflammatory signaling [33]. Additionally, STAT4 plays a critical role as a mediator in the development of inflammation in immunological-mediated diseases and protective immune responses. As a result of abrogated Th1 responses, STAT4-deficient mice are resistant to the development of Th1-mediated autoimmune diseases, including EAE, RA, colitis, myocarditis, and diabetes, because they produce a smaller amount of pro-inflammatory cytokines, such as tumor necrosis factor-alpha (TNF-α). [11]. A meta-analysis showed that the STAT4 rs7574865 T allele was associated with RA in Europeans (OR = 1.300; 95% CI = 1.195–1.414; p < 0.001) [34]. Another study found a statistical association between rs10181656 and RA (p = 0.007) [35]. Furthermore, Hanan et al. found that patients carrying the T allele of rs7574865 have a high risk of RA and SLE compared to healthy controls (p < 0.001) [36]. It was also noticed that the rs7574865 T allele was statistically significantly associated with susceptibility to SS in the Spanish population (OR = 1.61; 95% CI: 1.29–1.99; p < 0.001) [25]. According to a study carried out by Zhang et al., the results showed a statistically significant association between the STAT4 rs7601754 A allele and the risk of primary biliary cholangitis (OR = 1.35; 95% CI: 1.17–1.55; p < 0.001) [37]. Although various sources indicate associations of STAT4 rs10181656, rs7574865, rs7601754, and rs10168266 with inflammatory and autoimmune diseases, in our study, only rs7601754 was statistically significantly associated with the occurrence of MS.
Inflammation depends on STAT, which controls the behavior of immune cells by facilitating the extracellular signaling of inflammatory mediators. Research shows that cytokines and growth factors can usually bind to their corresponding cell surface receptors to initiate an intracellular tyrosine kinase phosphorylation cascade. This cascade can be modified by kinases such as JAK2, which can alter immune responses, growth, and metabolic processes. Only a few studies have examined the association of STAT4 serum levels with disease risk. A study carried out by Zhang et al. revealed that the placenta of preeclampsia patients had statistically significantly higher STAT4 levels compared to normal late-term pregnant females [38]. It is also known that the increased systemic inflammatory response triggered by endotoxins is coordinated by excessive cytokine production. A study by Lentsch et al. showed that STAT4 is a vital regulator of the systemic inflammatory response to endotoxins. Mice lacking STAT4 are highly susceptible to lethal endotoxemia. These results indicate that STAT4 protects against endotoxin-induced death [39]. We found that serum STAT4 levels were statistically significantly lower in MS patients compared to the control group (median (IQR): 0.16 (0.09) vs. 0.26 (0.42), p = 0.007).
In conclusion, this was the first attempt to evaluate the association of STAT4 SNPs and STAT4 serum levels with MS in the Lithuanian population. Although STAT4 rs10181656, rs7574865, and rs10168266 have been associated with various types of autoimmune and inflammatory diseases, they were not considered as genetic factors contributing to MS in our patient group. Only STAT4 rs7601754 is associated with MS and increases the disease occurence in the Lithuanian population. However, given the small number of patients in the case group of this study, further investigations with a sufficient sample size and in other populations, as well as an evaluation of different potential SNPs, will be helpful interpretations to reach a comprehensive conclusion about the role of STAT4 in MS etiopathogenesis. The lack of association could be due to the small number of patients in the study group. Further studies with larger samples are needed to confirm these results and draw a conclusion.

5. Conclusions

In summary, the results of the present study show that STAT4 rs7601754 increases the odds of MS occurrence. STAT4 serum levels were statistically significantly lower in MS patients compared to the control group. STAT4 rs7601754 and STAT4 serum levels could be potential biomarkers associated with MS. Identifying STAT4 variants and STAT4 serum levels’ impact on MS can help to identify personalized treatment strategies for individuals with MS. However, our results need to be verified in further studies.

Author Contributions

Conceptualization, A.B., G.G. and R.L.; methodology, A.B. and G.G.; software, G.G.; validation, A.B. and G.G.; formal analysis, A.B. and G.G.; investigation, A.B. and G.G.; resources, R.L., R.B. and L.K., data curation, G.G.; writing—original draft preparation, G.G., A.B. and R.L.; writing—review and editing, A.B., G.G., L.K., R.B. and R.L.; visualization, A.B., G.G. and R.L.; supervision, R.L.; project administration, G.G. and R.L.; funding acquisition, A.B. All authors have read and agreed to the published version of the manuscript.

Funding

This research received no external funding.

Institutional Review Board Statement

The study was conducted according to the Declaration of Helsinki and approved by the Biomedical Research, Lithuanian University of Health Sciences (No. BE-2-47).

Informed Consent Statement

Informed consent was obtained from all subjects involved in the study.

Data Availability Statement

The data presented in this study are available on request from the corresponding author due to ethical reasons.

Conflicts of Interest

The authors declare no conflicts of interest.

References

  1. Tafti, D.; Ehsan, M.; Xixis, K.L. Multiple Sclerosis. In StatPearls [Internet]; StatPearls Publishing: Treasure Island, FL, USA, 2023. [Google Scholar]
  2. Filippi, M.; Bar-Or, A.; Piehl, F.; Preziosa, P.; Solari, A.; Vukusic, S.; Rocca, M.A. Multiple sclerosis. Nat. Rev. Dis. Prim. 2018, 4, 43, Erratum in Nat. Rev. Dis. Prim. 2018, 4, 49. [Google Scholar] [CrossRef] [PubMed]
  3. McGinley, M.P.; Goldschmidt, C.H.; Rae-Grant, A.D. Diagnosis and Treatment of Multiple Sclerosis: A Review. JAMA 2021, 325, 765–779, Erratum in JAMA 2021, 325, 2211. [Google Scholar] [CrossRef] [PubMed]
  4. Rodríguez Murúa, S.; Farez, M.F.; Quintana, F.J. The Immune Response in Multiple Sclerosis. Annu. Rev. Pathol. 2022, 17, 121–139. [Google Scholar] [CrossRef]
  5. Grunwald, C.; Krętowska-Grunwald, A.; Adamska-Patruno, E.; Kochanowicz, J.; Kułakowska, A.; Chorąży, M. The Role of Selected Interleukins in the Development and Progression of Multiple Sclerosis—A Systematic Review. Int. J. Mol. Sci. 2024, 25, 2589. [Google Scholar] [CrossRef]
  6. Angelini, G.; Bani, A.; Constantin, G.; Rossi, B. The interplay between T helper cells and brain barriers in the pathogenesis of multiple sclerosis. Front. Cell Neurosci. 2023, 17, 1101379. [Google Scholar] [CrossRef] [PubMed]
  7. Kamm, C.P.; Uitdehaag, B.M.; Polman, C.H. Multiple sclerosis: Current knowledge and future outlook. Eur. Neurol. 2014, 72, 132–141. [Google Scholar] [CrossRef] [PubMed]
  8. Gao, X.; Wang, J.; Yu, Y. The Association Between STAT4 rs7574865 Polymorphism and the Susceptibility of Autoimmune Thyroid Disease: A Meta-Analysis. Front. Genet. 2019, 9, 708. [Google Scholar] [CrossRef]
  9. Rodriguez, M.; Zoecklein, L.; Gamez, J.D.; Pavelko, K.D.; Papke, L.M.; Nakane, S.; Howe, C.; Radhakrishnan, S.; Hansen, M.J.; David, C.S.; et al. STAT4- and STAT6-signaling molecules in a murine model of multiple sclerosis. FASEB J. 2006, 20, 343–345. [Google Scholar] [CrossRef]
  10. Korman, B.D.; Kastner, D.L.; Gregersen, P.K.; Remmers, E.F. STAT4: Genetics, mechanisms, and implications for autoimmunity. Curr. Allergy Asthma Rep. 2008, 8, 398–403. [Google Scholar] [CrossRef]
  11. Kaplan, M.H. STAT4: A critical regulator of inflammation in vivo. Immunol. Res. 2005, 31, 231–242. [Google Scholar] [CrossRef]
  12. Gotthardt, D.; Trifinopoulos, J.; Sexl, V.; Putz, E.M. JAK/STAT Cytokine Signaling at the Crossroad of NK Cell Development and Maturation. Front. Immunol. 2019, 10, 2590. [Google Scholar] [CrossRef] [PubMed]
  13. Yang, C.; Mai, H.; Peng, J.; Zhou, B.; Hou, J.; Jiang, D. STAT4: An immunoregulator contributing to diverse human diseases. Int. J. Biol. Sci. 2020, 16, 1575–1585. [Google Scholar] [CrossRef] [PubMed]
  14. Cotsapas, C.; Mitrovic, M.; Hafler, D. Multiple sclerosis. Handb. Clin. Neurol. 2018, 148, 723–730. [Google Scholar] [CrossRef] [PubMed]
  15. Patsopoulos, N.A. Genetics of Multiple Sclerosis: An Overview and New Directions. Cold Spring Harb. Perspect. Med. 2018, 8, a028951. [Google Scholar] [CrossRef] [PubMed]
  16. Dobson, R.; Giovannoni, G. Multiple sclerosis—A review. Eur. J. Neurol. 2019, 26, 27–40. [Google Scholar] [CrossRef] [PubMed]
  17. Ghasemi, N.; Razavi, S.; Nikzad, E. Multiple Sclerosis: Pathogenesis, Symptoms, Diagnoses, and Cell-Based Therapy. Cell J. 2017, 19, 1–10. [Google Scholar] [CrossRef] [PubMed]
  18. Filippi, M.; Rocca, M.A.; Ciccarelli, O.; De Stefano, N.; Evangelou, N.; Kappos, L.; Rovira, A.; Sastre-Garriga, J.; Tintorè, M.; Frederiksen, J.L.; et al. MRI criteria for the diagnosis of multiple sclerosis: MAGNIMS consensus guidelines. Lancet Neurol. 2016, 15, 292–303. [Google Scholar] [CrossRef] [PubMed]
  19. Thompson, A.J.; Banwell, B.L.; Barkhof, F.; Carroll, W.M.; Coetzee, T.; Comi, G.; Correale, J.; Fazekas, F.; Filippi, M.; Freedman, M.S.; et al. Diagnosis of multiple sclerosis: 2017 revisions of the McDonald criteria. Lancet Neurol. 2018, 17, 162–173. [Google Scholar] [CrossRef] [PubMed]
  20. Shi, Z.; Zhang, Q.; Chen, H.; Lian, Z.; Liu, J.; Feng, H.; Miao, X.; Du, Q.; Zhou, H. STAT4 Polymorphisms are Associated with Neuromyelitis Optica Spectrum Disorders. Neuromol. Med. 2017, 19, 493–500. [Google Scholar] [CrossRef]
  21. SNP [Internet]. Bethesda (MD): National Library of Medicine (US), National Center for Biotechnology Information. 2004. Available online: https://www.ncbi.nlm.nih.gov/snp/ (accessed on 20 November 2023).
  22. Ebrahimiyan, H.; Rezaei, R.; Mostafaei, S.; Aslani, S.; Goulielmos, G.N.; Jamshidi, A.; Mahmoudi, M. Association study between STAT4 polymorphisms and susceptibility to systemic lupus erythematosus disease: A systematic review and meta-analysis. Meta Gene 2018, 16, 241–247. [Google Scholar] [CrossRef]
  23. Lalan, S.; Khan, M.; Schlakman, B.; Penman, A.; Gatlin, J.; Herndon, R. Differentiation of neuromyelitis optica from multiple sclerosis on spinal magnetic resonance imaging. Int. J. MS Care 2012, 14, 209–214. [Google Scholar] [CrossRef]
  24. Ota, Y.; Srinivasan, A.; Capizzano, A.A.; Bapuraj, J.R.; Kim, J.; Kurokawa, R.; Baba, A.; Moritani, T. Central Nervous System Systemic Lupus Erythematosus: Pathophysiologic, Clinical, and Imaging Features. Radiographics 2022, 42, 212–232. [Google Scholar] [CrossRef] [PubMed]
  25. Rueda, B.; Broen, J.; Simeon, C.; Hesselstrand, R.; Diaz, B.; Suarez, H.; Ortego-Centeno, N.; Riemekasten, G.; Fonollosa, V.; Vonk, M.; et al. The STAT4 gene influences the genetic predisposition to systemic sclerosis phenotype. Hum. Mol. Genet. 2009, 18, 2071–2077. [Google Scholar] [CrossRef] [PubMed]
  26. Nageeb, R.S.; Omran, A.A.; Nageeb, G.S.; Yousef, M.A.; Mohammad, Y.A.A.; Fawzy, A. STAT4 gene polymorphism in two major autoimmune diseases (multiple sclerosis and juvenile-onset systemic lupus erythematosus) and its relation to disease severity. Egypt. J. Neurol. Psychiatry Neurosurg. 2018, 54, 16. [Google Scholar] [CrossRef] [PubMed]
  27. Byrne, J.C.; Ní Gabhann, J.; Lazzari, E.; Mahony, R.; Smith, S.; Stacey, K.; Wynne, C.; Jeffer-ies, C.A. Genetics of SLE: Functional relevance for monocytes/macrophages in disease. Clin. Dev. Immunol. 2012, 2012, 582352. [Google Scholar] [CrossRef]
  28. Wang, J.M.; Xu, W.D.; Huang, A.F. Association of STAT4 Gene Rs7574865, Rs10168266 Polymorphisms and Systemic Lupus Erythematosus Susceptibility: A Meta-analysis. Immunol. Investig. 2021, 50, 282–294. [Google Scholar] [CrossRef] [PubMed]
  29. Zhou, T.B.; Jiang, Z.P.; Qin, Y.H.; Zhou, J.F. Retracted Association of STAT4 gene polymorphism with systemic lupus erythematosus/lupus nephritis risk. Nephrology 2014, 19, 517. [Google Scholar] [CrossRef]
  30. Chai, H.C.; Chua, K.H.; Lim, S.K.; Phipps, M.E. Insight into gene polymorphisms involved in toll-like receptor/interferon signalling pathways for systemic lupus erythematosus in Southeast Asia. J. Immunol. Res. 2014, 2014, 529167. [Google Scholar] [CrossRef] [PubMed]
  31. Salmaninejad, A.; Mahmoudi, M.; Aslani, S.; Poursani, S.; Ziaee, V.; Rezaei, N. Association of STAT4 gene single nucleotide polymorphisms with Iranian juvenile-onset systemic lupus erythematosus patients. Turk. J. Pediatr. 2017, 59, 144–149. [Google Scholar] [CrossRef]
  32. Stampanoni Bassi, M.; Iezzi, E.; Centonze, D. Multiple sclerosis: Inflammation, auto-immunity, and plasticity. Handb. Clin. Neurol. 2022, 184, 457–470. [Google Scholar] [CrossRef]
  33. Meng, Z.Z.; Liu, W.; Xia, Y.; Yin, H.M.; Zhang, C.Y.; Su, D.; Yan, L.F.; Gu, A.H.; Zhou, Y. The pro-inflammatory signalling regulator Stat4 promotes the vasculogenesis of great vessels derived from endothelial precursors. Nat. Commun. 2017, 8, 14640. [Google Scholar] [CrossRef] [PubMed]
  34. Lee, Y.H.; Woo, J.H.; Choi, S.J.; Ji, J.D.; Song, G.G. Association between the rs7574865 polymorphism of STAT4 and rheumatoid arthritis: A meta-analysis. Rheumatol. Int. 2010, 30, 661–666. [Google Scholar] [CrossRef] [PubMed]
  35. Ghanavati, F.; Nezhad, S.R.K.; Hajjari, M.R.; Akhoond, M.R. Association of Signal Transducer and Activator of Transcription 4 rs10181656 Polymorphism with Rheumatoid Arthritis and Systemic Sclerosis in Khuzestan Province in South-western Iran. Arch. Rheumatol. 2019, 34, 434–442. [Google Scholar] [CrossRef] [PubMed]
  36. El-Saadany, H.M.; Amer, W.H.; Khalil, H.S.; Gaber, R.A.; Elshweikh, S.A. Association of STAT4 polymorphism with susceptibility and severity of rheumatoid arthritis and systemic lupus erythematosus in Egyptian patients. Egypt. Rheumatol. 2016, 38, 21–27. [Google Scholar] [CrossRef]
  37. Zhang, L.; Gao, C.; Liu, C.; Chen, J.; Xu, K. Association between STAT4 polymorphisms and risk of primary biliary cholangitis: A meta-analysis. Genes Genom. 2018, 40, 1101–1109. [Google Scholar] [CrossRef]
  38. Zhang, L.; Li, X.; Zhou, C.; You, Z.; Zhang, J.; Cao, G. The diagnosis values of serum STAT4 and sEng in preeclampsia. J. Clin. Lab. Anal. 2020, 34, e23073. [Google Scholar] [CrossRef]
  39. Lentsch, A.B.; Kato, A.; Davis, B.; Wang, W.; Chao, C.; Edwards, M.J. STAT4 and STAT6 regulate systemic inflammation and protect against lethal endotoxemia. J. Clin. Investig. 2001, 108, 1475–1482. [Google Scholar] [CrossRef]
Figure 1. The JAK/STAT signaling pathway. Signals from extracellular cytokines are transmitted to the cell nucleus via the JAK/STAT signaling pathway. The transmembrane receptor of a cytokine binds to it and activates receptor associated JAKs, which phosphorylate STAT proteins. The transcription of the target genes is modulated by activated STAT proteins, which migrate into the cell nucleus as homo- or heterodimers [12,13].
Jcm 13 02385 g001
Figure 2. STAT4 concentrations in MS patients and healthy individuals.
Jcm 13 02385 g002
Table 1. Demographic characteristics of study groups.
CharacteristicsGroupp-Value
MS (n = 200)Control Group (n = 200)
Male, n (%)88 (44.0)79 (39.5)0.417 1
Female, n (%)112 (56.0)121 (60.5)
Age, (years), median, (IQR)38.0 (15)33.0 (21)0.143 2
MS—multiple sclerosis; p-value—significance level (differences considered significant when p < 0.05). 1 Pearson chi-square; 2 Mann–Whitney U test.
Table 2. Information about STAT4 SNPs used to amplify real-time polymerase chain reaction (RT-PCR) [20,21].
Rs NumberSNP SubstitutionRegionChromosome PositionHGVS Nomenclature
rs7574865G>TIntron 3191,964,633NC_000002.12:191099907T>G
rs10181656C>GIntron 3191,969,879NC_000002.12:191105152: G>C
rs7601754G>AIntron 4191,940,45NC_000002.12:191075724: G>A
rs10168266C>TIntron 5191,935,804NC_000002.12:191071077:C>T
SNP—single-nucleotide polymorphism; HGVS—Human Genome Variation Society.
Table 3. Primer sequences [VIC/FAM] of STAT4 SNPs.
SNPPrimer Sequence
rs7574865TATGAAAAGTTGGTGACCAAAATGT[G/T]ATAGTGGTTATCTTATTTCAGTGG
rs10181656ACTAGCTGGAATCCAACTCTTCTCA[C/G]CCCTTGTACCACTACCCTCCTTTGT
rs7601754CATGGGGGTGAAGAAAAGGAACTAC[G/A]CAAAGATGATACTAAGACCTTGATT
rs10168266AGTAGTAGCTATTGACTACATGATA[C/T]ACTGTCTACCCACCCGTAGTAATAA
Table 4. Genotype and allele distribution of the STAT4 variants in MS patients and the control groups.
PolymorphismMS, n (%)Control Group, n (%)p-Value
STAT4 rs10181656
CC122 (61.0)117 (58.5)0.307
CG73 (36.5)72 (36.0)
GG5 (2.5)11 (5.5)
Total200 (100)200 (100)
Allele
C317 (79.25)306 (76.5)0.349
G83 (20.75)94 (23.5)
STAT4 rs7574865
GG125 (62.5)118 (59.0)0.214
GT70 (35.0)70 (35.0)
TT5 (2.5)12 (6.0)
Total200 (100)200 (100)
Allele
G320 (80.0)306 (76.5)0.230
T80 (20.0)94 (23.5)
STAT4 rs7601754
AA126 (63.0) 1153 (76.5) 10.012
AG64 (32.0)42 (21.0)
GG10 (5.0)5 (2.5)
Total200 (100)200 (100)
Allele
A316 (79.0)348 (87.0)0.003
G84 (21.0)52 (13.0)
STAT4 rs10168266
CC134 (67.0)133 (66.5)0.441
CT54 (27.0)60 (30.0)
TT12 (6.0)7 (3.5)
Total200 (100)200 (100)
Allele
C322 (80.5)326 (81.5)0.719
T78 (19.5)74 (18.5)
1 AA vs. AG+GG p = 0.003; MS—multiple sclerosis; p-value—significance level. Bonferroni corrected the significance level when p < 0.0125 (0.05/4). Note: Significant results are indicated in bold.
Table 5. Analysis of STAT4 variants using binary logistic regression in patients with MS and the control groups.
ModelGenotype/AlleleOR (95% CI)p-ValueAIC
STAT4 rs10181656
Co-dominantCG vs. CC0.972 (0.644–1.469)0.894556.100
GG vs. CC0.436 (0.147–1.293)0.134
DominantCG+GG vs. CC0.901 (0.604–1.344)0.610556.258
RecessiveGG vs. CC+CG0.441 (0.150–1.292)0.135554.118
OverdominantCG vs. CC+GG1.022 (0.680–1.536)0.917556.507
AdditiveG0.845 (0.599–1.192)0.336555.591
STAT4 rs7574865
Co-dominantGT vs. GG0.944 (0.623–1.431)0.786555.346
TT vs. GG0.393 (0.134–1.150)0.088
DominantGT+TT vs. GG0.863 (0.578–1.290)0.474556.004
RecessiveTT vs. GG+GT0.402 (0.139–1.162)0.092553.420
OverdominantGT vs. TT+GG1.000 (0.663–1.508)1.000556.518
AdditiveT0.809 (0.574–1.139)0.224555.034
STAT4 rs7601754
Co-dominantAG vs. AA1.850 (1.174–2.917)0.008549.602
AA vs. AA2.429 (0.809–7.289)0.114
DominantAG+GG vs. AA1.912 (1.237–2.954)0.004547.825
RecessiveGG vs. AA+AG2.053 (0.689–6.117)0.197554.754
OverdominantAG vs. AA+GG1.770 (1.127–2.781)0.013550.271
AdditiveG1.732 (1.193–2.516)0.004547.848
STAT4 rs10168266
Co-dominantCT vs. CC0.893 (0.576–1.386)0.614556.867
CC vs. CC1.701 (0.650–4.455)0.279
DominantCT+TT vs. CC0.978 (0.645–1.482)0.915556.506
RecessiveTT vs. CC+CT1.760 (0.678–4.567)0.245555.121
OverdominantCT vs. CC+TT0.863 (0.559–1.333)0.506556.076
AdditiveT1.062 (0.755–1.494)0.728556.397
MS—multiple sclerosis; OR—odds ratio; AIC—Akaike information criterion; p-value—significance level. Bonferroni corrected the significance level when p < 0.0125 (0.05/4). Note: Significant results are indicated in bold.
Table 6. Genotype and allele distribution of the STAT4 variants in females with MS and the control groups.
PolymorphismMS, n (%)Control Group,
n (%)
p-Value
STAT4 rs10181656
CC66 (58.9)67 (55.4)0.684
CG42 (37.5)47 (38.8)
GG4 (3.6)7 (5.8)
Total112 (100)121 (100)
Allele
C174 (77.7)181 (74.8)0.465
G50 (22.3)61 (25.2)
STAT4 rs7574865
GG70 (62.5)66 (54.5)0.248
GT39 (34.8)47 (38.8)
TT3 (2.7)8 (6.6)
Total112 (100)121 (100)
Allele
G179 (79.9)179 (74.0)0.129
T45 (20.1)63 (26.0)
STAT4 rs7601754
AA72 (64.3)92 (76.0)0.030
AG33 (29.5)28 (23.1)
GG7 (6.3)1 (0.8)
Total112 (100)121 (100)
Allele
A177 (79.0)212 (87.6)0.013
G47 (21.0)30 (12.4)
STAT4 rs10168266
CC73 (65.2)78 (64.5)0.935
CT37 (33.0)40 (33.1)
TT2 (1.8)3 (2.5)
Total112 (100)121 (100)
Allele
C183 (81.7)196 (81.0)0.845
T41 (18.3)46 (19.0)
MS—multiple sclerosis; p-value—significance level. Bonferroni corrected the significance level when p < 0.0125 (0.05/4).
Table 7. Analysis of STAT4 variants using binary logistic regression in females with MS and the control groups.
ModelGenotype/AlleleOR (95% CI)p-ValueAIC
STAT4 rs10181656
Co-dominantCG vs. CC0.907 (0.530–1.553)0.907325.889
GG vs. CC0.580 (0.162–2.075)0.580
DominantCG+GG vs. CC0.865 (0.514–1.454)0.584324.358
RecessiveGG vs. CC+CG0.603 (0.172–2.119)0.430324.016
OverdominantCG vs. CC+GG0.945 (0.557–1.604)0.833324.614
AdditiveG0.845 (0.544–1.312)0.453324.094
STAT4 rs7574865
Co-dominantGT vs. GG0.782 (0.45501.345)0.374323.785
TT vs. GG0.354 (0.090–1.390)0.137
DominantGT+TT vs. GG0.720 (0.426–1.216)0.219323.141
RecessiveTT vs. GG+GT0.389 (0.101–1.504)0.171322.576
OverdominantGT vs. TT+GG0.841 (0.493–1.434)0.525324.255
AdditiveT0.704 (0.451–1.100)0.123322.247
STAT4 rs7601754
Co-dominantAG vs. AA1.506 (0.834–2.718)0.174319.089
AA vs. AA8.944 (1.076–74.358)0.043
DominantAG+GG vs. AA1.762 (0.998–3.113)0.051320.800
RecessiveGG vs. AA+AG8.000 (0.968–66.091)0.054318.944
OverdominantAG vs. AA+GG1.387 (0.772–2.493)0.274323.455
AdditiveG1.835 (1.116–3.017)0.017318.679
STAT4 rs10168266
Co-dominantCT vs. CC0.988 (0.571–1.712)0.967326.523
CC vs. CC0.712 (0.116–4.385)0.715
DominantCT+TT vs. CC0.969 (0.566–1.660)0.909324.646
RecessiveTT vs. CC+CT0.715 (0.117–4.361)0.716324.524
OverdominantCT vs. CC+TT0.999 (0.578–1.725)0.997324.659
AdditiveT0.950 (0.583–1.549)0.838324.617
MS—multiple sclerosis; OR—odds ratio; AIC—Akaike information criterion; p-value—significance level. Bonferroni corrected the significance level when p < 0.0125 (0.05/4).
Table 8. Genotype and allele distribution of the STAT4 variants in males with MS and the control groups.
PolymorphismMS, n (%)Control Group,
n (%)
p-Value
STAT4 rs10181656
CC56 (63.6)50 (63.3)0.316
CG31 (35.2)25 (31.6)
GG1 (1.1)4 (5.1)
Total88 (100)79 (100)
Allele
C143 (81.25)125 (79.1)0.625
G33 (18.75)33 (20.9)
STAT4 rs7574865
GG55 (62.5)52 (65.8)0.483
GT31 (35.2)23 (29.1)
TT2 (2.3)4 (5.1)
Total88 (100)79(100)
Allele
G141 (80.1)127 (80.4)0.951
T35 (19.9)31 (19.6)
STAT4 rs7601754
AA54 (61.4)61 (77.2)0.038
AG31 (35.2) 114 (17.7) 1
GG3 (3.4)4 (5.1)
Total88 (100)79 (100)
Allele
A139 (79.0)136 (86.1)0.089
G37 (21.0)22 (13.9)
STAT4 rs10168266
CC61 (69.3)55 (69.6)0.266
CT17 (19.3)20 (25.3)
TT10 (11.4)4 (5.1)
Total88 (100)79 (100)
Allele
C139 (79.0)130 (82.3)0.719
T37 (21.0)28 (17.7)
1 AG vs. AA+GG p = 0.011. MS—multiple sclerosis; p-value—significance level. Bonferroni corrected the significance level when p < 0.0125 (0.05/4).
Table 9. Analysis of STAT4 variants using binary logistic regression in males with MS and control groups.
ModelGenotype/AlleleOR (95% CI)p-ValueAIC
STAT4 rs10181656
Co-dominantCG vs. CC1.107 (0.578–2.122)0.759232.600
GG vs. CC0.223 (0.024–2.064)0.186
DominantCG+GG vs. CC0.985 (0.524–1.851)0.963233.024
RecessiveGG vs. CC+CG0.216 (0.024–1.970)0.174230.694
OverdominantCG vs. CC+GG1.175 (0.616–2.239)0.625232.786
AdditiveG0.867 (0.397–1.511)0.614232.772
STAT4 rs7574865
Co-dominantGT vs. GG1.274 (0.659–2.464)0.471233.558
TT vs. GG0.473 (0.083–2.691)0.398
DominantGT+TT vs. GG1.156 (0.613–2.179)0.655232.826
RecessiveTT vs. GG+GT0.436 (0.078–2.448)0.346232.079
OverdominantGT vs. TT+GG1.324 (0.689–2.545)0.400232.313
AdditiveT1.017 (0.590–1.754)0.951233.022
STAT4 rs7601754
Co-dominantAG vs. AA2.501 (1.206–5.189)0.014228.357
AA vs. AA0.847 (0.181–3.956)0.833
DominantAG+GG vs. AA2.134 (1.082–4.206)0.029228.081
RecessiveGG vs. AA+AG0.662 (0.143–3.053)0.597232.742
OverdominantAG vs. AA+GG2.525 (1.224–5.211)0.012226.402
AdditiveG1.597 (0.907–2.812)0.105230.295
STAT4 rs10168266
Co-dominantCT vs. CC0.766 (0.365–1.610)0.482232.301
CC vs. CC2.254 (0.669–7.600)0.190
DominantCT+TT vs. CC1.014 (0.524–1.962)0.966233.024
RecessiveTT vs. CC+CT2.404 (0.723–7.998)0.153230.796
OverdominantCT vs. CC+TT0.706 (0.339–1.470)0.353232.158
AdditiveT1.178 (0.728–1.907)0.504232.576
MS—multiple sclerosis; OR—odds ratio; AIC—Akaike information criterion; p-value—significance level. Bonferroni corrected the significance level when p < 0.0125 (0.05/4). Note: Significant results are indicated in bold.
Table 10. Genotype and allele distribution of the STAT4 variants in patients younger than 37 years with MS and the control groups.
PolymorphismMS, n (%)Control Group,
n (%)
p-Value
STAT4 rs10181656
CC58 (61.1)62 (54.9)0.302
CG35 (36.8)44 (38.9)
GG2 (2.1)7 (6.2)
Total95 (100)113 (100)
Allele
C151 (79.5)168 (74.3)0.217
G39 (20.5)58 (25.7)
STAT4 rs7574865
GG60 (63.2)64 (56.6)0.217
GT33 (34.7)41 (36.3)
TT2 (2.1)8 (7.1)
Total95 (100)113 (100)
Allele
G153 (80.5)169 (74.8)0.148
T37 (19.5)57 (25.2)
STAT4 rs7601754
AA61 (64.2)87 (77.0)0.127
AG31 (32.6)24 (21.2)
GG3 (3.2)2 (1.8)
Total95 (100)113 (100)
Allele
A153 (80.5)198 (87.6)0.047
G37 (19.5)28 (10.4)
STAT4 rs10168266
CC64 (67.4)74 (65.5)0.741
CT27 (28.4)36 (31.9)
TT4 (4.2)3 (2.7)
Total95 (100)113 (100)
Allele
C155 (81.6)184 (81.4)0.966
T35 (18.4)42 (18.6)
MS—multiple sclerosis; p-value—significance level. Bonferroni corrected the significance level when p < 0.0125 (0.05/4).
Table 11. Analysis of STAT4 variants using binary logistic regression in patients younger than 37 years with MS and control groups.
ModelGenotype/AlleleOR (95% CI)p-ValueAIC
STAT4 rs10181656
Co-dominantCG vs. CC0.850 (0.481–1.504)0.577288.246
GG vs. CC0.305 (0.061–1.531)0.149
DominantCG+GG vs. CC0.776 (0.445–1.350)0.369287.979
RecessiveGG vs. CC+CG0.326 (0.066–1.606)0.168286.557
OverdominantCG vs. CC+GG0.915 (0.521–1.606)0.756288.693
AdditiveG0.733 (0.454–1.184)0.204287.153
STAT4 rs7574865
Co-dominantGT vs. GG0.859 (0.482–1.530)0.605287.499
TT vs. GG0.267 (0.054–1.306)0.103
DominantGT+TT vs. GG0.762 (0.436–1.332)0.340287.876
RecessiveTT vs. GG+GT0.282 (0.058–1.363)0.115285.767
OverdominantGT vs. TT+GG0.935 (0.528–1.654)0.817288.736
AdditiveT0.712 (0.443–1.145)0.161286.787
STAT4 rs7601754
Co-dominantAG vs. AA1.842 (0.986–3.443)0.056286.663
AA vs. AA2.139 (0.347–13.189)0.413
DominantAG+GG vs. AA1.865 (1.017–3.421)0.044284.688
RecessiveGG vs. AA+AG1.810 (0.296–11.063)0.521288.367
OverdominantAG vs. AA+GG1.796 (0.964–3.346)0.065285.353
AdditiveG1.721 (1.001–2.961)0.050284.844
STAT4 rs10168266
Co-dominantCT vs. CC0.867 (0.476–1.581)0.642288.190
CC vs. CC1.542 (0.333–7.147)0.580
DominantCT+TT vs. CC0.919 (0.515–1.639)0.775288.708
RecessiveTT vs. CC+CT1.612 (0.352–7.388)0.539288.407
OverdominantCT vs. CC+TT0.849 (0.468–1.541)0.591288.500
AdditiveT0.989 (0.601–1.627)0.966288.788
MS—multiple sclerosis; OR—odds ratio; AIC—Akaike information criterion; p-value—significance level. Bonferroni corrected the significance level when p < 0.0125 (0.05/4).
Table 12. Genotype and allele distribution of the STAT4 variants in patients older than 37 years with MS and the control groups.
PolymorphismMS, n (%)Control Group,
n (%)
p-Value
STAT4 rs10181656
CC64 (61.0)55 (63.2)0.720
CG38 (36.2)28 (32.2)
GG3 (2.9)4 (4.6)
Total105 (100)87 (100)
Allele
C166 (79.0)138 (79.3)0.950
G44 (21.0)36 (20.7)
STAT4 rs7574865
GG65 (61.9)54 (62.1)0.800
GT37 (35.2)29 (33.3)
TT3 (2.9)4 (4.6)
Total105 (100)87 (100)
Allele
G167 (79.5)137 (78.7)0.850
T43 (20.5)37 (21.3)
STAT4 rs7601754
AA65 (61.9)66 (75.9)0.112
AG33 (31.4)18 (20.7)
GG7 (6.7)3 (3.4)
Total105 (100)87 (100)
Allele
A163 (77.6)150 (86.2)0.031
G47 (22.4)24 (13.8)
STAT4 rs10168266
CC70 (66.7)59 (67.8)0.681
CT27 (25.7)24 (27.6)
TT8 (7.6)4 (4.6)
Total105 (100)87 (100)
Allele
C167 (79.5)142 (81.6)0.608
T43 (20.5)32 (18.4)
MS—multiple sclerosis; p-value—significance level. Bonferroni corrected the significance level when p < 0.0125 (0.05/4).
Table 13. Analysis of STAT4 variants using binary logistic regression in older-than-37-years patients with MS and control groups.
ModelGenotype/AlleleOR (95% CI)p-ValueAIC
STAT4 rs10181656
Co-dominantCG vs. CC1.166 (0.636–2.140)0.619267.823
GG vs. CC0.645 (0.138–3.006)0.576
DominantCG+GG vs. CC1.101 (0.613–1.979)0.747266.375
RecessiveGG vs. CC+CG0.610 (0.133–2.804)0.526266.070
OverdominantCG vs. CC+GG1.195 (0.655–2.179)0.561266.139
AdditiveG1.017 (0.613–1.686)0.949266.474
STAT4 rs7574865
Co-dominantGT vs. GG1.060 (0.579–1.942)0.851266.035
TT vs. GG0.623 (0.134–2.906)0.547
DominantGT+TT vs. GG1.007 (0.56101.808)0.981266.478
RecessiveTT vs. GG+GT0.610 (0.133–2.804)0.526266.070
OverdominantGT vs. TT+GG1.088 (0.598–1.981)0.782266.402
AdditiveT0.951 (0.574–1.576)0.847266.441
STAT4 rs7601754
Co-dominantAG vs. AA1.862 (0.954–3.633)0.069264.038
AA vs. AA2.369 (0.587–9.562)0.226
DominantAG+GG vs. AA1.934 (1.031–3.630)0.040262.143
RecessiveGG vs. AA+AG2.000 (0.501–7.978)0.326265.445
OverdominantAG vs. AA+GG1.757 (0.906–3.408)0.095263.627
AdditiveG1.705 (1.014–2.868)0.044262.205
STAT4 rs10168266
Co-dominantCT vs. CC0.948 (0.495–1.816)0.873267.694
CC vs. CC1.686 (0.483–5.879)0.413
DominantCT+TT vs. CC1.054 (0.575–1.931)0.866266.450
RecessiveTT vs. CC+CT1.711 (0.497–5.887)0.394265.719
OverdominantCT vs. CC+TT0.909 (0.378–1.727)0.770266.393
AdditiveT1.122 (0.698–1.804)0.633266.250
MS—multiple sclerosis; OR—odds ratio; AIC—Akaike information criterion; p-value—significance level. Bonferroni corrected the significance level when p < 0.0125 (0.05/4).
Disclaimer/Publisher’s Note: The statements, opinions and data contained in all publications are solely those of the individual author(s) and contributor(s) and not of MDPI and/or the editor(s). MDPI and/or the editor(s) disclaim responsibility for any injury to people or property resulting from any ideas, methods, instructions or products referred to in the content.

