Article

Application of a Daily Crop Water Stress Index to Deficit Irrigate Malbec Grapevine under Semi-Arid Conditions

by
Krista C. Shellie
1 and
Bradley A. King
2,*
1
USDA-ARS Horticultural Crops Research Unit (retired), Corvallis, OR 97330, USA
2
USDA-ARS Northwest Irrigation and Soils Research Laboratory, Kimberly, ID 83341, USA
*
Author to whom correspondence should be addressed.
Agriculture 2020, 10(11), 492; https://doi.org/10.3390/agriculture10110492
Submission received: 10 September 2020 / Revised: 15 October 2020 / Accepted: 19 October 2020 / Published: 22 October 2020
(This article belongs to the Special Issue Precision Viticulture and Enology: Technologies and Applications)

Abstract

:
Precision irrigation of wine grape is hindered by the lack of an automated method for monitoring vine water status. The objectives of this study were to: Validate an automated model for remote calculation of a daily crop water stress index (CWSI) for the wine grape (Vitis vinifera L.) cultivar Malbec and evaluate its suitability for use in irrigation scheduling. Vines were supplied weekly with different percentages of evapotranspiration-based estimated water demand (ETc) over four growing seasons. In the fifth growing season, different daily CWSI threshold values were used to trigger an irrigation event that supplied 28 mm of water. All three indicators of vine water status (CWSI, midday leaf water potential (Ψlmd), and juice carbon isotope ratio (δ13C)) detected an increase in stress severity as the irrigation amount decreased. When the irrigation amount decreased from 100% to 50% ETc, 70% to 35% ETc, or the daily CWSI threshold value increased from 0.4 to 0.6, berry fresh weight and juice titratable acidity decreased, juice δ13C increased, the weekly CWSI increased, and Ψlmd decreased. Under the semi-arid conditions of this study, utilizing a daily CWSI threshold for irrigation scheduling reduced the irrigation amount without compromising the yield or changes in berry composition and remotely provided automated decision support for managing water stress severity in grapevine.

1. Introduction

Many New and Old World wine grape (Vitis vinifera L.) production regions are in climate zones that have a limited amount of available soil moisture during the growing season and irrigation can be used as a management tool to maintain vine balance [1], induce beneficial changes in berry composition [2], and increase water productivity [3,4,5]. Decisions about when to irrigate and how much water to supply during an irrigation event ultimately influence input costs, yield, and fruit quality. Currently available tools for irrigation decision-making such as soil moisture or water potential and estimated vine water demand (ETc) [6], are either not amenable to automation or have a low spatial and/or temporal resolution that limits their practical use on a commercial scale. Since a mild amount of water stress is usually desirable in wine grape production, the amount of water supplied during an irrigation event is usually a fraction of ETc. The lack of a rapid, automated method for monitoring vine water status between irrigation events limits the ability of vineyard managers to maintain a desired, consistent level of water stress severity in the grapevine during berry development.
Infrared thermometry has been used successfully to monitor vine canopy temperature under field conditions and has been found to be responsive to irrigation events [7,8,9,10,11]. However, a canopy-surface-temperature-based empirical crop water stress index (CWSI) for quantifying plant water status, developed by [12], has had limited use in grapevine due to the difficulty of determining upper and lower temperature threshold values for non-transpiring and fully transpiring vines. The objectives of this study were to: Validate an automated model for remote calculation of a daily CWSI for the wine grape (Vitis vinifera L.) cultivar Malbec and evaluate its suitability for use in irrigation scheduling.
The CWSI is defined as:
C W S I = T c     T L L T U L     T L L
where Tc (°C) is the measured temperature of fully sunlit canopy leaves. The temperatures TUL (°C) and TLL (°C) are the maximum and minimum temperature of fully sunlit canopy leaves when transpiration is severely restricted (non-transpiring) and unrestricted (fully transpiring), respectively. The values of TUL and TLL need to reflect the environmental conditions (air temperature (Ta), relative humidity (RH), radiation (Rs), wind speed (WS), etc.) present at the time of Tc measurement because, in addition to soil moisture, leaf temperature is affected by WS, Rs, and vapor pressure deficit (VPD) [9]. The TUL and TLL temperatures are the lower and upper baselines used to normalize the CWSI for effects of environmental conditions on Tc. When TUL and TLL are accurate for the crop and the environment, the CWSI value ranges from 0 under a well-watered condition to 1 under a non-transpiring, water-stressed condition.
Since the direct measurement of TLL and TUL are not practical in production agriculture due to the inconvenience of maintaining unrestricted transpiration (well-watered) plots and inability to maintain a canopy in non-transpiring condition, numerous methods of estimation have been investigated. The physical models developed to estimate TLL and TUL [13,14] used ancillary measurements to reliably estimate equation parameters. Artificial wet and dry reference surfaces have been used [7,15,16,17,18,19,20]; however, their required routine maintenance limits their practical use in commercial crop production.
Various empirical methods have also been used to estimate TLL and TUL. Payero and Irmak [21] used multiple linear regression (MLR) with independent variables Ta, Rs, crop height, WS, and VPD or RH to predict the TcTLL of well-watered corn and soybean and obtained correlation coefficients of 0.69–0.84 between the predicted and measured canopy temperature. However, King and Shellie [22] found that an artificial neural network (ANN) obtained a more accurate estimate of TLL for wine grape than MLR.
Measurements of TUL are difficult to obtain because of the challenge of maintaining a crop canopy in a non-transpiring condition. In research studies, non-transpiring leaves have been simulated by coating them with Vaseline to block transpiration [16,23,24], which is not practical in production agriculture. Most studies have either used severely deficit-irrigated plants to estimate TUL as a constant by measuring the maximum TcTa [19,22,25] or have developed an empirical model to estimate TULTa [10,11]. A TUL constant of 4.6–5.1 °C above Ta has been used for water-stressed corn [25], and 5.0 °C above Ta has been used for other crops [7,15,26]. A TUL constant of 5.0 °C above daily maximum Ta has been used for soybean and cotton [19].
Using a constant value for TULTa introduces an error into the calculation of the CWSI when actual Rs is less than when TULTa was determined, as may occur under cloudy, overcast conditions or at northern latitudes, where Rs decreases as the growing season progresses. Under these situations, the calculated CWSI values would be underestimated due to a too large denominator in Equation (1). To account for this influence of Rs and eliminate a need for deficit-irrigated plots to estimate TULTa, O’Toole and Real [27] modified the canopy energy balance equation of [13] for TcTa as a linear function of vapor pressure deficit (VPD) to allow an estimate of average aerodynamic resistance (ra). Measured well-watered canopy temperatures for measured climatic conditions (net radiation, Ta, RH, WS) under full transpiration were used to estimate ra. The non-transpiring canopy temperature equation of Jackson et al. [13] was used to estimate TULTa as:
T U L T a = r a R n ρ C p
where Rn (W m−2) is the average net radiation, ρ is the average density of air (kg m−3), and Cp is the average heat capacity of air (J kg−1 °C−1) for the time of day CWSI is desired. Han et al. [28] used this equation to estimate TUL for the calculation of a CWSI adjusted soil water balance for water-stressed maize with good results. This approach of O’Toole and Real [27] has not been used to calculate a CWSI for wine grape. Additionally, the relationship between CWSI values, other indicators of grapevine water status, yield components, and berry composition at maturity has not been evaluated. In this study, we remotely measured field environmental conditions and vine canopy temperature to estimate TUL using the approach of O’Toole and Real [27] and TLL using the approach of King and Shellie [22] in real-time and used these values to calculate a daily CWSI for the wine grape cultivar Malbec. We evaluated the suitability of its use in irrigation scheduling by relating daily CWSI values to the available soil moisture, leaf water potential, yield, and berry composition.

2. Materials and Methods

2.1. Trial Site and Experimental Design

The study was conducted during the 2014, 2015, 2016, 2018, and 2019 growing seasons at a field trial site located at the University of Idaho Parma Research and Extension Center in Parma, ID (lat. 43° 37′ 7.9716🠲N, long. 116° 12′ 54.1🠲W, 750 m asl). The soil (sandy loam, available water-holding capacity of 0.14 cm/cm soil), climatic conditions (semi-arid, dry steppe with warmest monthly average temperature of 32 °C), and irrigation water supply (well water with sand media filter) at the location were well-suited for conducting deficit irrigation field research. The wine grape cultivar Malbec was planted as un-grafted, dormant-rooted cuttings in 2007. The row by vine spacing (2.4 × 1.8 m), training and trellis system (double-trunked, bilateral cordon, spur-pruned annually to 16 buds/m of cordon, vertical shoot positioned on a two-wire trellis with moveable wind wires), disease and pest control followed local commercial practices. Alley and vine rows were maintained free of vegetation.
The irrigation system provided an independent irrigation scheduling for each irrigation treatment amount in a randomized block design with six replicate blocks and independent irrigation water supply to border vines located in the trial perimeter. Each water supply manifold was equipped with a programmable solenoid, a flow meter (to measure the delivered irrigation amount), a pressure regulator and a pressure gauge (to monitor delivery uniformity). Above ground drip tubing with an emitter spacing of 90 cm and delivery rate of 60 mL/min was used to supply irrigation water to the vines.
Treatment plots contained three adjacent vine rows with six vines per row (18 vines per plot). The vines located in the outer rows of each plot were considered buffers and data were collected on interior vines in the center row. In the first four study years, irrigation treatment amounts were evapotranspiration-based and applied weekly from fruit set until harvest with 70% or 35% of ETc in 2014, 2015, and 2016 and with 50% or 100% ETc in 2018. In 2014, 2015, and 2016, each replicate block was applied the same irrigation treatment in each subsequent year and border vines located on the trial perimeter were maintained under well-watered conditions by supplying >100% ETc. Weekly ETc was calculated by multiplying the value for alfalfa reference ETr, acquired from a weather station located within 3 km of the study site (http://www.usbr.gov/pn/agrimet/wxdata.html), by Kc that increased during the growing season from 0.3 to 0.7 [6,29]. In 2019, different daily CWSI threshold values (0.3, 0.4, 0.5, or 0.6) were used to trigger an irrigation event of 28 mm. Each year, all plots were irrigated to field capacity prior to bud break and there were no subsequent irrigations until the irrigation treatments were initiated after fruit set, when berries were ~7 mm in diameter and vines were at growth stage 31 of the modified E-L grapevine growth stage system [30].

2.2. Canopy and Environmental Measurements

Canopy temperature was measured using infrared radiometers (SI-121, Apogee Instruments, Logan, UT, USA) with a 36° field of view. One radiometer was used in each of two replicates of each irrigation treatment in 2014, 2015, 2016, and 2018 and one radiometer was used in four replicates of the irrigation treatments in 2019. The radiometers were positioned approximately 15 to 30 cm above the fully expanded leaves located at the top of the vine canopy and pointed northeasterly at approximately 45° from nadir with the sensor view aimed at the center of solar noon sunlit leaves. The measured canopy area received full sunlight exposure during midday. The temperature sensing area was approximately 10 to 20 cm in diameter. The possibility of bare soil visibility in the background was limited by leaf layers within the canopy below the measured canopy location. The infrared radiometer sensor view was periodically checked and adjusted as necessary to ensure that the field of view concentrated on sunlit leaves near the top of the canopy. Climatic parameters Rs (SP-110 pyranometer, Apogee Instruments, Logan, UT, USA), Ta, RH (HMP50 temperature and humidity probe, Campbell Scientific, Logan, UT, USA), and WS (05305 anemometer, R. M. Young, Traverse City, MI, USA) were measured within the study vineyard at a height of 2 m. Net radiation was measured using net radiometers (Q-7.1, Radiation and Energy Balance System, Inc., Bellevue, WA, USA) at 3 m height and directly below the canopy centered in the vine row in two irrigation treatment plots in 2018 and 2019. Canopy temperature and climatic parameters were measured every minute by a data logger (CR1000 or CR6, Campbell Scientific, Logan, UT, USA) and recorded as 15-min averages. The equipment was installed after fruit set, usually mid to late June and removed prior to harvest, usually mid to late September.

2.3. CWSI Calculation

Daily CWSI was calculated as the average of 15-min CWSI values between 13:00 and 15:00 MST, which corresponds to ±90 min of solar noon at the experimental site. The well-watered canopy temperature (TLL) was calculated using a neural network model and cultivar-specific database as described by King and Shellie [22,31]. The method of O’Toole and Real [27] was used to estimate average ra (Equation (2)) based on the well-watered data set for Malbec used by King and Shellie [31]. Equation (2) was used to estimate TLL based on the measured 15-min average environmental conditions. A linear relationship between the measured Rn and Sr was Rn = 0.9*Sr − 60 with an R2 = 0.95 between 13:00 and 15:00 MDT and was used to estimate the 15-min Rn needed in Equation (2). Using the method of O’Toole and Real [27], ra was 14.5 s m−1 between the hours of 13:00 and 15:00 MDT when averaged over the irrigation seasons of 2014, 2015, 2016. Canopy temperature and environmental conditions were collected in real-time using a wireless network between data loggers and a master data logger with a cellular modem for remote data collection (CR1000, CR6, RF401A and Raven XT modem, Campbell Scientific, Inc. Logan, UT, USA). The wireless data network was used in 2019 to remotely daily measure field conditions and daily calculate a CWSI for irrigation scheduling.

2.4. Soil Water Measurement

In 2018, the soil water content was monitored in 10 cm depth increments to a total depth of 120 cm using a capacitance-based soil moisture sensor (Drill and Drop, Sentek Inc., Stepney, Australia) in two replicates of each irrigation treatment. The sensors were installed within 8 to 12 cm of a drip irrigation system emitter located within 45 cm of a vine. The field capacity (FC) of each 10 cm depth increment was estimated based on the maximum soil water content measured over the season and the soil texture observed during probe installation. The permanent wilting point (PWP) of each 10 cm depth increment was estimated primarily based on soil texture and secondarily on minimum soil water content measured during the season. The depth of available soil water (ASW) was computed as the difference between the measured soil water content and PWP multiplied by the 10 cm depth increment summed over the 120 cm measurement depth. The fraction of available soil water was calculated as the depth of ASW divided by the depth of ASW for the 120 cm soil profile at FC.

2.5. Vine Water Status

Weekly vine water status was monitored by measuring leaf water potential at midday (Ψlmd) on the sixth day after a weekly irrigation event using a pressure chamber (model 610; PMS Instruments; Corvallis, OR, USA) as described by Shellie [5]. Seasonal vine water stress was measured by determining the photosynthetic carbon isotope composition (δ13C) of the juice at harvest using isotope-ratio mass spectrometry at the Stable Isotope Facility (UC Davis, University of California Davis, CA, USA) following the method of Herrero-Langreo et al. [32].

2.6. Yield Components and Berry Composition

Fruits were harvested when a composite sample of randomly collected clusters had a target soluble solid concentration (SS) of ~24% and a juice titratable acidity (TA) of 4 to 6 g/L. All plots were harvested on the same day. On the day of harvest, a basal cluster was removed from either side of two main shoots from two data vines located in the center of each plot. The sampled clusters were immediately placed into a cooler and transported to the lab. The remaining clusters on each data vine were counted as they were removed from the vine and their weight was added to the weight of sampled clusters to determine the yield per vine. Sampled clusters were individually weighed and then subsampled to obtain 100 berries for determining average berry weight. The 100 berry subsamples were stored at −80 °C for analysis of total berry anthocyanins following the method of Iland et al. [33], and for δ13C analysis. The remaining berries from the eight-cluster sample were used to measure the juice SS, pH, and TA following the methods of Iland et al. [33] using equipment previously described by Shellie [34]. The same vines harvested for yield and berry measurements were pruned to two bud spurs during dormancy and pruned canes from each vine were weighed. The ratio of yield to pruning weight (Ravaz index) was calculated as an indicator of vine balance. Seasonal cumulative growing degree days (GDD) were calculated from daily maximum (no upper limit) and minimum temperatures from 1 April to 31 October using a base threshold of 10 °C. Temperature data were obtained from the same weather station used for obtaining ETr.

2.7. Statistical Analysis

An average weekly CWSI was calculated from daily CWSI values. Seasonal average weekly CWSI and Ψlmd values and other measured attributes at harvest were analyzed using a mixed model analysis of variance (SAS version 8.02; SAS Institute, Cary, NC, USA). Year and irrigation amount were the main effects in 2014, 2015, and 2016 with years treated as a repeated measure. The main effect in 2018 was irrigation amount and in 2019 was the daily CWSI threshold value. The probability of a significant difference (p ≤ 0.05) among treatment levels for a significant main effect was determined using the Tukey-Kramer adjusted t-test. The significance of interaction effects was determined using LSMEANS at p ≤ 0.05. Graphs presented in figures were generated using Sigmaplot 13.0 (Systat Software, San Jose, CA, USA).

3. Results

3.1. Environmental Conditions and Irrigation Amounts

In each year of the 5-year study, the daily average total direct solar radiation and the number of days when the maximum air temperature was greater than 35 °C were within one standard deviation of the 20-year site average (Table 1). Precipitation was similar to the site average in 2014, 2015, and 2016, below the site average in 2018, and above the site average in 2019. The above normal precipitation in 2019 occurred prior to 15 June and the start of the irrigation treatments. The growing degree day accumulation was similar to the site average in all years except in 2015, when it was higher than the site average. Alfalfa-based reference evapotranspiration (ETr) exceeded the 20-year average in 2014, 2016, and 2018 and was similar to the site average in 2015 and 2019.
Well-watered vines in the trial perimeter were provided ~45% of ETr in 2014 and 2015 and ~87% of ETr in 2016 (Table 1). In 2014, 2015, and 2016, vines irrigated at 70% and 35% ETc were supplied, respectively, with ~20% and 10% of ETr. In 2018, vines irrigated at 100% and 50% ETc were supplied 23% and 8% of ETr. Water supplied to the CWSI driven irrigation treatments in 2019 ranged from 18% to 5% of ETr. The three-year average amount of water supplied to vines under 35% ETc was ~44% less than vines that were under 70% ETc. In 2018, vines under 50% ETc were supplied ~65% less water than vines under 100% ETc. In 2019, as the maximum CWSI threshold increased by 0.1 from 0.3 to 0.6, the amount of water supplied to vines decreased ~26%, 14%, and 54%, respectively.

3.2. Indicators of Water Stress

In each study year, the daily CWSI decreased after an irrigation event and increased daily during the period between irrigation events (Figure 1, Figure 2 and Figure 3). The amount of decrease and rate of increase in the CWSI corresponded inversely with the irrigation amount. In each study year, the irrigation treatment that supplied the least amount of water had the highest daily CWSI. The CWSI of well-watered vines (Figure 1) and vines under 100% ETc (Figure 2) was close to zero much of the season. In 2018, the fraction of ASW was inversely related to the CWSI throughout the season and, for the 100% ETc treatment remained above 0.8 for most of the season (Figure 2). When irrigation ceased after day of year 248, the CWSI of the 100% ETc treatment steadily increased while the fraction of ASW rapidly decreased. The daily CWSI of the 50% ETc treatment ranged between 0.1 and 0.7 in response to irrigation. The fraction of ASW of the 50% ETc treatment ranged from 0.85 to 0.55 in response to irrigation events and varied inversely with the daily CWSI. After irrigation ceased on day of year 248, the fraction of ASW of the 50% ETc treatment rapidly decreased and the daily CWSI remained above 0.7. In 2019, irrigation frequency decreased as the CWSI level to trigger irrigation increased (Figure 3). Maximum daily CWSI values for the 0.3 and 0.4 threshold treatments were often similar because the change in CWSI between consecutive days was generally greater than 0.1 and increased well beyond the irrigation threshold. Despite this outcome, the irrigation application differed by 51 mm (Table 1), or effectively two irrigations less for the 0.4 threshold treatment. The timing of the first irrigation was increasingly delayed as the CWSI threshold value increased.
The values of all three indicators (CWSI, Ψlmd, and δ13C) showed that water stress severity corresponded inversely with the irrigation amount (Table 2). In 2014, 2015, and 2016, a decrease in the irrigation amount from 70% to 35% ETc was associated with an average increase in the average weekly CWSI from 0.09 to 0.31, decrease in Ψlmd from −1.20 to −1.29 MPa, increase in δ13C from −25.78 to −24.09, and an ~10% decrease in berry fresh weight. In 2018, a decrease in the irrigation amount from 100% to 50% ETc was associated with an average increase in the average weekly CWSI from 0.08 to 0.42, decrease in Ψlmd from −0.80 to −1.29 MPa, increase in δ13C from −26.98 to −24.61, and an ~21% decrease in berry fresh weight. In 2019, increasing the maximum daily CWSI threshold from 0.3 to 0.4 had no detectable influence on the average weekly CWSI or berry fresh weight, but was associated with a decrease in Ψlmd from −1.00 to −1.18 MPa and an increase in δ13C from −26.32 to −25.56. Each sequential increase in the maximum daily CWSI threshold from 0.4 to 0.6 was associated with an increase in average weekly CWSI, decrease in Ψlmd, and decrease in berry fresh weight.

3.3. Relationship among Water Stress Indicators

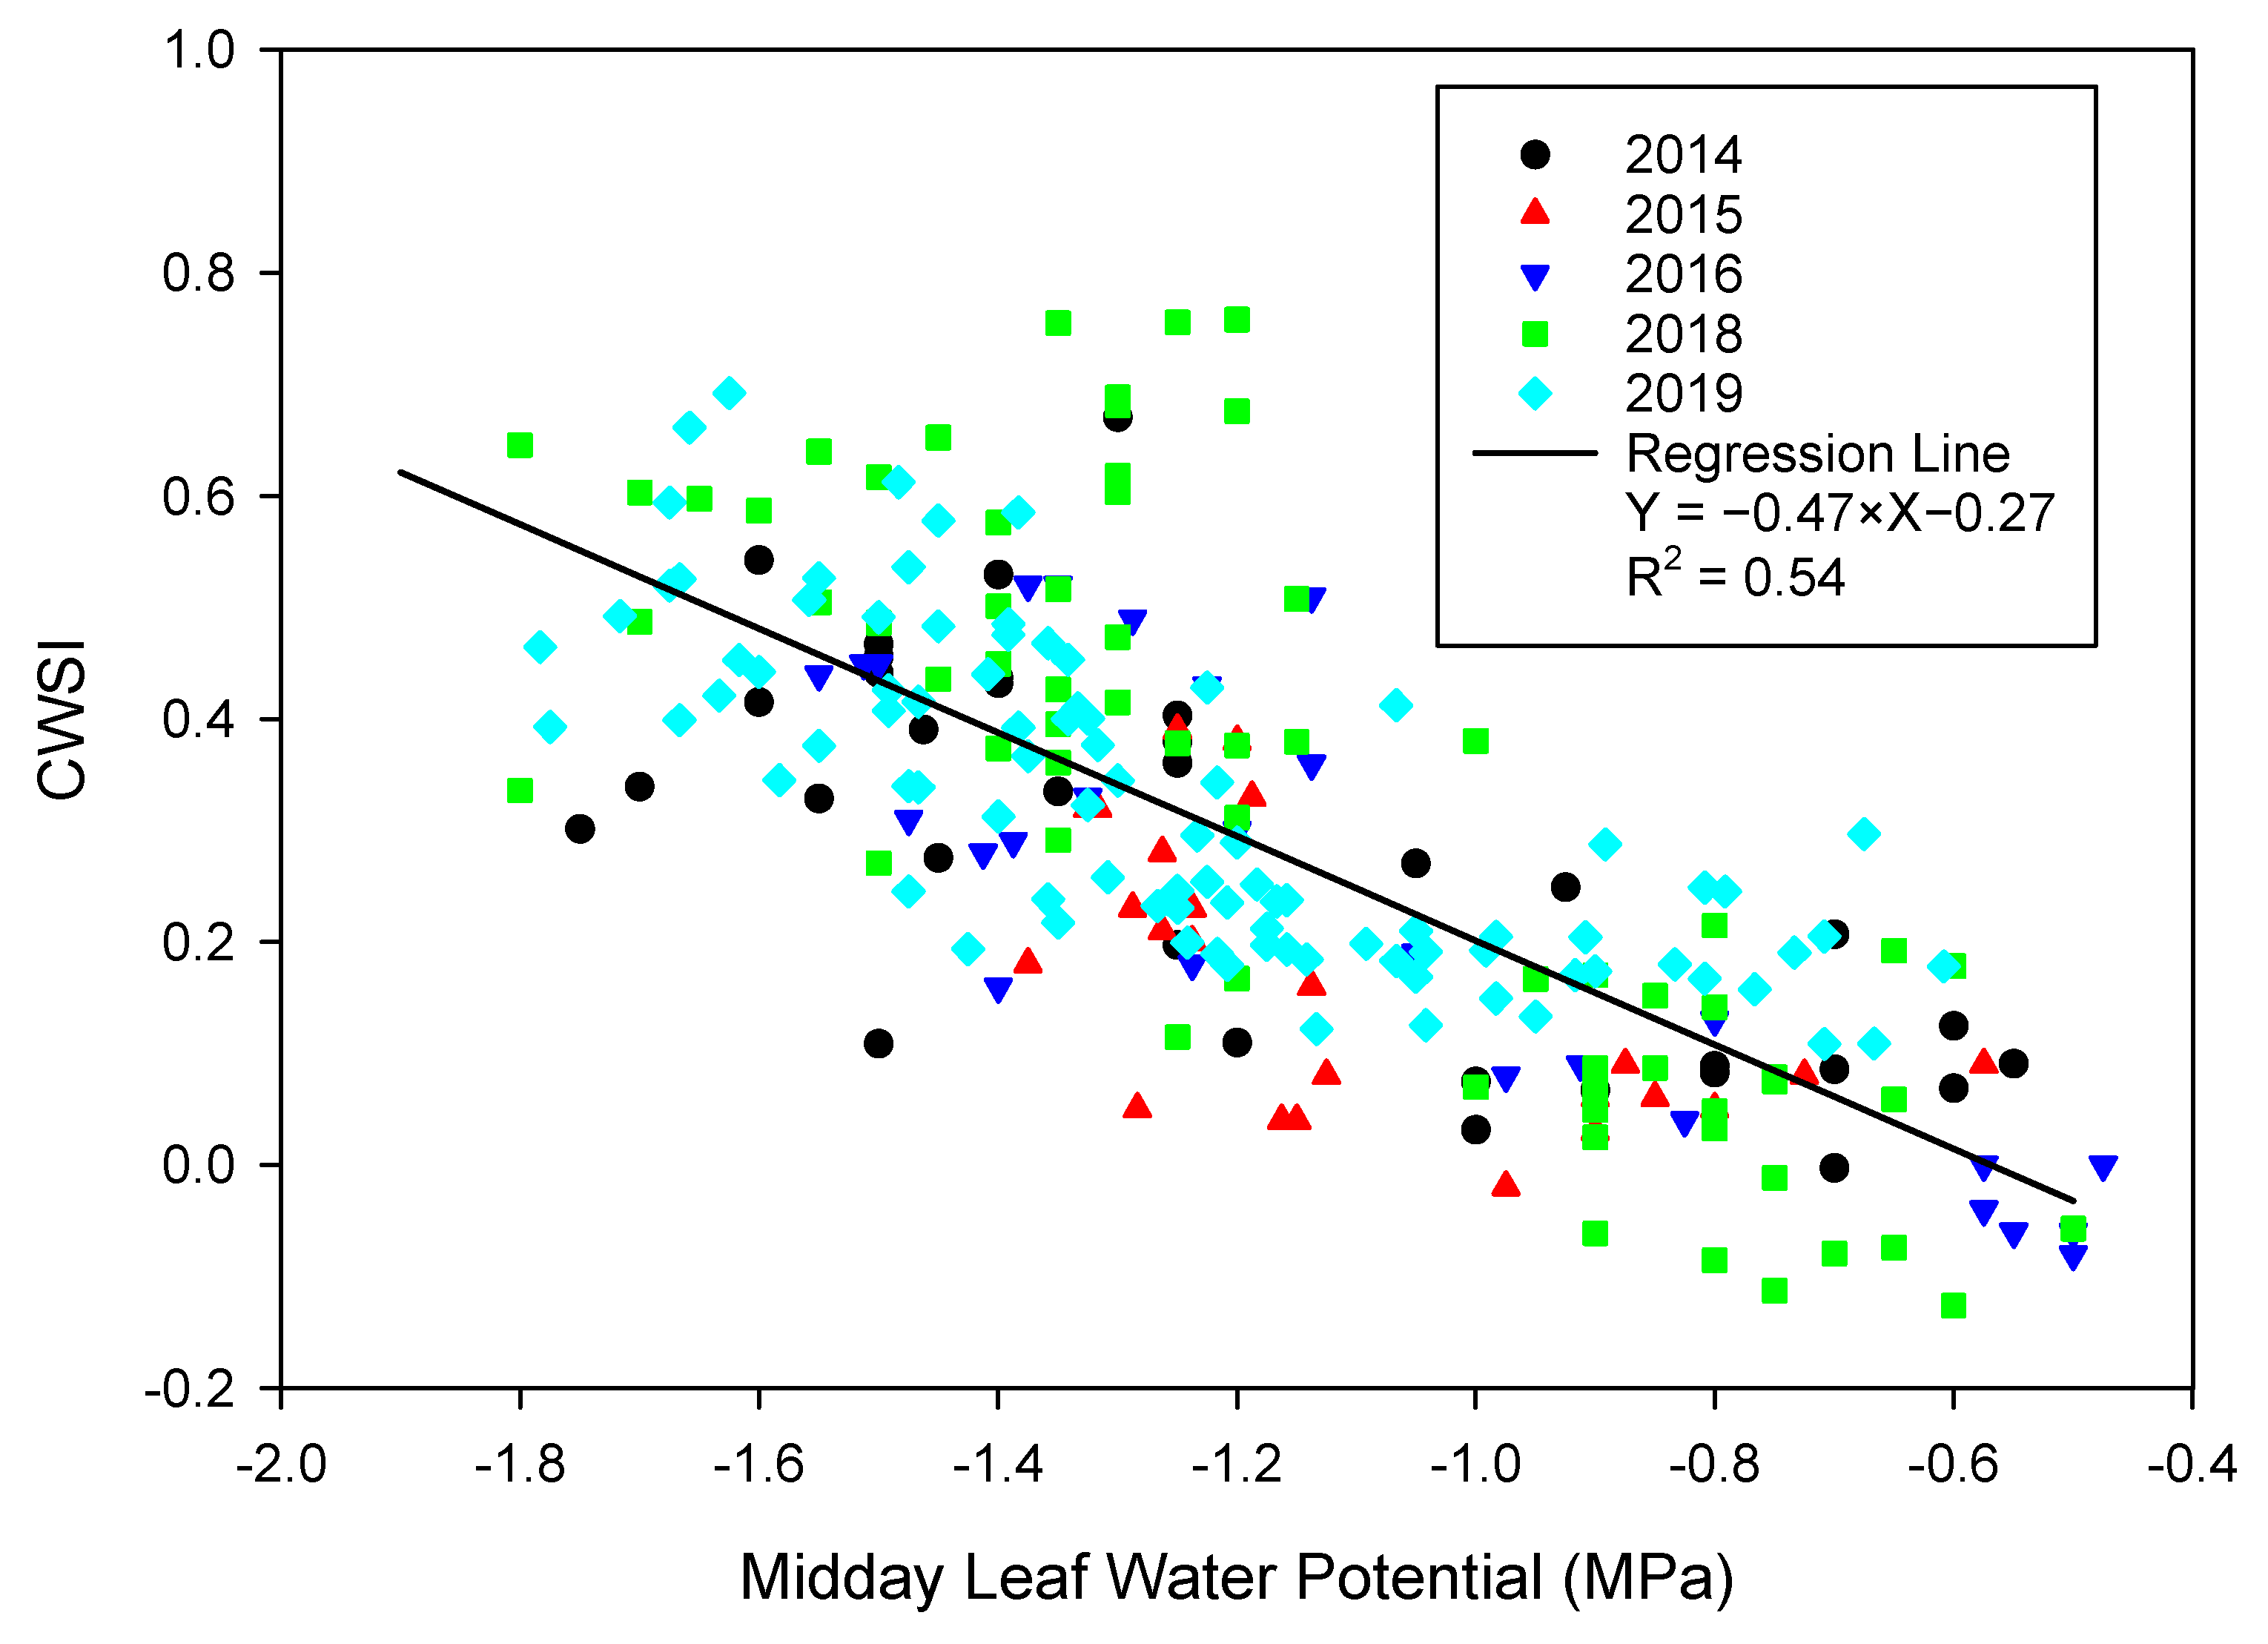
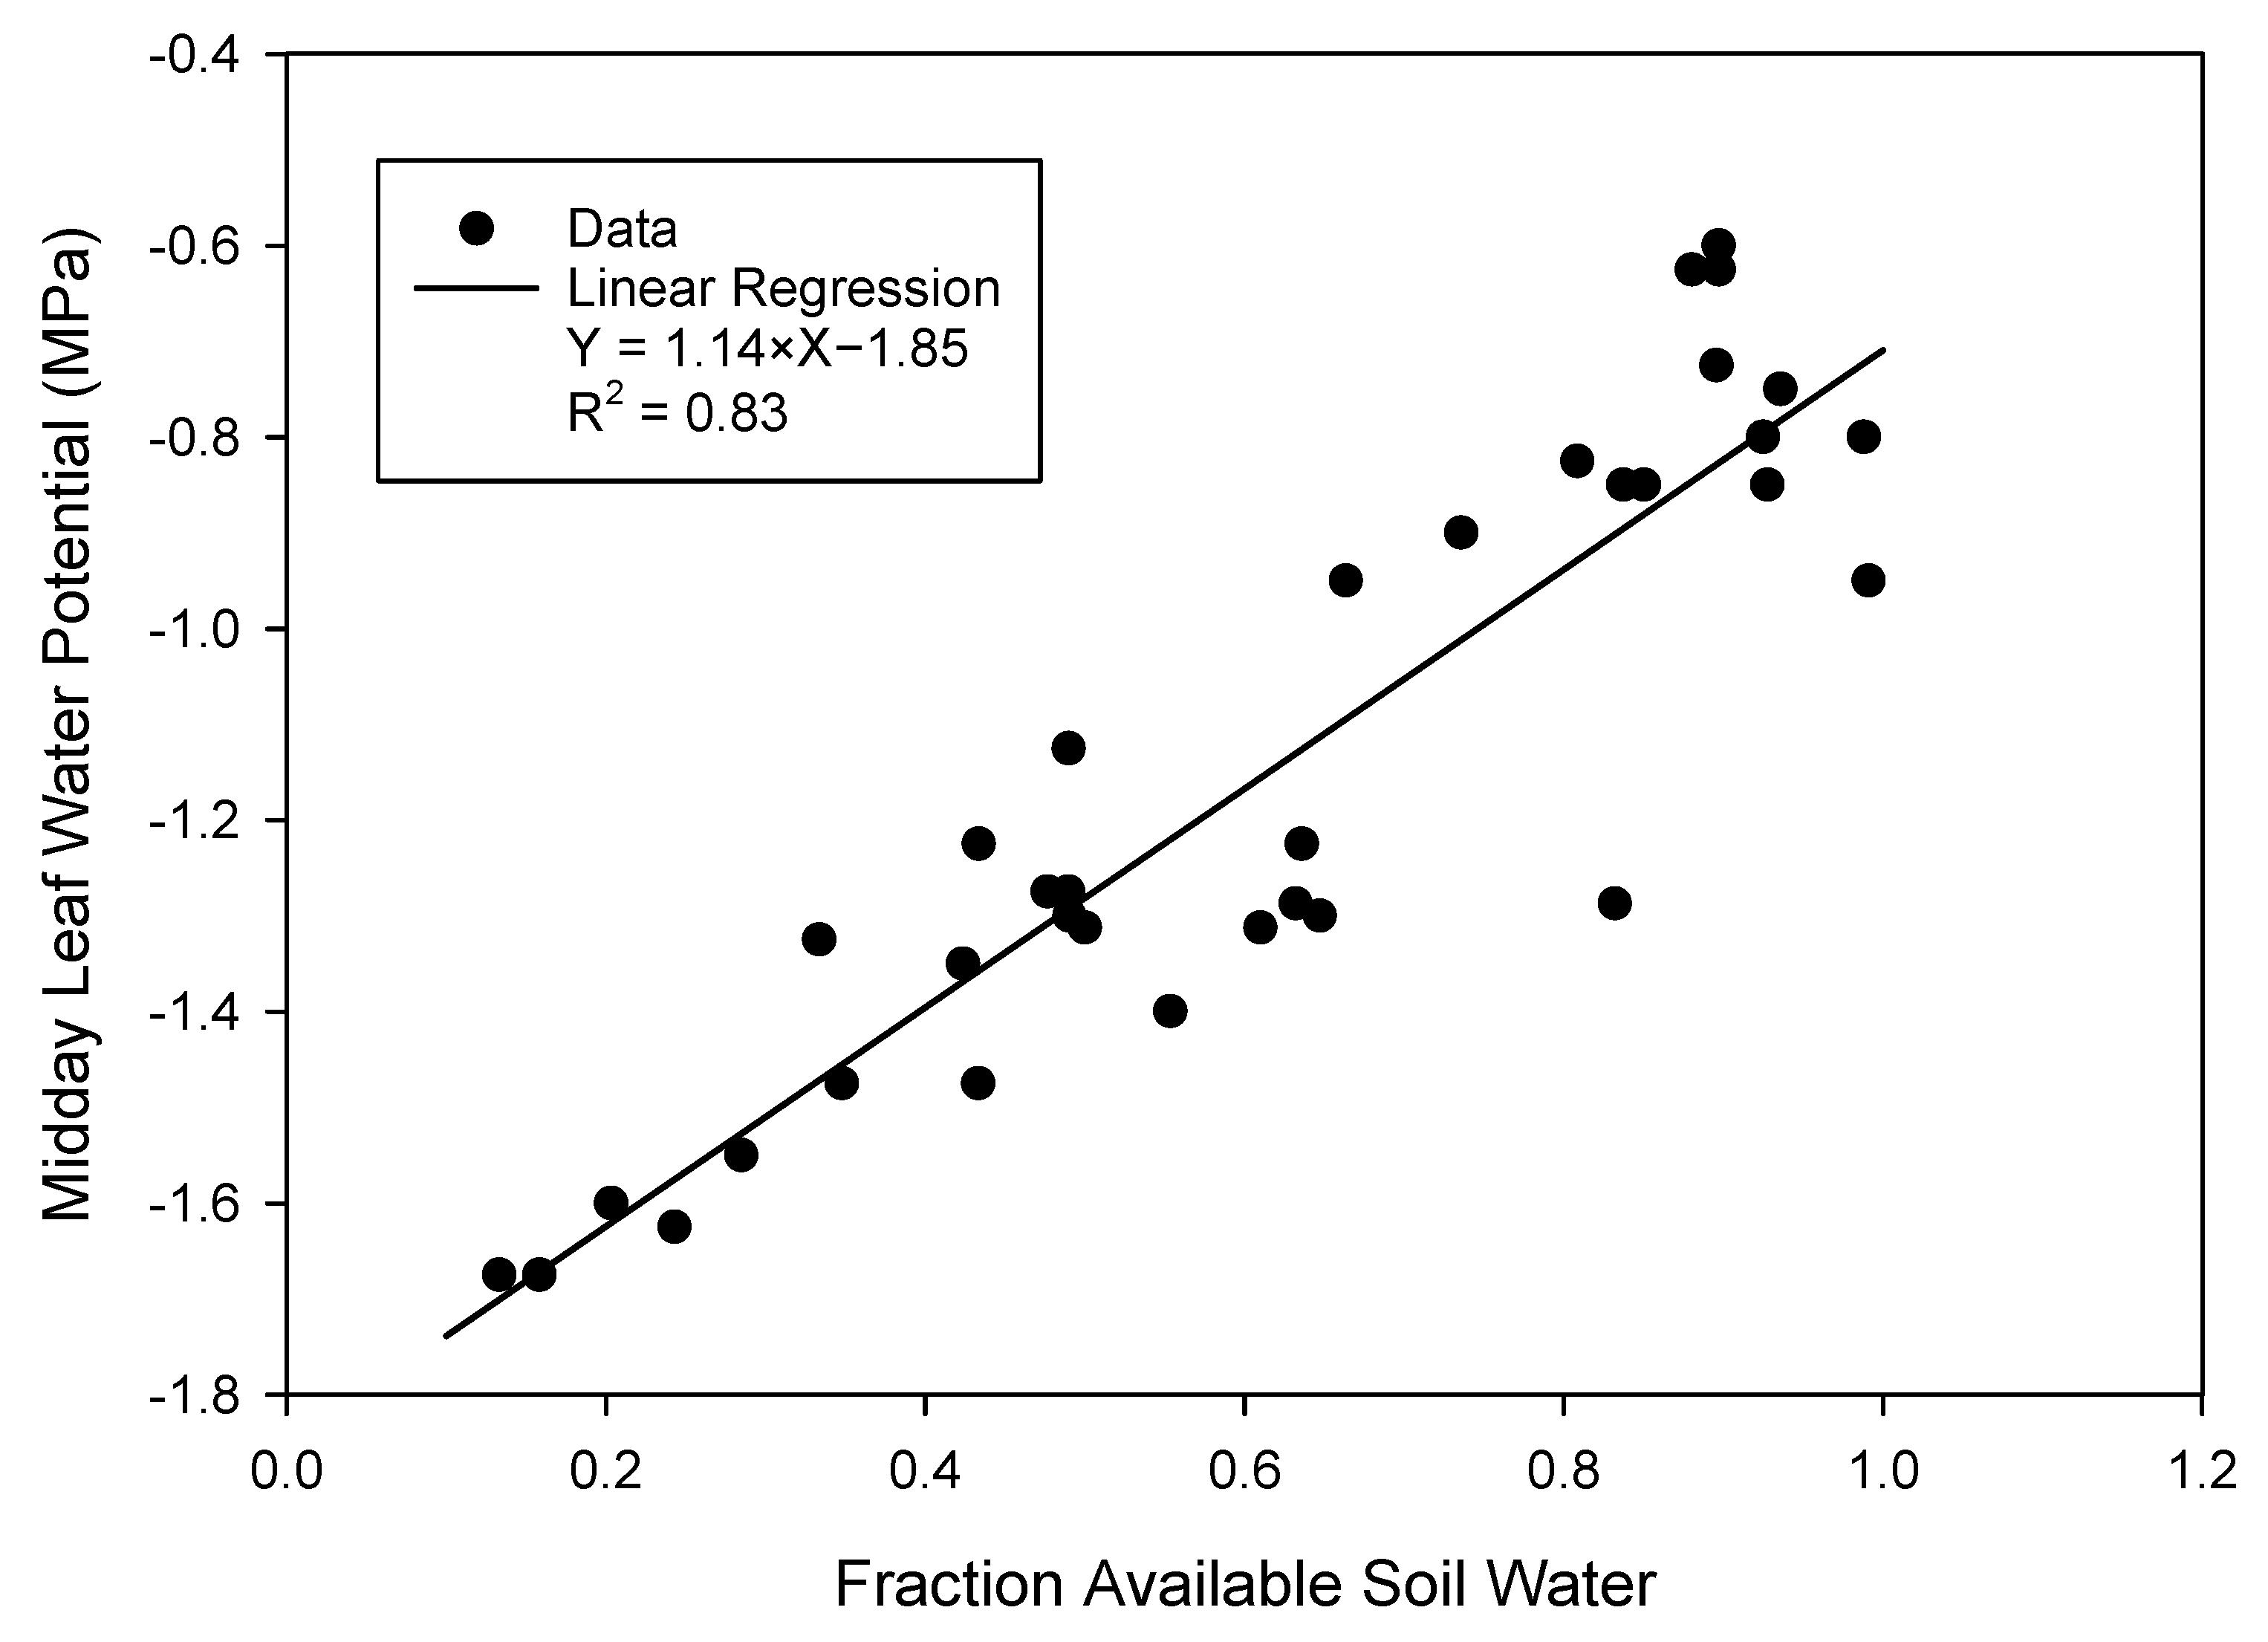
Over the 5-year study, a significant linear relationship (p < 0.001) was observed between Ψlmd and the daily CWSI (Figure 4), ASW and Ψlmd (Figure 5), and ASW and the daily CWSI (Figure 6). A significant logarithmic relationship (p < 0.001) was observed between the amount of irrigation/precipitation supplied between the fruit set and harvest and the average daily CWSI (Figure 7). The seasonal average daily CWSI increased as irrigation/precipitation between the fruit set and harvest decreased.

3.4. Yield Components and Berry Composition

Decreasing the irrigation amount significantly decreased the average cluster weight in each year of the study (Table 3). Decreasing the irrigation amount from 70% to 35% ETc reduced the cluster weight by ~30% and from 100% to 50% ETc, by ~18%. Increasing the daily maximum CWSI from 0.3 or 0.4 to 0.5 or 0.6 decreased the average cluster weight by ~22%. A corresponding decrease in yield per vine was observed in the first three study years; however, the decrease was not of statistical significance in 2018 or 2019. The significant interaction between year and irrigation amount in the first three study years for cluster number was due to a cold event during winter or spring of 2014–15 that reduced the number of clusters per vine in 2015. A detectable influence on the Ravaz index was observed only in 2018 when irrigation was reduced from 100% to 50% ETc.
Decreasing the irrigation amount decreased juice TA and increased the concentration of total anthocyanins in each year of the study (Table 4). When the irrigation amount was decreased from 70% to 35% ETc, TA decreased ~11% and the anthocyanin concentration increased ~13%. When the irrigation amount was decreased from 100% to 50% ETc, TA decreased by ~18% and the anthocyanin concentration increased by ~31%. Increasing the daily maximum CWSI from 0.3 or 0.4 to 0.5 or 0.6 decreased TA by ~20% without a statistical increase in anthocyanin concentration. The increase in anthocyanin concentration was offset by a corresponding decrease in berry fresh weight, resulting in similar amounts of total anthocyanins per berry in four out of the five study years. Increasing the daily maximum CWSI threshold to 0.5 or 0.6 reduced the total amount of anthocyanins per berry. In the first four study years, decreasing the fraction of ET-based irrigation increased SS by ~3%; however, increasing the daily maximum CWSI threshold value had no detectable influence on SS.

4. Discussion

There are a number of published studies on wine grape grown under arid conditions where the CWSI and other measurements of vine water status have been measured at periodic intervals during the growing season [11,17,26,35]. To the best of our knowledge, this is the first study to relate seasonal daily CWSI values with irrigation events, irrigation amounts, other indicators of vine water status, yield components, and berry composition. Despite the difference among the studies in the methods used to calculate a CWSI and to acquire canopy temperature data, results consistently supported a strong relationship between CWSI values and leaf-level measurements of vine water status.
The neural network model used in this study to calculate the lower temperature threshold of the CWSI was unique relative to other published studies [22]. The lower and upper threshold temperatures were estimated in other studies using wet and dry reference leaves [17], actually measured in fully-irrigated and non-irrigated plots of grapevines [35], estimated using a wet reference and a constant [26], or by relating vapor pressure deficit with the temperature difference between air and the canopy of a fully-transpiring vine [11]. As in this study, most other studies also measured sunlit leaves [11,26,35]. Jones et al. [17] reported that the sensitivity of leaf temperature to stomatal conductance was greater in sunlit relative to shaded leaves. Canopy temperature was measured in some studies from above the top of the canopy similar to this study [11,26] or from the side perpendicular to the vine row [17,35]. Similar to this study, most other studies used measurements acquired around solar noon to calculate the CWSI [11,17,26].
In this study, the CWSI values increased with the decreasing irrigation amounts and an inverse relationship was observed between the CWSI and Ψlmd. All three indicators of vine water status detected an increase in stress severity as the irrigation amount decreased. A similar inverse relationship between the CWSI and leaf or stem water potential was observed in Moscatel and Periquita [17], Castelão and Aragonês [35], Merlot [26], Chardonnay, Pinot-noir, and Tempranillo [11]. Jones et al. [17] concluded that the CWSI provided a more effective replication than would be practical using labor-intensive, leaf-level measurements. Grant et al. [35] used a CWSI to evaluate the relative stress severity among different deficit irrigation delivery methods (partial rootzone drying (PRD), sustained deficit (SDI), and regulated deficit (RDI)), and reported similar CWSI values for PRD and SDI and a higher CWSI value for RDI. The large amount of variability in the relationship between the CWSI and Ψlmd observed in this study, suggests that the daily CWSI is not a suitable direct surrogate for Ψlmd. However, the strong relationships between ASW and both the CWSI and Ψlmd suggest that either measurement of water status is suitable for assisting routine irrigation decision making. A similar amount of variability between the CWSI and Ψlmd observed in this study was also reported by [11] Bellvert et al. (2015). Potential sources of variability could be operator errors in collecting Ψlmd measurements, environmental factors, and vine differences [36]. In this study, multiple operators collected Ψlmd measurements in 2016, and this could have introduced variability into the Ψlmd measurements. Solar radiation and VPD are also known to influence Ψlmd and Ψlmd measurements [37]. The Ψlmd values reported in this study were made over a wide range of VPD and on days with variable clouds. The combination of multiple operators and wide range in VPD, solar radiation, temperature, and evaporative demand during Ψlmd measurements may account for some of the observed variability between daily CWSI and Ψlmd. Additionally, some Ψlmd values reported in this study were not collected on the same vine used for canopy temperature measurement, which could introduce another source of variability in the relationship between daily CWSI and Ψlmd.
In this study, a significant linear relationship was observed between the fraction of ASW and Ψlmd when the maximum and minimum Ψlmd values were −0.6 and −1.7 MPa (Figure 5). Williams and Trout [38] reported a quadratic relationship between soil water content and Ψlmd for Thompson Seedless grapes grown in a lysimeter; however, when Ψlmd values in their dataset were below −0.6 MPa, their data were nearly linear and similar to the results of this study. In this study, ASW corresponded more strongly with Ψlmd (Figure 5) than with the daily CWSI (Figure 6). However, the CWSI and Ψlmd both corresponded well with δ13C (Table 2), suggesting that both indicators detected differences in seasonal vine water stress severity. The greater amount of variability observed in this study between ASW and the daily CWSI may be attributed to the influence of environmental stresses on CWSI values in addition to soil water availability. The strong relationship between the daily CWSI and amount of supplied water (Figure 7) suggests that a maximum daily CWSI can be used for irrigation scheduling to distribute limited water resources over the growing season and sustain a desired level of vine water stress.
In this study, we observed an increase in juice δ13C as Ψlmd decreased (Table 2). A similar inverse relationship between δ13C and Ψ was observed in juice by Gaudillère et al. [39] and in dried leaves by Grant et al. [35]. However, at a similar range in Ψ in all three studies, the δ13C values in this study were lower than that of Gaudillère et al. [39] and higher than that of Grant et al. [35]. The three-year average Ψlmd and corresponding δ13C values for the 35 and 70 ETc treatments were, respectively, −1.29 and −1.15 MPa and −24.8 and −26.3. The δ13C values for Ψ values similar to this study reported by Gaudillère et al. [39] were −23 and −24, and, −27.25 and −28.89 for the 35% and 100% ETc treatments reported by Grant et al. [35]. The difference in δ13C values between studies could be due to cultivar differences, different laboratories, and/or the use of different tissues.

5. Conclusions

It is apparent from the results of this study that a water stress index based upon canopy temperature is sensitive to changes in soil moisture availability under semi-arid growing conditions. CWSI values responded quickly to irrigation events, were sensitive to irrigation amounts, and corresponded with changes in Ψlmd, juice δ13C, yield components, and berry composition. Vines irrigated at a daily CWSI threshold of 0.4 were supplied with 26% less water and had a similar yield per vine and a similar berry composition as vines irrigated at a daily CWSI threshold of 0.3. Under the semi-arid conditions of this study, utilizing a daily CWSI threshold for irrigation scheduling decreased the irrigation amount without compromising the yield or changes in berry composition and remotely provided automated decision support for managing water stress severity in grapevine.

Author Contributions

Both authors contributed substantially to the work reported in this paper. Conceptualization, K.C.S. and B.A.K.; site management, yield component data collection, sample analysis, statistical analysis, K.C.S.; canopy temperature measurement, computer modeling, CWSI calculation, soil moisture measurement, and data collection network, B.A.K.; Writing—Original draft preparation, K.C.S., Writing—Review and editing, B.A.K.; project administration, K.C.S.; funding acquisition, K.C.S. All authors have read and agreed to the published version of the manuscript.

Funding

The work reported in this paper was partially funded by the Idaho Department of Agriculture 2014 Idaho Specialty Crop Block, grant number 2014-14-SCBG-ID-0016 and the Idaho Department of Agriculture 2016 Idaho Specialty Crop Block, grant number 2016-16SCBGPID0034.

Acknowledgments

Allen Muir USDA-ARS Horticultural Crops Research Unit provided technical support for field management, sensor installation and sample collection and analysis. Mention of company or trade names is for description only and does not imply endorsement by the USDA. The USDA is an equal opportunity provider and employer.

Conflicts of Interest

The authors declare no conflict of interest.

References

  1. Chaves, M.M.; Francisco, Z.R.; Costa, J.M.; Santos, T.; Regalado, A.P.; Rodrigues, M.L.; Lopes, C.M. Grapevine under deficit irrigation: Hints from physiological and molecular data. Ann. Bot. London 2010, 105, 661–676. [Google Scholar] [CrossRef] [PubMed] [Green Version]
  2. Sadras, V.O.; Moran, M.A. Elevated temperature decouples anthocyanins and sugars in berries of Shiraz and Cabernet Franc. Aust. J. Grape Wine Res. 2012, 18, 115–122. [Google Scholar] [CrossRef]
  3. Chaves, M.M.; Santos, T.P.; Souza, C.R.; Ortuno, M.F.; Rodrigues, M.L.; Lopes, C.M. Deficit irrigation in grapevine improves water-use efficiency while controlling vigour and production quality. Ann. Appl. Biol. 2007, 150, 237–252. [Google Scholar] [CrossRef]
  4. Fereres, E.; Soriano, M.A. Deficit irrigation for reducing agricultural water use. J. Exp. Bot. 2007, 58, 147–159. [Google Scholar] [CrossRef] [PubMed] [Green Version]
  5. Shellie, K.C. Water productivity, yield, and berry composition in sustained versus regulated deficit irrigation of Merlot grapevines. Am. J. Enol. Vitic. 2014, 65, 197–205. [Google Scholar] [CrossRef]
  6. Allen, R.G.; Pereira, L.S.; Raes, D.; Smith, M. Crop Evapotranspiration-Guidelines for Computing Crop Water Requirements-FAO Irrigation and Drainage Paper 56, 1st ed.; Food and Agricultural Organizationof the United Nations: Rome, Italy, 1998; pp. 51–131. ISBN 92-5-104219-5. [Google Scholar]
  7. Cohen, Y.; Alchanatis, V.; Meron, M.; Saranga, Y.; Tsipris, J. Estimation of leaf water potential by thermal imagery and spatial analysis. J. Exp. Bot. 2005, 56, 1843–1852. [Google Scholar] [CrossRef] [PubMed] [Green Version]
  8. Glenn, M.D.; Cooley, N.; Walker, R.; Clingeleffer, P.; Shellie, K. Impact of kaolin particle film and water deficit on wine grape water use efficiency and plant water relations. HortScience 2010, 45, 1178–1187. [Google Scholar] [CrossRef]
  9. Shellie, K.C.; King, B.A. Kaolin particle film and water deficit influence Malbec leaf and berry temperature, pigments, and photosynthesis. Am. J. Enol. Vitic. 2013, 64, 223–230. [Google Scholar] [CrossRef]
  10. Bellvert, J.; Zarco-Tejada, P.J.; Girona, J.; Fereres, E. Mapping crop water stress index in a ‘Pinot-noir’ vineyard: Comparing ground measurements with thermal remote sensing imagery from an unmanned aerial vehicle. Precis. Agric. 2014, 15, 361–376. [Google Scholar] [CrossRef]
  11. Bellvert, J.; Marsal, J.; Girona, J.; Zarco-Tejada, P.J. Seasonal evolution of crop water stress index in grapevine varieties determined with high-resolution remote sensing thermal imagery. Irrig. Sci. 2015, 33, 81–93. [Google Scholar] [CrossRef]
  12. Idso, S.B.; Jackson, R.D.; Pinter, P.J.; Reginato, R.J.; Hatfield, J.L. Normalizing the stress-degree-day parameter for environmental variability. Agr. Meteorol. 1981, 24, 45–55. [Google Scholar] [CrossRef]
  13. Jackson, R.D.; Idso, S.B.; Reginato, R.J.; Pinter, P.J. Canopy temperature as a drought stress indicator. Water Resour. Res. 1981, 13, 651–656. [Google Scholar] [CrossRef]
  14. Jones, H.G. Plants and Microclimate, 2nd ed.; Cambridge University Press: Cambridge, UK, 1992; pp. 231–239. ISBN 978-0521425247. [Google Scholar]
  15. Alchanatis, V.; Cohen, Y.; Cohen, S.; Möller, M.; Sprinstin, M.; Meron, M.; Tsipris, J.; Saranga, Y.; Sela, E. Evaluation of different approaches for estimating and mapping crop water status in cotton using thermal imaging. Precision Ag. 2010, 11, 27–41. [Google Scholar] [CrossRef]
  16. Jones, H.G. Use of infrared thermometry for estimation of stomatal conductance as a possible aid to irrigation scheduling. Agric. For. Meteorol. 1999, 95, 139–149. [Google Scholar] [CrossRef]
  17. Jones, H.G.; Stoll, M.; Santos, T.; de Sousa, C.; Chaves, M.M.; Grant, O.M. Use of infrared thermography for monitoring stomatal closure in the field: Application to grapevine. J. Exp. Bot. 2002, 53, 2249–2260. [Google Scholar] [CrossRef]
  18. Leinonen, I.; Jones, H.G. Combining thermal and visible imagery for estimating canopy temperature and identifying plant stress. J. Exper. Botany 2004, 55, 1423–1431. [Google Scholar] [CrossRef] [Green Version]
  19. O’Shaughnessy, S.A.; Evett, S.R.; Colaizzi, P.D.; Howell, T.A. Using radiation thermography and thermometry to evaluate crop water stress in soybean and cotton. Ag. Water Manag. 2011, 98, 1523–1535. [Google Scholar] [CrossRef]
  20. Pou, A.; Diago, M.P.; Medrano, H.; Baluja, J.; Tardaguila, J. Validation of thermal indices for water status identification in grapevine. Ag. Water Manag. 2014, 134, 60–72. [Google Scholar] [CrossRef]
  21. Payero, J.O.; Irmak, S. Variable upper and lower crop water stress index baselines for corn and soybean. Irrig. Sci. 2006, 25, 21–32. [Google Scholar] [CrossRef] [Green Version]
  22. King, B.A.; Shellie, K.C. Evaluation of neural network modeling to predict non-water-stressed leaf temperature in wine grape for calculation of crop water stress index. Ag. Water Manag. 2016, 167, 38–52. [Google Scholar] [CrossRef]
  23. Belfiore, N.; Vinti, R.; Lovat, L.; Chitarra, W.; Tomasi, D.; de Bei, R.; Meggio, F.; Gaiotti, F. Infrared thermography to estimate vine water status: Optimizing canopy measurements and thermal indices for the varieties Merlot and Moscato in northern Italy. Agronomy 2019, 9, 821. [Google Scholar] [CrossRef] [Green Version]
  24. Fuentes, S.; de Bei, R.; Pech, J.; Tyerman, S. Computational water stress indices obtained from thermal image analysis of grapevine canopies. Irrig. Sci. 2012, 30, 523–536. [Google Scholar] [CrossRef]
  25. Irmak, S.; Haman, D.Z.; Bastug, R. Determination of crop water stress index for irrigation timing and yield estimation of corn. Agron. J. 2000, 92, 1221–1227. [Google Scholar] [CrossRef]
  26. Möller, M.; Alchanatis, V.; Cohen, Y.; Meron, M.; Tsipris, J.; Naor, A.; Ostrovsky, V.; Sprintsin, M.; Cohen, S. Use of thermal and visible imagery for estimating crop water status of irrigated grapevine. J. Exp. Botany 2007, 58, 827–838. [Google Scholar] [CrossRef] [PubMed] [Green Version]
  27. O’Toole, J.C.; Real, J.G. Estimation of aerodynamic and crop resistances from canopy temperature. Agron. J. 1986, 78, 305–310. [Google Scholar] [CrossRef]
  28. Han, M.; Zhang, H.; Chavez, J.L.; Ma, L.; Trout, T.J.; DeJonge, K.C. Improved soil water deficit estimation through integration of canopy temperature measurement into a soil water balance model. Irrig. Sci. 2018, 36, 187–201. [Google Scholar] [CrossRef]
  29. Keller, M.; Smithyman, R.P.; Mills, L.J. Interactive effects of deficit irrigation and crop load on Cabernet Sauvignon in an arid climate. Am. J. Enol. Vitic. 2008, 59, 221–234. [Google Scholar]
  30. Coombe, B.G. Growth stages of the grapevine: Adoption of a system for identifying grapevine growth stages. Aust. J. Grape Wine Res. 1995, 1, 104–110. [Google Scholar] [CrossRef]
  31. King, B.A.; Shellie, K.C. Wine grape cultivar influence on the performance of models that predict the lower threshold canopy temperature of a water stress index. Comput. Electron. Ag. 2018, 145, 122–129. [Google Scholar] [CrossRef]
  32. Herrero-Langreo, A.; Tisseyre, B.; Goutouly, J.; Scholasch, T.; Van Leeuwen, C. Mapping grapevine (Vitis vinifera L.) water status during the season using carbon isotope ratio (δ13C) as ancillary data. Am. J. Enol. Vitic. 2013, 64, 307–315. [Google Scholar] [CrossRef]
  33. Iland, P.; Bruer, N.; Edwards, G.; Weeks, S.; Wilkes, E. Chemical Analysis of Grapes and Wine: Techniques and Concepts, 1st ed.; Patrick Iland Wine Promotions PTY LTD: Athelstone, Australia, 2004; pp. 1–120. ISBN 978-0958160513. [Google Scholar]
  34. Shellie, K.C. Vine and berry response of Merlot (Vitis vinifera L.) to differential water stress. Am. J. Enol. Vitic. 2006, 57, 514–518. [Google Scholar]
  35. Grant, O.M.; Tronina, L.; Jones, H.G.; Chaves, M.M. Exploring thermal imaging variable for the detection of stress responses in grapevine under different irrigation regimes. J. Exp. Bot. 2007, 58, 815–825. [Google Scholar] [CrossRef] [PubMed]
  36. Levin, A.D. Re-evaluating pressure chamber methods of water stress determination in field-grown grapevine. Ag. Water Manag. 2019, 221, 422–429. [Google Scholar] [CrossRef]
  37. Williams, L.W.; Baeza, P. Relationships among ambient temperature and vapor pressure deficit and leaf and stem water potentials of fully irrigated, field grown grapevines. Am. J. Enol. Vitic. 2007, 58, 173–181. [Google Scholar]
  38. Williams, L.E.; Trout, T.J. Relationships among vine and soil based measures of water status in a ‘Thompson Seedless’ vineyard in response to high frequency drip irrigation. Am. J. Enol. Vitic. 2005, 56, 357–366. [Google Scholar]
  39. Gaudillère, J.P.; Van Leeuwen, C.; Ollat, N. Carbon isotope composition of sugars in grapevine, an integrated indicator of vineyard water status. J. Exp. Bot. 2002, 53, 757–763. [Google Scholar] [CrossRef] [Green Version]
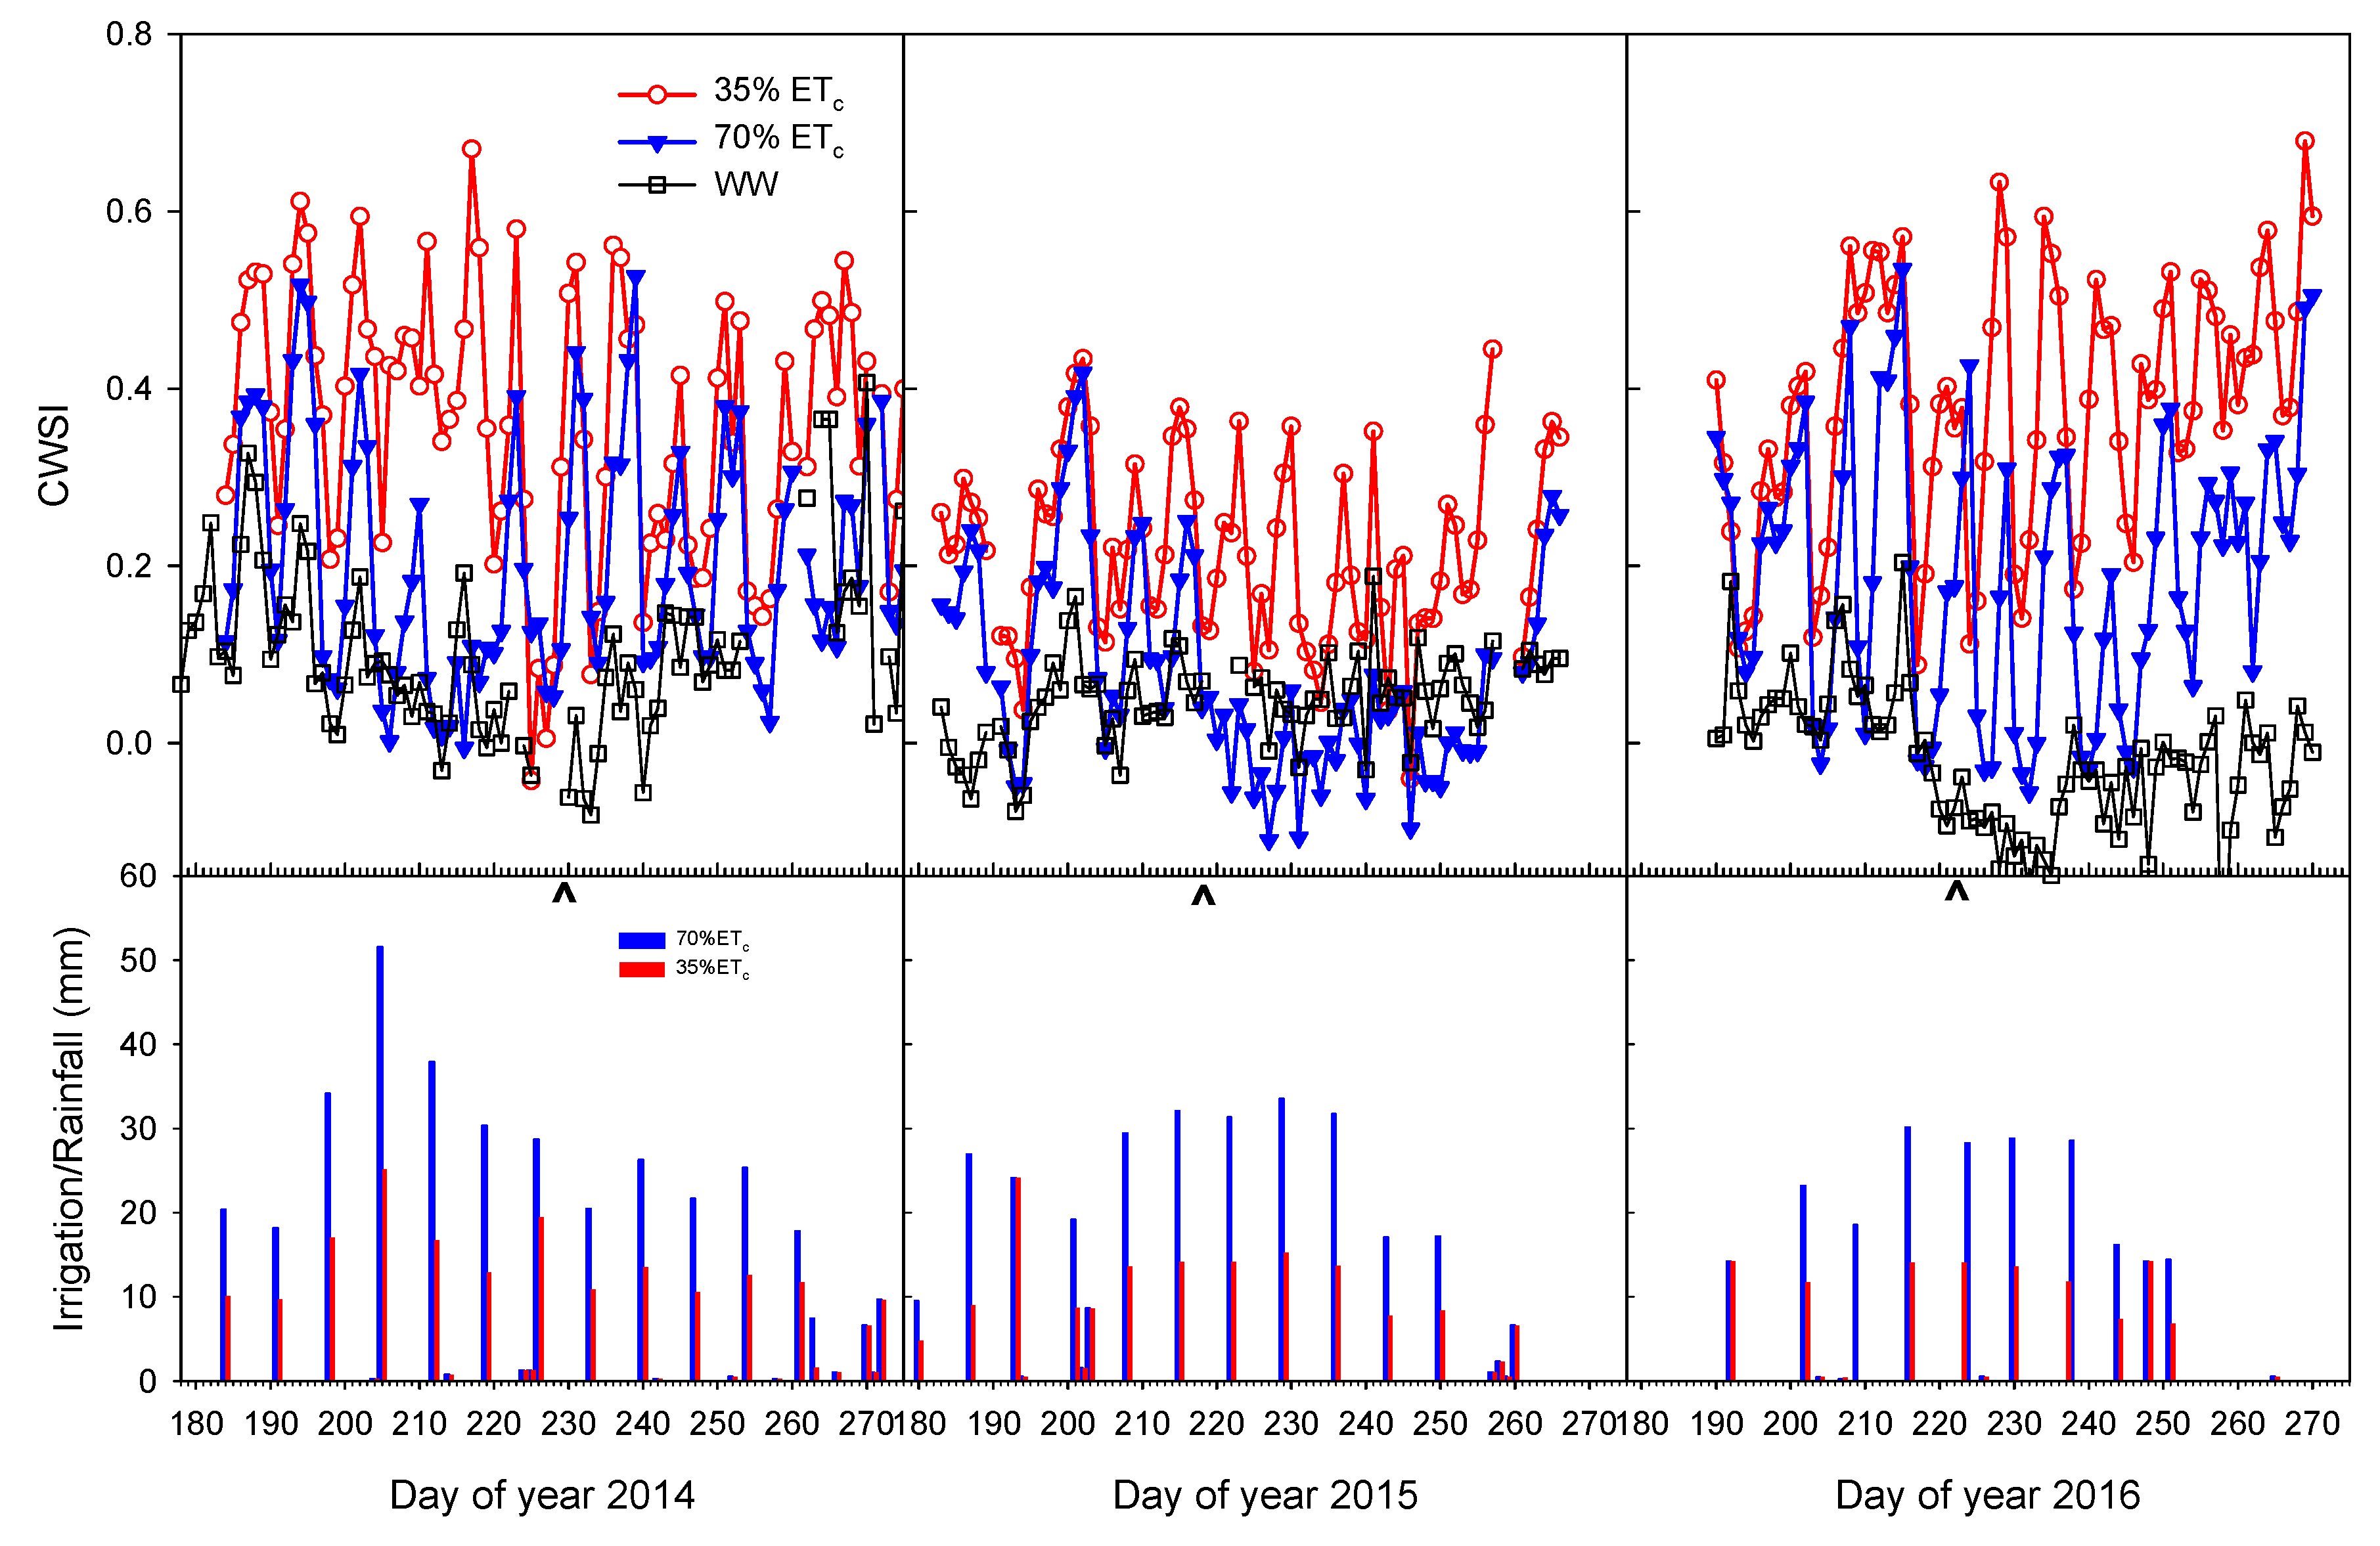
Figure 1. Average daily crop water stress index (CWSI) and irrigation applications to deficit irrigated treatments in 2014, 2015, and 2016. Computed CWSI of the well-watered vines (WW) is shown for reference. The ^ symbol denotes veraison day of year.
Agriculture 10 00492 g001
Figure 2. Crop water stress index (CWSI), fraction available soil water, and irrigation applications to treatments in 2018. Bars represent ± standard error of the value.
Agriculture 10 00492 g002
Figure 3. Crop water stress index (CWSI), fraction available soil water, and irrigation applications to treatments in 2019. Bars represent ± standard error of the value.
Agriculture 10 00492 g003
Figure 4. Linear relationship between the crop water stress index (CWSI) and midday leaf water potential of Malbec for the 5-year study at the experimental site.
Agriculture 10 00492 g004
Figure 5. Relationship between the fraction available soil water and midday leaf water potential for Malbec in 2018.
Agriculture 10 00492 g005
Figure 6. Relationship between the fraction of available soil water and crop water stress index (CWSI) in 2018.
Agriculture 10 00492 g006
Figure 7. Relationship between the seasonal irrigation applied and seasonal average daily crop water stress index (CWSI) for Malbec over the 5-year study at the experimental site.
Agriculture 10 00492 g007
Table 1. Weather and climate data from 1 Apr through 31 Oct for the field trial site in Parma, ID, and average irrigation amount supplied between fruit set and harvest to each treatment in each study year. Weather data were collected at the Parma (PMAI) weather station located 3 km from the field trial site ((www.usbr.gov/pn/agrimet/), latitude 43° 48′ 00”, longitude 116° 56′ 00”, elevation 702 m).
Parameters201420152016201820191994–2012
Average ± Std Dev
Precipitation (mm)881131206617599.6 ± 35
Solar radiation (MJ m−2 d−1)22.321.922.622.522.022.1 ± 0.9
Days air temperature > 35 °C272526332728 ± 12
Growing degree days (°C) a175918651688176216081708 ± 115
Alfalfa-based reference evapotranspiration (ETr) (mm)131412651329133412431212 ± 55
Treatment bIrrigation amount (mm)
Well-Watered521514669
100% ETc 304
70% ETc306284174
50% ETc 107
35% ETc190123117
CWSI = 0.3 233
CWSI = 0.4 172
CWSI = 0.5 148
CWSI = 0.6 68
a Growing degree days were calculated from the daily maximum and minimum temperature with no upper limit and a base temperature of 10 °C. b ETc is the estimated vine water demand.
Table 2. Malbec grapevines grown in southern Idaho under semi-arid conditions and drip-irrigated weekly (2014, 2015, 2016, 2018) to supply differing fractions of estimated water demand (ETc) or irrigated to supply 28 mm of water at different maximum daily Crop Water Stress Index (CWSI) threshold values (2019). Weekly average daily CWSI and midday leaf water potential (Ψlmd) measured one day prior to irrigation. Juice 13C/12C ratio (δ13C) and berry weight at harvest.
Main Effect aWeekly
CWSI
(0–1)
Ψlmd
(MPa)
Juice
δ13C
Berry Weight
(g)
% ETc: 350.31a−1.29a−24.09a1.35a
700.09b−1.20b−25.78b1.51b
Year: 20140.29a−1.29a−25.22b1.42b
20150.14b−1.20b−25.08b1.34b
20160.17b−1.23ab−24.50a1.52a
p values
Irrigation (I)*******
Year*******
I × Year**nsnsns
Year: 2018
% ETc: 500.42a−1.29a−24.61a1.44a
1000.08b−0.80b−26.98b1.82b
p values
Irrigation********
Year: 2019
CWSIb: 0.30.24a−1.00a−26.32a1.79a
0.40.27a−1.18b−25.56b1.79a
0.50.34b−1.31c−25.20b1.48b
0.60.43c−1.48d−24.18c1.30c
p values
CWSI********
a For main effect treatment level rows, least square mean values followed by a different letter within a column are significantly different (p ≤ 0.05) determined by Tukey-Kramer adjusted t-test. *, p ≤ 0.05; **, p ≤ 0.01; ns, not significant. b Daily maximum CWSI to trigger irrigation application of 28 mm water per vine.
Table 3. Yield components for Malbec (MB) grapevines grown under semi-arid conditions in southern Idaho that were drip-irrigated at weekly intervals with differing fractions of estimated water demand (ETc) (2014, 2015, 2016, 2018) or irrigated with the same amount of water at differing irrigation intervals (2019) based upon threshold daily crop water stress index (CWSI) values.
Main Effect aCluster Weight
(g)
Yield
(kg)
Cluster Number per VineRavaz Index
% ETc 35104.97a4.06a39.47a4.05
70150.51b6.90b53.54b4.95
Year: 2014157.01a5.81a48.92b4.35
2015103.42b4.00b21.72a4.59
2016122.79b6.63a68.88a4.56
p-values
Irrigation (I)******ns
Year******ns
I × Yearnsns**ns
Year: 2018
% ETc 50193.42a6.00a32.03a5.19a
100235.69b7.47a28.93b3.94b
p-values
Irrigation **ns**
Year: 2019
CWSI b 0.3197.71a8.3949.05.72
0.4176.76ab7.2846.85.16
0.5145.02b7.0951.66.22
0.6147.39b7.1950.95.43
p-values
CWSI*nsnsns
a For the main effect treatment level rows, the least square mean values followed by a different letter within a column are significantly different (p ≤ 0.05) determined by the Tukey-Kramer adjusted t-test. *, p ≤ 0.05; **, p ≤ 0.01; ns: Not significant. b Daily maximum CWSI to trigger the irrigation application of 28 mm of water.
Table 4. Berry attributes of Malbec grapevines grown under semi-arid conditions in southern Idaho that were drip-irrigated at weekly intervals with differing fractions of estimated water demand (ETc) (2014, 2015, 2016, 2018) or irrigated with the same amount of water at differing irrigation intervals (2019) based upon threshold daily crop water stress index (CWSI) values.
Main Effect aTitratable Acidity (g/mL)Soluble Solids (%)Anthocyanins (mg/g)Anthocyanins (mg/berry)
% ETc 354.490a23.7a2.071a2.799a
705.052b23.0b1.827b2.756a
Year: 20145.28923.1ab1.997ab2.839b
20154.76823.0b1.776b2.358c
20164.25624.0a2.034a3.136a
p-values
Irrigation (I)****ns
Year******
I × Year*nsnsns
Year: 2018
% ETc 504.174a24.5a1.839a2.639a
1005.085b23.5b1.408b2.566b
p-values
Irrigation ******ns
Year: 2019
CWSI b 0.34.793a22.81.532a2.760a
0.44.475a22.91.577a2.831a
0.53.679b22.51.453b2.148b
0.63.628b22.41.745a2.265b
p-values
CWSI**ns**
a For the main effect treatment level rows, the least square mean values followed by a different letter within a column are significantly different (p ≤ 0.05) determined by the Tukey-Kramer adjusted t-test. *, p ≤ 0.05; **, p ≤ 0.01; ns: Not significant. b Daily maximum CWSI to trigger the irrigation application of 28 mm of water. c TA: I × Year interaction was due to 2014 when 70% tmt had TA of 6.0. 2015 and 2016 were 4.8 and 4.3.
Publisher’s Note: MDPI stays neutral with regard to jurisdictional claims in published maps and institutional affiliations.