Impact of Cover Crops on Insect Community Dynamics in Organic Farming
by
Lili Martinez
1, 
Pushpa Soti
1,2,*,
Jasleen Kaur
1,
Alexis Racelis
1,2 and
Rupesh R. Kariyat
1,2,* 1
Department of Biology, University of Texas Rio Grande Valley, Edinburg, TX 78539, USA
2
Department of Biology, School of Earth, Environmental, and Marine Sciences, University of Texas Rio Grande Valley, Edinburg, TX 78539, USA
*
Authors to whom correspondence should be addressed.
Agriculture 2020, 10(6), 209; https://doi.org/10.3390/agriculture10060209
Submission received: 18 April 2020
/
Revised: 3 June 2020
/
Accepted: 4 June 2020
/
Published: 8 June 2020
(This article belongs to the Section Crop Protection, Diseases, Pests and Weeds)
Abstract
:Manipulating cover crops as an integrated pest management strategy has recently gained popularity in both traditional and organic agroecosystems. However, little information is available for producers to make informed decisions about cover crop selection, management, and their potential use as a pest management tool. To address this, we conducted a two-year, four-season field experiment on the potential of various cover crops during the summer seasons of both years, followed by monocultures of cash crops during winters. We hypothesized that the cover crop treatments would attract beneficial insects and repel damaging herbivores in a species-specific manner, and the insect community dynamics would be bridged to the cash crops in the subsequent season. In addition, we hypothesized that cash crops would suffer lower herbivory damage following specific cover crop treatments. Our design comprised of three cover crops. Our results indicate that cover crops support beneficial insects during the early summer season, while the time of growing season doesnot affect herbivore abundance. Crop-specific effects were found for herbivore abundance with possible cascading effects on insect community as well as damage levels on the subsequent cash crop, but without any impact on the growth traits of the cash crop. Together, our data suggest that cover crops, when carefully selected, can be an integral part of a pest management strategy for sustainable agriculture.
1. Introduction
Harnessing natural predator–prey interactions to limit pest populations is one of the major goals of insect biological control, and farmers have employed both augmentative and classical strategies to increase beneficial insects in their cropping systems. This includes the use of beneficial organisms such as predatory insects and mites, parasitoids, beneficial nematodes, and other microbial agents [1,2]. In addition, increasing plant diversity in cropping systems can also play an important role in protecting and managing crops from herbivore damage, by increasing both natural enemy abundance and diversity, which in turn can suppress pest populations [2]. These community ecology-based pest management strategies can be mediated through plant volatiles, and their induction through herbivore damage (herbivore induced plant volatiles; HIPV) as a cue for predators and parasitoids through tritrophic interactions [3], and also as a repellant for some herbivore species [4]. However, these interactions are often species specific, and also depend on other contributing factors such as age, location, and health of the plants, just to name a few [5,6].
Cover crops, or the intentional planting of non-cash crops for agroecosystem services such as weed suppression and water management [7], is a common method that has been found to increase above- and below-ground species diversity in agricultural farms. In addition to these commonly perceived benefits, cover cropping has also been found to serve as an integrated pest management tool, attracting beneficial insects, thereby acting as an indirect plant defense [8,9,10,11,12]. For example, Creamer and Baldwin [10] found that Sesame (Sesamum indicum), in addition to outcompeting weeds, also attracted beneficial insects, clearly demonstrating the multiple benefits of cover crops. More interestingly, in a California organic vineyard system, the planting of summer cover crops buckwheat (Fagopyrum esculentum Moench) and sunflower (Helianthus annus Linnaeus) resulted in the reduced density of leafhoppers and thrips and increased the numbers of predators, including spiders, and Anagrus epos Girault (Hymenoptera: Mymaridae), a major leafhopper parasitoid [13]. Proper incorporation of cover crops into the cropping system can have an added benefit of pest management along with soil fertility management and weed suppression, although this warrants additional empirical testing in a wide range of cover crop species across various cropping systems [7,14].
Ideally, a cover crop should include species that provide nectar, pollen, refuge for insects and maintain relatively high populations of predators and parasitoids [15], in addition to building healthy soils and providing weed control through their allelopathic properties [16]. Selecting the right species of cover crop has been reported to reduce the dependency on synthetic chemical treatments (herbicides and insecticides), especially in organic systems where these options are inherently limited. However, these cover crops may also potentially serve as a refuge and alternative host for herbivorous insects and can exacerbate pest populations, consequently nullifying any on-farm benefits received from cover cropping [8,15]. Furthermore, habitat complexity (mono vs. polycultures) [17] can lead to reduced predator abundance and foraging efficiency. For example, studies have found that both predators and parasitoid populations can be affected by habitat complexity, such as that of polycultures [18,19] when compared to monocultures [20,21,22]. Among all these expected benefits, the cover crops should also provide these traits to the cash crop, including any additional yield gain through better pest management or improved nutrient status [23]. However, it is quite clear that cover cropping systems are heavily dependent on species specificity, and any given benefits in one system are not necessarily reproducible in another. In addition, due to a dearth of studies showing the susceptibility of cover crops in harboring insect pests of subsequent cash crops [8,15,20,21], special attention is needed in selecting appropriate species that can potentially serve as insectaries supporting beneficial insects while staying neutral or repelling herbivores [21]. Since herbivores, predators, and pollinators use plant-derived volatiles as olfactory cues (in addition to other cues), expecting a cover crop to selectively attract predators, pollinators, and natural herbivore enemies while repelling the damaging herbivores is tricky to put in practice [20,21]. More importantly, we lack enough field studies that have tested these effects with cover-cash crops and their specificity in attracting and repelling natural enemies and herbivores, respectively. Results from these studies can assist in the selection, management, and evaluation of cover crops and cash crops, and cover crop-mediated and integrated pest management for cropping systems.
To address this, we conducted a two-year, four-season field experiment on the potential of a cover crop and cash crop duo on insect community dynamics (beneficial insects including predators, parasitoids, pollinators, and herbivorous insects) in a certified organic cropping system in the Lower Rio Grande Valley (LRGV). Due to the subtropical climate with hot summers and mild winters, and high relative humidity, LRGV has always been a sweet spot for insects. This makes pest management a primary concern for the two million acres or more of agricultural land in the area, but also provides a unique opportunity to understand the mechanisms underlying a wide range of plant–herbivore–pollinator interactions, and devise management practices that have broad appeal for tropics and sub-tropic agroecosystems elsewhere. The cover crop species were selected based on their ability to successfully grow and develop in the warm and subtropical conditions pertinent to the study location. Specifically, we asked the following questions: i) Can cover crops enhance the biological control of insect pests?; ii) Are there species-specific effects of cover crops on the insect community dynamics?; and iii) Do these effects, if any, translate into enhanced pest management or yield increase for the subsequent cash crops?
2. Materials and Methods
2.1. Study Site
This study was conducted on a certified organic vegetable farm located in Edinburg, Texas (26°15′59.3″ N 98°05′28.1″ W) in the LRGV. The farm had been managed under organic farming specifications for the past nine years under a diverse rotation of organically grown crucifers (beets, cabbage, cauliflower, kohlrabi, kale), cucurbits (squash, zucchini, pumpkin, cucumber, watermelons), tomatoes, okra, and eggplants. Farm soil was sandy loam with 0.6% soil organic matter, 0.10% total N, 55.33 ppm total P, and soil pH 8.30. Average temperature during the summer and fall of the 2017 study period was 28.7 °C and 22.2 °C, respectively. Average temperatures during the summer and fall of the 2018 study period were 30.7 °C and 21.1 °C, respectively.
2.2. Cover Crop Treatments and Experimental Design
The cover crop treatments included in this study were selected for their relevance to summer conditions (extremely hot, dry) of the region, and included (1) sunn hemp (SH) (Crotalaria juncea), a legume extensively used as a green manure crop in the tropical and subtropical regions; (2) sudangrass (SG) (Sorghum drummondii), a high-biomass grass used for increasing soil organic matter with weed-suppression potential; (3) Chinese red cowpea (CP) (Vigna unguiculata); (4) mix of the three (Mix). Certified organic seeds of sudangrass and sunn hemp were purchased from Johnny’s Seed Company (Fairfield, Maine) and cowpea seeds were purchased from Petcher Seeds (Fruitdale, AL; for seeding rates and cover crop details, see Table 1). In June 2017 and 2018, after the spring vegetable growing season, an area approximately 0.85 ha was disked and divided into 20–35 m × 7 m with a 1-m buffer space between, delineated with a rototiller. Each cover crop treatment (SH, SG, CP, Mix) and the control fallow were completely randomized during both the years. This experimental design (including four treatments and control) was replicated four times (see Table 2 and Figure 1).
2.3. Planting and Termination
Cover crop seeds were planted using a hand-held seeder (Scotts Handy Green II®; Marysville, OH, USA) at recommended rates (see Table 1). All blocks and all treatments (including control) were flood-irrigated twice during the study (immediately after planting and three weeks after planting when the plants showed signs of water stress). All treatments were terminated using a flail mower at the end of 8 weeks after planting in both the years.
2.4. Insect Community Collection
Insect community data were collected from all the treatment blocks in 2017 and only from the leguminous cover crops (cowpea and sunn hemp) in 2018. Insect community data were sampled using three different techniques: sweep net (11” diameter), pit fall traps (8 fluid ounce plastic cups with 3/4ths of water and a drop of odorless detergent to break surface tension; [3]), and unbaited sticky traps (Pherocon® AM Yellow; Trece, Inc., Adair, OK, USA). Pit fall traps and sticky traps were installed randomly in each treatment plots on 15 August (7 weeks after planting). This method allowed us to collect both flying insects and soil dwellers to get a better understanding of the insect community associated with the system, rather than selectively collecting one or the other. All the collected insects were retrieved after 72 h (a total of 20 pitfall and 20 sticky traps). For sweep net collection, each of the cover crop treatments was swept (20 sweeps/plot) just before cover crop termination. The rationale behind using three different methods of sampling was to obtain comprehensive coverage of the community including insects and other arthropods at canopy and soil levels, including fliers and crawlers (for details, see [3,24,25]). After the experiment, all sampled insects were identified and grouped into guilds based on their functional roles: herbivores, predators, parasitoids, and pollinators. The summer of 2018 consisted of the same cover crops as the previous year but only sunn hemp and cowpea were observed since other cover crops had delayed germination and were patchy in growth. Data collection of summer 2018 consisted of two insect damage assessments and a sweep net method before termination. Damage was measured for 50 randomly chosen plants in each of the 3 sunn hemp and 3 cowpea plots for a total of >300 plants. Damage was measured visually on a scale of 0 to 4, 0 indicating no visible damage to the plant while a 4 indicated physical damage was present on almost all leaves of the plant (see [25] for methodological details). Insect collection using the sweep net method consisted of sweeping an insect net (11’ diameter) three times over the cover crop plot of each of the six chosen fields plus three control plots and placing the contents into a mason jar containing 70% isopropyl alcohol for further storage and identification.
2.5. Cash Crop Planting & Pest Damage
In both 2017 and 2018, after two weeks of cover crops termination, all the experimental plots were disked to incorporate the cover crop biomass residue and then bedded into rows to prepare for fall planting. In 2017, each cover crop plot was divided into two equal plots for the cash crops: zucchini (Cucurbita pepo) and bush beans (Phaseolus vulgaris). Seeds of organic zucchini and bush beans were planted in rows as traditionally done by growers (row hills were 1.2 m apart and about 0.5 m between plants). The cash crop plants were drip irrigated and the edges around the treatment plots were hand-weeded as necessary. Since the bush bean plants did not suffer heavy insect damage, pest damage estimation was only done for zucchini. A visual pest damage estimate was conducted three times (as detailed above), twice for damage on plants and once for damage on fruit (zucchini). In 2018, the cash crops consisted of cabbage (Brassica oleracea var. capitata), cilantro (Coriandrum sativum), and kale (Brassica oleracea var. sabellica). Rows were distanced by 1 m and plants were sown 0.5 m apart. Drip irrigation was implemented after sowing. Two rows consisting of cilantro and cabbage were sown on opposite widths of the plot while seven rows of kale were sown in the center. Data collection consisted of pit fall cup setups and visual damage assessments. Pit fall cups were placed throughout the field at two months after sowing and three months after sowing with a total of 45 cups per replication.
3. Statistical Analysis
The statistical analysis was performed using generalized linear models (GLM). All analyses were carried out using Minitab 19® (by Minitab LLC) and plots were built using Graphpad Prism (GraphPad Software, CA, USA). For year one, we examined the total insect abundance as well as their separation according to functional roles across different cover crop treatments during the cropping season using GLM and Tukey’s post-hoc tests. For this, we included time, cover crop species, and their interaction as factors, while the mean number of total insects, beneficial insects and herbivores were the response variable. For the damage levels recorded on cash crops (year 1), time and previous year cover crop plots were included as factors, while the damage levels were the response variables.
Since cowpea and sunn hemp were the main cover crops that showed promise, in the second year we focused on these two by examining their growth and damage levels. The data were analyzed with time and cover crop species, and their interactions were factors, plant height and damage levels as response variables, followed by Tukey’s post-hoc tests. Cover crop biomass data at the end of the growing season was analyzed using a two-tailed t-test to test for significance between the two species. In the fall of year two among the cash crops planted, only cabbage survived, and we used similar analyses (GLM and Tukey’s post-hoc tests) to examine whether the cover crops from the previous season had any effect on both biomass and insect community dynamics on the cash crop.
4. Results
For the summer of year 1, when cover crops were planted, we found no significant difference among the three cover crop species and their mix for the total number of insects collected in the traps when pooled for each treatment (P = 0.286; Table 3). Interestingly, a similar trend was also found for both the early season as well as the late season collections (P = 0.598, F = 0.053; Table 3). Additionally, we also separated the insects found in the traps into different groups based on the functional roles: herbivores such as white fly (Bemisia sp.; Hemiptera) and armyworm (Pseudaletia unipuncta; Lepidoptera), and beneficial insects (predators, parasitoids, and pollinators) such as big-eyed bug (Geocoris sp.) and parasitoid wasps (Cotesia sp.) (See appendix Table A1 for details). Our results suggest that beneficial insects significantly varied during the different growth periods (P = 0.025, F = 4.98; Table 3), as they were found significantly more during the early season of summer 2017 as compared to mid-season. However, this effect was not observed during other seasons or with respect to different crops (P = 0.387, F = 1.13; Table 3). On the contrary, we did not find any significant difference for the prevalence of the damaging herbivores with respect to the growth period during Summer 2017 (P = 0.199, F = 1.83; Table 3). However, it is interesting to note that damaging herbivore numbers were found to significantly vary for the different cover crops (P = 0.026, F = 3.93; Figure 2; Table 3). We found that herbivores were significantly lower on the treatment with a mix of sorghum- sudangrass, sunn hemp, and cowpea as compared to control without any cover crops. However, none of the cover crops showed any significant difference among themselves for herbivore attraction (Tukey’s post-hoc tests; Figure 2; Table 3). Taken together, cover crop insect community dynamics showed little effect due to both growth season variation and cover crop species, except for beneficial insects which were more prevalent in the early season of cover crop growth.
Following this, we performed the damage assessment on the cash crops (zucchini/squash) planted in fall 2017, after the termination of the cover crops to examine any remnant effects of the previously sown cover crops. We found that the herbivory incurred on the cash crops significantly varied by the growing season of cash crop. Specifically, observing the foliar damage levels at three time points during the growing season, we found significant variation in the damage levels during the early season (P = 0.015, F = 4.36; Figure 3; Table 3); however no difference was observed during the mid and late season (P = 0.23, F = 1.58; Figure 3; Table 3; P = 0.896, F = 0.26; Figure 3; Table 3). More precisely, during the early season of fall 2017, the squash crop grown in cowpea plots suffered significantly higher damage compared to squash grown in sudangrass and sunn hemp plots. While, damage levels did not vary significantly for the squash plants in the mix and control plots and their comparison to the squash plants grown in sorghum sudangrass, sunn hemp and cowpea plots (Tukey’s post-hoc tests; Figure 3; Table 3).
During the second year (summer 2018), we further recorded damage levels in the cover crops to understand the effect of cash crops on the subsequent cover crops in the next season. Our analysis showed a significant interaction between the cover crop and the time of the season or growth stage for the damage levels incurred on the plants following the cash crop (P = 0.000, F = 225.83; Figure 4; Table 3). Furthermore, post hoc pairwise comparisons showed that early season cowpea and late season sunn hemp suffered significantly higher damage levels than early season sunn hemp and late season cowpea (Tukey’s post-hoc tests) but the pairs did not differ among each other. We also found that early season cowpea suffered higher damage than late season cowpea while early season sunn hemp has lower damage than the late season sunn hemp (P = 0.000; Figure 4; Table 3). In addition, as expected, sunn hemp clearly displayed significantly higher growth traits than cowpea. Sunn hemp grew taller and gained higher biomass than cowpea during the summer 2018 (Two tailed t tests; P = 0.000; Figure 5; Table 3; Two tailed t tests; P = 0.000; Figure 6; Table 3). In contrast, we did not find any significant difference in biomass of the cash crop cabbage grown in both sunn hemp and cowpea plots. However, the cabbages in the sunn hemp plots had significantly higher biomass than the control plot (P = 0.013, F = 4.6; Figure 7; Table 3).
Finally, we also assessed the effects from previous season cover crops on the insect community associated with the only surviving cabbage cash crop. These analyses revealed no significant difference between the early and late season cash crops for total number of all the insects, beneficial insects and damaging insects (P = 0.548, 0.397, 0.348, F = 0.37, 0.74, 0.92; Figure 8a–c, respectively; Table 3). However, cabbage grown following cowpea planting attracted significantly more number of total insects, followed by cabbage grown after sunn hemp and the least number of insects were found on cabbage grown on control plots (P = 0.002, F = 8.59; Figure 9a; Table 3). Additionally, we also found that the damaging herbivores had a significantly higher affinity for both cowpea and sunn hemp, compared to the control plants (weedy plots mainly with pigweed, Solanum elaeagnifolium, cowpen daisy, and sunflower) (P = 0.001, F = 9.17; Figure 9b; Table 3; Tukey’s post-hoc tests). Also, the mean number of beneficial insects did not significantly vary for any of the three treatments (P = 0.095, F = 2.6; Figure 9c; Table 3).
5. Discussion
This study was conducted to examine the effect of sorghum sudangrass, cowpea, sunn hemp, and their mix on the insect community dynamics in the field and whether their effects cascaded to the cash crop grown during the following season upon their termination. Overall, we found that crop specificity played a significant role in regulating the herbivore abundance in this cropping system, while the natural enemies’ (predators and parasitoids) abundance was largely influenced by temporal variation during the same season.
Insect abundance during summer 2017 remained unaffected by the presence of different cover crop treatments and their growing period (time) during the season. Amongst these, beneficial insects comprising of predators, parasitoids, and pollinators were found to be more abundant earlier rather than later in the season, while no crop-specific effect was observed on their abundance. As plants emit a unique blend of volatile compounds induced upon herbivory, also known as herbivore-induced plant volatiles (HIPVs) [3,25,26,27,28], studies suggest that HIPVs can selectively attract the natural enemies like predators and parasitoids of the insect pests feeding on the host plant. For instance, a United States Department of Agriculture study suggested that sorghum sudangrass, upon herbivory by aphids, attracts their predators while cowpea, upon damage by stink bugs, leaf-footed bugs, and aphids, can attract parasitoid wasps and other beneficial insects [29]. Interestingly, in our experimental traps, we found Cotesia sp. (Hymenoptera), an important braconid wasp that parasitises two major cabbage herbivores, Trichoplusia ni and Pseudaletia unipuncta (Lepidoptera) [30,31]. Besides cabbage, P. unipuncta can damage cereals (Gramineae) like Sorghum sp. [31]. Our traps also collected various predatory bugs (Hemiptera) and spiders (Arachnae) which can forage on P. unipuncta [31]. Egg parasitoid green lacewing (Chrysoperla carnea; Neuroptera), also known to predate on the whitefies (Bemisia argentifolii), was found in the traps [32,33]. Therefore, the early season can be the most favorable for biocontrol of prevalent herbivores in this particular cropping system. In addition, intercropping is known to affect the host location of a suitable plant by the insect pest. For instance, Mansion-Vaquie [34] reported the increased time taken by cereal aphids (Sitobion avenae) to locate wheat plants (Triticum aestivum) in a diversified cropping system than in a monoculture. So, it is possible that herbivore abundance remained constant during the early and the late season in the course of locating and feeding on the appropriate host plant. These results can have major implications in devising integrated pest management strategies for growing cash crops in the next season. However, the temporal influence on the insect diversity during the same season warrants additional examination of herbivore-induced plant chemistry, which can certainly play a major role in influencing the insect community dynamics in the field [3,24,25,26,27]. Our results suggest that herbivores had a more-or-less uniform affinity to the cover crops throughout the summer season, while the beneficial insects were mostly found in higher numbers during the early season.
In addition, significant variation in the selective herbivore affinity to the cover crops can be related to the collective effect of intercropping along with HIPVs. Past studies suggest that HIPVs released in a specific plant-insect system can also repel the herbivores. For instance, HIPVs induced in Spodoptera frugiperda (Lepidoptera) fed maize, a gramineae crop like sorghum sudangrass, have been found to repel the adult moths of the pest [35]. Although statistically insignificant, we still found the lowest herbivores in the mix treatment followed by the individual crops, and highest in the control. This reinforces the difficulty in host selection faced by the insects in a mixed system, possibly due to volatiles overload and mixing from multiple species and concentrations [36,37]. Similarly, a study recorded lower aphid movement to the potatoes in onion intercropped fields [38]. However, these effects were not bridged to the next cash crop; no significant difference was recorded for damage levels on squash grown in control and mix plots. Therefore, our data do not support using mix treatment in cover cropping. Additionally, it involves an increased workforce, difficulty in carrying out pest control, and intercultural farm operations using mechanized implements and farm machinery, making it possibly uneconomical.
During year 2, our data indicated that squash plants grown in cowpea plots suffered the highest damage levels when compared to both sunn hemp and sorghum sudangrass plots. In fact, cowpea grown after the termination of squash again displayed the highest damage levels. Therefore, a possible plant morphological effect on the insect herbivory can be speculated in this case. As cowpea is a short cover crop when compared to tall growing sunn hemp and sorghum sudangrass [39,40], it is plausible that the insect pests harbored by cowpea’s short canopy were bridged to the squash plants, another short-statured crop, in the following season and back to cowpeas grown in the next season. This reinforces our speculation that a unique microclimate due to a shorter canopy of the crop plants (both cowpea and squash) is a possible explanation for these results. This is known as the green bridge effect [41], where the cover crops are expected to influence the insect diversity of the cash crop in the subsequent season. However, contrary to the expectations, the green bridge effect also has the risk of spreading insect pests to the cash crop [41], where cover crops serve as a refuge in an otherwise bare fallow period.
Our results indicate that cowpea can potentially serve as a trap crop to attract and kill the prevalent insect pests in the field, similar to push–pull-based biocontrol [37,42,43], but this area warrants further examination. Furthermore, significantly high damage levels recorded on the early season cowpea during the second year reinforces the speculation of temporal effects on the insects prevalent in the area. With the progress of the summer season accompanied by a rise in ambient temperature, there was a significant decrease in the damage levels on the crop. However, significantly higher damage levels were observed on the sunn hemp later in the season, suggesting species-specific effects, as observed throughout the experiment. Additionally, we observed a positive effect of both cowpea and sunn hemp on the growth traits of our cash crop cabbage grown in the following season. Cabbage grown on the cover crop treatment plots had significantly higher biomass than the control cabbage. This is consistent with the benefits of cover crops reported in the earlier studies [25,44,45]. It is also important to note that there was a significant difference between the height of the two cover crops, with sunn hemp being taller than cowpea [39,40]. This growth pattern might be beneficial and less of a concern for resource partitioning by growing sunn hemp in a cover cropping system alongside others. For instance, certain cover crops are known to have allelopathic effects which can hamper the growth of neighboring plants or voluntary plants (e.g., weed species) in the vicinity of the allelopathic plant [46,47].
To conclude, our results are in congruence with other studies which collectively demonstrate that intercropping different cover crops can influence the insect diversity during the cropping season [29,34,36,37,38,43,44] and bridge a few, if not all, insects and their benefits, if any, to the subsequent cash crop [41]. However, it is important to plan and select appropriate cover crops for maximum benefits that are both species- and location-specific. Instances have been reported where plant volatiles have served as cues for herbivores and thus lead to additional herbivory [35]. The results of this study also demonstrate how the effects of different cover crops on the insect community dynamics and growth benefits vary when transferred to the cash crops grown in the same field in the next season. Most importantly, our results have highlighted the need for a detailed examination of the effect of microclimates modified by a particular crop species in relation to the macroclimate of the entire field, having a significant impact on the insect community dynamics and thereby the major cash crops.
Author Contributions
Conceptualization, R.R.K., P.S., and A.R.; methodology, L.M., R.R.K. and P.S; formal analysis, R.R.K. and J.K., investigation, L.M., R.R.K. and P.S.; resources, R.R.K., P.S., and A.R.; writing—original draft preparation, L.M., R.R.K., P.S., writing—review and editing, L.M., R.R.K., P.S. and A.R.; visualization, supervision, R.R.K. and P.S.; project administration.; funding acquisition, R.R.K., P.S. and A.R. All authors have read and agreed to the published version of the manuscript.
Funding
This project was funded by UTRGV startup funds to Rupesh Kariyat, and United States Department of Agriculture-National Institute of Food and Agriculture Grant # 2016-38422-25543 to Alex Racelis, and Southern Sare on Farm Research Grant and United States Department of Agriculture-National Institute of Food and Agriculture Grant # 2017-67012-26128 to Pushpa Soti.
Acknowledgments
The authors thank Tera Preta Farm for allowing us to conduct research on their farm. The authors also thank the three anonymous reviewers for their insightful comments on the manuscript.
Conflicts of Interest
The authors declare no conflict of interest.
Appendix A

Table A1.
Details of most common pests, their natural predators, and parasitoids found in the traps employed in different cover and cash crop treatments over two years of field study. Details of their common names, scientific names, taxonomic orders and families are included.
Table A1.
Details of most common pests, their natural predators, and parasitoids found in the traps employed in different cover and cash crop treatments over two years of field study. Details of their common names, scientific names, taxonomic orders and families are included.
| Herbivores | Order | Family |
|---|---|---|
| White fly (Bemisia argentifolii [Bellows & Perring]) | Hemiptera | Aleyrodidae |
| Leaf hopper (Empoasca fabae (Harris]) | Hemiptera | Cicadellidae |
| Lygus bugs (Lygus lineolaris) | Hemiptera | Miridae |
| Flea beetle (Chaetocnema hortensis) | Coleoptera | Chrysomelidae |
| Armyworm (Pseudaletia unipuncta [Haworth]) | Lepidoptera | Noctuidae |
| Looper (Trichoplusia ni [Hübner]) | Lepidoptera | Noctuidae |
| Predators | ||
| Ladybug beetle (Hippodamia convergens [Guérin-Méneville]) | Coleoptera | Coccinellidae |
| Minute pirate bug (Orius sp.) | Hemiptera | Anthocoridae |
| Big eyed bug (Geocoris sp.) | Hemiptera | Geocoridae |
| Spiders (multiple species) | Araneae | |
| Green lacewing (Chrysoperla sp.) | Neuroptera | Chrysopidae |
| Damsel bug (Nabis sp.) | Hemiptera | Nabidae |
| Assassin bug (Zelus sp.) | Hemiptera | Reduviidae |
| Parasitoids | ||
| Parasitoid Wasps (Cotesia sp.) | Hymenoptera | Braconidae |
References
- Bale, J.; Van Lenteren, J.C.; Bigler, F. Biological control and sustainable food production. Philos. Trans. R. Soc. B Biol. Sci. 2007, 363, 761–776. [Google Scholar] [CrossRef] [PubMed] [Green Version]
- Rodriguez-Saona, C.; Blaauw, B.R.; Isaacs, R. Manipulation of natural enemies in agroecosystems: Habitat and semiochemicals for sustainable insect pest control. In Integrated Pest Management and Pest Control—Current and Future Tactics, 1st ed.; Larramendy, M.L., Soloneski, S., Eds.; InTech: Rijeka, Croatia, 2012; pp. 89–126. [Google Scholar]
- Kariyat, R.; Mauck, K.E.; De Moraes, C.M.; Stephenson, A.G.; Mescher, M.C. Inbreeding alters volatile signalling phenotypes and influences tri-trophic interactions in horsenettle (Solanum carolinense L.). Ecol. Lett. 2012, 15, 301–309. [Google Scholar] [CrossRef] [PubMed]
- Unsicker, S.B.; Kunert, G.; Gershenzon, J. Protective perfumes: The role of vegetative volatiles in plant defense against herbivores. Curr. Opin. Plant Biol. 2009, 12, 479–485. [Google Scholar] [CrossRef] [PubMed]
- Reicosky, D.C.; Forcella, F. Cover crop and soil quality interactions in agroecosystems. J. Soil Water Conserv. 1998, 53, 224–229. [Google Scholar]
- Fageria, N.K.; Baligar, V.C.; Bailey, B.A. Role of cover crops in improving soil and row crop productivity. Commun. Soil Sci. Plant Anal. 2005, 36, 2733–2757. [Google Scholar] [CrossRef]
- Lu, Y.-C.; Watkins, K.B.; Teasdale, J.R.; Abdul-Baki, A.A. Cover crops in sustainable food production. Food Rev. Int. 2000, 16, 121–157. [Google Scholar] [CrossRef]
- Bugg, R.L.; Wäckers, F.L.; Brunson, K.E.; Dutcher, J.D.; Phatak, S.C. Cool-season cover crops relay intercropped with cantaloupe: Influence on a generalist predator, geocoris punctipes (Hemiptera: Lygaeidae). J. Econ. Èntomol. 1991, 84, 408–416. [Google Scholar] [CrossRef]
- Bugg, R.L.; Waddington, C. Using cover crops to manage arthropod pests of orchards: A review. Agric. Ecosyst. Environ. 1994, 50, 11–28. [Google Scholar] [CrossRef]
- Creamer, N.G.; Baldwin, K.R. An evaluation of summer cover crops for use in vegetable production systems in North Carolina. HortScience 2000, 35, 600–603. [Google Scholar] [CrossRef] [Green Version]
- Tilman, D. Niche tradeoffs, neutrality, and community structure: A stochastic theory of resource competition, invasion, and community assembly. Proc. Natl. Acad. Sci. USA 2004, 101, 10854–10861. [Google Scholar] [CrossRef] [Green Version]
- Lundgren, J.G.; Fergen, J.K. The effects of a winter cover crop on diabrotica virgifera (Coleoptera: Chrysomelidae) populations and beneficial arthropod communities in No-Till maize. Environ. Èntomol. 2010, 39, 1816–1828. [Google Scholar] [CrossRef] [PubMed] [Green Version]
- Nicholls, C.I.; Parrella, M.; Altieri, M.A. The effects of a vegetational corridor on the abundance and dispersal of insect biodiversity within a northern California organic vineyard. Landsc. Ecol. 2001, 16, 133–146. [Google Scholar] [CrossRef]
- Vukicevich, E.; Lowery, T.; Bowen, P.; Úrbez-Torres, J.R.; Hart, M. Cover crops to increase soil microbial diversity and mitigate decline in perennial agriculture. A review. Agron. Sustain. Dev. 2016, 36. [Google Scholar] [CrossRef] [Green Version]
- Long, R.F.; Lamb, C.; Reberg-Horton, S.C.; Chandler, J.; Stimmann, M.; Corbett, A. Beneficial insects move from flowering plants to nearby crops. Calif. Agric. 1998, 52, 23–26. [Google Scholar] [CrossRef]
- Hoffman, M.L.; Weston, L.A.; Snyder, J.C.; Regnier, E.E. Allelopathic influence of germinating seeds and seedlings of cover crops on weed species. Weed Sci. 1996, 44, 579–584. [Google Scholar] [CrossRef]
- Asmah, S.; Ghazali, A.; Syafiq, M.; Yahya, M.S.; Peng, T.L.; Norhisham, A.R.; Puan, C.L.; Lindenmayer, D.; Azhar, B. Effects of polyculture and monoculture farming in oil palm smallholdings on tropical fruit-feeding butterfly diversity. Agric. For. Èntomol. 2016, 19, 70–80. [Google Scholar] [CrossRef] [Green Version]
- Stamps, W.T.; Linit, M.J. Plant diversity and arthropod communities: Implications for temperate agroforestry. Agrofor. Syst. 1997, 39, 73–89. [Google Scholar] [CrossRef]
- E Crews, T.; Carton, W.; Olsson, L. Is the future of agriculture perennial? Imperatives and opportunities to reinvent agriculture by shifting from annual monocultures to perennial polycultures. Glob. Sustain. 2018, 1. [Google Scholar] [CrossRef] [Green Version]
- Costello, M. Abundance, growth rate and parasitism of Brevicoryne brassicae and Myzus persicae (Homoptera: Aphididae) on broccoli grown in living mulches. Agric. Ecosyst. Environ. 1995, 52, 187–196. [Google Scholar] [CrossRef] [Green Version]
- Bryant, A.; Brainard, D.C.; Haramoto, E.R.; Szendrei, Z. Cover crop mulch and weed management influence arthropod communities in strip-tilled cabbage. Environ. Èntomol. 2013, 42, 293–306. [Google Scholar] [CrossRef]
- Legrand, A.; Barbosa, P. Plant morphological complexity impacts foraging efficiency of adult coccinella septempunctata L. (Coleoptera: Coccinellidae). Environ. Èntomol. 2003, 32, 1219–1226. [Google Scholar] [CrossRef] [Green Version]
- Kaye, J.P.; Quemada, M. Using cover crops to mitigate and adapt to climate change. A review. Agron. Sustain. Dev. 2017, 37. [Google Scholar] [CrossRef]
- Kariyat, R.; Hardison, S.; Ryan, A.B.; Stephenson, A.G.; De Moraes, C.M.; Mescher, M.C. Leaf trichomes affect caterpillar feeding in an instar-specific manner. Commun. Integr. Biol. 2018, 11, 1–6. [Google Scholar] [CrossRef] [PubMed]
- Kaur, J.; Chavana, J.; Soti, P.; Racelis, A.; Kariyat, R. Arbuscular mycorrhizal fungi (AMF) influences growth and insect community dynamics in Sorghum-sudangrass (Sorghum × drummondii). Arthropod-Plant Interact. 2020, 14, 301–315. [Google Scholar] [CrossRef]
- Pare, P.W. Plant volatiles as a defense against insect herbivores. Plant Physiol. 1999, 121, 325–332. [Google Scholar] [CrossRef] [Green Version]
- Kariyat, R.; Scanlon, S.R.; Moraski, R.P.; Stephenson, A.G.; Mescher, M.C.; De Moraes, C.M. Plant inbreeding and prior herbivory influence the attraction of caterpillars (Manduca sexta) to odors of the host plant Solanum carolinense (Solanaceae). Am. J. Bot. 2014, 101, 376–380. [Google Scholar] [CrossRef]
- Dicke, M.; Baldwin, I.T. The evolutionary context for herbivore-induced plant volatiles: Beyond the ‘cry for help’. Trends Plant Sci. 2010, 15, 167–175. [Google Scholar] [CrossRef]
- Cover Cropping for Pollinators and Beneficial Insects. Available online: https://www.sare.org/Learning-Center/Bulletins/Cover-Cropping-for-Pollinators-and-Beneficial-Insects/Text-Version (accessed on 30 March 2020).
- Grasela, J.J.; McIntosh, A.H.; Shelby, K.S.; Long, S. Isolation and characterization of a baculovirus associated with the insect parasitoid wasp, cotesiamarginiventris, or its host, Trichoplusia ni. J. Insect Sci. 2008, 8, 1–19. [Google Scholar] [CrossRef]
- Capinera, J.L. Armyworm, Pseudaletia Unipuncta (Haworth) (Insecta: Lepidoptera: Noctuidae); University of Florida: Gainesville, FL, USA, 2012; Available online: http://citeseerx.ist.psu.edu/viewdoc/download?doi=10.1.1.512.757&rep=rep1&type=pdf (accessed on 29 March 2020).
- Legaspi, J.; Nordlund, D.; Legaspi, B. Tri-trophic interactions and predation rates in Chrysoperla spp. Attacking the silverleaf whitefly. Southwest. Entomol. 1996, 21, 33–42. [Google Scholar]
- Inbar, M.; Gerling, D. Plant-mediated interactions between whiteflies, herbivores, and natural enemies. Annu. Rev. Èntomol. 2008, 53, 431–448. [Google Scholar] [CrossRef] [Green Version]
- Mansion-Vaquié, A.; Ferrer, A.; Ramon-Portugal, F.; Wezel, A.; Magro, A. Intercropping impacts the host location behaviour and population growth of aphids. Èntomol. Exp. Appl. 2019, 168, 41–52. [Google Scholar] [CrossRef] [Green Version]
- War, A.R.; Sharma, H.C.; Paulraj, M.G.; War, M.Y.; Ignacimuthu, S. Herbivore induced plant volatiles: Their role in plant defense for pest management. Plant Signal. Behav. 2011, 6, 1973–1978. [Google Scholar] [CrossRef] [PubMed] [Green Version]
- Himanen, S.J.; Bui, T.N.T.; Maja, M.M.; Holopainen, J.K. Utilizing associational resistance for biocontrol: Impacted by temperature, supported by indirect defence. BMC Ecol. 2015, 15. [Google Scholar] [CrossRef] [PubMed] [Green Version]
- Leslie, A.W.; Hamby, K.A.; McCluen, S.R.; Hooks, C.R.R. Evaluating a Push-Pull Tactic for Management of Epilachna Varivestis Mulsant and Enhancement of Beneficial Arthropods in Phaseolus lunatus L. Available online: https://www.sciencedirect.com/science/article/pii/S0925857419303842 (accessed on 1 April 2020).
- Ninkovic, V.; Dahlin, I.; Vucetic, A.; Petrovič-Obradovič, O.; Glinwood, R.; Webster, B. Volatile exchange between undamaged plants—A new mechanism affecting insect orientation in intercropping. PLoS ONE 2013, 8. [Google Scholar] [CrossRef] [PubMed] [Green Version]
- Mansoer, Z.; Reeves, D.; Wood, C.W. Suitability of sunn hemp as an alternative late-summer legume cover crop. Soil Sci. Soc. Am. J. 1997, 61, 246–253. [Google Scholar] [CrossRef] [Green Version]
- Taiwo, M.A.; Akinjogunla, O.J. Cowpea viruses: Quantitative and qualitative effects of single and mixed viral infections. Afr. J. Biotechnol. 2006, 5, 1749–1756. [Google Scholar]
- Hickman, P.L. Cover Crops as an Integrated Approach for Pest Suppression and Pollinator Promotion in Arkansas. Master’s Thesis, University of Arkansas, Fayetteville, AR, USA, 2019. [Google Scholar]
- Khan, Z.R.; Midega, C.A.O.; Bruce, T.J.A.; Hooper, A.; Pickett, J. Exploiting phytochemicals for developing a ‘push-pull’ crop protection strategy for cereal farmers in Africa. J. Exp. Bot. 2010, 61, 4185–4196. [Google Scholar] [CrossRef] [Green Version]
- Ezzat, S.M.; Jeevanandam, J.; Egbuna, C.; Merghany, R.M.; Akram, M.; Daniyal, M.; Nisar, J.; Sharif, A. Semiochemicals: A green approach to pest and disease control. In Natural Remedies for Pest, Disease and Weed Control; Egbuna, C., Sawicka, B., Eds.; Academic Press: Cambridge, MA, USA, 2020; pp. 81–89. [Google Scholar]
- Soti, P.G.; Racelis, A. Cover crops for weed suppression in organic vegetable systems in semiarid subtropical Texas. Org. Agric. 2020, 1–8. [Google Scholar] [CrossRef]
- Murrell, E.G.; Ray, S.; Lemmon, M.E.; Luthe, D.; Kaye, J.P. Cover crop species affect mycorrhizae-mediated nutrient uptake and pest resistance in maize. Renew. Agric. Food Syst. 2019, 1–8. [Google Scholar] [CrossRef]
- Bewick, T.A.; Shilling, D.G.; Dusky, J.A.; Williams, D. Effects of celery (apium graveolens) root residue on growth of various crops and weeds. Weed Technol. 1994, 8, 625–629. [Google Scholar] [CrossRef]
- Saha, B.; Devi, C.; Khwairakpam, M.; Kalamdhad, A.S. Vermicomposting and anaerobic digestion-viable alternative options for terrestrial weed management—A review. Biotechnol. Rep. 2018, 17, 70–76. [Google Scholar] [CrossRef] [PubMed]
Figure 1.
Schematic of planting for summer and fall of 2017 and 2018. Summer of 2017 consisted of a mix (sudangrass, sunn hemp, and cowpea), and sunn hemp, Chinese red cowpea, and sudangrass plots. Fall of 2017 shows the zucchini cash crop. Summer of 2018 shows the cover crops sunn hemp and cowpea. And, Fall of 2018 shows the cabbage cash crop. Cartoon by Annette Diaz.
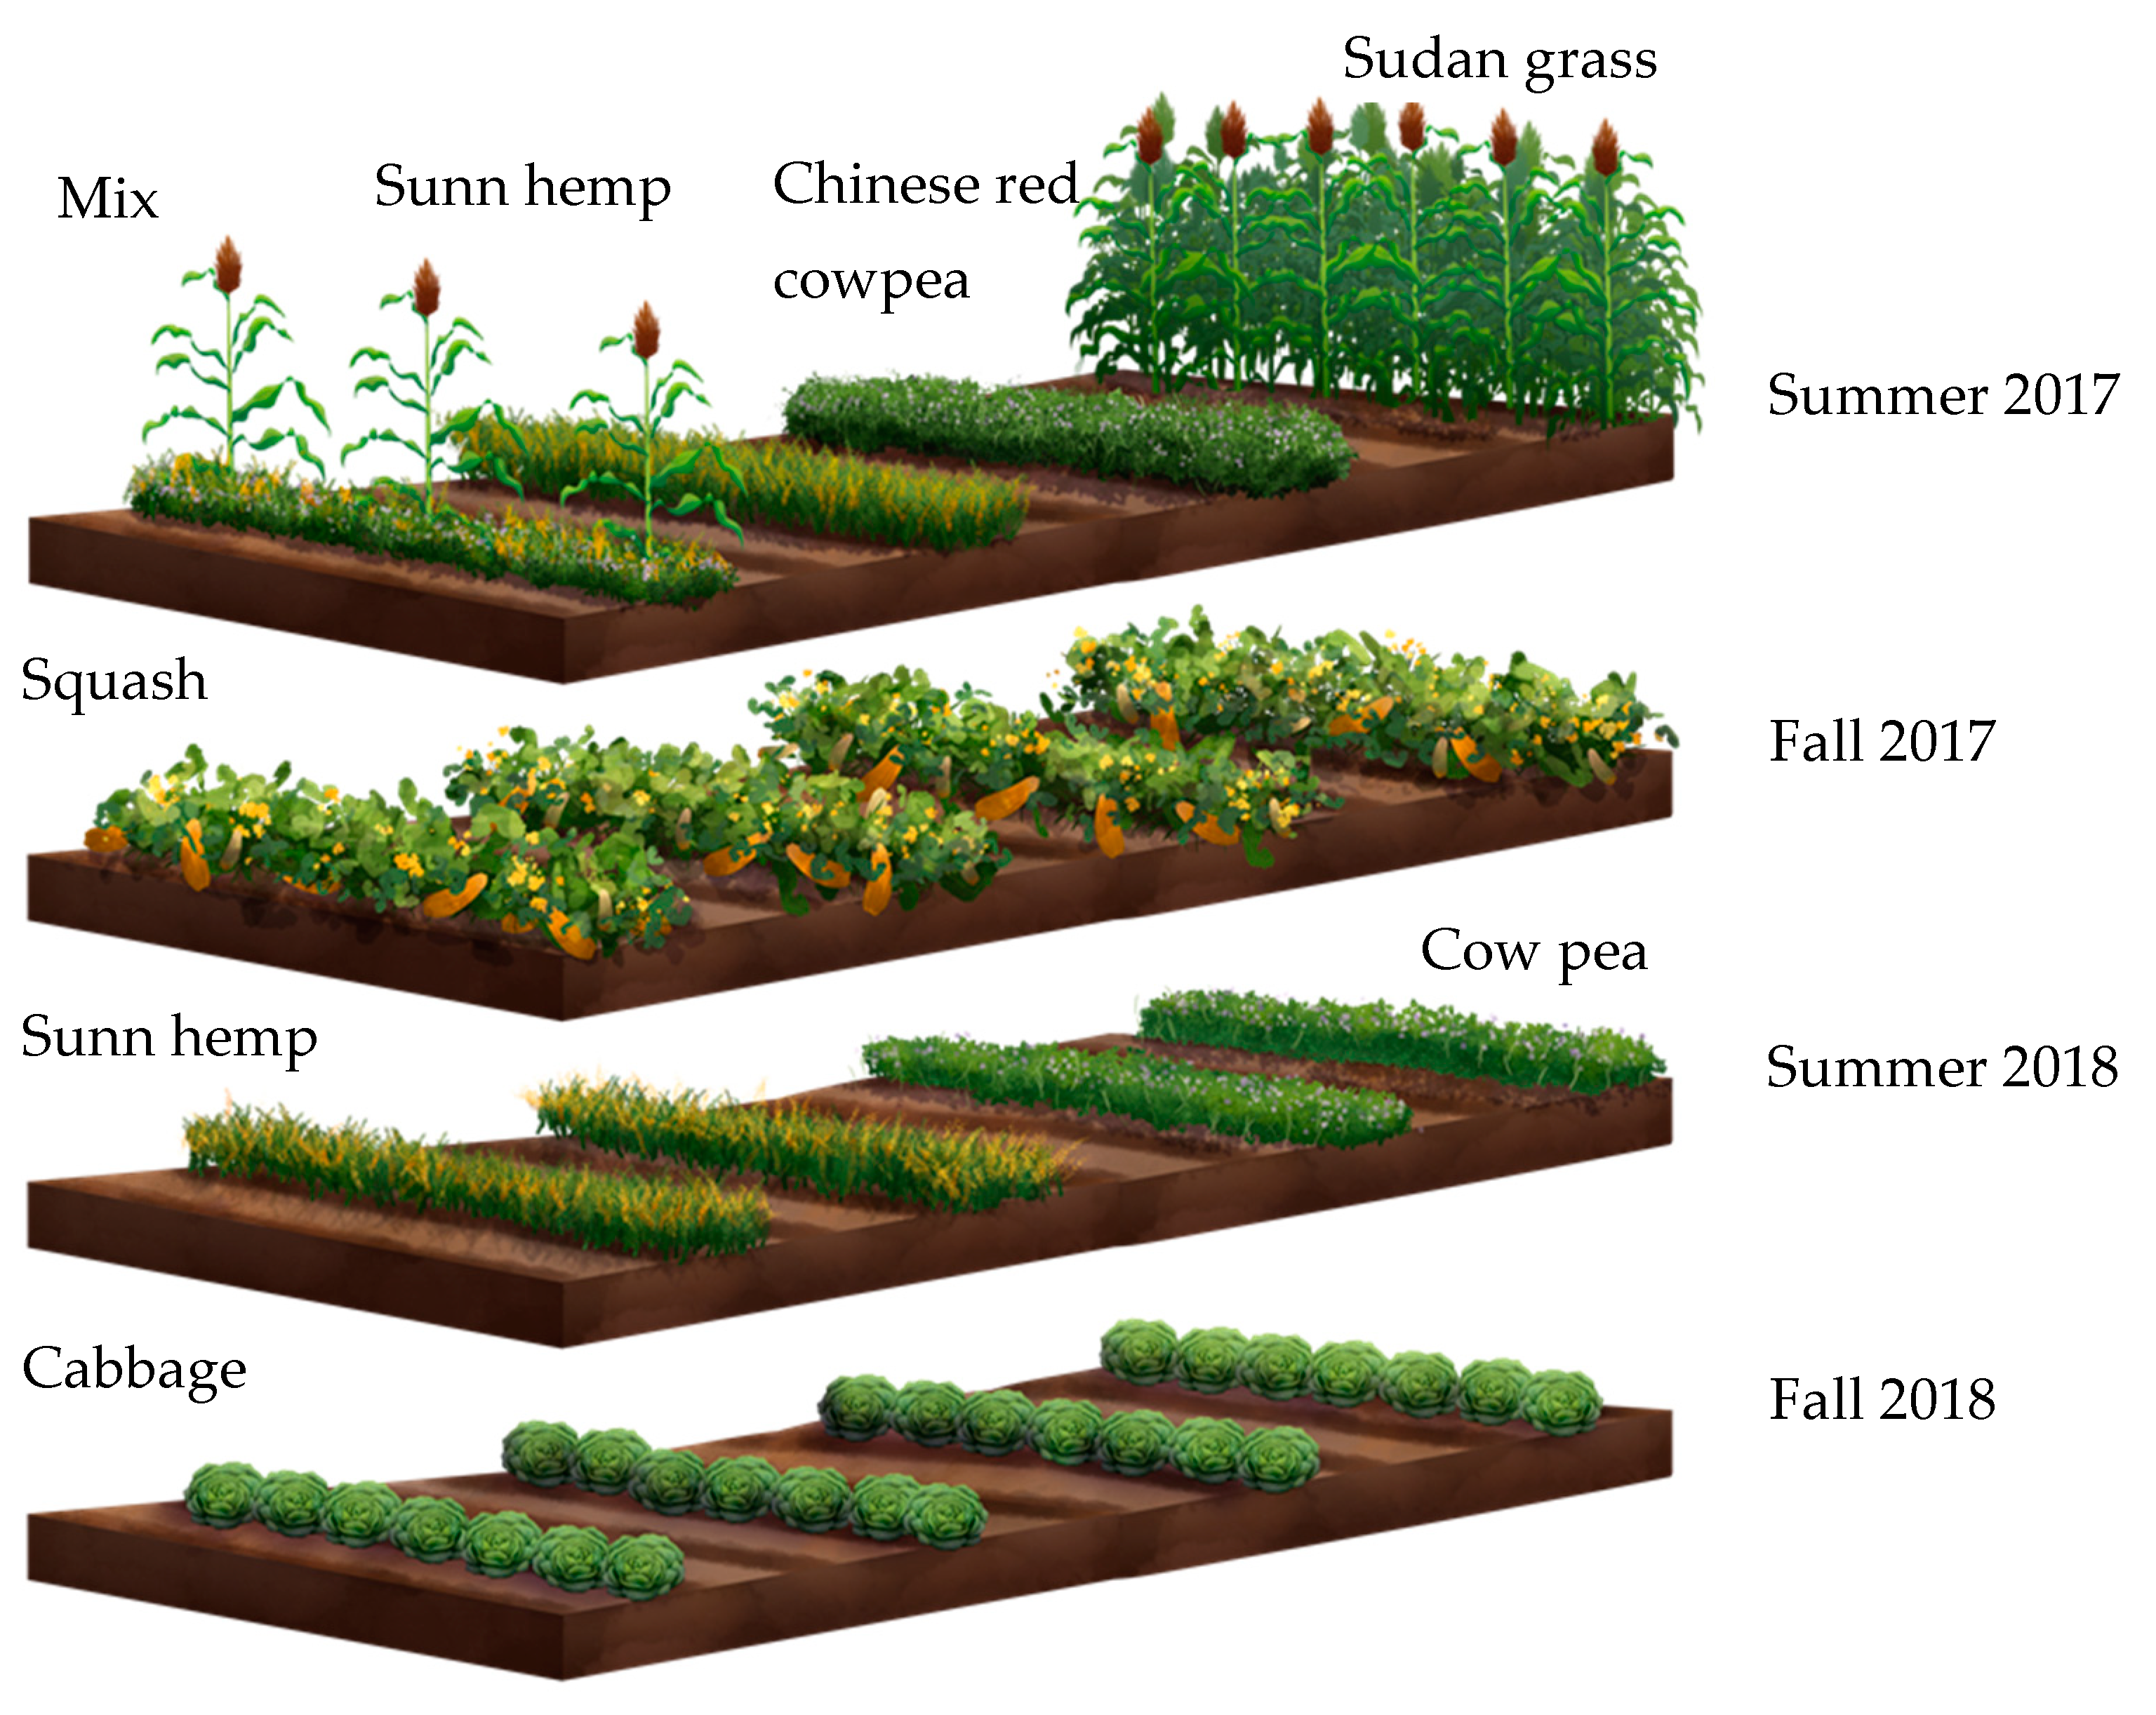
Figure 2.
Results of herbivore abundance pooled from all traps by different cover crop treatments during Summer 2017. Data were analyzed using the generalized linear model and means were separated using post-hoc tests at a P value of 0.05. Different treatments are represented in different colors in the graph. Bars with different lowercase letters denote statistically significant differences at P value of 0.05. Details are included in Table 3.

Figure 3.
Results of damage levels on cash crop (squash) during Fall 2017 based on previous cover crop. Data were analyzed using a generalized linear model and means were separated using post-hoc tests at a P value of 0.05. Different treatments are represented in different colors in the graph. Bars with different lowercase letters denote statistically significant differences at P value of 0.05. Details are included in Table 3.

Figure 4.
Results of damage levels on the cover crops during the early and late season during summer 2017. Data were analyzed using a generalized linear model and means were separated using post-hoc tests at a P value of 0.05. Different treatments are represented in different colors in the graph. Bars with different lowercase letters denote statistically significant differences at P value of 0.05. Details are included in Table 3.

Figure 5.
Results of height of cover crops during the summer 2018. Data were analyzed using a generalized linear model and means were separated using post-hoc tests at a P value of 0.05. Different treatments are represented in different colors in the graph. Bars with different lowercase letters denote statistically significant differences at P value of 0.05. Details are included in Table 3.

Figure 6.
Results of the biomass of cover crops during summer 2018. Data were analyzed using a generalized linear model and means were separated using post-hoc tests at a P value of 0.05. Different treatments are represented in different colors in the graph. Bars with different lowercase letters denote statistically significant differences at P value of 0.05. Details are included in Table 3.

Figure 7.
Results of damage levels on cash crop (squash) during Fall 2018 based on previous cover crops. Data were analyzed using a generalized linear model and means were separated using post-hoc tests at a P value of 0.05. Different treatments are represented in different colors in the graph. Bars with different lowercase letters denote statistically significant differences at P value of 0.05. Details are included in Table 3.

Figure 8.
Results of the insect abundance (based on their functional role) at the early and late season during the year 2 (2018). (A–C) represent mean abundance of total insects comprising of (a) all the insects irrespective of their taxonomic orders, (b) beneficial insects- including predators, parasitoids and pollinators and (c) herbivorous insects collected. No significant difference was found for total, beneficial, or herbivorous insects when compared early and late during the season. Data were analyzed using a generalized linear model and treatment means were separated using post-hoc tests at a P value of 0.05. Different treatments are represented in different colors in the graph. Bars with different lowercase letters denote statistically significant differences at P value of 0.05, while ns denotes non-significant results. Details are included in Table 3.

Figure 9.
Results of insect abundance (based on their functional role) by cover crop during the year 2 (2018). (A–C) represent mean abundance of total insects comprising of (a) all the insects irrespective of their taxonomic orders, (b) herbivorous insects including damaging insect pests and (c) beneficial insects- including predators, parasitoids and pollinators collected. (a) shows total insects among control, cowpea, and sunn hemp were significantly different; (b) shows cowpea and sunn hemp had significantly more herbivorous insects than control; (c) shows beneficial insects were not significantly different among the three crops. Data were analyzed using a generalized linear model and means were separated using post-hoc tests at a P value of 0.05. Different treatments are represented in different colors in the graph. Bars with different lowercase letters denote statistically significant differences at P value of 0.05, while ns denotes non-significant results. Details are included in Table 3.

Table 1.
Cover crop treatments, species, crop types, and seeding rate used in the study.
| Cover Crop Treatment | Crop Type | Seeding Rate (kg/ha) |
|---|---|---|
| Sudangrass (SG) | Grass | 45 |
| Cowpea (CP) | Legume | 28 |
| Sunn hemp (SH) | Legume | 45 |
| Mix (Sudangrass + Cowpea + Sunn hemp) | - | 16 + 10 + 16 |
| Control (C) | - | - |
Table 2.
Summary of different crop treatments and traits observed for data collection and time of data collection with respect to the season and year. CP, SH, and SG are abbreviations used for Chinese red cowpea, Sunn hemp and Sudangrass, respectively. Years 1 and 2 refer to the years 2017 and 2018, respectively.
| Year | Season | Crop | Frequency | Data Collected |
|---|---|---|---|---|
| 1 | Summer | Cover crops: CP, SH, SG, Mix | Early and late in season | Herbivores and Beneficial insects |
| Fall | Cash crop: Squash | Early and late in season | Herbivore damage | |
| 2 | Summer | Cover crops: CP and SH | Early and late in season | Plant height, Herbivore damage, Biomass |
| Fall | Cash crop: Cabbage | Early and late in season | Herbivores and Beneficial insects |
Table 3.
Results of statistical analyses to examine the effects of cover crops, time of season and their interaction on the insect diversity, damage levels and growth traits in cover crops and cash crops over two years and four seasons.
Table 3.
Results of statistical analyses to examine the effects of cover crops, time of season and their interaction on the insect diversity, damage levels and growth traits in cover crops and cash crops over two years and four seasons.
| Time | Trait | Test Statistic | P Value |
|---|---|---|---|
| 2017 Cover crop | Total insects (Time) | F = 0.53, df = 2 | 0.598 |
| Total insects (Crop) | F = 1.41, df = 4 | 0.286 | |
| Beneficial insects (Time) | F = 4.98, df = 2 | 0.025 | |
| Beneficial insects (Crop) | F = 1.13, df = 4 | 0.387 | |
| Herbivores (Time) | F = 1.83, df = 2 | 0.199 | |
| Herbivores (Crop) | F = 3.93, df= 4 | 0.026 | |
| 2017 Cash crop | Damage (Early season) | F = 4.36, df = 4 | 0.015 |
| Damage (Mid season) | F = 1.58, df = 4 | 0.230 | |
| Damage (Late season) | F = 0.26, df = 4 | 0.896 | |
| 2018 Cover crop | Height (Time) | F =117.51, df =1 | 0.000 |
| Height (Crop) | F =617.74, df = 1 | 0.000 | |
| Height (Time* Crop) | F =53.73, df =1 | 0.000 | |
| Damage (Crop) | F = 0.09, df = 1 | 0.762 | |
| Damage (Time* Crop) | F = 225.83, df = 1 | 0.000 | |
| Biomass | t = 3.96, df = 31 | 0.000 | |
| 2018 Cash crop | Biomass | F = 4.6, df = 2 | 0.013 |
| Total insects (Time) | F = 0.37, df = 1 | 0.548 | |
| Total insects (Cover crop) | F = 8.59, df = 2 | 0.002 | |
| Cash crop | F =1.14, df = 2 | 0.337 | |
| Beneficial’s (Time) | F = 0.74, df = 1 | 0.397 | |
| Cover crop | F = 2.6, df = 2 | 0.095 | |
| Cash crop | F = 0.31, df = 2 | 0.735 | |
| Herbivores (Time) | F = 0.92, df = 1 | 0.348 | |
| Herbivores (Cover crops) | F = 9.17, df = 2 | 0.001 | |
| Herbivores (Cash crop) | F = 1.98, df = 2 | 0.160 |
Asterisk (*) denotes the interaction between two treatments. Bold values represent statistically significant effects at P < 0.05.
© 2020 by the authors. Licensee MDPI, Basel, Switzerland. This article is an open access article distributed under the terms and conditions of the Creative Commons Attribution (CC BY) license (http://creativecommons.org/licenses/by/4.0/).
Share and Cite
MDPI and ACS Style
Martinez, L.; Soti, P.; Kaur, J.; Racelis, A.; Kariyat, R.R. Impact of Cover Crops on Insect Community Dynamics in Organic Farming. Agriculture 2020, 10, 209. https://doi.org/10.3390/agriculture10060209
AMA Style
Martinez L, Soti P, Kaur J, Racelis A, Kariyat RR. Impact of Cover Crops on Insect Community Dynamics in Organic Farming. Agriculture. 2020; 10(6):209. https://doi.org/10.3390/agriculture10060209
Chicago/Turabian StyleMartinez, Lili, Pushpa Soti, Jasleen Kaur, Alexis Racelis, and Rupesh R. Kariyat. 2020. "Impact of Cover Crops on Insect Community Dynamics in Organic Farming" Agriculture 10, no. 6: 209. https://doi.org/10.3390/agriculture10060209
Note that from the first issue of 2016, this journal uses article numbers instead of page numbers. See further details here.