Article

Monitoring and Modelling Analysis of Maize (Zea mays L.) Yield Gap in Smallholder Farming in Ghana

1
CSIR Crops Research Institute, Box 3785 Kumasi, Ghana
2
Department of Plant, Soil and Microbial Sciences, Michigan State University, 1066 Bogue St., East Lansing, MI 48824, USA
3
CSIRO Agriculture and Food, GPO Box 1700, Canberra ACT 2601, Australia
4
Forschungszentrum Jülich, Institute of Bio-Geosciences 2, Plant Sciences, 52425 Jülich, Germany
*
Author to whom correspondence should be addressed.
Agriculture 2020, 10(9), 420; https://doi.org/10.3390/agriculture10090420
Submission received: 11 August 2020 / Revised: 7 September 2020 / Accepted: 16 September 2020 / Published: 22 September 2020

Abstract

:
Modelling and multiple linear regression were used to explore the reason for low maize yield in the Atebubu-Amantin and West Mamprusi Districts of Ghana, West Africa. The study evaluated maize yields on twenty farms against measures of soil fertility, agronomic attributes and soil water availability. Correlations between yield, soil fertility, rain, crop density, and weed biomass, were low, and no single factor could explain the low yields. A 50-year virtual experiment was then set up using the Agricultural Production Systems Simulator (APSIM) to explore the interactions between climate, crop management (sowing date and nitrogen fertilization) and rooting depth on grain yield and nitrate (NO3-N) dynamics. The analysis showed that a lack of optimal sowing dates that synchronize radiation, rainfall events and nitrogen (N) management with critical growth stages explained the low farm yields.

1. Introduction

In the past 50 years, global wheat, maize and rice yields has increased as a result of crop intensification involving improved varieties, increased fertilizer inputs, production of two or more crops per year on the same piece of land, and irrigation [1,2,3,4]. Increases in maize yield of sub-Saharan African smallholders, however, were insignificant and remained with the largest yield gap in the world [5]. On average, the yield gap is 20%–36% below potential yield [6,7,8,9]. The key factors causing low yield are biophysical and management practices that lead to frequent nutrient, water, pest and disease stresses [7,8]. In South-East Asia, achievable maize yield is still about 0.9 t ha−1 lower than potential yield, resulting from field management and climate change. Site-specific nutrient management and climate resilient germplasm has been observed to be a potential way forward for sustainable intensification of maize production by smallholder farmers [9,10,11]. Improving smallholder farmers’ yield, especially in Africa and Asia, is a critical part of future global food security.
Maize is an important staple food in Ghana accounting for more than 50% of total cereal production in the country and is grown in all agro-ecological zones [12]. In northern Ghana, where the annual rainfall averages 900 mm, simulation modelling evaluated under water non-limiting conditions suggest that farmers’ yields are 59–75% below the potential [13]. The low productivity is attributed to poor soil fertility, management and climate variability [13,14]. Closing the yield gaps for maize is a priority for agricultural researchers in Ghana.
Various interventions have been proposed to address the maize yield gap in smallholder farms in Ghana. Application of N and P fertilizer, retention of crop residues, adopting minimum tillage that enhances soil organic carbon, total soil N and P concentrations, are likely to increase yields to be closer to the water-limited yield potentials [15]. However, adoption of these management options has been constrained by socio-economic limitations that include high costs, labor constraints, high transport costs, lack of credit facilities and lack of knowledge and technology [16,17,18]. Even though many authors agreed that nutrient supply rather than water is the limiting factor for yield in Ghana, it is observed that reduced maize yield on well-fertilized soil is due to highly variable rainfall [19,20].
Maize breeding programs in Ghana endeavor to bridge the yield gap with improved varieties. However, the potential of the new genetic material can only be realized if crop management, soil water and agronomic management are optimal. Improved varieties have yield advantages over traditional varieties due to superior root architecture, which provides the crop with increased capacity to extract soil nutrients and water and withstand abiotic stresses [21]. Over 40 maize varieties have been released since 1983. Maize cv. Obatanpa (CSIR—Crops Research Institute of Ghana) is the dominant variety planted by farmers and has a grain yield potential of 6 t ha−1 [22,23]. Although most farmers have adopted Obatanpa, the current average yield of maize in Ghana stands at 1.99 t ha−1, far below the potential yield of 6 t ha−1 [22,24].
The large yield gaps in African smallholder farming systems are due to the genetic-environment-management interactions [6]. Farmers′ priorities regarding labor allocation during sowing, fertilizer application and weeding are the most important factors that affect the actual yield. For example, delayed sowing due to insufficient labor exposes critical stages of crop development to periods of drought, low radiation, extreme temperature and water deficits which limit yield potential [25,26]. It is, however, challenging to understand the complex interaction and to determine which constraint is more critical to yield increase when there are multiple interacting constraints [7].
Smallholder farmers in Ghana often achieve lower yield for given management practices, sites, and varieties. Several studies have shown the low maize yield is a result of interactions between three biophysical constraints: (i) poor soil fertility, (ii) low plant available water capacity, and (iii) the variability of climatic factors. Questions have been raised about whether the low crop yields are related to soil fertility, soil water, crop density, or competition from weeds. Another question is whether the interactions between in-crop rainfall, radiation, sowing time, soil water stress, NO3-N leaching, and management are the main cause of low yield. It is, therefore, possible to hypothesize that coinciding sowing windows with high radiation growth period and rainfall on fertility unconstrained soils would improve maize yield. The interaction between these biophysical constraints can be explored using long-term field trials and simulation modelling [27]. Simulation models give the flexibility of evaluating management options over space and time with fewer resources as compared with field experiments [28,29,30]. The Agricultural Production Systems Simulator (APSIM) has been used in Sub Saharan Africa to explore opportunities related to soil fertility, sowing date, crop management and climate change in smallholder farming systems [31,32,33,34,35,36,37,38,39]. The objective of this research was to investigate the interaction of in-season rainfall, radiation, sowing date, N management, and root depth on grain yield and N dynamics, and examine the main constraints of maize production in West Mamprusi and Amatin Atebubu, in the Middle and Northern Ghana.

2. Materials and Methods

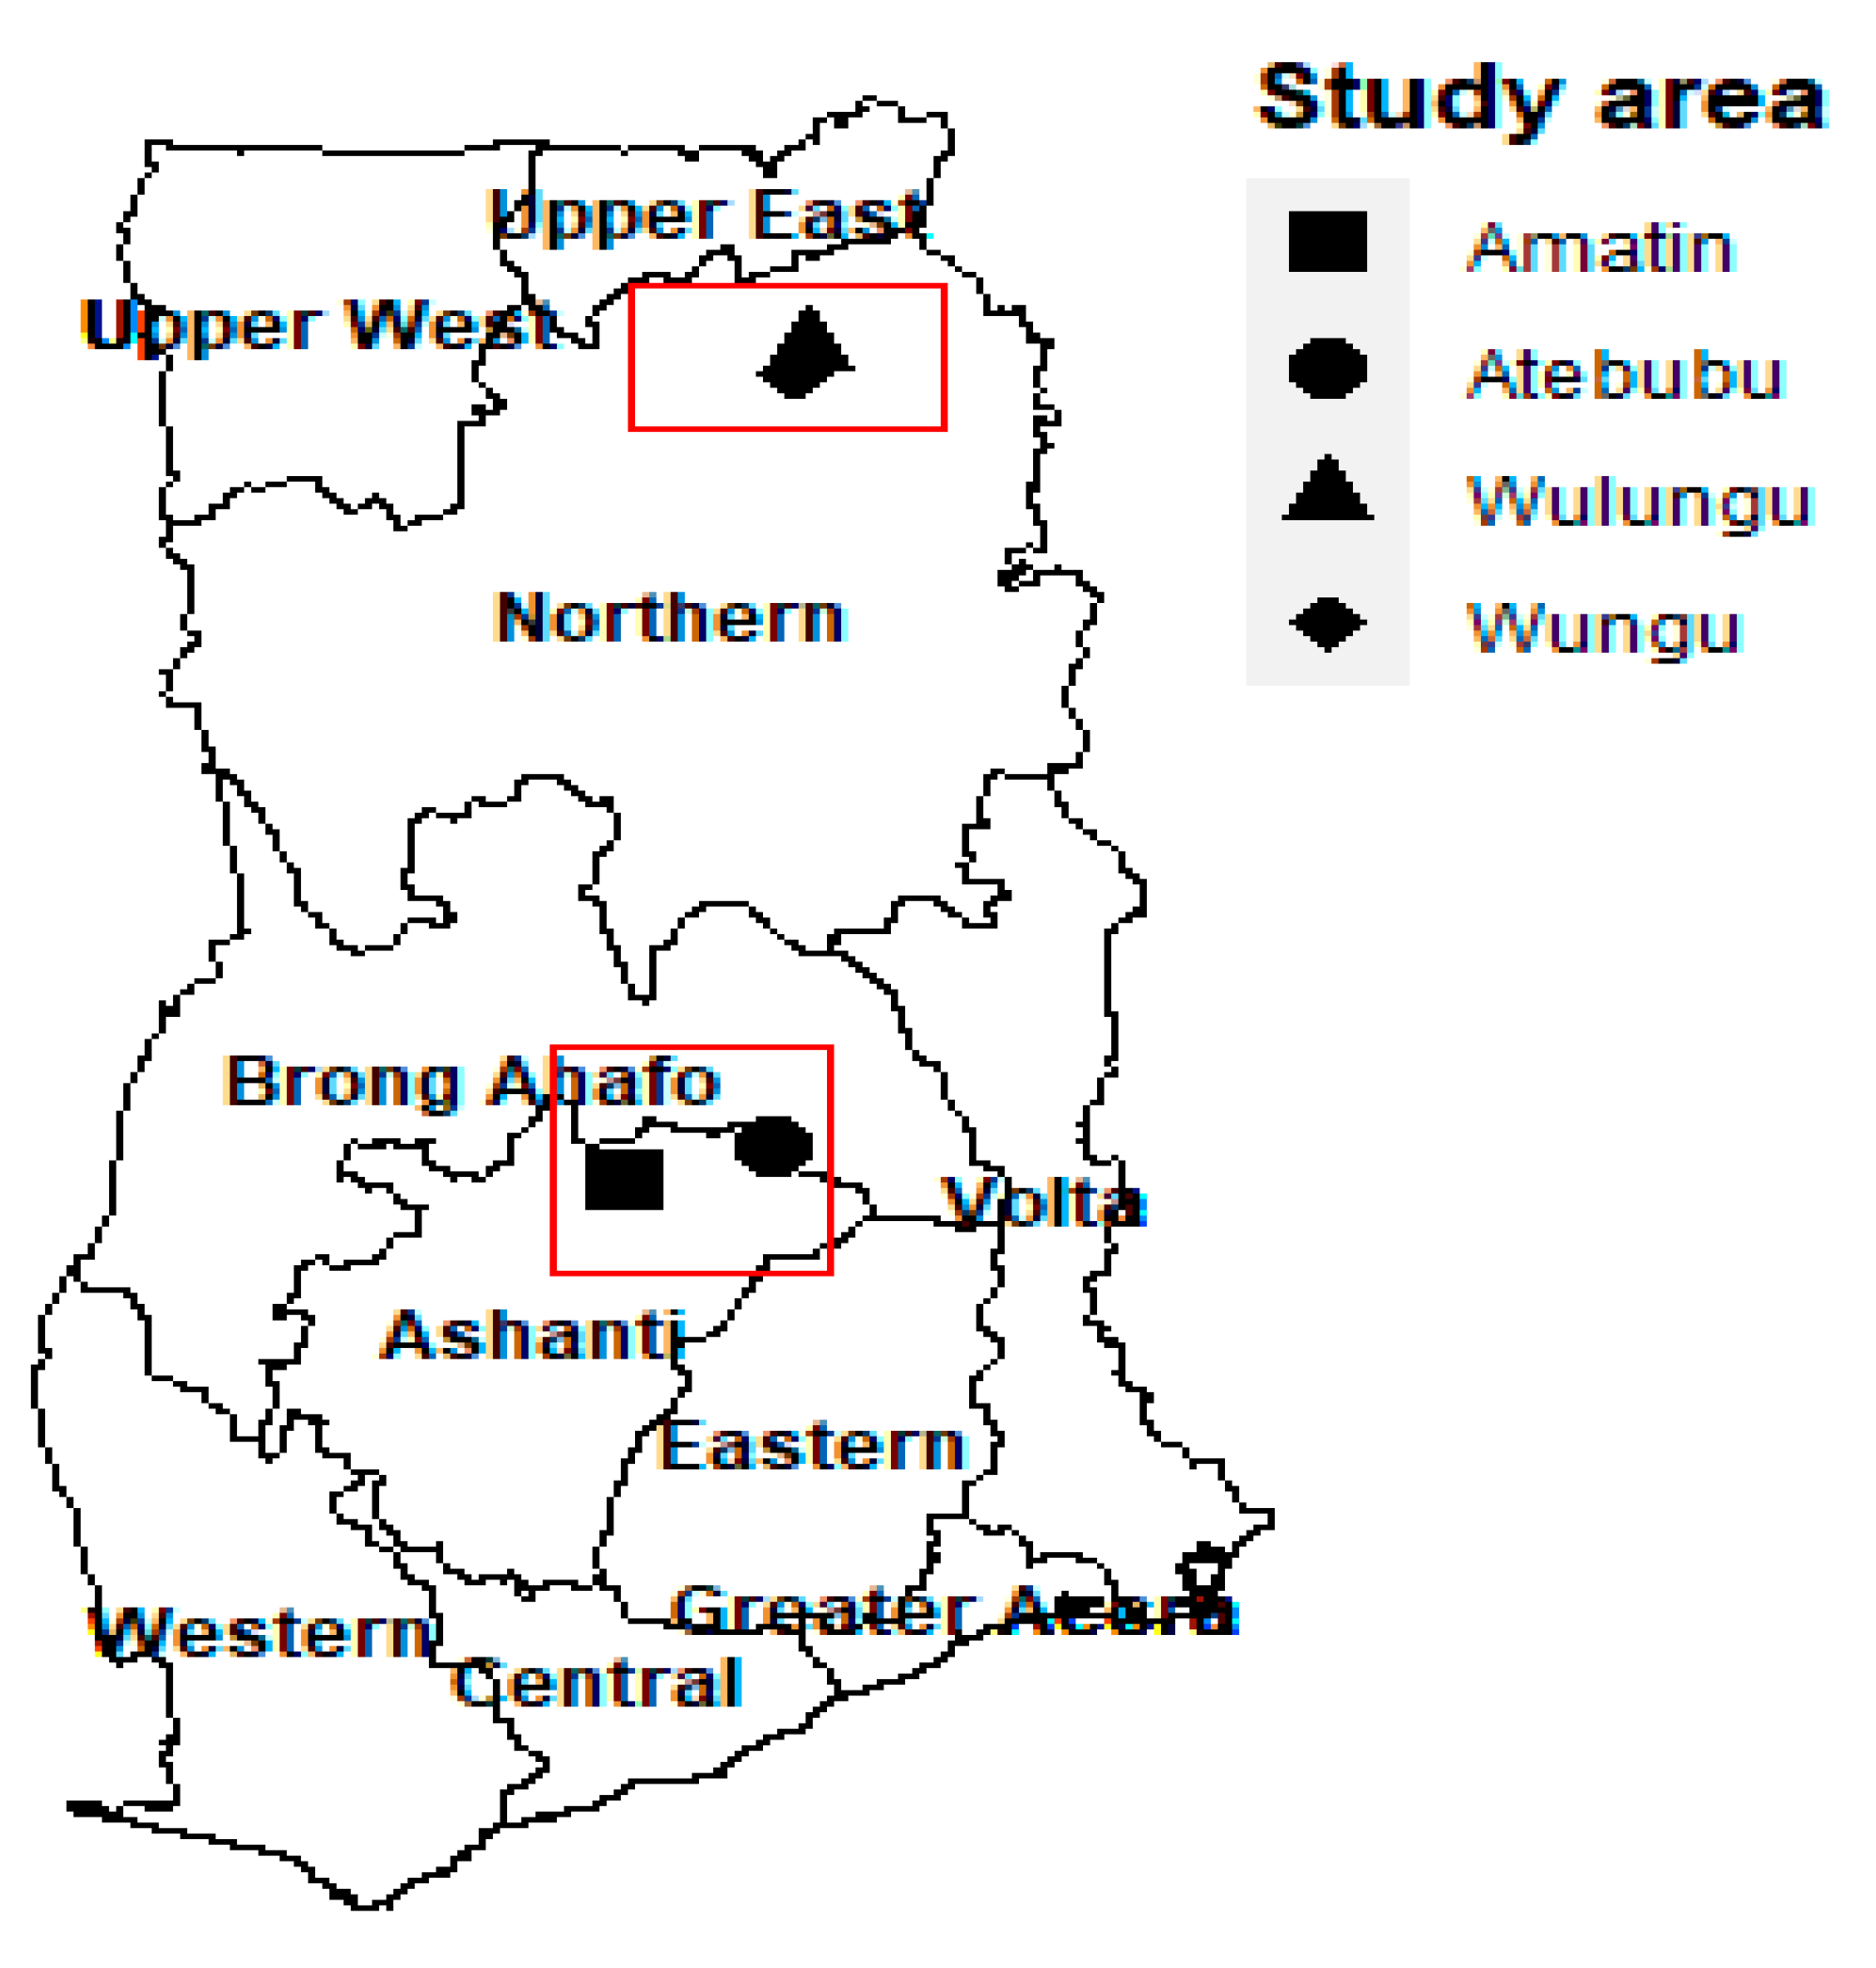
2.1. Site Description and Climate

The relationship between maize yield, soil water and fertility was investigated in the forest—savannah transition and the Guinea savannah agroecological zones of Ghana. The study was conducted at four locations in the 2012 and 2013 cropping seasons (Figure 1): Atebubu (7°45′ N, 0°59′ W), Amantin (7°32′ N, 1°12′ W) (Atebubu-Amantin district) are located in the forest–savannah transition zone, and Wungu (10°19′ N, 0°51′ W) and Wulugu (10°27′ N, 0°47′ W) (West Mamprusi districts) in the Guinea savannah agroecological zone of Ghana. The forest—savannah transition zone is characterized by well-distributed bimodal rainfall with an annual average of 1500 mm (Figure 2). The mean monthly temperature during the growing season ranges from 22 to 34 °C. The Guinea savannah agroecological zone is characterized by low, erratic and poorly distributed monomodal rainfall. The mean annual rainfall is 1100 mm and the daily mean minimum and maximum temperatures are 22 and 35 °C, respectively [24].

2.2. Field Measurements

2.2.1. Crop Data

Maize yields were measured on 20 farms from the center of two rows of each field. Farmers planted maize (cv. Obatanpa) in most of the study areas. Plant density (plant ha−1) and weed pressure (kg ha−1) were also recorded. The maize cobs were harvested 74–143 days after sowing. The sowing and harvesting dates and fertilizer rates applied by the farmers are summarized in Table 1 and Table 2.

2.2.2. Soil Data

Soil fertility indices of total nitrogen (TN), pH, organic matter (SOC), soil phosphorus (P), and potassium (K) were measured in the 0–0.30 and 0.30–0.60 m zone on twenty farms. Total N was determined using the Kjeldahl method, soil pH was measured using a pH meter (1:1, H2O), organic carbon (OC) using the Walkley and Black method [40,41]. Soil available P was determined using the Bray method [42], and available K using flame photometry [41]. Exchangeable cations were determined using the ammonium acetate method [41]. Soil properties are summarized in Table 3.
Soil matric potentials (ψ) were measured using Watermark sensors (Irrometer Co., Riverside, CA, USA) at 0.30, 0.60, and 0.80 m depths in ten farmers’ field. A handheld watermark meter was used to read the sensors in the field. Additionally, Decagon 5TM (Decagon Devices, Inc., Pullman, WA, USA) soil water probes were installed at two farmers’ fields in each of the two sites at 0–0.30 and 0.30–0.60 m to determine crop lower limit (LL) and drained upper limit (DUL) of the soils. The sensors were connected to a datalogger and data were recorded hourly. The lower limit (LL) was determined at the end of the season when crops had extracted all the water available to it from the soil, whereas DUL or field capacity is the maximum amount of water the soil can hold against gravity. Plant available water (PAW) was calculated as the difference between LL and DUL in mm for each depth (mm). Soil water characteristics of the farmers’ field are summarized in Table 4. Two soil solution samplers were also installed at 0.30 and 0.60 m adjacent to each other and solutions were collected three times a week. Soil NO3-N concentration was measured by dipping test strips on each of the samples and reading the test strips with an RQflex Plus 10 [43].

2.3. Modelling Using APSIM

We used the cultivar parameters suggested for maize (cv. Obatanpa) [37]. The crop management data (sowing date, harvest date, range of N applied) were taken from the farmers’ field records (Table 1). A sowing density of 67,000 plants ha−1 and row spacing of 0.75 m were used in the model following recommended practices [44,45].
Although soil water content was measured in 10 farmers’ fields (Table 4), a representative soil hydraulic profile with a fine soil layer using those measured and soil parameters reported by MacCarthy et al. [37] for northern Ghana was used in APSIM (Table 5). Soil water was assumed to be the same for soil layers 0 to 0.30 m and 0.30 to 1.20 m deep as measurements were taken only at 0.30 and 0.60 m. Water availability was also assumed to decrease with soil depth, particularly below 0.30 m (Table 5).
Soil albedo, soil drainage, and runoff curve number values reported by MacCarthy et al. [38] were adjusted for the site. Soil water above the drainage upper limit was assumed to drain within one day to the next layer. Oxygen stress that crops would have experienced when the soil is saturated was not considered. The only stress that was simulated in APSIM was the reduction in yield due to water, N, climatic factors and root depth.
The root exploration factor (xfi), which determines the ability of roots to grow, proliferate and extract water from each layer, was assumed to be non-limiting to yield (Table 6).

Modelling Scenarios

The model was run for 3 combinations of virtual experiments: (i) application of six N rates (0 to 125 kg N ha−1, at 25 kg N ha−1 increments); (ii) root water extraction constrained at four rooting depths (0.30, 0.60, 0.90, and 1.20 m) using the soil parameter (kl) and (iii) seven sowing windows. For the 1.20 m rooting depth, root water extraction was considered non-limiting at all depths. For West Mamprusi (WM) and Amantin-Atebubu major season (AAMajor), five sowing months (March to July), whereas for Amantin-Atebubu minor season (AAMinor) two sowing months (August and September), were considered. For both sites, a sowing rule criterion was applied: sowing commenced after 25 mm of rainfall was recorded in the preceding five days. Simulations were carried out for each site using the maize (cv. Obatanpa) parameters, soil and long-term daily weather records (1950–2000; http://www.eu-watch.org/database). Soil water profiles were not reset to account for the effect of any rainfall after harvest and before next sowing.
For each site, biomass, yield, radiation interception, in-crop rainfall, sowing date, deep drainage, water stress, nitrogen stress and NO3-N leaching were considered as predictors of yield and were extracted for analysis. Temperature’s effects on crop thermal time were not separately included in the study because its effect on crop cycle was considered indirectly through crop yield. Multiple linear regression (MLR) analysis was used to identify the relationship between yield and the set of independent variables (rainfall, radiation, NO3-N leaching, and drainage). We performed statistical analyses with R version 3.3.0 [46]. The analysis was done for all N applications considering grain yield and biomass as response variables and in-crop rainfall, radiation interception, sowing window, leaching, drainage, water stress, and nitrogen stress as predictors.

3. Results

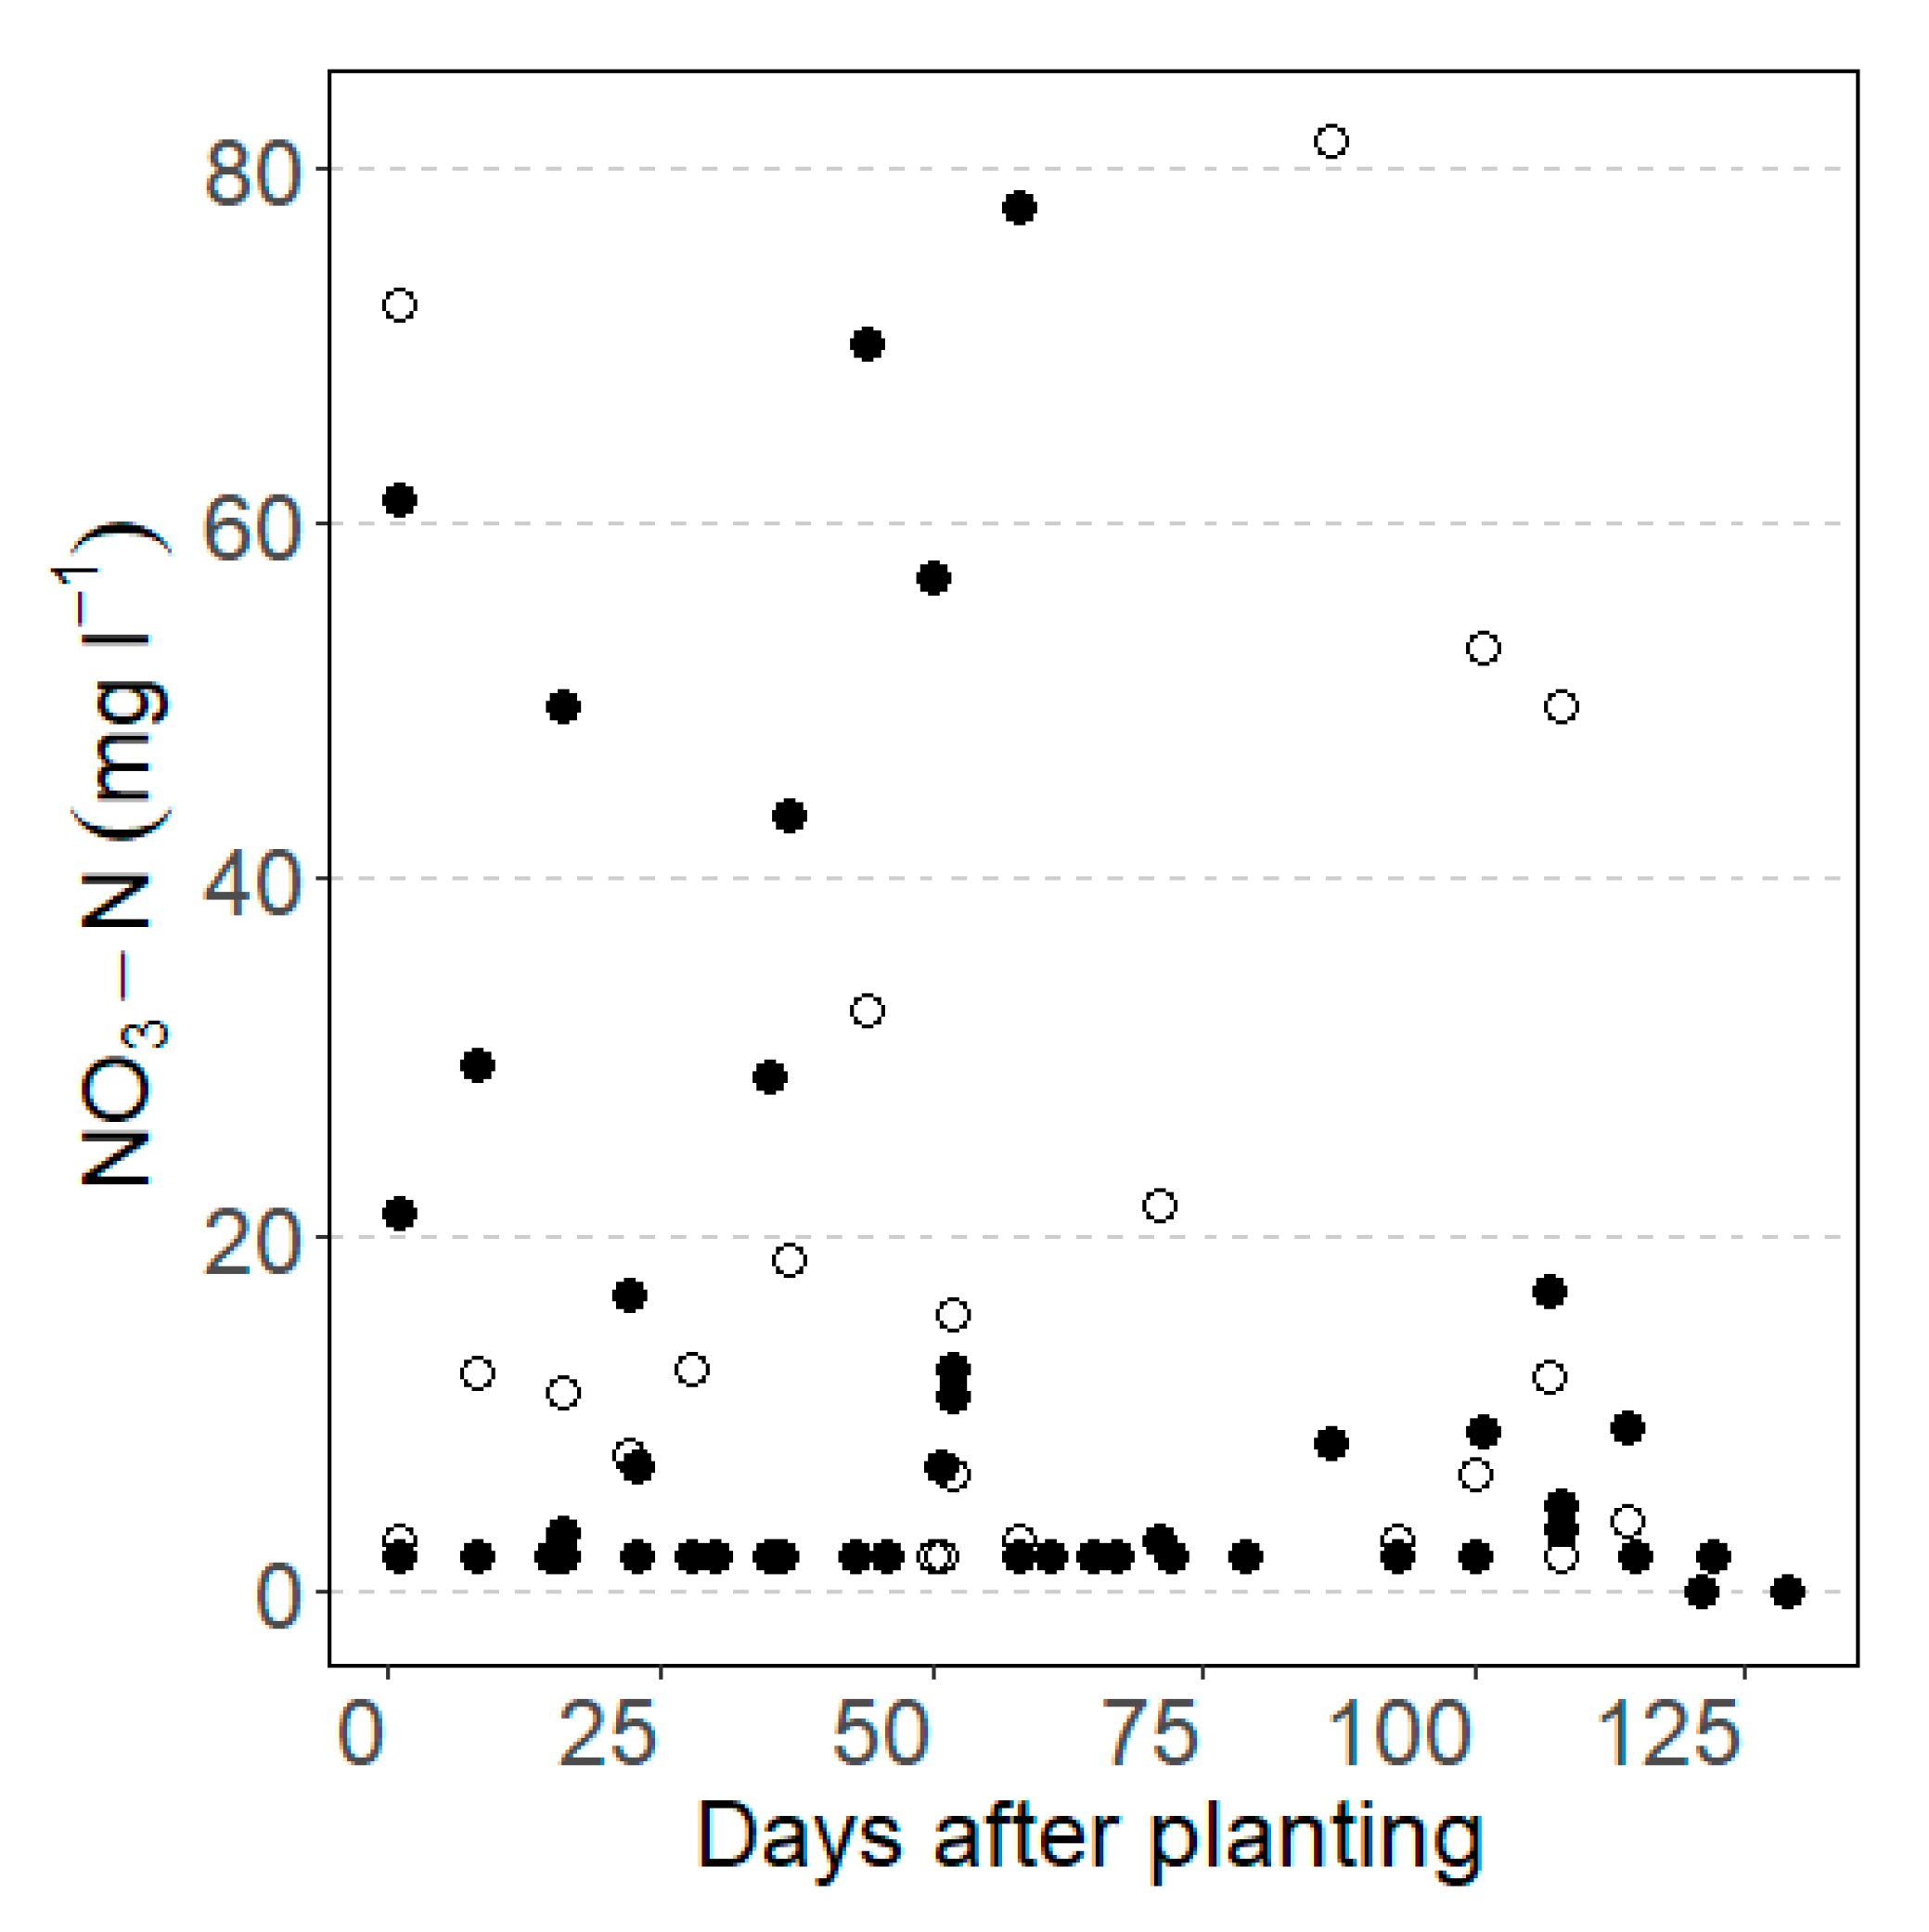
3.1. Observed Yield, Soil Water and Nutrients

Surveys of farmers involved in the trial showed that N fertilizer applications varied between 0 and 101 kg ha−1 in the Atebubu-Amantin district (Table 1) and between 0 and 76 kg ha−1 in the West Mamprusi district (Table 2). The two sources of N fertilizer used were compound fertilizer (15-15-15 kg ha−1 N-P205-K2O) and ammonium sulfate [(NH4)2SO4]. Ammonium sulfate was applied about six weeks after sowing as a top dressing.
The grain yield obtained by farmers plotted against explanatory variables of soil fertility, crop density, and weed pressure for the three sites is given in Figure 3. The soil was poor in terms of its fertility (P, N% and Org. C(%)), planting density varied among farmers (4 to 17 plants m−2), 75% of the fields were acidic and the weed pressure (volume) also varied between 200 and 800 kg ha−1 dry matter. None of these explanatory variables correlated with the farmers’ yields. Two farms that had very high plant densities in AAMajor (rainfall > 1000 mm) had poor yields, and none of the other variables measured could explain the low yields.
Figure 4 shows matric potentials (ψ) measured over time for the different sites. Matric potentials (ψ) between 0 and −25 kPa were considered as wet and the optimum soil water content is typically at field capacity, near −30 kPa in most agricultural soils. Figure 4b,d, and h show the soils to be generally wet and there was little, if any, water extraction from the sub-soil (0.60–0.80 m depth), as evidenced by no increase in the matric potential during the cropping season. The soil moisture measurements across the farmers’ field showed very few crops used sub-soil moisture (Figure 4a–f). In the wetter zone (Atebubu-Amantin), 38% of the farmers planted between March and May, and 62% of the farmers planted between July and September (Table 2).
Nitrate-N concentrations in farmers field at 0.30 and 0.60 m depth are shown in Figure 5. Of the farmers who applied fertilizer, 12.5% applied >75 kg N ha−1 and 25% applied 50–75 kg N ha−1. Relatively high concentrations of NO3-N (>60 mg L−1) were observed at 0.60 m depth early in the growing season. Given that there was little water extraction at this depth, we argue that NO3-N was not taken up by the crop (Figure 5). The wet profile (ψ > −25 kPa) and high NO3-N collected by the suction cups at 0.60 m is evidence that water moved down the profile. Suction samples collect water samples only when ψ > −40 kPa [39] and provide further evidence to suggest that the water was moving down the profile and leaching the NO3-N before it was taken up by the crop. The high NO3-N concentration observed 85 days after planting in one field corresponded with the wet state at 0.30 m.

3.2. Modelling Results

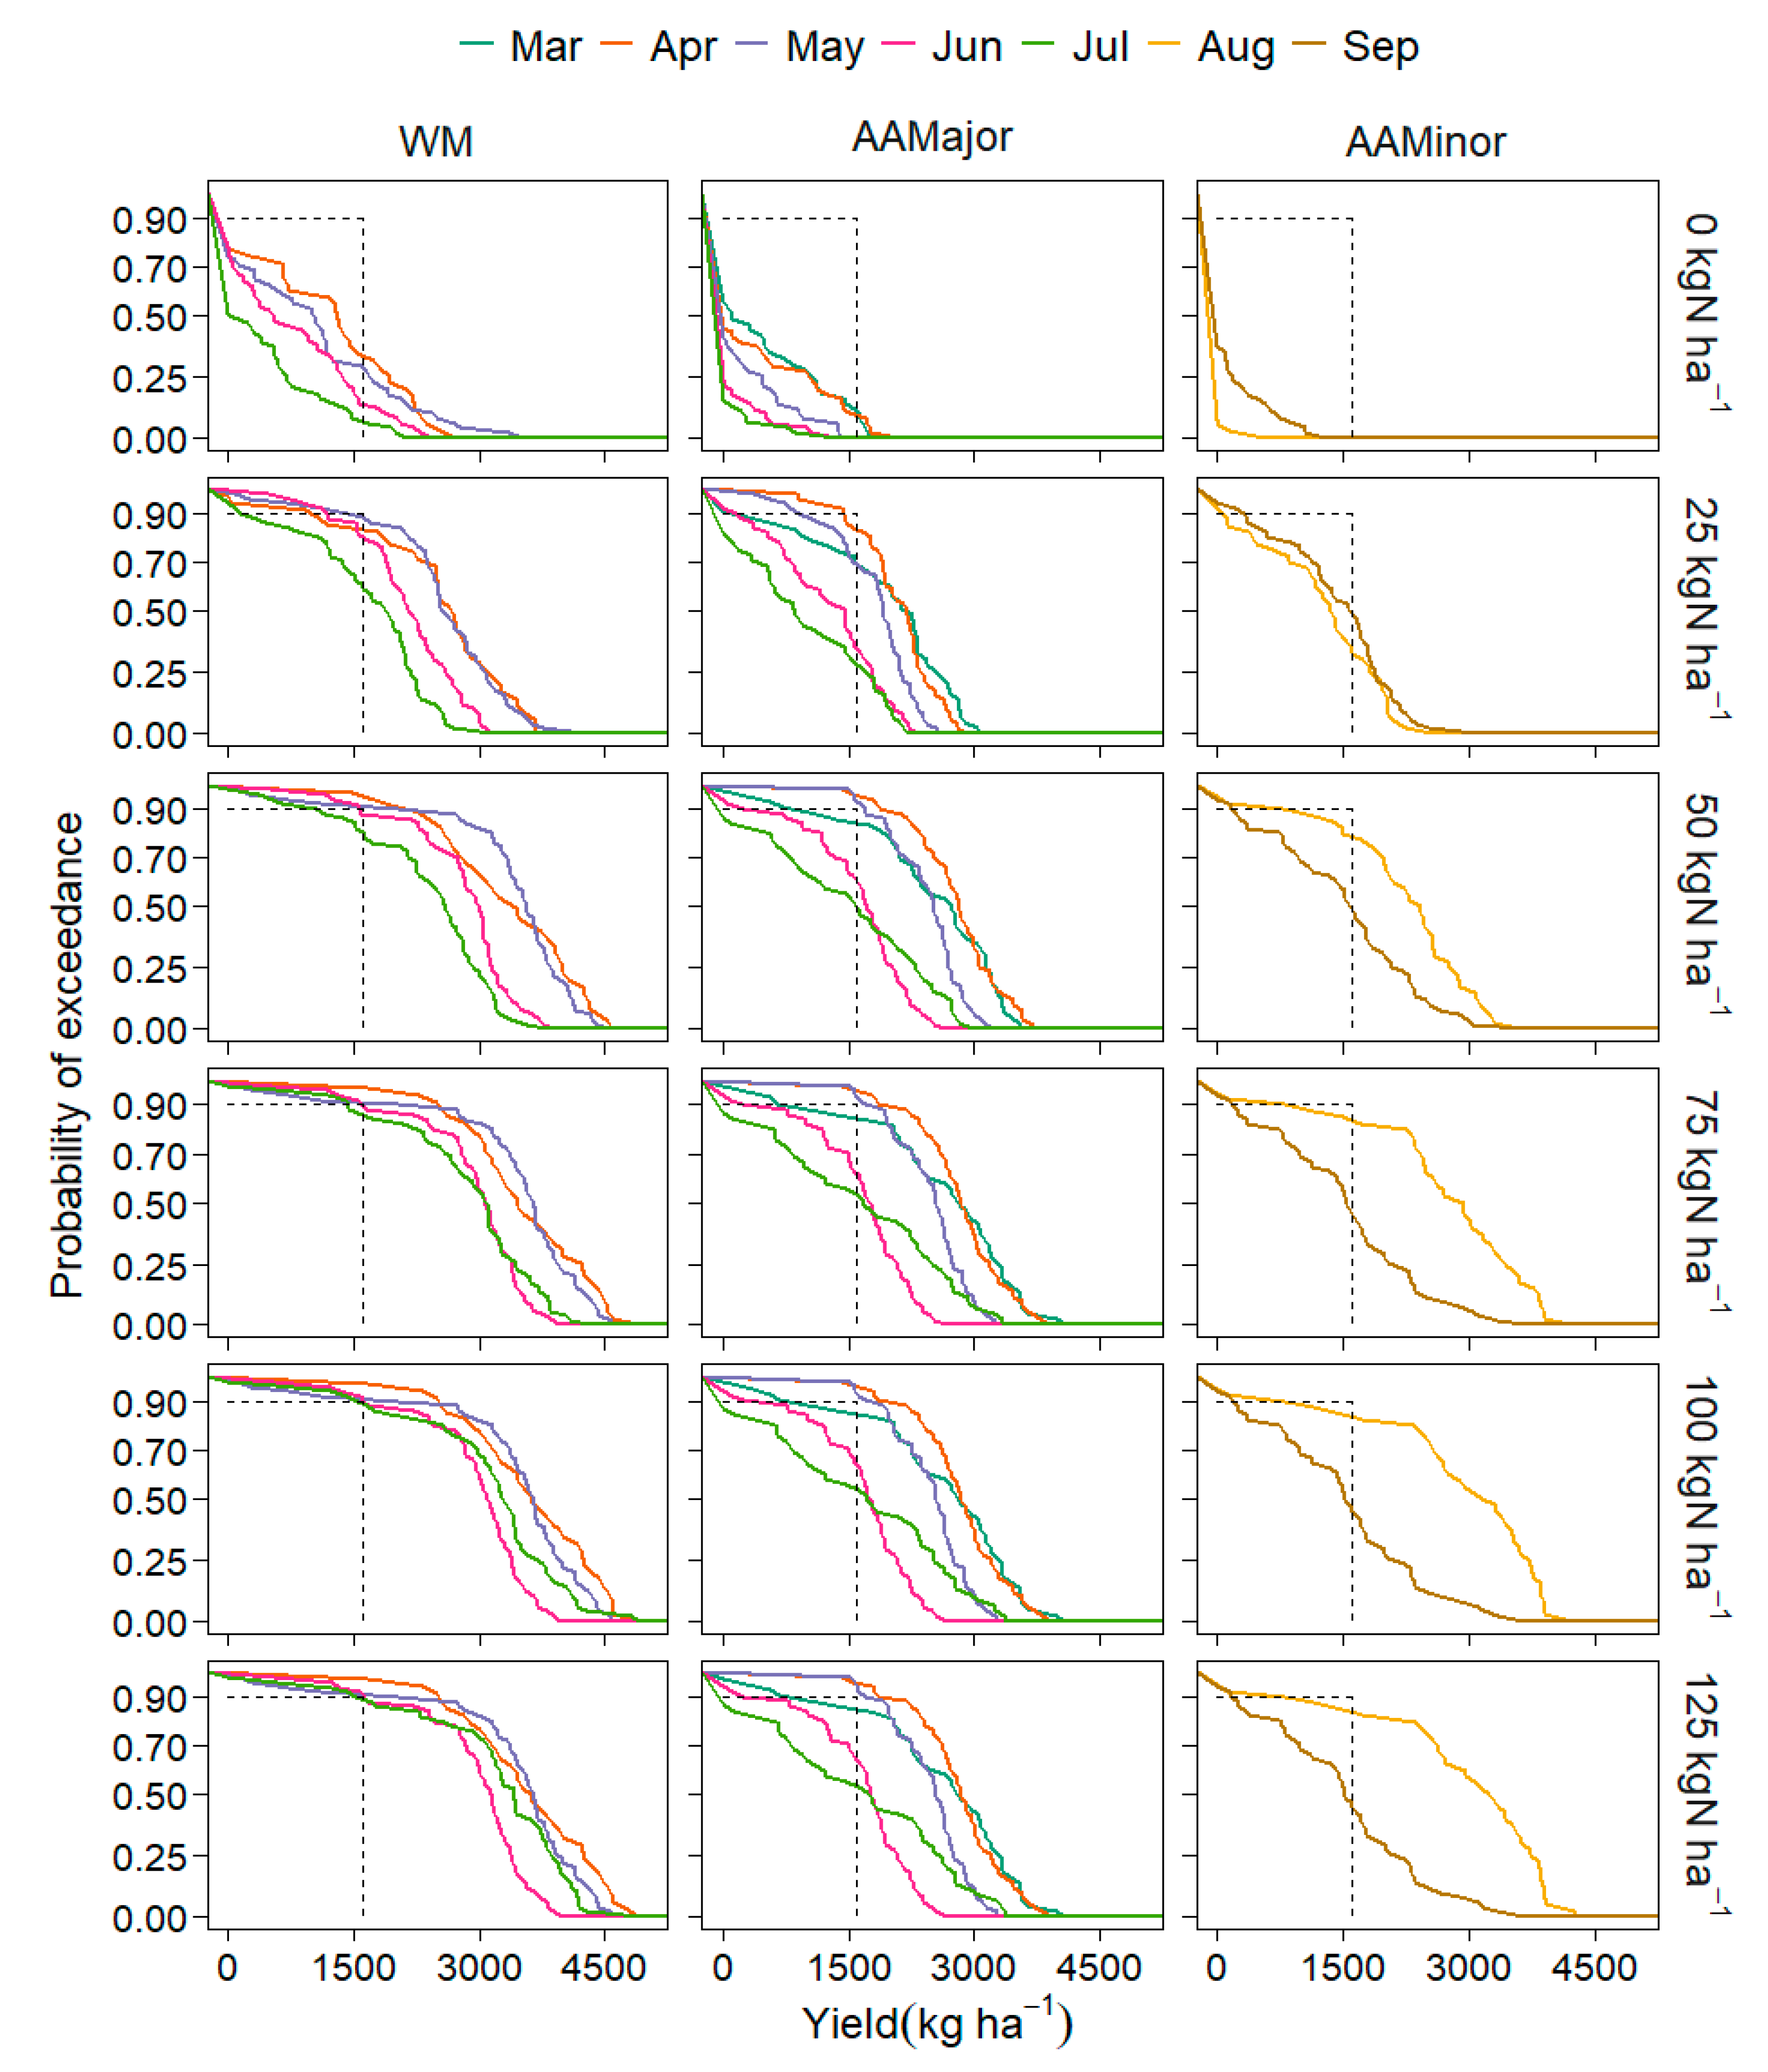
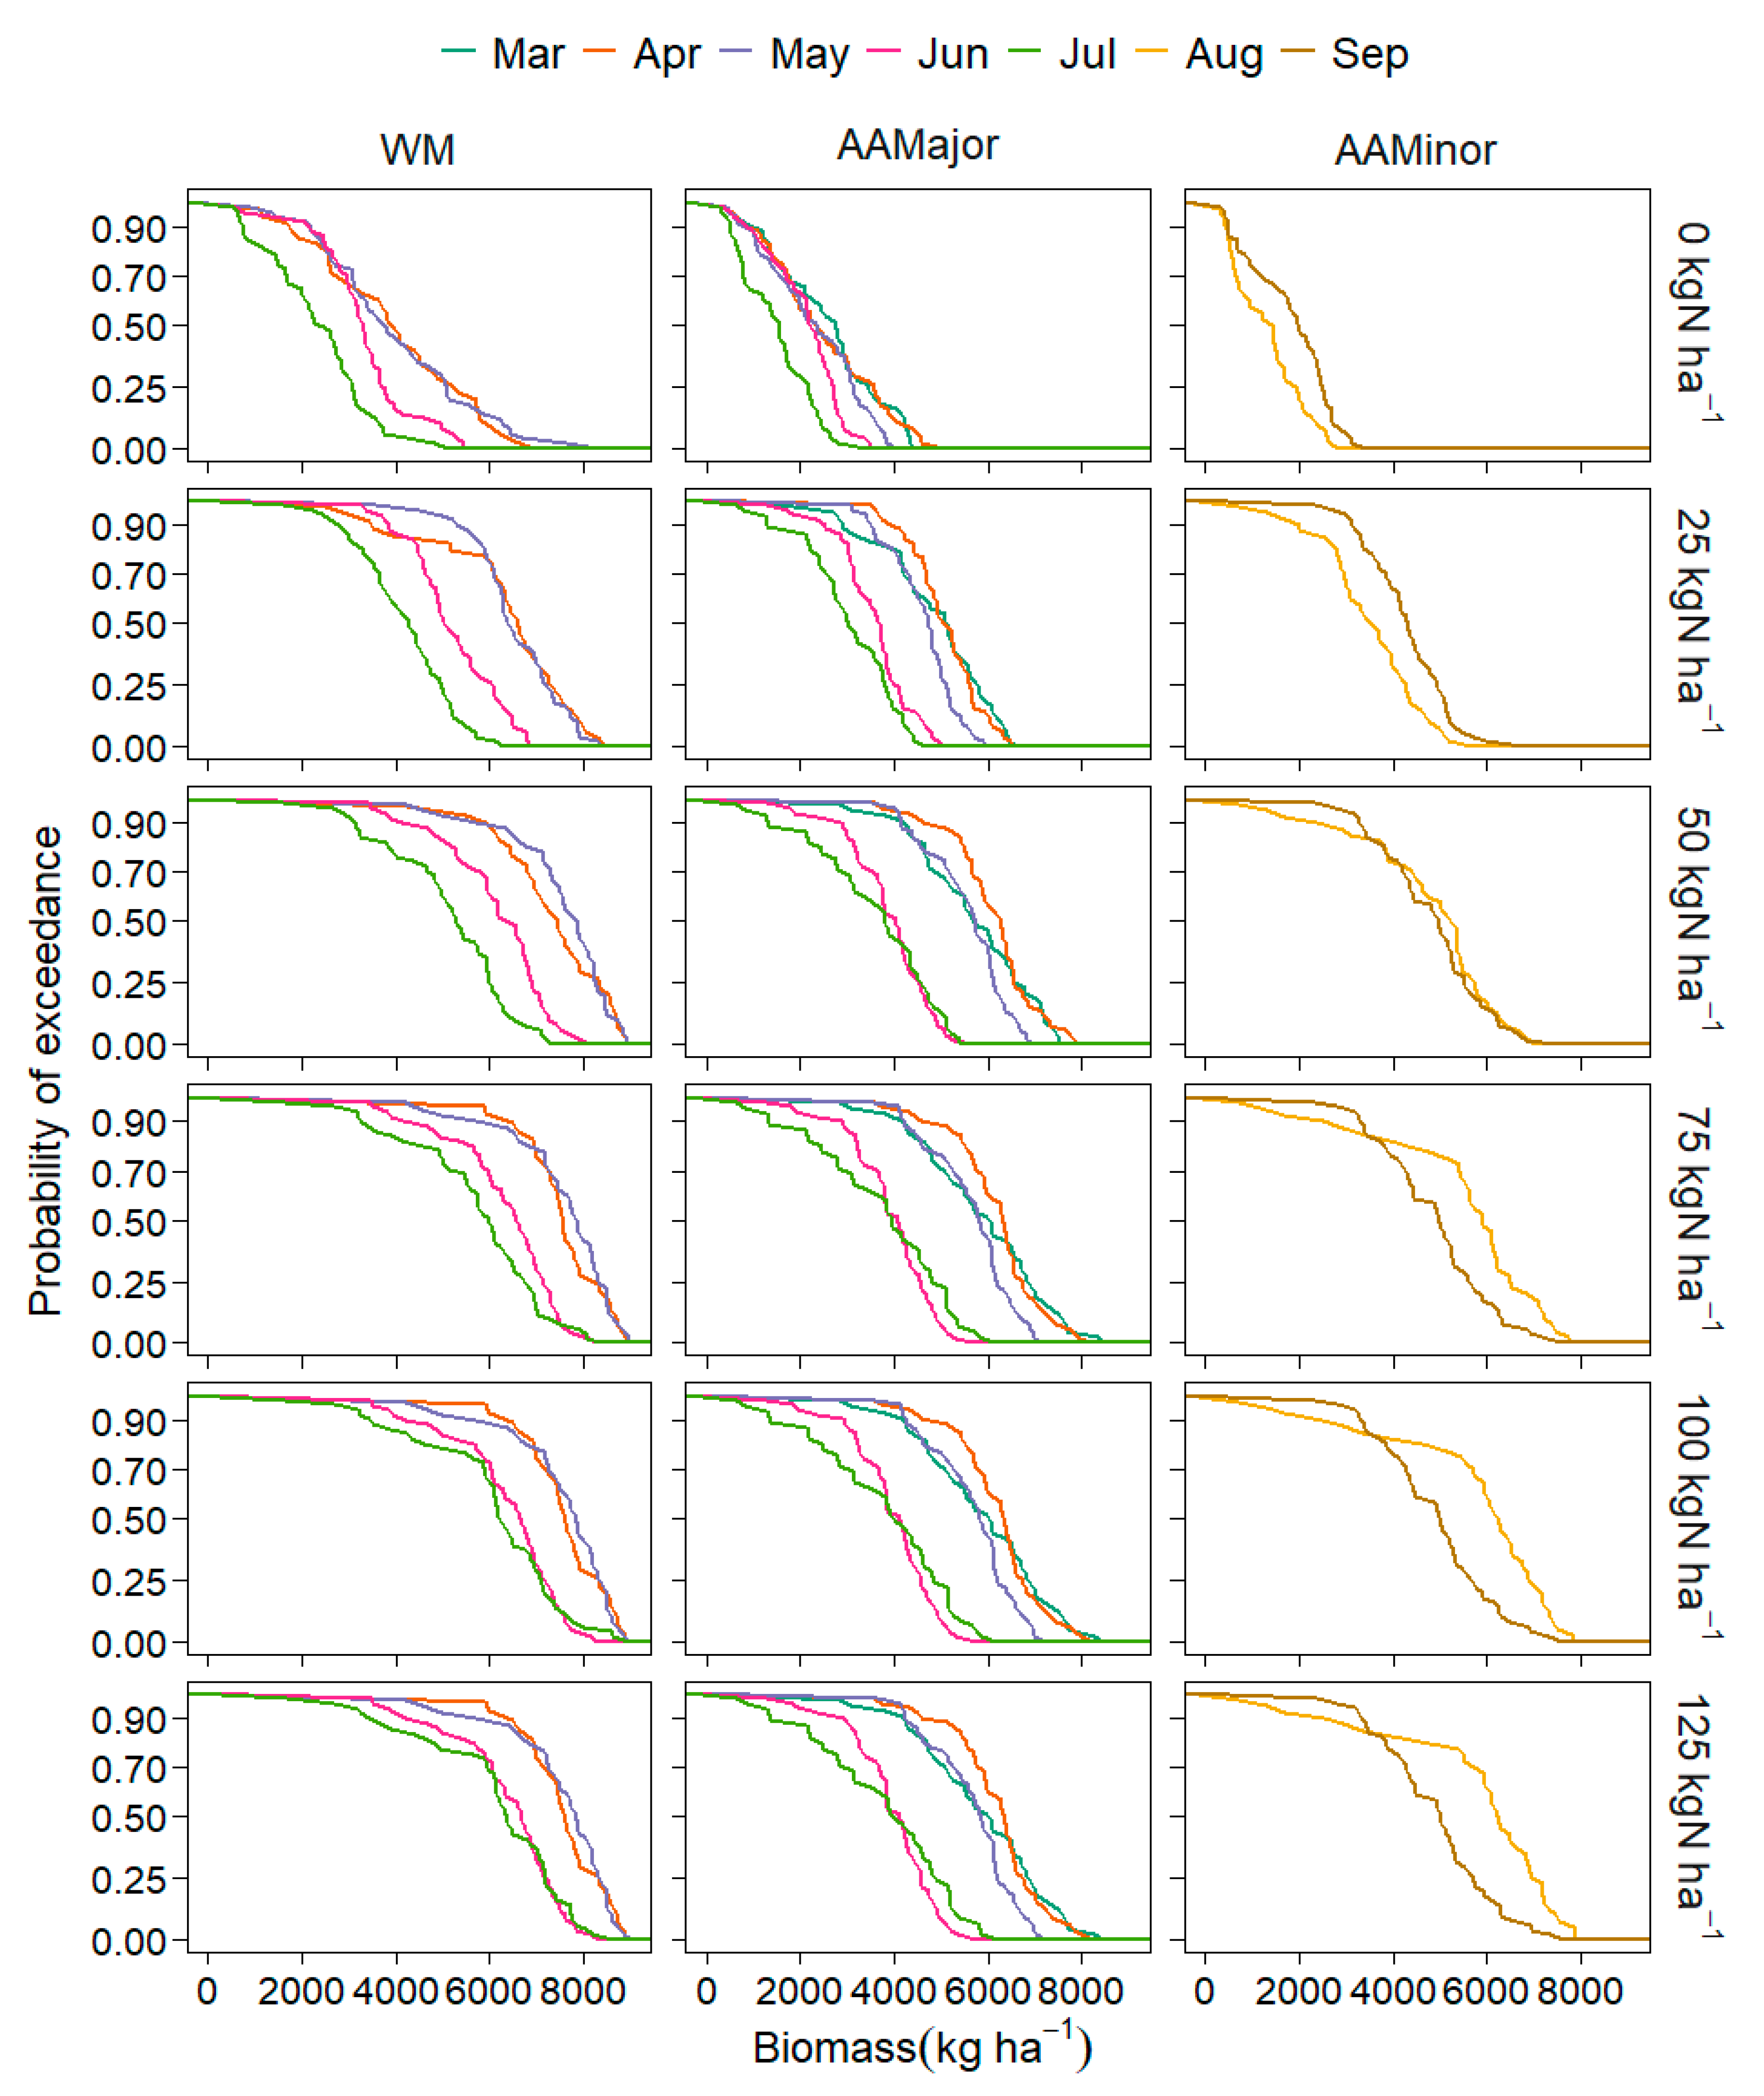
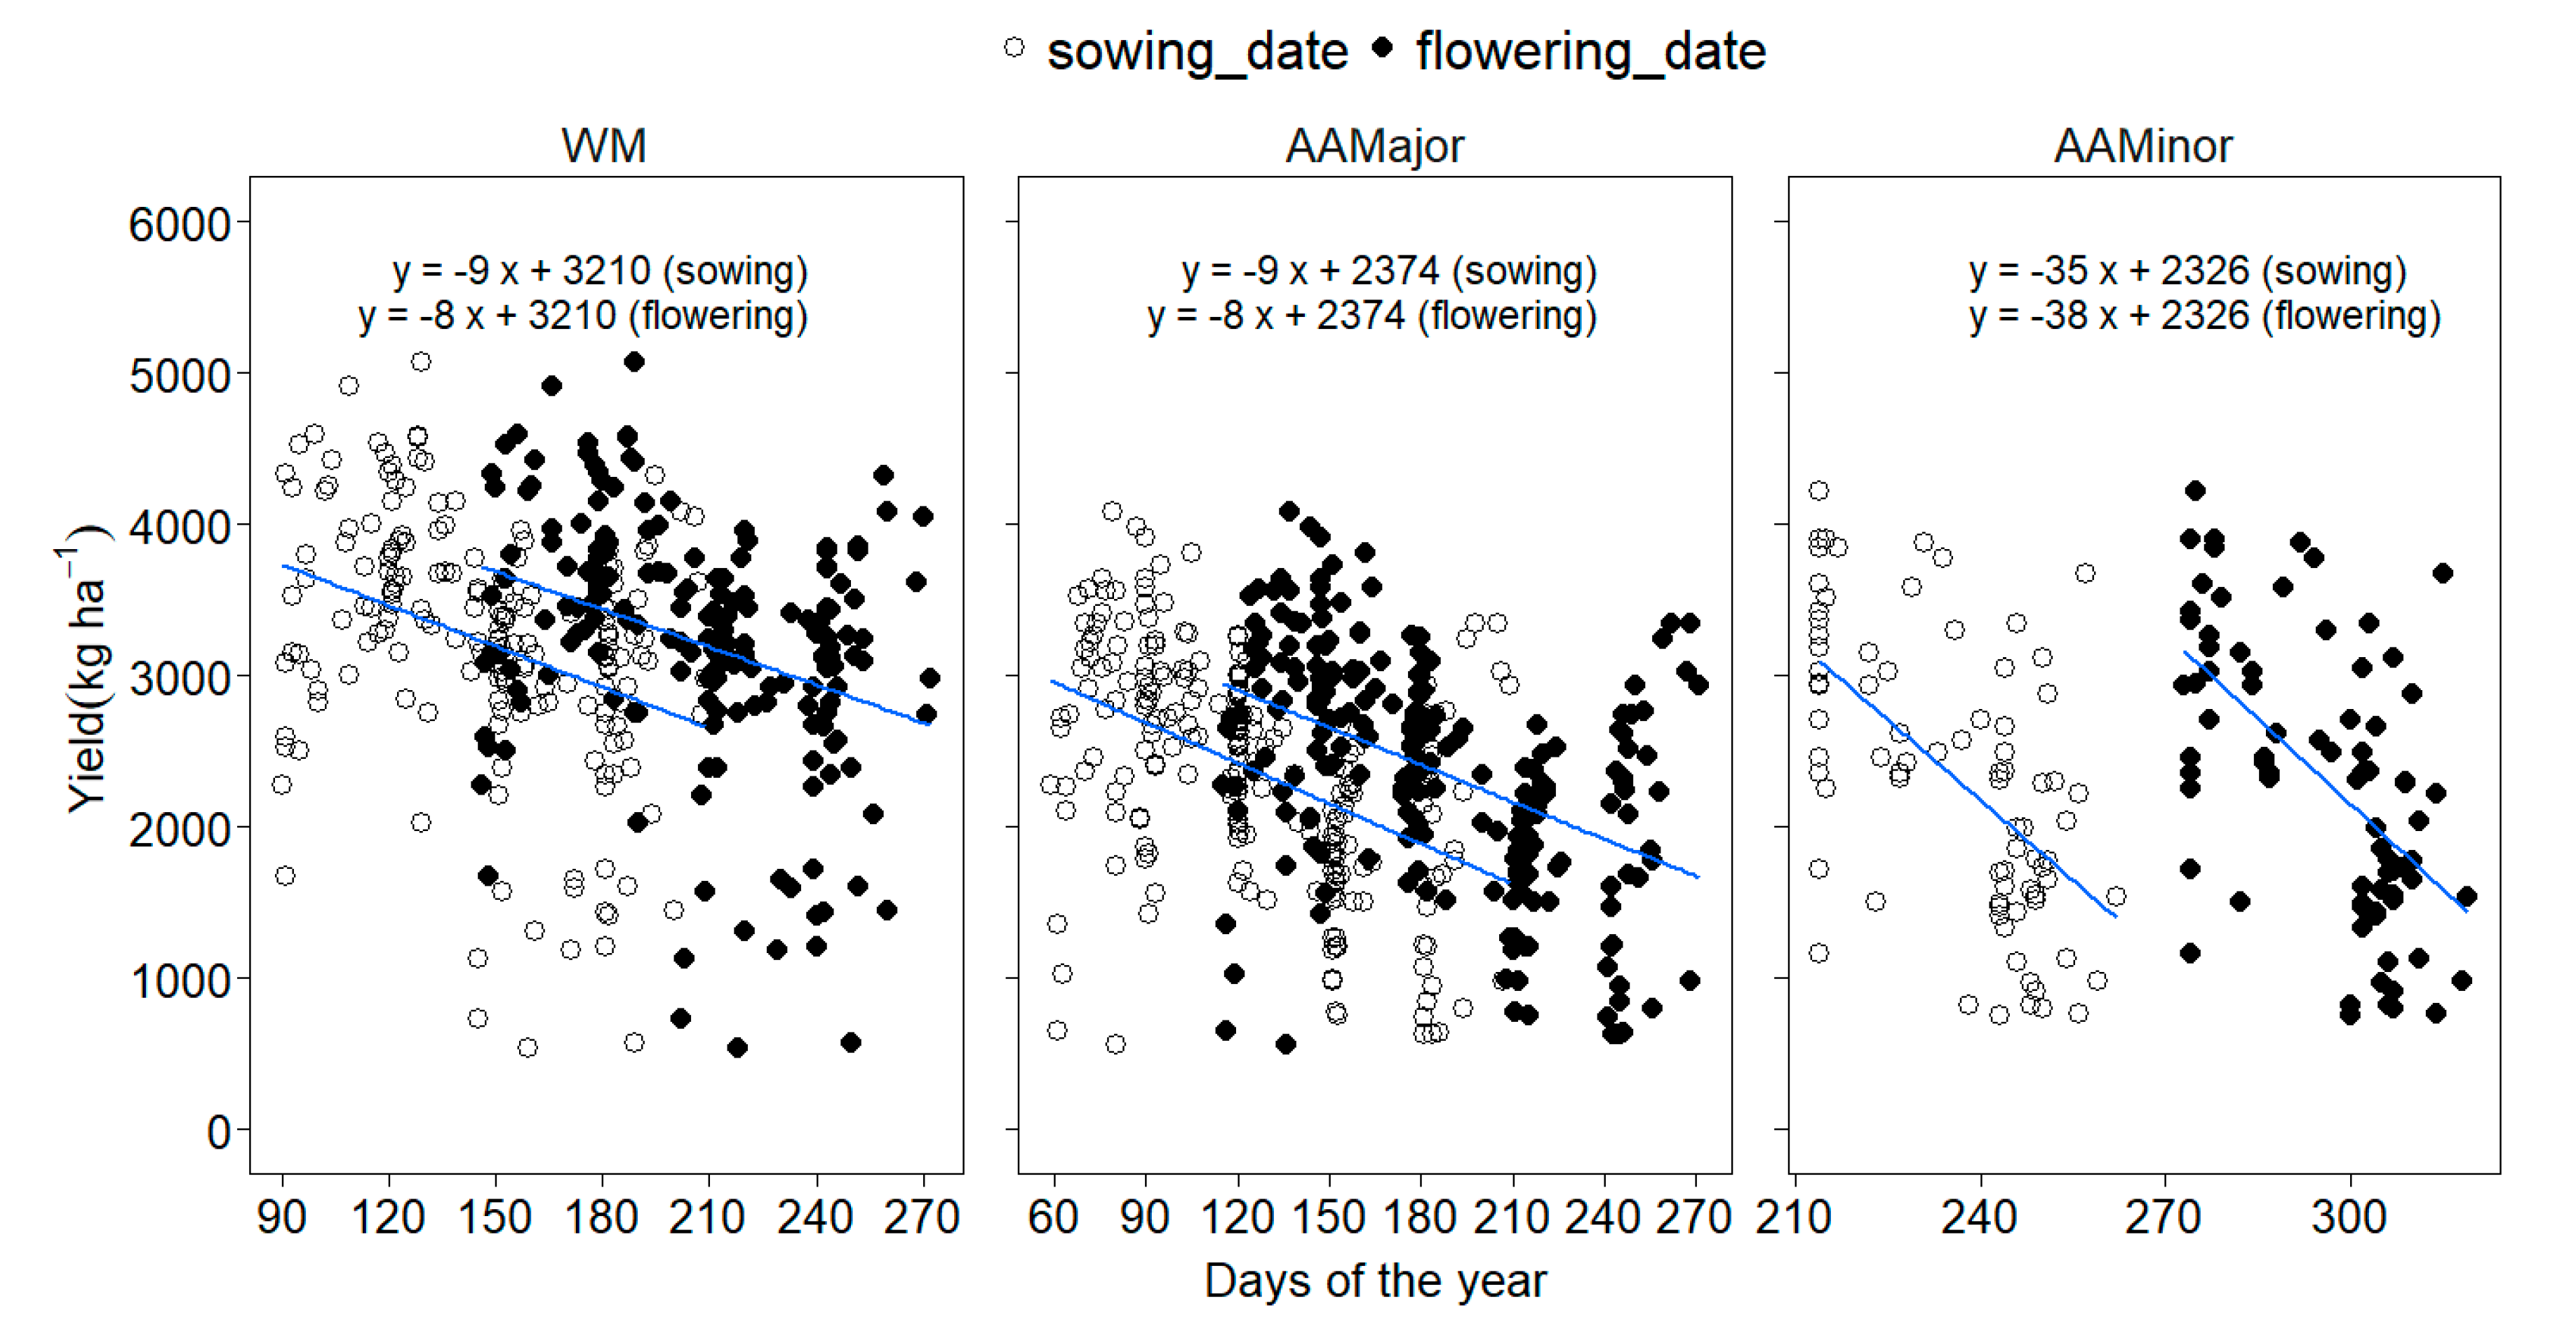
3.2.1. Yield, Sowing Date and Rooting Depth

Simulated yield showed high inter-annual variability with coefficient variation (CV) of 43%, 43%, 55% for West Mamprusi, Atebubu-Amantin major, and Atebubu-Amantin minor seasons, respectively. Higher grain yield was simulated when maize is sown in April in AAMajor and August in AAMinor for the 75 kg N ha−1 treatment (Figure 6). The reason for the higher yield in this sowing window is due to the high in-crop radiation and rainfall the crop receives at a critical stage (emergence to the start of grain-filling during the flowering period). For example, for AAMajor, the model simulated >3800 kg ha−1 when the average in crop radiation interception and rainfall for April is 543 MJ m−2 and 563 mm, and 632 MJ m−2 and 428 mm in WM, respectively. On the other hand, the yield was simulated to be <2500 kg ha−1 for the April planting and the average in-crop radiation interception and rainfall for the season was 353 MJ m−2 and 469 mm respectively, for AAMajor. The model also simulated a similar trend of yield for a given in-crop radiation interception and rainfall on WM and AAMinor. Higher biomass was simulated when maize was sown in April and May for WM, March, April, and May in AAMajor and August in AAMinor for the 75 kg N ha−1 treatment (Figure 7). The analysis showed that there is a 90% chance of getting a higher grain yield than the observed farmer yield when 75 kg N ha−1 is applied and for planting in April and May in AAMajor and WM (Figure 6). In AAMinor, there was only an 80% chance of getting higher yield than the average farmers’ yield when maize was sown in August. The yield probability increased with the increase in root depth (Figure 8). A higher yield was simulated for 1.20 m followed by 0.90 m root depth. Simulated sowing and flowering date are compared for different sowing dates. The results show that crops that were sown early flowered early, and produced higher biomass and yield as compared with late sowing (Figure 9).

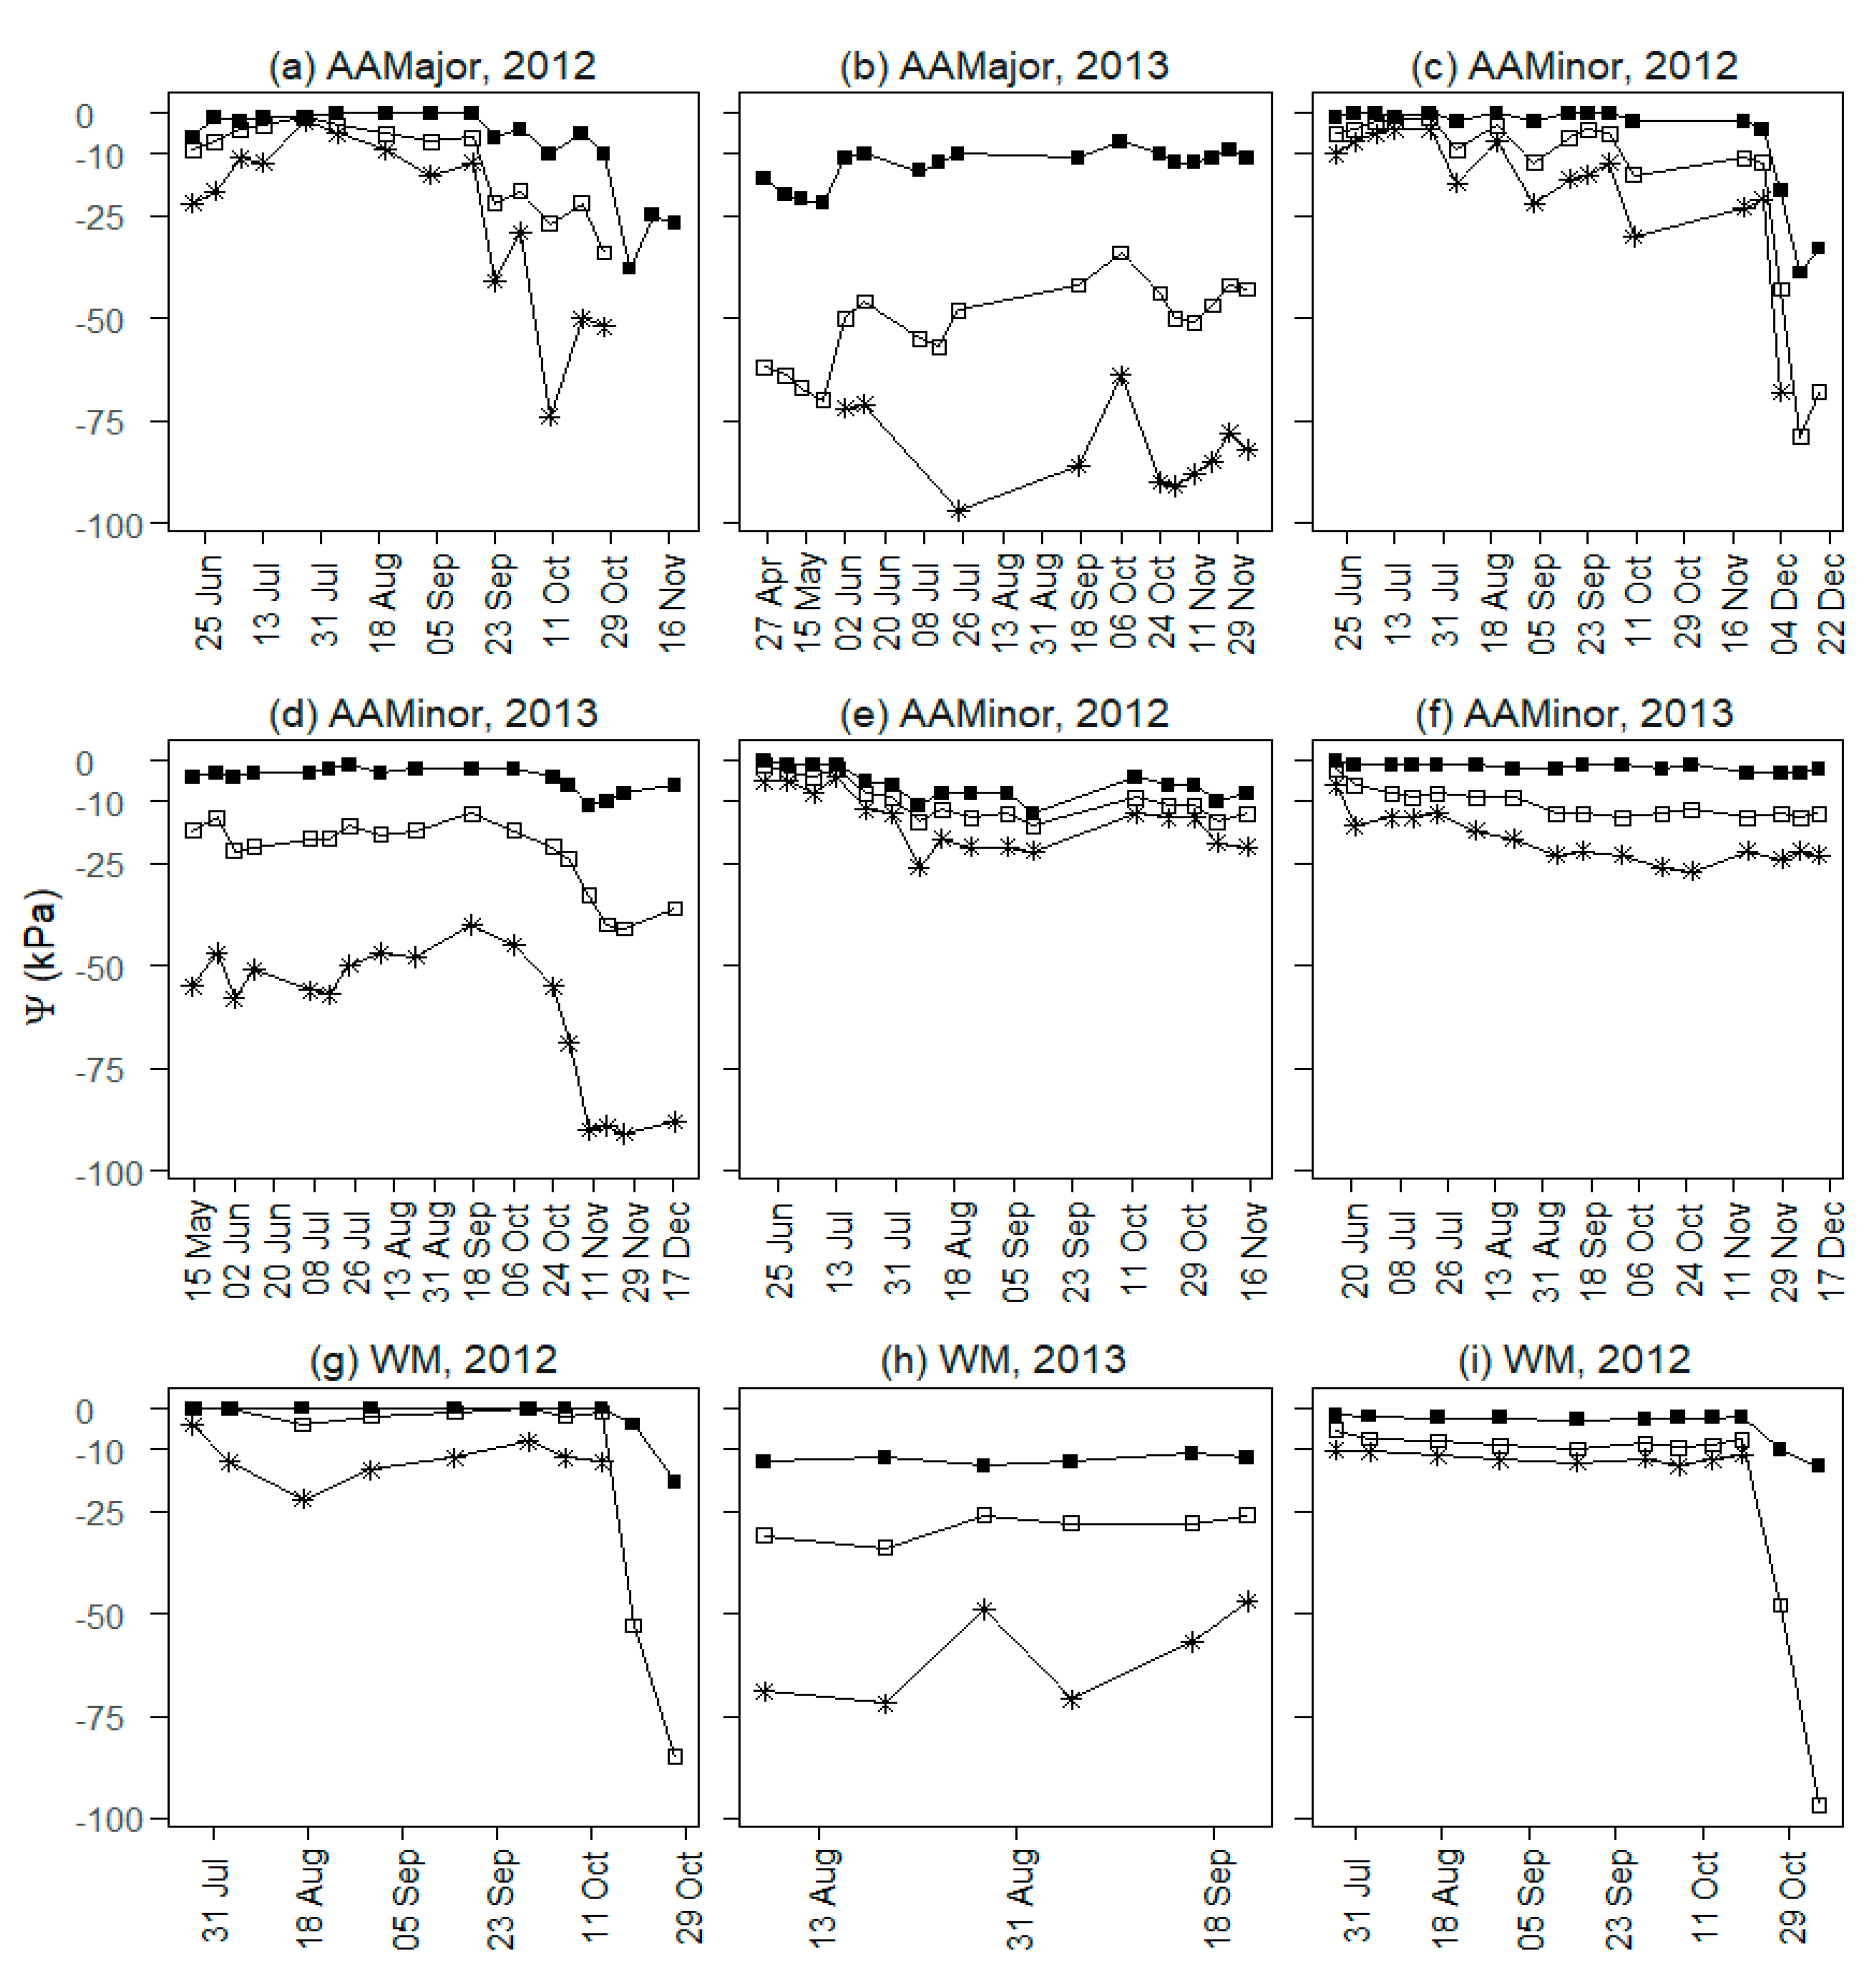
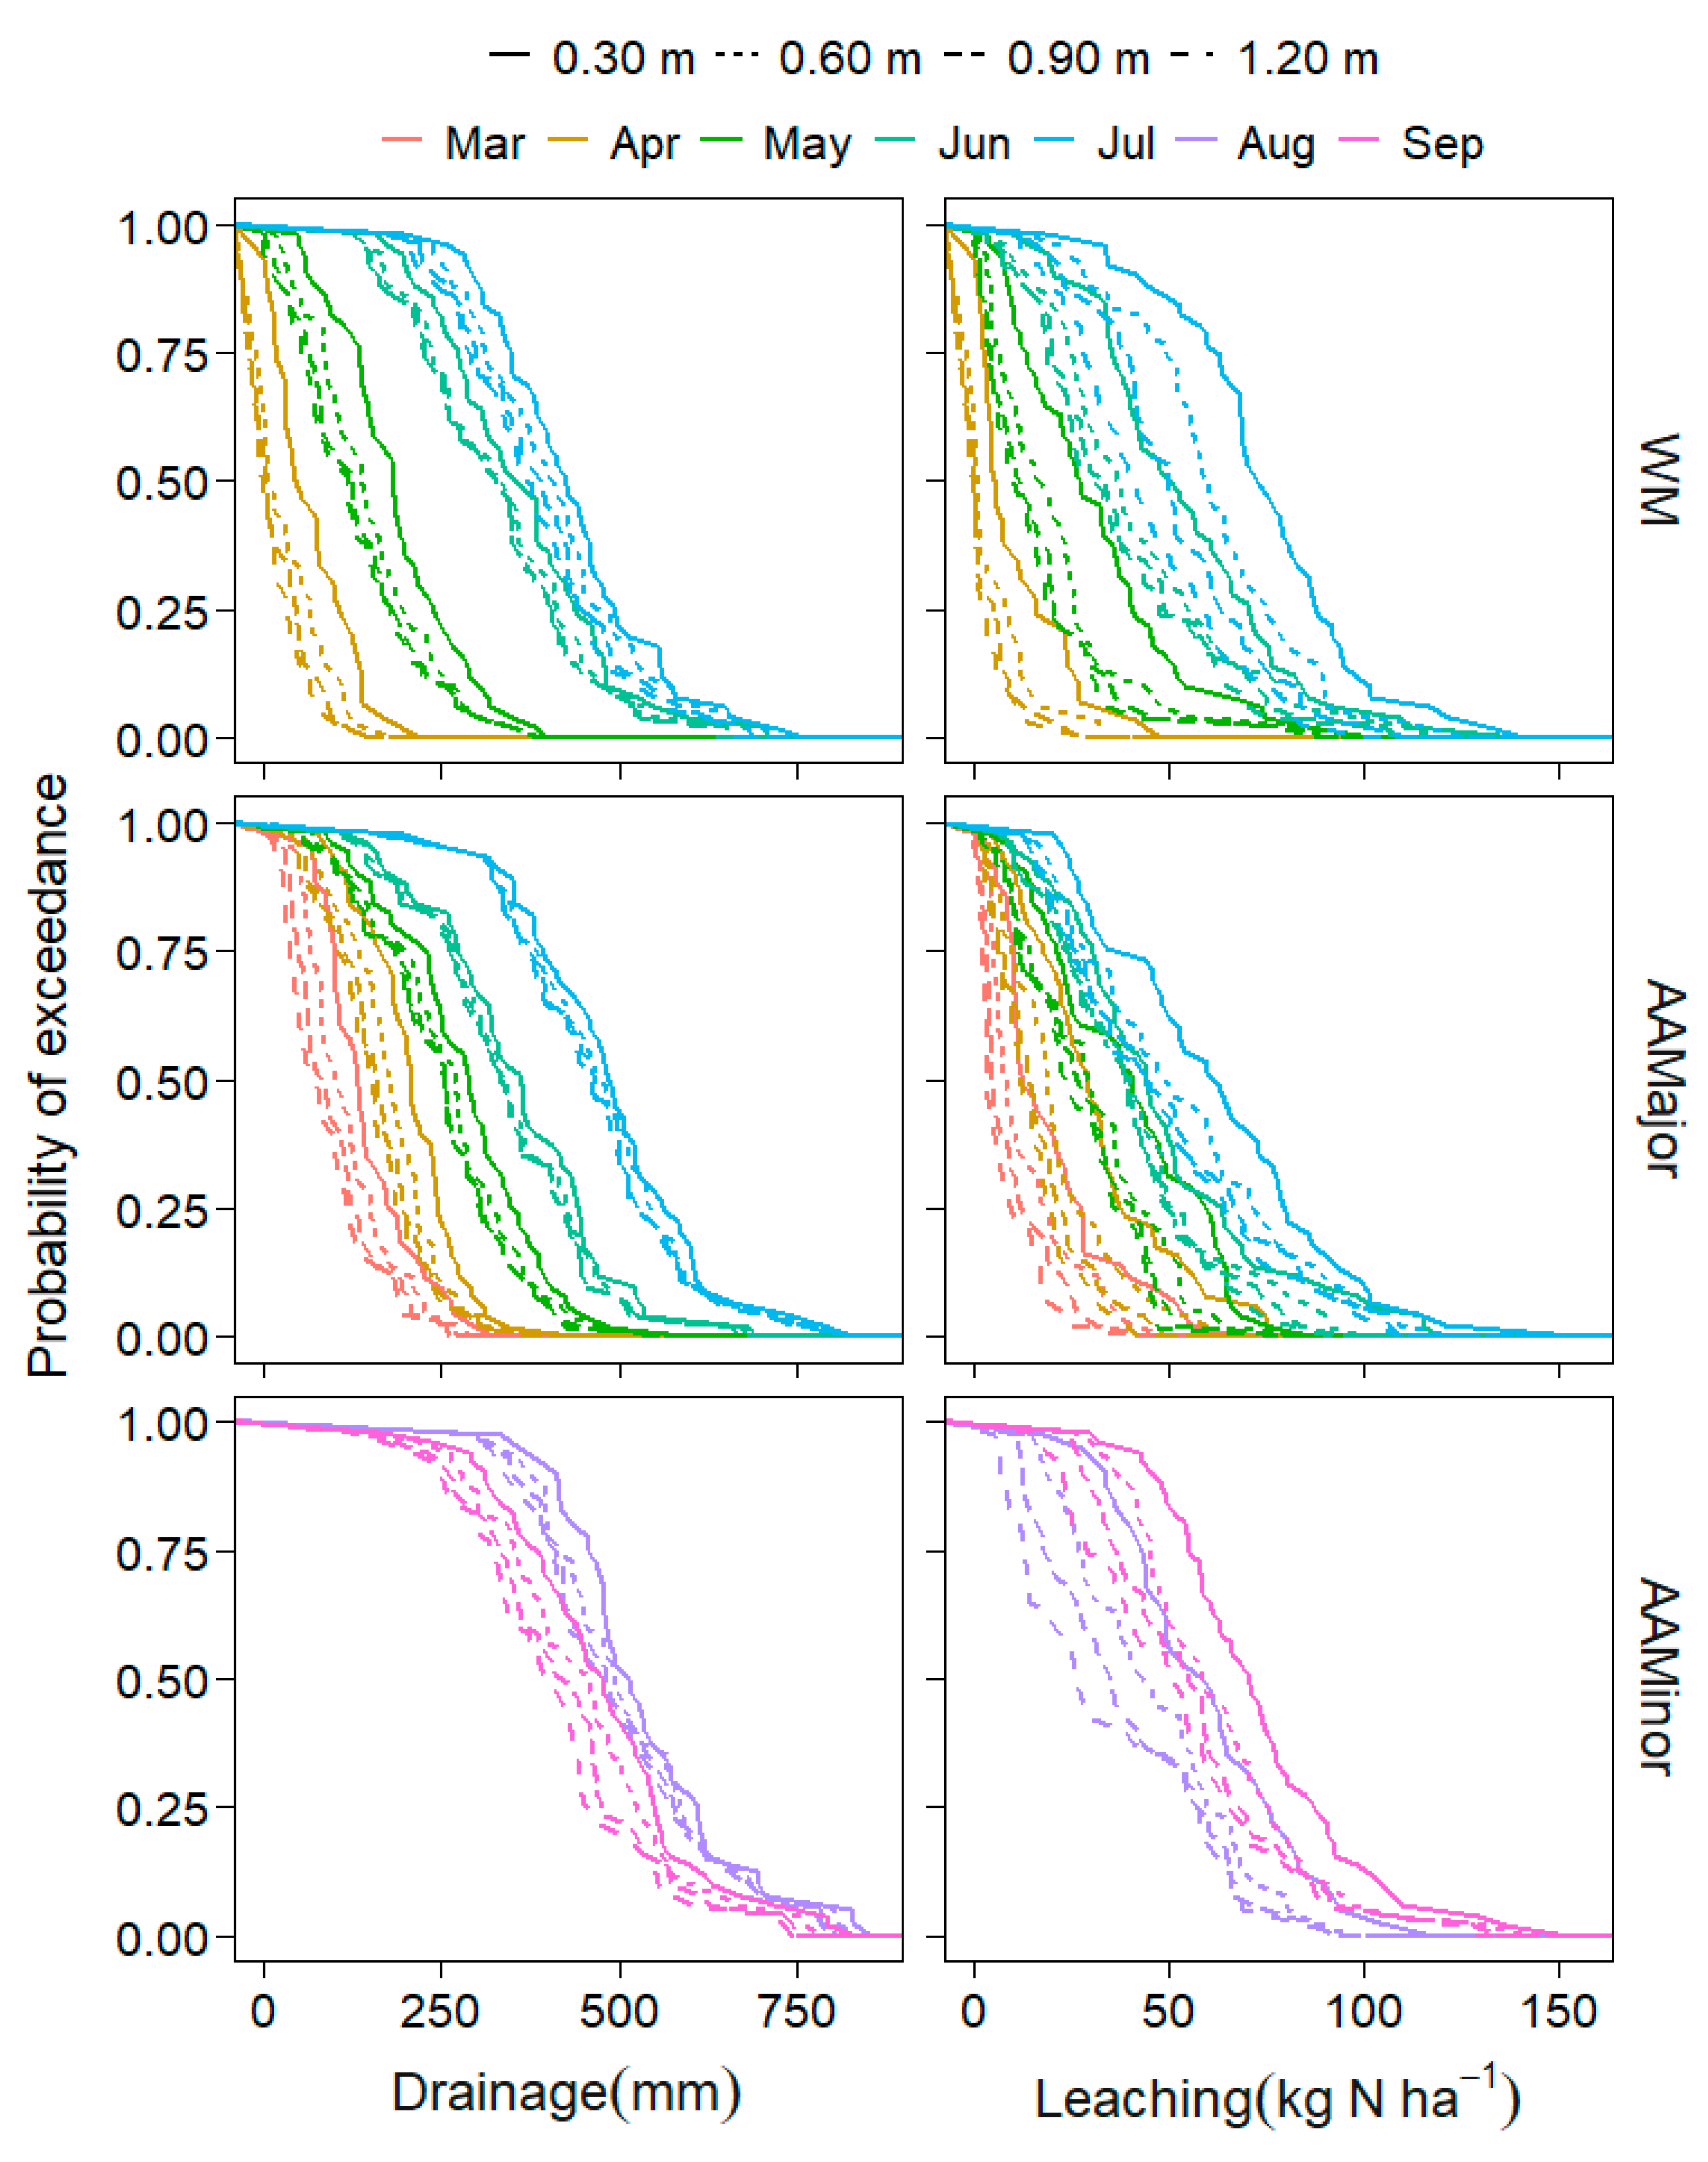
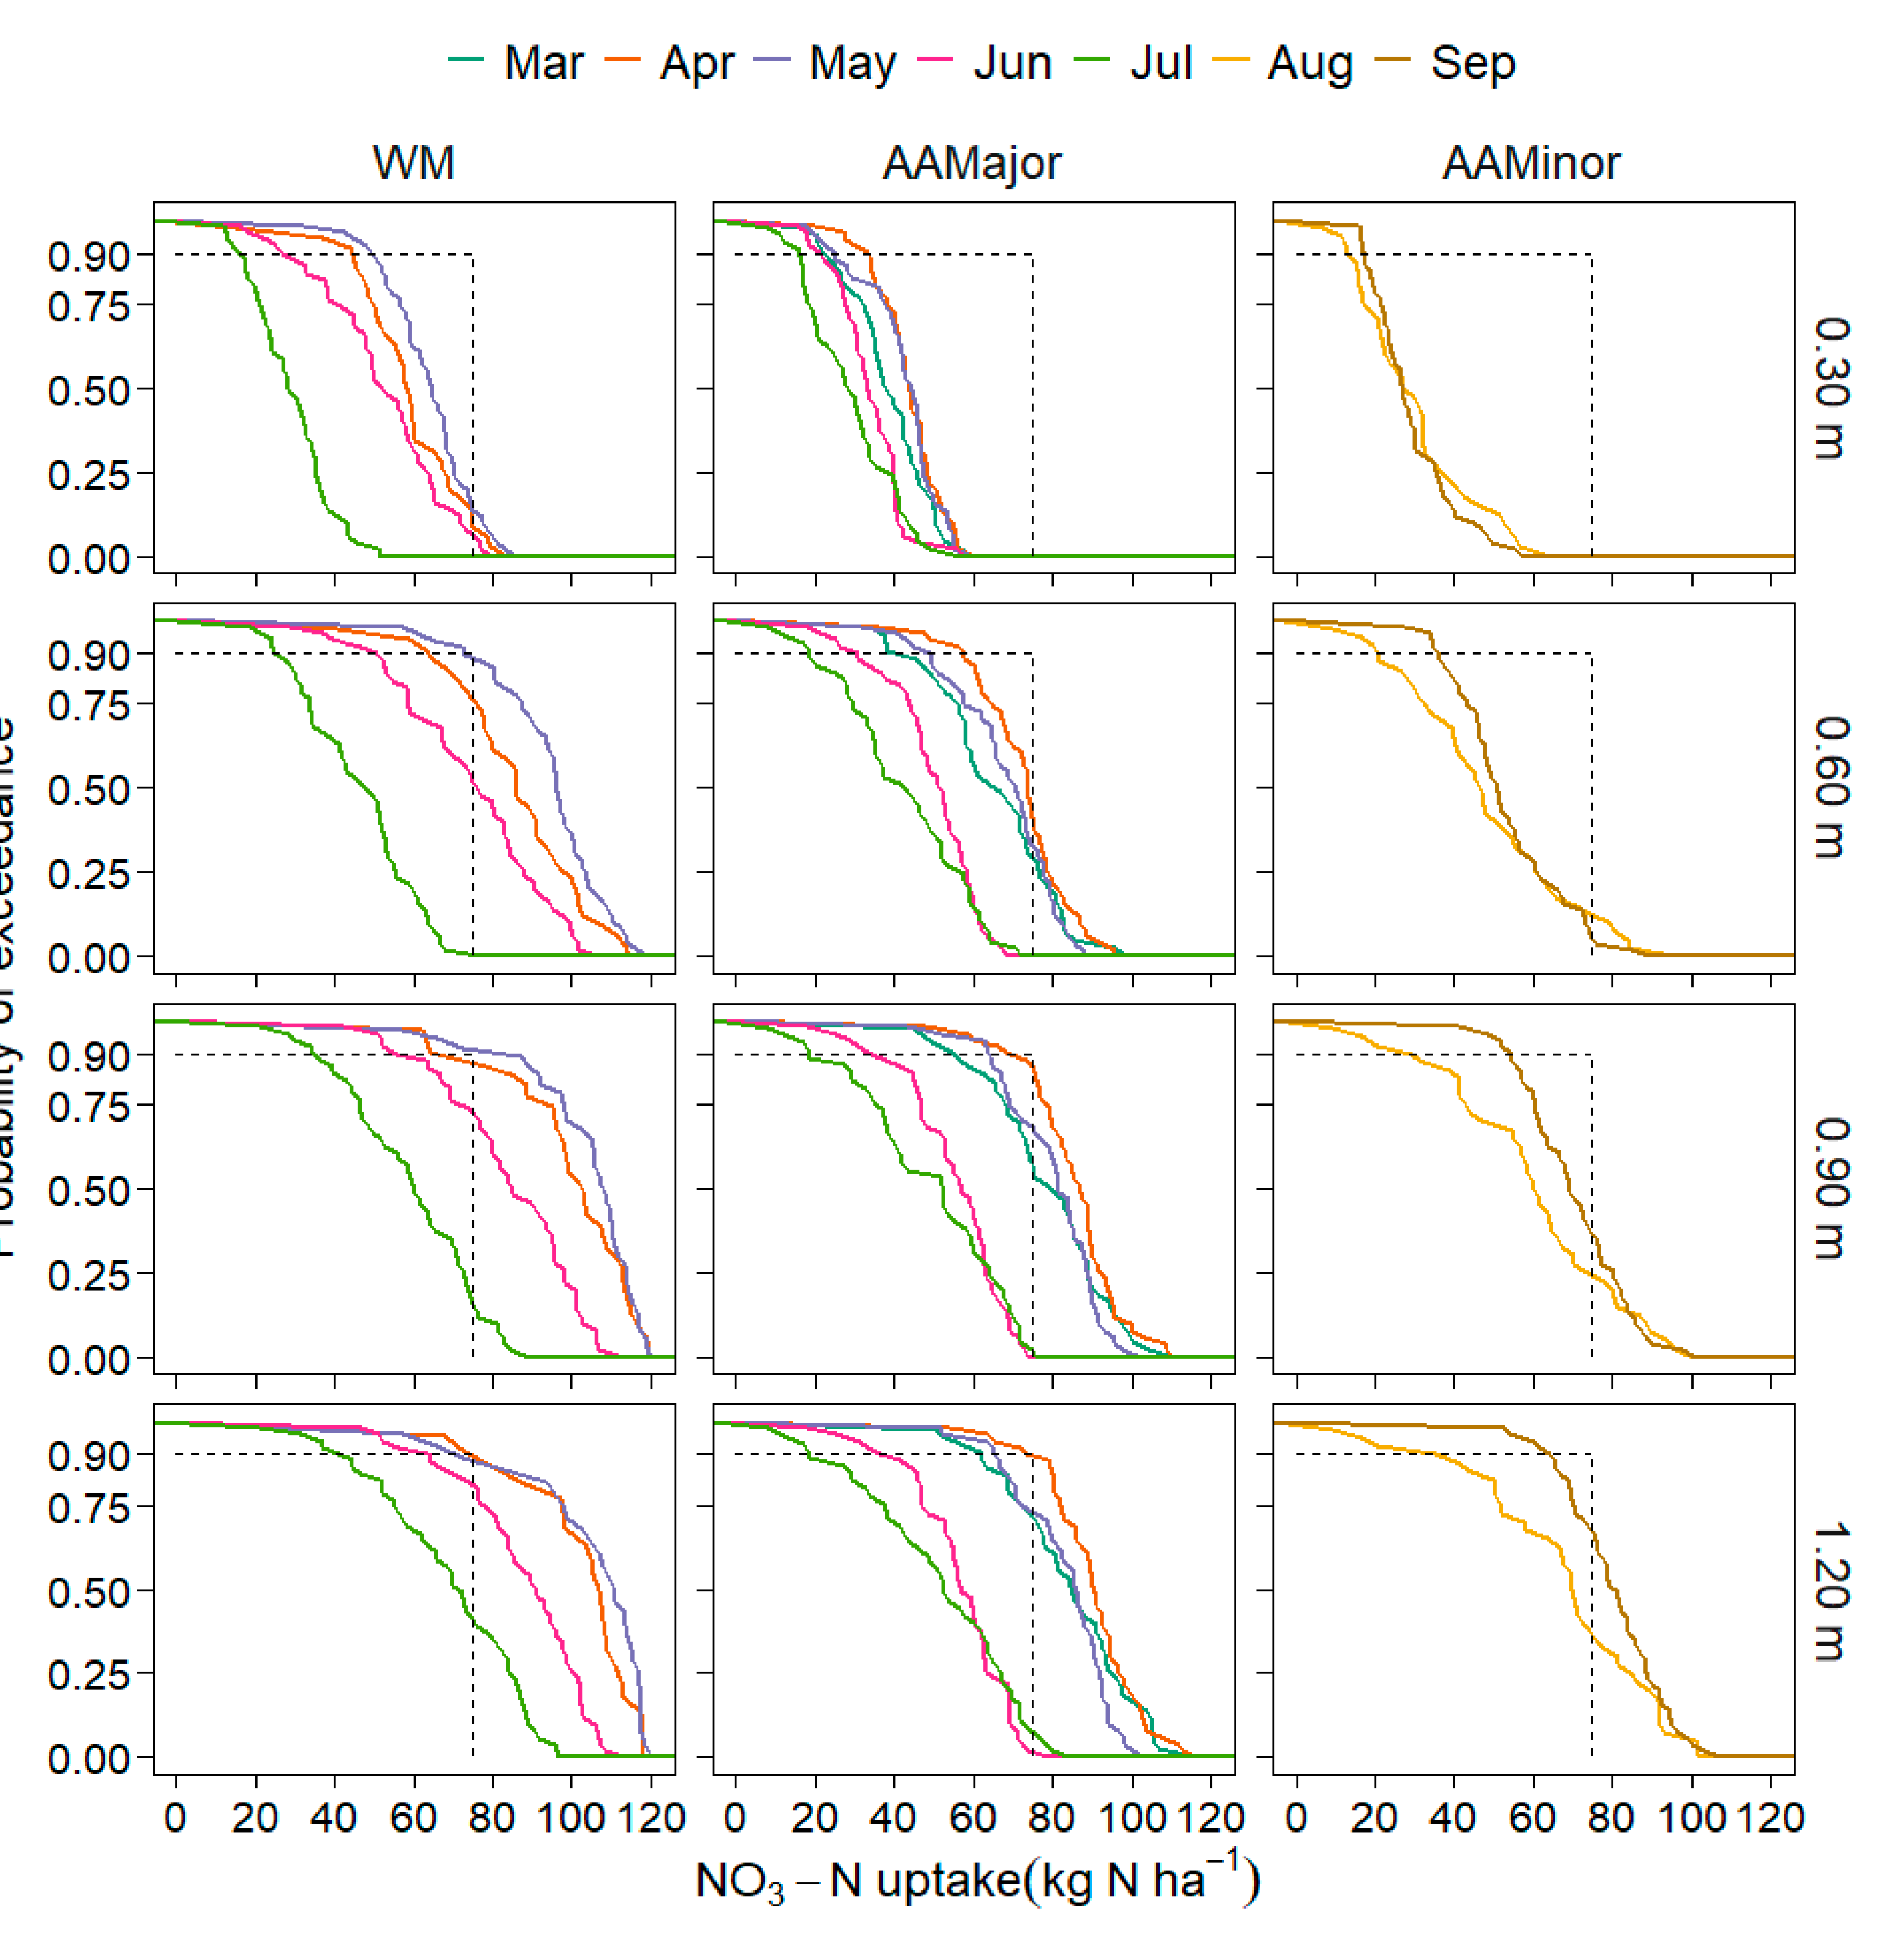
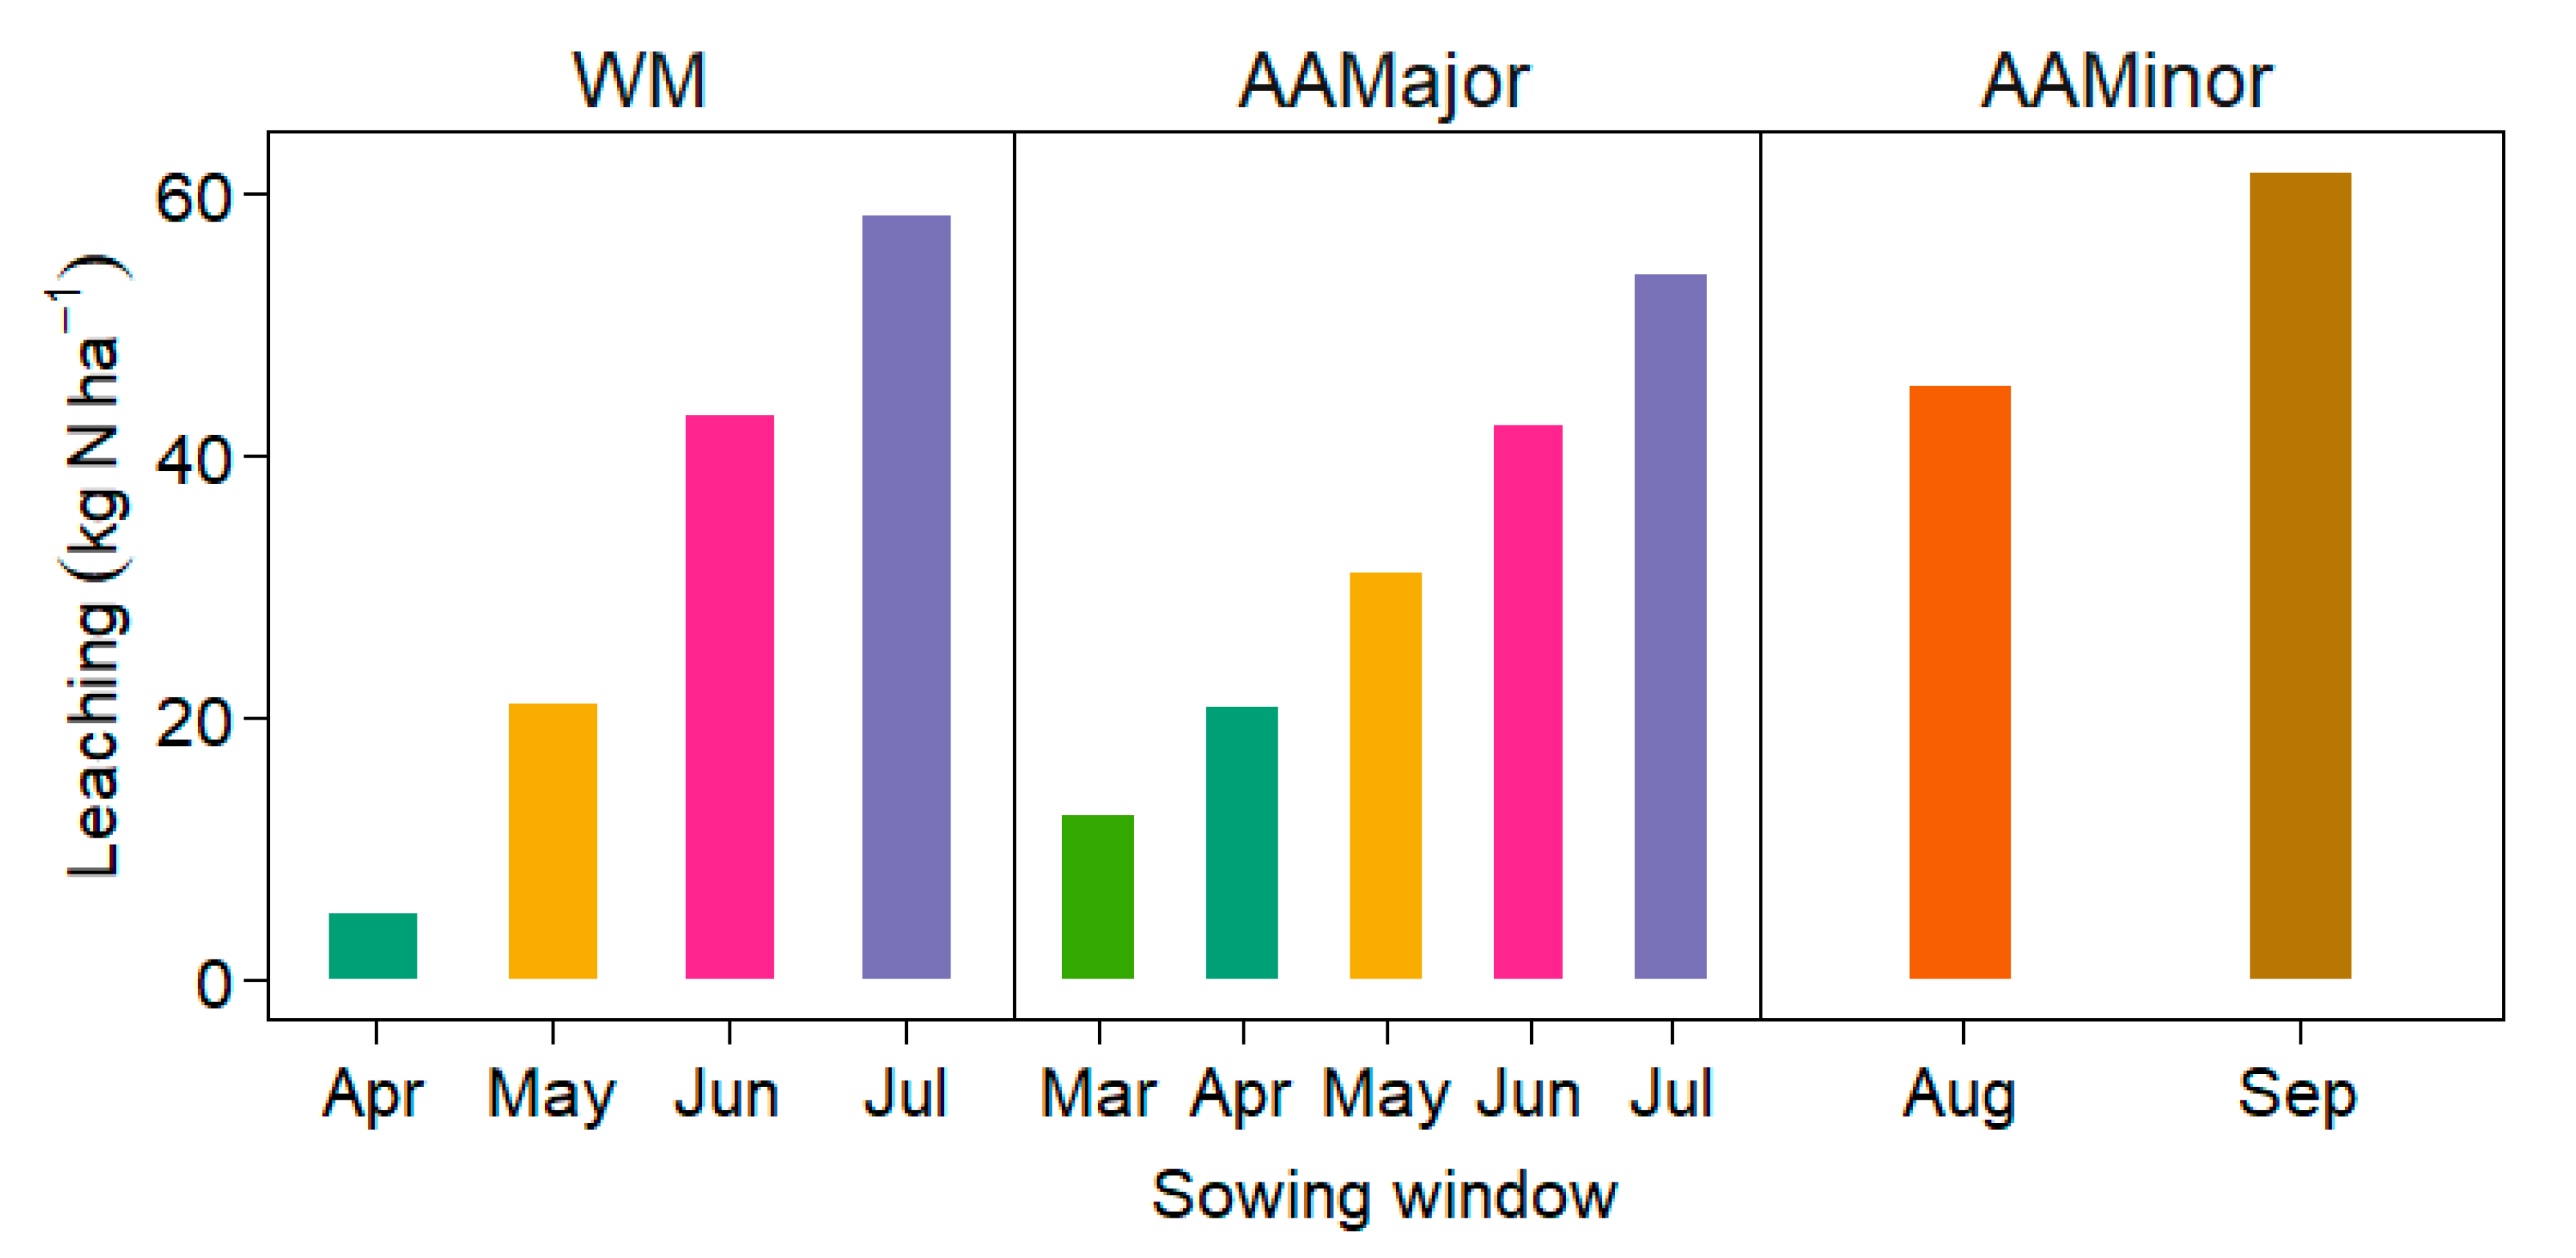
3.2.2. NO3-N Leaching and Uptake, and Water Stress

The comparison of simulated yield, drainage, and leaching for three sites which received 75 kg N ha−1 is given in Figure 10. Each line in the graph represents simulated drainage and leaching for the three sites for different sowing windows and constricted soil depths. Simulated NO3-N leaching varied between AAMinor, AAMajor and WM. High nitrate leaching (>50 kg ha−1) was simulated for the July sowing window in AAMajor and WM and is probably be due to the high rainfall in July. Similarly, yield regressed against drainage and leaching showed a decreasing trend with increase in drainage and leaching (Figure 11). The variation in daily drainage (not shown here) paralleled the variation in simulated NO3-N leaching for the sites. Even though drainage largely depends on soil hydraulic properties, it decreased with the increased yield, higher biomass production, and crop water uptake.
The probability of NO3-N uptake by maize for different root depths shows that more N is taken up as the depth of rooting is increased (Figure 12). The low yield at shallow root depth (0.3 m) is an indication of relatively poor accessibility to NO3-N because of the shallow rooting depth set in the model. Under these conditions, there is less demand for N by the crop.
The simulated water stress index (swdef_photo) shown in Figure 13 is an index used to modify the rate of photosynthesis in APSIM. Zero indicates maximum water stress, corresponding to a non-transpiring crop (stomata fully closed), whereas the value 1.0 represents non-water-stressed, and is indicative of a fully watered crop. The simulations showed negligible water stress (swdef_photo) for AAMajor and WM. In contrast, in AAMinor, a higher probability of water stress was predicted, and the degree of stress increased with rooting depth and varied between August and September sowing windows (data not shown). The water stress in AAMinor was as a result of low in-crop rainfall and restricted root depth. Overall, the sites, crops with shallow root depth (0.30 m), were more severely affected than deep-rooted ones.
Leaching loss for different sowing windows with deep rooting maize that received 75 kg N ha−1 is indicated in Figure 14. A higher leaching loss is estimated for July sowing window in WM and AAMajor, and September sowing window for AAMinor.

4. Discussion

4.1. Field Observations

Several studies in Ghana showed that maize yield response increases with N application [17,47,48,49,50]. Others have also shown that the addition of fertilizer N increases maize radiation interception and radiation use efficiency, and thereby biomass and yield [51,52,53]. Contrary to expectations, our study shows there was large variation in the response of grain yield to additional N fertilization. The yield of maize with the application of <30 kg N ha−1 was equivalent or higher than that of maize grown >60 kg N ha−1. Muchow and Davis [52] indicated that the efficiency of N’s utilization by maize (defined as grain yield per unit N uptake) varies under different climatic, soil, and management conditions. It also demonstrated that radiation use efficiency at higher rates of N declines during grain filling and supplying N under water-limited growth decreases nitrogen use efficiency. Thus far, the evidence supports the notion that N rate alone is not adequate for maximum yield at these study sites. Farmers’ management decisions need to consider N application options that are adjusted to climatic variables (radiation and rainfall) and return the benefit of enhanced photosynthetic efficiency and solar radiation interception between emergence and grain filling stages.
Root architecture and water uptake are interrelated and thereby determine the potential of the crop to access soil water [54]. The soil moisture data collected at 0.30 m showed the soil dried to −25 to −75 kPa, while the sub-soil (0.60–0.80 m depth) was saturated for most of the growing season (Figure 4a–f), and at the same time the crops experienced terminal drought. The question is why the roots are not proliferating deeper in the soil to take up water and nutrient? A possible explanation for the drier topsoil and wet sub soil could be due to the strong force of the crown roots in water uptake than seminal roots. It was reported that seminal roots of maize supply one fifth of the water used by the plant during its lifetime [55]. In addition, crown roots are thicker, have more and larger xylem vessels (which leads to a higher axial conductivity) than seminal roots and have better ability to transport water [56,57,58]. Reduced NO3-N uptake could have also been caused by NO3-N losses through leaching [59,60].

4.2. Modelling Analysis

4.2.1. Yield, Sowing Windows and Climate Variables

The modelling study investigated the effect of nitrogen fertilizer, sowing windows, in crop rainfall and radiation on crop grain yield. The results show that simulated yield was higher than the measured yield, when maize was fertilized with 75 kg N ha−1 and was sown in May for WM, April AAMajor and August for AAMinor (Figure 6 and Figure 8). This suggests there is potential to increase yields when crops are planted early. This finding is consistent with the results of Lopez-Pereira and Morris [61] and MacCarthy et al. [37]. A maize grain yield range of 231 kg ha−1 with no mineral N fertilizer and 3831 kg ha−1 following the addition of 120 kg N ha−1 was observed [62].
Multiple linear regression analysis shows that radiation interception and sowing window-controlled yield and biomass in WM and AAMajor (p-value: <2.2e−16). In both sites, APSIM simulated yield decrease when maize was planted late in the season, i.e., in June and July (Figure 6). For example, in WM, growing season rainfall increases while radiation intercepted decreases from April (700 MJ m−2) to June (400 MJ m−2), and the corresponding yields decreased from 5.0 to 2.0 t ha−1. The reason for the higher yield in AA Major for maize sown in April is due to the high radiation and wet periods occurring at a critical stage (from emergence to grain filling stage (May and June)), which resulted in increased yield potential (Figure 6). Based on these findings, we suggest that the low yields observed among farmers are as a result of late sowing (June–July), where the crop reproductive stages coincide with low rainfall and radiation periods.
In the AAMajor season, in-crop rainfall remains in the range of 480–505 mm from March to June, but in-crop radiation interception decreases from 435 to 248 MJ m−2. The decrease in radiation could be related to the effect on the potential assimilation and further partitioning of biomass to grain. Radiation and temperature have been observed to be the most important limiting factors for simulated maize yield using the LINTUL5 model in central Ghana [63,64]. Additionally, when water and nutrients are not limiting, low yields of maize in West Africa are due to a decline in radiation associated with heavy cloud cover during the peak rainfall months of August and September [38]. Spatial patterns of yield changes due to reduced radiation in central Ghana have been predicted [64].
In both sites, 74% of the farmers planted late in the season between June and August. Thus, low radiation interception that occurs in a critical stage (emergence to flag leaf) of the crop could be one of the reasons for low yield. The simulated results suggest that planting in April and May would give a better yield potential for AAMajor and WM, respectively. In this way, the crops could benefit from relatively higher radiation during the early growth stage and higher rainfall during the flowering stage and would place this month as most favorable for maize planting. However, the probability of yield exceedance of 3.5 t ha−1 decreases to 20% as rainfall is variable in amount and distribution, and is also difficult to forecast. Thus, we argue that supplemental irrigation that allows farmers to plant their crops in April (AAMajor) and in May (WM) without needing to wait for the onset of seasonal rain would be of great help to the farmers. However, such an initiative needs to be explored in relation to the socio-economic impact on the region. In AAMinor, the simulated results show that in-crop rainfall significantly affected grain yield for the September planting, and this is due to the low in crop rainfall amount at the flowering stage of the crop (October and November months). Thus, the low yield of farmers in AAMinor is related to low rainfall rather than radiation under 75 kg N ha−1 conditions.

4.2.2. Soil Water Stress and NO3-N Leaching

Soil water stress varied across the three sites and decreased with the increase in root depth (Figure 9). The evidence presented thus far supports the idea that crops adjust their growth strategy according to different environments, and in particular, tend to partition relatively more biomass to root systems under more stressful, low-nutrient, and poor climatic conditions [65].
Higher nitrogen stress was simulated for AAMinor and WM at all depths for July and August planting, respectively. It seems possible that rain could have leached NO3-N before being used by the crop. The nitrogen stress suggests that synchronization between a rainfall event, crop demand, and nitrogen for a given sowing date would improve yield. From this, it is evident that a predetermined N-application without considering NO3-N leaching could lead to N-leaching loss [66,67,68].
N application rate of 75 kg ha−1 gave an average NO3-N leaching value of 22 kg ha−1 in AAMajor for April sowing, 45 kg ha−1 in the minor season for August sowing, and 20 kg ha−1 in West Mamprusi for May sowing. We think that the larger NO3-N leaching loss could have also caused the low yield in AAMinor. The values estimated for WM and AAMajor are double than the global average estimate [69], which was 15% for maize. Global NO3-N leaching losses is estimated to be about 20% using process-based modelling [70], which is lower than predicted for the study sites.

5. Conclusions

The field observations highlight the lack of synergy between agronomic decisions (N application) and sowing windows as the principal cause of the low yield. The modelling study shows that early or late sowing causes crop stress, reduces crop establishment, and low radiation interception late in the season limits maximum crop growth. The appropriate management practices (sowing and nitrogen application) that match peak rainfall and radiation are critical for optimal yield.

Author Contributions

E.O.D., collected data, reviewed literature, performed agronomic data analysis, and drafted the paper. Y.B., R.S. and C.S. validated the data, performed the modeling analysis, reviewed literature and reviewed the paper. S.Y., P.O.-D., and F.F. assisted in data collection, reviewed the literature for the write-up, and reviewed the paper. S.A.E. supervised data collection reviewed the paper and played an administrative role for the success of the project. All authors have reviewed and approved the final paper. All authors have read and agreed to the published version of the manuscript.

Funding

This research was funded by the International Development (AusAID) now Department of Foreign Affairs and Trade (DFAT) through the West and Central African Council for Agricultural Research and Development (CORAF/WECARD).

Acknowledgments

The authors would want to express their profound gratitude to the Australian Agency for International Development (AusAID) now Department of Foreign Affairs and Trade (DFAT) for providing financial support for the study through CORAF/WECARD under the project entitled “Intensification of Integrated Crop-Small Ruminant Production Systems in West Africa″ lead by the CSIR—Crops Research Institute, Ghana.

Conflicts of Interest

Authors declare no conflict of interest.

References

  1. Pretty, J.; Toulmin, C.; Williams, S. Sustainable intensification in African agriculture. Int. J. Agric. Sustain. 2011, 9, 5–24. [Google Scholar] [CrossRef]
  2. Sanginga, N.; Dashiell, K.E.; Diels, J.; Vanlauwe, B.; Lyasse, O.; Carsky, R.J.; Tarawali, S.; Asafo-Adjei, B.; Menkir, A.; Schulz, S.; et al. Sustainable resource management coupled to resilient germplasm to provide new intensive cereal–grain–legume–livestock systems in the dry savanna. Agric. Ecosyst. Environ. 2003, 100, 305–314. [Google Scholar] [CrossRef]
  3. Cassman, K.G. Ecological Intensification of Cereal Production Systems: Yield Potential, Soil Quality, and Precision Agriculture. Proc. Natl. Acad. Sci. USA 1999, 96, 5952–5959. [Google Scholar] [CrossRef] [PubMed] [Green Version]
  4. Pingali, P.L.; Heisey, P.W. Cereal Crop Productivity in Developing Countries: Past Trends and Future Prospects; CIMMYT: Texcoco, Mexico, 1998. [Google Scholar]
  5. Santpoort, R. The Drivers of Maize Area Expansion in Sub-Saharan Africa. How Policies to Boost Maize Production Overlook the Interests of Smallholder Farmers. Land 2020, 9, 68. [Google Scholar] [CrossRef] [Green Version]
  6. Tittonell, P.; Giller, K.E. When yield gaps are poverty traps: The paradigm of ecological intensification in African smallholder agriculture. Field Crops Res. 2013, 43, 76–90. [Google Scholar] [CrossRef] [Green Version]
  7. Lobell, D.B.; Cassman, K.G.; Field, C.B. Crop yield gaps: Their importance, magnitudes and causes. Annu. Rev. Environ. Resour. 2009, 34, 179–204. [Google Scholar] [CrossRef] [Green Version]
  8. Van Ittersum, M.K.; Van Bussel, L.G.; Wolf, J.; Grassini, P.; Van Wart, J.; Guilpart, N.; Claessens, L.; de Groot, H.; Wiebe, K.; Mason-D’Croz, D.; et al. Can sub-Saharan Africa feed itself? Proc. Natl. Acad. Sci. USA 2016, 113, 14964–14969. [Google Scholar] [CrossRef] [PubMed] [Green Version]
  9. Prasanna, B.M. Maize in the developing world: Trends, challenges, and opportunities. In Addressing Climate Change Effects and Meeting Maize Demand for Asia, Proceedings of the 11th Asian Maze Conference, Nanning, China, 7–11 November 2011; CIMMYT: Texcoco, Mexico, 2011; pp. 26–38. [Google Scholar]
  10. Pasuquin, J.M.; Pampolino, M.F.; Witt, C.; Dobermann, A.; Oberthür, T.; Fisher, M.J.; Inubushi, K. Closing yield gaps in maize production in Southeast Asia through site-specific nutrient management. Field Crops Res. 2014, 156, 219–230. [Google Scholar] [CrossRef]
  11. Pasuquin, J.M.C.A.; Witt, C. Yield Potential and Yield Gaps of Maize in Southeast Asia; International Potash Institute: Zug, Switzerland, 2007. [Google Scholar]
  12. Akramov, K.; Malek, M. Analysing Profitability of Maize, Rice and Soybean Production in Ghana: Results of PAM and DEA Analysis; GSSP Working Paper; International Food Policy Research Institute: Washington, DC, USA, 2012. [Google Scholar]
  13. MacCarthy, D.S.; Adiku, S.G.K.; Freduah, B.S.; Gbefo, F.; Kamara, A.Y. Using CERES-Maize and ENSO as decision support tools to evaluate climate-sensitive farm management practices for maize production in the northern regions of Ghana. Front Plant Sci. 2017, 8, 31. [Google Scholar] [CrossRef] [PubMed] [Green Version]
  14. Mueller, N.D.; Gerber, J.S.; Johnston, M.; Ray, D.K.; Ramankutty, N.; Foley, J.A. Closing yield gaps through nutrient and water Management. Nature 2012, 490, 254–257. [Google Scholar] [CrossRef]
  15. Naab, J.; Mahama, G.; Koo, J.; Jones, J.; Boote, K. Nitrogen and phosphorus fertilization with crop residue retention enhances crop productivity, soil organic carbon, and total soil nitrogen concentrations in sandy-loam soils in Ghana. Nutr. Cycling Agroecosyst. 2015, 102, 33–43. [Google Scholar] [CrossRef]
  16. Crawford, E.; Kelly, V.; Jayne, T.S.; Howard, J. Input use and market development in Sub-Saharan Africa: An overview. Food Policy. 2003, 28, 277–292. [Google Scholar] [CrossRef]
  17. Fosu-Mensah, B.Y.; Benedicta, Y.; Mensah, M. The effect of phosphorus and nitrogen fertilizers on grain yield, nutrient uptake and use efficiency of two Maize (Zea mays L.) varieties under rain fed condition on Haplic Lixisol in the forest-savannah transition zone of Ghana. Agric. Ecosyst. Environ. 2016, 5, 22. [Google Scholar] [CrossRef] [Green Version]
  18. Martey, E.; Wiredu, A.N.; Etwire, P.M.; Fosu, M.; Buah, S.S.J.; Bidzakin, J.; Kusi, F. Fertilizer adoption and use intensity among smallholder farmers in Northern Ghana: A case study of the AGRA soil health project. Sustain. Agric. Res. 2014, 3, 24–36. [Google Scholar] [CrossRef]
  19. Kanton, R.A.L.; Buah, S.S.J.; Larbi, A.; Mohammed, A.A.; Bidzakin, J.K.; Yakubu, E.A. Soil Amendments and Rotation Effects on Soybean and Maize Growths and Soil Chemical Changes in Northern Ghana. Int. J. Agron. 2017, 2017. [Google Scholar] [CrossRef] [Green Version]
  20. Kermah, M.; Franke, A.C.; Adjei-Nsiah, S.; Ahiabor, B.D.K.; Abaidoo, R.C.; Giller, K.E. Maize-grain legume intercropping for enhanced resource use efficiency and crop productivity in the Guinea savanna of northern Ghana. Field Crops Res. 2012, 213, 38–50. [Google Scholar] [CrossRef]
  21. Adu, G.B.; Akromah, R.; Abdulai, M.S.; Obeng-Antwi, K.; Alidu, H.; Tengan, K.M.L. Trait association for improved grain yield of extra-early maturing maize hybrids evaluated in the forest and transitional zones of Ghana. Aust. J. Crop Sci. 2016, 10, 1127–1135. [Google Scholar] [CrossRef]
  22. Alhassan, A.; Salifu, H.; Adebanji, A.O. Discriminant analysis of farmers adoption of improved maize varieties in Wa Municipality, Upper West Region of Ghana. SpringerPlus 2016, 5, 1514. [Google Scholar] [CrossRef] [PubMed] [Green Version]
  23. DTMA (Drought Tolerant Maize for Africa). A Quarterly Bulletin of the Drought Tolerant Maize for Africa Project; CIMMYT: Texcoco, Mexico, 2013; Volume 2. [Google Scholar]
  24. MoFA (Ministry of Food and Agriculture). Agriculture in Ghana Facts and Figures; Ministry of Food and Agriculture, Statistics, Research and Information Directorate (SRID): Accra, Ghana, 2017.
  25. Cakir, R. Effect of water stress at different development stages on vegetative and reproductive growth of corn. Field Crops Res. 2004, 89, 1–16. [Google Scholar] [CrossRef]
  26. Heisey, P.W.; Edmeades, G.O. Maize production in drought-stressed environments: Technical options and research resource allocation. In World Maize Facts and Trends 1997–1998. Part 1; CIMMYT: Texcoco, Mexico, 2019. [Google Scholar]
  27. Van Ittersum, M.K.; Cassman, K.G.; Grassini, P.; Wolf, J.; Tittonell, P.; Hochman, Z. Yield gap analysis with local to global relevance—A review. Field Crops Res. 2013, 143, 4–17. [Google Scholar] [CrossRef] [Green Version]
  28. Keating, B.A.; Carberry, P.S.; Hammer, G.L.; Probert, M.E.; Robertson, M.J.; Holzworth, D.; Smith, C.J. An overview of APSIM, a model designed for farming systems simulation. Eur. J. Agron. 2003, 18, 267–288. [Google Scholar] [CrossRef] [Green Version]
  29. Jones, J.W.; Antle, J.M.; Basso, B.; Boote, K.J.; Conant, R.T.; Foster, I.; Godfray, H.C.J.; Herrero, M.; Howitt, R.E.; Janssen, S.; et al. Brief history of agricultural systems modeling. Agric. Syst. 2017, 155, 240–254. [Google Scholar] [CrossRef]
  30. Antle, J.M.; Basso, B.; Conant, R.T.; Godfray, H.C.J.; Jones, J.W.; Herrero, M.; Howitt, R.E.; Keating, B.A.; Munoz-Carpena, R.; Rosenzweig, C.; et al. Towards a new generation of agricultural system data, models and knowledge products: Design and improvement. Agric. Syst. 2017, 155, 255–268. [Google Scholar] [CrossRef] [PubMed]
  31. Ncube, B.; Dimes, J.P.; van Wijk, M.T.; Twomlow, S.J.; Giller, K.E. Productivity and residual benefits of grain legumes to sorghum under semi-arid conditions in south-western Zimbabwe: Unravelling the effects of water and nitrogen using a simulation model. Field Crops Res. 2009, 110, 173–184. [Google Scholar] [CrossRef] [Green Version]
  32. Whitbread, A.M.; Robertson, M.J.; Carberry, P.S.; Dimes, J.P. How farming systems simulation can aid the development of more sustainable smallholder farming systems in southern Africa. Eur. J. Agron. 2010, 32, 51–58. [Google Scholar] [CrossRef] [Green Version]
  33. Fosu-Mensah, B.Y.; MacCarthy, D.S.; Vlek, P.L.G.; Safo, E.Y. Simulating impact of seasonal climatic variation on the response of maize (Zea mays L.) to inorganic fertilizer in sub-humid Ghana. Nutr. Cycl. Agroecosyst. 2012, 94, 255–271. [Google Scholar] [CrossRef]
  34. Holzworth, D.P.; Huth, N.I.; de Voil, P.G.; Zurcher, E.J.; Herrmann, N.I.; McLean, G.; Keating, B.A. APSIM—Evolution towards a new generation of agricultural systems simulation. Environ. Modell. Softw. 2014, 62, 327–350. [Google Scholar] [CrossRef]
  35. Beletse, Y.G.; Durand, W.; Nhemachena, C.; Crespo, O.; Tesfuhuney, W.A.; Jones, M.R.; Teweldemedhin, M.Y.; Gamedze, S.M.; Bonolo, P.M.; Jonas, S.; et al. Projected Impacts of Climate Change Scenarios on the Production of Maize in Southern Africa: An Integrated Assessment Case Study of the Bethlehem District, Central Free State, South Africa. In Handbook of Climate Change and Agroecosystems: The Agricultural Model Intercomparison and Improvement Project Integrated Crop and Economic Assessments, Part 2; Imperial College Press: London, UK, 2015; pp. 125–157. [Google Scholar]
  36. Kihara, J.; MacCarthy, D.S.; Bationo, A.; Koala, S.; Hickman, J.; Koo, J.; Jones, J.W. Perspectives on climate effects on agriculture: The international efforts of AgMIP in sub-Saharan Africa. In Handbook of Climate Change and Agro-ecosystems: The Agricultural Model Inter-comparison and Improvement Project (AgMIP) Integrated Crop and Economic Assessments; Hillel, D., Rosenzweig, C., Eds.; Imperial College Press: London, UK, 2015; pp. 263–280. [Google Scholar] [CrossRef]
  37. MacCarthy, D.S.; Akponikpe, P.B.I.; Narh, S.; Tegbe, R. Modelling the effect of seasonal climate variability on the efficiency of mineral fertilization on maize in the coastal savannah of Ghana. Nutr. Cycl. Agroecosys. 2015, 102, 45–64. [Google Scholar] [CrossRef]
  38. MacCarthy, D.S.; Kihara, J.; Masikati, P.; Adiku, S.G.K. Decision support tools for site-specific fertilizer recommendations and agricultural planning in selected countries in sub-Sahara Africa. Nutr. Cycl. Agroecosyst. 2018, 110, 343–359. [Google Scholar] [CrossRef]
  39. Poss, R.; Noble, A.D.; Dunin, F.X.; Reyenga, W. Evaluation of ceramic cup samplers to measure nitrate leaching in the field. Eur. J. Soil Sci. 1995, 46, 667–674. [Google Scholar] [CrossRef]
  40. Walkley, A.; Black, I.A. An examination of the Degtjareff method for determining soil organic matter, and a proposed modification of the chromic acid titration method. Soil Sci. 1984, 37, 29–38. [Google Scholar] [CrossRef]
  41. Toth, S.J.; Prince, A.L. Estimation of cation-exchange capacity and exchangeable Ca, K, and Na contents of soils by flame photometer techniques. Soil Sci. 1949, 67, 439–446. [Google Scholar] [CrossRef]
  42. Bray, R.H.; Kurtz, L.T. Determination of total, organic, and available forms of phosphorus in soils. Soil Sci. 1945, 59, 39–46. [Google Scholar] [CrossRef]
  43. RQflex Plus 10 Product. Available online: www.sigmaaldrich.com/catalog/product/mm/116957?lang=en&region=GH&cm_sp=Insite--caContent_prodMerch_gruCrossEntropy_prodMerch10-3 (accessed on 25 March 2020).
  44. Berchie, J.N.; Tengan, M.L.; Agyeman, K.; Gyasi-Boakye, E.; Adu-Appiah, A. Maize Production Guide; Council for Scientific and Industrial Research—Crops Research Institute (CSIR—CRI): Kumasi, Ghana, 2016. [Google Scholar]
  45. Owusu Danquah, E.; Ennin, S.A.; Frimpong, F.; Oteng-Darko, P.; Yeboah, S.; Osei-Adu, J. Adoption of good agricultural practices for sustainable maize and cowpea production: The role of enabling policy. World Res. J. Agri. Sci. (WRJAS) 2015, 2, 028–038. [Google Scholar]
  46. R Core Team. R: A Language and Environment for Statistical Computing; R Foundation for Statistical Computing: Vienna, Austria, 2020; Available online: https://www.R-project.org/ (accessed on 10 August 2020).
  47. SARI (Savanna Agricultural Research Institute). Annual Report for 2005; SARI: Nyankpala, Ghana, 2005. [Google Scholar]
  48. Buah, S.S.J.; Ibrahim, H.; Derigubah, M.; Kuzie, M.; Segtaa, J.V.; Bayala, J.; Zougmore, R.; Ouedraogo, M. Tillage and fertilizer effect on maize and soybean yields in the Guinea savanna zone of Ghana. Agric. Food Secur. 2017, 6, 17. [Google Scholar] [CrossRef] [Green Version]
  49. Kugbe, J.X.; Kombat, R.; Atakora, W. Secondary and micronutrient inclusion in fertilizer formulation impact on maize growth and yield across northern Ghana. Cogent Food Agric. 2019, 5, 1700030. [Google Scholar] [CrossRef]
  50. Atakora, K.W.; Fosu, M.; Marthey, F. Modeling Maize Production towards Site Specific Fertilizer Recommendation in Ghana. Glob. J. Sci. Front. Res. Agric. Vet. 2014, 14, 1. [Google Scholar]
  51. Muchow, R.C.; Davis, R. Effect of nitrogen supply on the comparative productivity of maize and sorghum in a semi-arid tropical environment. II. Radiation interception and bio-mass accumulation. Field Crops Res. 1988, 18, 17–30. [Google Scholar] [CrossRef]
  52. Danso, E.O.; Yakubu, A.; Darrah, Y.O.K.; Arthur, E.; Manevski, K.; Sabi, E.B.; Abenney-Mickson, S.; Ofori, K.; Plauborg, F.; Andersen, M.N. Impact of rice straw biochar and irrigation on maize yield, intercepted radiation and water productivity in a tropical sandy clay loam. Field Crops Res. 2019, 243, 107628. [Google Scholar] [CrossRef]
  53. Abubakar, A.W.; Manga, A.A.; Kamara, A.Y.; Tofa, A.I. Physiological Evaluations of Maize Hybrids under Low Nitrogen. J. Adv. Agric. 2019, 2019, 2624707. [Google Scholar] [CrossRef] [Green Version]
  54. Colombi, T. Feedbacks between soil penetration resistance, root architecture and water uptake limit water accessibility and crop growth—A vicious circle. Sci. Total Environ. 2018, 626, 1026–1035. [Google Scholar] [CrossRef] [PubMed]
  55. Rostamza, M.; Richards, R.A.; Watt, M. Response of millet and sorghum to a varying water supply around the primary and nodal roots. Ann. Bot. 2013, 112, 439–446. [Google Scholar] [CrossRef] [PubMed]
  56. Hund, A.; Reimer, R.; Messmer, R. A consensus map of QTLs controlling the root length of maize. Plant Soil 2011, 344, 143–158. [Google Scholar] [CrossRef] [Green Version]
  57. Tai, H.; Lu, X.; Opitz, N.; Marcon, C.; Paschold, A.; Lithio, A.; Nettleton, D.; Hochholdinger, F. Transcriptomic and anatomical complexity of primary, seminal, and crown roots highlight root type-specific functional diversity in maize (Zea mays L.). J. Exp. Bot. 2016, 67, 1123–1135. [Google Scholar] [CrossRef] [PubMed] [Green Version]
  58. Ahmed, M.A.; Zarebanadkouki, M.; Meunier, F.; Javaux, M.; Kaestner, A.; Carminati, A. Root type matters: Measurement of water uptake by seminal, crown, and lateral roots in maize. J. Exp. Bot. 2018, 69, 1199–1206. [Google Scholar] [CrossRef] [PubMed] [Green Version]
  59. Perego, A.; Basile, A.; Bonfante, A.; De Mascellis, R.; Terribile, F.; Brenna, S.; Acutis, M. Nitrate leaching under Maize cropping systems in Po Valley (Italy). Agric. Ecosyst. Environ. 2012, 147, 57–65. [Google Scholar] [CrossRef]
  60. Ren, B.; Zhang, J.; Li, X.; Fan, X.; Dong, S.; Liu, P.; Zhao, B. Effects of waterlogging on the yield and growth of summer maize under field condition. Can. J. Plant Sci. 2014, 94, 23–31. [Google Scholar] [CrossRef]
  61. Lopez-Pereira, M.; Morris, M. Impact of International Maize Breeding Research in the Developing World; International Maize and Wheat Improvement Centre (CIMMYT): Texcoco, Mexico, 2019. [Google Scholar]
  62. Atakora, W.K.; Kwakye, P.K.; Weymann, D.; Brüggemann, N. Stimulus of nitrogen fertilizers and soil characteristics on maize yield and nitrous oxide emission from Ferric Luvisol in the Guinea Savanna agro-ecological zone of Ghana. Sci. Afr. 2019, 6, e00141. [Google Scholar] [CrossRef]
  63. Srivastava, A.K.; Mboh, C.M.; Gaiser, T.; Ewert, F. Impact of climatic variables on the spatial and temporal variability of crop yield and biomass gap in sub-Saharan Africa—A case study in Central Ghana. Field Crop Res. 2017, 203, 33–46. [Google Scholar] [CrossRef]
  64. Srivastava, A.K.; Mboh, G.; Zhao, C.M.; Gaiser, T.; Ewert, F. Climate change impact under alternate realizations of climate scenarios on maize yield and biomass in Ghana. Agric. Sys. 2018, 159, 157–174. [Google Scholar] [CrossRef]
  65. Qi, Y.; Wei, W.; Chen, C.; Chen, L. Plant root-shoot biomass allocation over diverse biomes: A global synthesis. Glob. Ecol. Conserv. 2019, 18, e00606. [Google Scholar] [CrossRef]
  66. Cameira, M.R.; Fernando, L.; Pereira, S. Monitoring water and NO3-N in irrigated maize fields in the Sorraia Watershed, Portugal. Agric. Water Manag. 2003, 60, 199–216. [Google Scholar] [CrossRef]
  67. Gheysaria, S.M.; Mirlatifi, M.; Homaeeb, M.E.; Hoogenboomd, A.G. Nitrate leaching in a silage maize field under different irrigation and nitrogen fertilizer rates. Agric. Water Manag. 2009, 96, 946–954. [Google Scholar] [CrossRef]
  68. Basso, B.; Ritchie, J.T. Impact of compost, manure and inorganic fertilizer on nitrate leaching and yield for a 6-year maize-alfalfa rotation in Michigan. Agric. Ecosyst. Environ. 2005, 108, 329–341. [Google Scholar] [CrossRef]
  69. Zhou, M.; Klaus, B. Assessment of nitrate leaching loss on a yield-scaled basis from maize and wheat cropping systems. Plant Soil 2014, 374, 977–991. [Google Scholar] [CrossRef]
  70. Lin, B.L.; Sakoda, A.; Shibasaki, R.; Suzuki, M. A modelling approach to global nitrate leaching caused by anthropogenic fertilization. Water Res. 2001, 35, 1961–1968. [Google Scholar] [CrossRef]
Figure 1. Location of the study areas in Ghana.
Agriculture 10 00420 g001
Figure 2. Long-term mean monthly total radiation and rainfall for Atebubu-Amantin (AA) and West Mamprusi (WM). The AA site has two seasons: major (Mar–Jul) and minor (Aug–Nov) season. The boxplot shows variability of rainfall and radiation. The lower horizontal line of the box represents the 25-percentile limit, and the upper horizontal line represents the 75-percentile limit. The line in the box represents the median radiation or rainfall. The dots below the 25 and above 75 percentile limits are outliers.
Agriculture 10 00420 g002
Figure 3. Grain yield (15% moisture content) of maize (t ha−1) against soil nutrient, agronomic practices (plant density and weed pressure) for Amantin-Atebubu major season (AAMajor) (○), Amantin-Atebubu minor season (AAMinor) (●) and WM (△).
Agriculture 10 00420 g003
Figure 4. Average matric potential measured at three depths; 0.30 (🞻), 0.60 (◻), and 0.80 m (◼) using watermark sensors in selected farmers’ fields AA and WM sites. The growing period of the crops is indicated at the top of each plot.
Agriculture 10 00420 g004
Figure 5. NO3-N concentrations of a soil solution collected at 0.30 (○) and 0.60 m (●) depth using suction samplers in six farmers’ fields.
Agriculture 10 00420 g005
Figure 6. Simulated grain yield under 6 N rates, unconstrained root depth (reaches 1.20 m) and various sowing windows for West Mamprusi (WM), major season Atebubu-Amantin (AAMajor) and minor season Atebubu-Amantin (AAMinor). The vertical broken line at 1600 kg ha−1 denotes average observed farmers’ yield for all the sites. The horizontal broken line represents the 90% probability that observed farmers’ yield will be equaled or exceeded.
Agriculture 10 00420 g006
Figure 7. Simulated maize biomass under 6 N rates, various sowing windows, and rooting depth of 1.20 m for West Mamprusi (WM), major season Atebubu-Amantin (AAMajor) and minor season Atebubu-Amantin (AAMinor).
Agriculture 10 00420 g007
Figure 8. Simulated grain yield of maize fertilized 75 kg N rate, soil root penetration constrained at 30, 60, 90 and 1.20 m, and various sowing windows for West Mamprusi (WM), major season Atebubu-Amantin (AAMajor) and minor season Atebubu-Amantin (AAMinor). The vertical broken line denotes average measured farmers’ yield for the sites. The horizontal broken line represents the 90% probability that observed farmers’ yield will be equaled or exceeded.
Agriculture 10 00420 g008
Figure 9. Simulated long term grain yield against sowing and flowering day of the year (April (91–121), May (121–152), June (152–182), July (182–2113), August (210–244), September (244–274), October (274–300)) for 75 kg N ha−1 and 1.20 m rooting depth. Maize below 500 kg ha−1 was considered as crop failure. Intercepts of the regression equations are centered around mean yield. The slope indicates the amount of yield (y) (kg ha−1) that declines for each day a sowing or flowering (x) delays.
Agriculture 10 00420 g009
Figure 10. Simulated NO3-N leaching and drainage for 75 kg N ha−1 rate, different sowing window and constricted rooting depth.
Agriculture 10 00420 g010
Figure 11. Simulated long-term NO3-N leaching and drainage against the yield of 75 kg N ha−1 of AAMajor (○), AAMinor (●), and WM (△) for April, August, and May sowing windows respectively.
Agriculture 10 00420 g011
Figure 12. Simulated NO3-N uptake for different maize rooting depth in treatment receiving 75 kg N ha−1 and for various sowing months. The vertical broken line denotes NO3-N uptake and the horizontal broken line represents the 90% probability that crop uptake will be equaled or exceeded.
Agriculture 10 00420 g012
Figure 13. Simulated water stress index (swdef_photo) for AAMinor at different rooting depth, August sowing window and fertilization treatment 75 kg N ha−1.
Agriculture 10 00420 g013
Figure 14. Simulated leaching (kg N ha−1) loss for a 1.20 m rooting depth, different sowing windows (x axis) and fertilization treatment 75 kg N ha−1.
Agriculture 10 00420 g014
Table 1. Sowing date, harvesting date and fertilizer amount applied by the farmers in Atebubu-Amantin District.
SeasonSowing DateSowing (DOY) **Harvest DateHarvesting (DOY)N Applied *
(kg ha−1)
Days to Harvesting
(Days)
Minor31 July 201221320 December 20123550143
Major5 May 20121269 September 201225359128
Minor27 August 201323920 December 201335438116
Major14 April 20121059 August 201222265118
Minor7 September 201325020 June 20133540104
Minor5 August 201221818 December 201235365136
Minor6 August 201221919 December 2012354101136
Minor8 September 201325118 December 201335219102
* Total N applied represents N applied from compound fertilizer and ammonium sulfate. ** DOY = day of year.
Table 2. Sowing date, harvesting date and fertilizer amount applied by the farmers in West Mamprusi District.
Sowing DateSowing (DOY) **Harvest DateHarvesting
(DOY)
N Applied *
(kg ha−1)
Days to Harvesting
(Days)
20 June 20121723 November 201230876137
12 July 201319313 September 201325619115
11 July 201219330 November 20123350143
12 July 201319323 September 2013266074
9 July 201219120 November 201232562135
11 July 20131925 November 201330925118
15 June 20121671 November 201230640140
29 June 20131805 October 20132784199
* Total N applied represents N applied from compound fertilizer and ammonium sulfate. ** DOY = day of year.
Table 3. Soil physical and chemical properties of studied farmers’ fields.
SiteDepth (m)Exchangeable Cations (Centimol+ kg−1)Org. C (%)pHTotal N (%)
Ca2+Mg2+K+Na+
A0.301.341.340.120.040.695.70.06
0.602.140.530.160.050.115.30.01
B0.302.670.530.030.020.755.60.06
0.602.670.530.040.020.595.90.05
C0.301.340.530.050.030.865.50.08
0.601.340.530.030.020.485.40.04
D0.303.201.340.090.030.966.00.08
0.601.600.530.060.030.665.70.06
E0.304.271.870.110.040.866.30.08
0.602.141.600.050.030.735.80.07
F0.301.340.800.040.020.575.80.05
0.601.341.070.050.030.505.50.04
G0.301.871.340.060.030.346.50.02
0.601.601.070.050.030.186.50.02
H0.302.401.070.190.051.196.170.06
0.602.141.340.110.041.036.070.05
I0.302.140.800.120.040.986.10.05
0.601.601.070.110.040.715.90.04
J0.304.010.800.260.070.826.260.07
0.604.010.800.160.050.445.990.04
Table 4. Soil water characteristics of studied fields.
SiteDepth
(m)
LL
(mm mm−1)
DUL
(mm mm−1)
SAT
(mm mm−1)
Bulk Density
(g cm−3)
PAW
(mm)
A0.300.060.210.31.4945
0.600.060.210.31.5845
B0.300.060.210.31.4545
0.600.060.210.31.4545
C0.300.150.190.31.4512
0.600.120.170.31.5215
D0.300.150.190.31.4112
0.600.120.170.31.3715
E0.300.150.190.31.4112
0.600.120.170.31.4315
F0.300.100.240.31.4942
0.600.100.240.31.5842
G0.300.100.240.31.4542
0.600.100.240.31.4542
H0.300.120.200.31.4524
0.600.120.180.31.5218
I0.300.120.200.31.4124
0.600.120.180.31.4818
LL, DUL and SAT, are saturated, Lower Limit and Drained Upper Limit of soil water respectively; PAW is Plant Available Water.
Table 5. Soil hydraulic properties used in Agricultural Production Systems Simulator (APSIM) for scenario simulations.
Soil Layers (m)West Mamprusi (WM)AA Major and AA Minor
LL **DULSATMaize LL *LL **DULSATMaize LL *
0–0.100.060.240.30.060.10.210.30.1
0.10–0.200.060.240.30.060.10.210.30.1
0.20–0.300.060.240.30.060.10.210.30.1
0.30–0.450.070.240.30.070.110.210.30.11
0.45–0.600.070.240.30.080.110.20.30.12
0.60–0.900.070.220.30.100.110.190.30.13
0.90–1.200.070.200.30.120.110.180.30.14
* Maize LL (lower limit) indicates the extent to which maize can extract water from the soil. ** LL refers to permanent wilting point. All measurements are in mm mm−1.
Table 6. APSIM root related soil input parameters used for scenario simulations.
Soil ParametersValues
kli *0–0.06
xfi **1
* A constant which is used to limit soil water extraction from a particular soil layer (m3 m−3). ** Root exploration factor used to consider physical constraints that slows down root advancement to different depths was considered non limiting. i refers to number of layers.

