
Growth of Pancreas and Intestinal Enzyme Activities in Growing Goats: Influence of a Low-Protein Diet
by
 , and
, and
Kefyalew Gebeyew
1,2 ,
,
Wenxun Chen
1,2,
Qiongxian Yan
1,3,
Zhixiong He
1,2,3,* and
Zhiliang Tan
1,2,3 1
CAS Key Laboratory for Agro-Ecological Processes in Subtropical Region, National Engineering Laboratory for Pollution Control and Waste Utilization in Livestock and Poultry Production, Hunan Provincial Key Laboratory of Animal Nutritional Physiology and Metabolic Process, Institute of Subtropical Agriculture, The Chinese Academy of Sciences, Changsha 410125, China
2
University of Chinese Academy of Sciences, Beijing 100049, China
3
Hunan Co-Innovation Center of Animal Production Safety (CICAPS), Changsha 410128, China
*
Author to whom correspondence should be addressed.
Agriculture 2021, 11(11), 1155; https://doi.org/10.3390/agriculture11111155
Submission received: 3 November 2021
/
Revised: 15 November 2021
/
Accepted: 15 November 2021
/
Published: 18 November 2021
(This article belongs to the Special Issue Improvement and Innovation in the Nutritional Quality and Technologies of Animal Feed)
Abstract
:A dependence between dietary protein and starch levels flowing to the duodenum has been characterized in monogastric animals for optimal enzymatic secretions of the pancreas, but those in ruminants remain unclarified. The present experiment was conveyed to assess the pancreas growth and mRNA expression of the small intestine enzymes in growing goats fed a low-protein diet. Twenty-four Liuyang goats (19.55 ± 3.55 of body weight (BW)) and aged approximately 8 months were randomly assigned to either a control protein diet (NP: 10.77% CP) or a low-protein diet (LP: 5.52% CP) for 70 days. The results show that no statistical differences (p > 0.05) were observed in the pancreas growth indices between the groups. Pancreas and small intestine α-amylase and lipase activities were unaffected (p > 0.05) by the LP diet, while activities of trypsin and chymotrypsin were decreased (p < 0.05). The LP diet reduced (p < 0.05) the mRNA expressions of trypsin and chymotrypsin in the duodenum and jejunum, and had no effects (p > 0.05) on the mRNA expressions of α-amylase and lipase. Goats fed with the LP diet had higher (p < 0.05) concentrations of cholecystokinin and insulin than those fed with the NP diet. In conclusion, feeding an LP diet (5.52% CP) had no profound influence on pancreas growth and digestive enzyme synthesis in goats.
1. Introduction
The combined need to reduce feed costs and nitrogen (N) losses to the environment and to improve the efficiency of feed has resulted in transformed interest to reduce protein levels in the diets of ruminants [1]. Several studies have recently adopted dietary nutrition strategies to probe the effects of feeding decreased dietary protein levels on performance and metabolism in ruminants. Cortese et al. [2] have noticed that reducing dietary protein levels from 15% to 13.5% of DM does not affect the feed efficiency and growth performance of growing bulls during growing and finishing phases. Conversely, decreasing dietary protein levels by 2.8% than that of the NRC recommendations seems to affect the growth performance but improved feed efficiency in goat kids [3]. Huhtanen and Hristov [4] have shown using a meta-analysis that reducing dietary protein is an essential way to improve the efficiency of dietary protein utilization. However, this approach may result in inadequate provision of amino acids and small peptides in the small intestine that credits to growth impairment. Growth is a complex event that depends on many factors, mainly animal digestive functions [5]. Digestive enzymes production and their responses to high or low dietary protein levels are crucial in determining how effectively a given diet promotes growth and feed utilization [6].
The ability to extract the essential nutrients from the diet is required to grow or maintain life. The small intestine has a vital role in the nutrient extraction and absorption process [7]. Adequate digestive enzymes are required to extract nutrients from the consumed feed and break down macronutrients into an easily absorbed form [8]. He et al. [6] have shown that reducing protein levels in the diets affects the expression of proteolytic enzymes in two growth stages of pigs. However, the influence of a low-protein (LP) diet on digestive enzyme production in goats is unclear due to the complex nature of pre-gastric digestion in ruminants. A close association between the secretion of digestive enzymes from the pancreas and the efficiency of nutrient utilization, such as starch, has been reported [9,10]. The pancreas is a vital gland in the animal digestive system since it represents one of the potential sources of digestive enzymes and bicarbonate [11]. (Rinderknecht et al., 1983). The pancreas juice secreted by the pancreas is comprised of several types of digestive enzymes, including α-amylase, lipase, trypsin, and chymotrypsin [12]. (Williams et al., 2010). Those enzymes are essential for the digestion and absorption of various nutrients to be utilized in the intermediary metabolism [11]. Several factors influence the secretion of pancreas enzymes, including dietary protein and starch [13] and dietary amino acids (AA) [14]. Thus, to gain more insight into the influence of a low protein diet on the growth of pancreas and digestive enzyme activity in goats, we determined the plasma AA concentrations and hormones, enzyme activity, and relative levels of the mRNAs specific for α-amylase, lipase, trypsin, and chymotrypsin.
2. Materials and Methods
2.1. Animals and Experimental Design
Twenty-four Liuyang black female goats with initial body weight (NP: 19.88 ± 2.34; LP: 19.20 ± 2.31 kg) and about 8 ± 0.3 months old were used in this study. The goats were randomly assigned to either the control protein diet (NP: 10.77% CP) and the low protein diet group (LP: 5.52% CP). Animals were penned individually in stainless cages and were fed a diet twice daily (0700 and 1700 h) in two equal portions. The roughage was rice straw, and the concentrate to roughage ratio was 30:70. The experimental diets were prepared according to the goats feeding standard in China (NYT816-2004). The diet ingredients and nutrient levels are shown in Table 1. Diets were formulated to be iso-caloric, and water was supplied ad libitum. The total feeding trial period was 70 days, including 25 days for adaption and 45 days’ experiments. The adaptation was sufficient for the animal to adjust to a low-protein diet and individual pen. The 4–8 weeks of feeding period was adequate to assess influence dietary intervention of pancreas growth and digestive enzyme activities as previously described by Swanson et al. [15]. Feed supplied was adjusted for each group in the morning according to previous day dry matter intake (DMI) at least 5% refusals. All experimental animal procedures were performed according to protocols approved by the Animal Care Committee of the Institute of Subtropical Agriculture, Chinese Academy of Sciences, Changsha, China (ISA-2019-0115).
2.2. Sample Collection Methods
Upon completion of the trial, twenty-four goats were slaughtered after 16 h of fasting. The animals were killed by bleeding the jugular vein by a registered veterinarian. Before slaughter, 10 mL of blood was sampled from the jugular vein into a heparinized syringe and quickly centrifuged at 2500× g for 15 min at 4 °C. Then, plasma was transferred into a 2 mL centrifuge tube containing heparin sodium. The plasma samples were kept at −80 °C for CCK, INSU, and AA determination. The pancreas was quickly separated, recorded the weight, and subsamples were taken. Then, subsamples were flash-frozen in liquid nitrogen and kept at −80 °C for subsequent analysis. Following the abdominal cavity dissection, the duodenum, jejunum, and ileum mucosa were collected, emptied of contents and spread out onto a glass plate placed lying on the ice. Each section of the intestinal mucosa was scraped off with a glass slide, flash-frozen in liquid nitrogen, and kept at −80 °C.
2.3. Chemical Composition of Diet
All samples of feeds were dried and ground to pass via a 1-mm sieve and assayed for dry matter (DM) (105 °C, 24 h). Ash content was assayed using a muffle furnace at 550 °C for 8 h. Organic matter (OM) was computed by the difference between the dry matter and ash content. Crude protein (CP) (N × 6.25) content was assayed following the methods Kjeldahl method [16]. Gross energy (GE) content was determined using an isothermal automatic calorimeter (5E-AC 8018, Changsha Kaiyuan Instruments Co. Ltd., Changsha, China). Neutral detergent fiber (NDF) and acid detergent fiber (ADF) contents were determined according to the methods of Van Soest et al. [17] and NDF was determined with the addition of amylase and sodium sulfite.
2.4. Plasma Free Amino Acids
The concentrations of free amino acids in the plasma were determined using the oxidation analysis method on an Applied Biosystems 3200 Q TRAP LC/MS/MS system equipped with an RP-C18 column (150 mm length, 4.6 mm diameter, 5 mm particle size) [18].
2.5. Measurement of Plasma CCK and Insulin Levels
The plasma levels of cholecystokinin (CCK) and insulin (INSU) were assayed using the goat enzyme-linked immunosorbent assay (ELISA) kits according to the manufacturer’s directions (Jiangsu Yutong Biological Technology Co., Ltd., Changzhou, China) [19,20]. The Intra-assay and inter-assay coefficient of variation (CV) for CCK and INSU were <7% and <10%, and <4% and <6%, respectively. The levels of CCK and insulin INSU were expressed as pg/mL and µIU/mL, respectively.
2.6. Pancreas Growth
The pancreas growth was evaluated following the methods described in the previous study of Crozier et al. [21]. Pancreas DNA was extracted and then quantified using a DNA quantification kit (Tiangen Biotech Co., Ltd., Beijing, China). The concentrations of protein in the pancreas and intestinal tissues were detected using the bicinchoninic acid procedure (BCA Protein Assay Kit; Beyotime Biotech Inc, Shanghai, China) using bovine serum albumin as the standard. The contents of total protein and DNA in the pancreas were computed by multiplying their concentrations with the weight of fresh tissue. DNA concentrations were used as a surrogate index to tissue hyperplasia (increased cell number), and total protein to DNA ratio (protein: DNA) was used as surrogate indices to tissue hypertrophy (increased cell size) [16].
2.7. Determination of Enzyme Activity
Pancreas tissue sample (~1 g) was weighed and homogenized in a homogenizing solution containing 0.1% Triton X-100 (v/v) and 0.5 mM magnesium chloride. The homogenate was sonicated for 15 s and then centrifuged at 1000× g at 4 °C for 10 min. The supernatant was used for assays of the total protein and enzyme activities. The activity levels of α-amylase, lipase, trypsin, and chymotrypsin were detected using a commercial kit according to the manufacturer’s protocols without any modification (Nanjing Jiancheng Bioengineering Institute, Nanjing, China). The results were expressed as U/mg protein (activity per milligram protein).
2.8. RNA Extraction and cDNA Synthesis
Total RNA from the duodenum, jejunum, and ileum samples were extracted using Takara kit (TaKaRa Biotechnology Co. Ltd., Dalian, China) according to the manufacturer’s guidelines. The amount and purity of total RNA were confirmed using a NanoDrop 2000 spectrophotometer (Thermo Fisher Scientific, Waltham, MA, USA). The RNA integrity was confirmed by running an aliquot of the RNA sample on a denaturing agarose gel. The cDNA synthesis was performed by using the PrimeScript RT reagent Kit with gDNA Eraser and random RT primers Mix (TaKaRa Biotechnology Co. Ltd., Dalian, China) following the manufacturer’s guidelines. The cDNA was kept at −20 °C until subsequent analyses.
2.9. Quantification of mRNA Levels
Real-time quantitative PCR was performed using the SYBR Premix Ex TaqTM II kit (TaKaRa Biotechnology Co. Ltd.) to quantify the transcripts of the genes coding for the intestinal α-amylase, lipase, trypsin, and chymotrypsin. Primer sequences of the target genes and internal references are listed in Table 2, and all primers were synthesized by Sangon Biotech Co., Ltd. (Shanghai, China). The real-time PCR for expression of genes was carried out on a Lightcycler 480 II System (Roche, Basel, Switzerland) with SYBR Premix Ex Taq II 98 (Tli RNaseH Plus) detection kit (Accurate Biotechnology Co. Ltd., Changesha, China). The thermal cycles were as follows: initial denaturation at 95 °C for 5 min; 40 cycles of 95 °C for 10 s, 60 °C for 30 s, and 72 °C for 30 s; and a final extension at 72 °C for 5 min. The average cycle threshold values were computed using the 2−ΔΔCt method (Livak and Schmittgen 2001). All samples were run in triplicate and the internal control gene was β-actin [22].
2.10. Statistical Analysis
Statistical analyses of the experimental data were carried out using the SPSS version 23 (SPSS Inc., Chicago, IL, USA). All the data were checked for normality and homoscedasticity of variance using the Shapiro–Wilk test and Levene’s test, respectively. After that, an independent t-test procedure was used to analyze the data using the treatment group as an independent variable and pancreatic growth indices, digestive enzyme, free Amin acids, hormones, and gene expression data as a dependent variable. The statistical difference was declared at p ≤ 0.05, and the tendency was considered at 0.05 < p ≤ 0.10 for all statistical analyses. Means ± standard errors of the mean (SEMs) were used to present the results.
3. Results
3.1. Pancreas Growth
The effects of a low-protein (LP) diet on the pancreas growth are shown in Table 3. The LP diet tended to have lower total pancreas DNA content (mg/kg of body weight (BW); p = 0.072) than those fed with control protein (NP) diet. No significant differences (p > 0.05) were observed in the BW, pancreas weight (g and g/kg of BW), pancreas DNA content (mg/g of the pancreas), pancreas protein content (mg/g of the pancreas and mg/kg of BW), and protein to DNA ratio between the groups. No significant differences (p > 0.05) were detected in dry matter intakes, average daily gain and carcass weight between the two groups (data not shown).
3.2. Enzymes Activity
The effects of the LP diet on pancreas, duodenum, jejunum and ileum enzyme activities are shown in Figure 1. The LP diet decreased the activity of trypsin and chymotrypsin in the pancreas, duodenum, jejunum, and ileum (p < 0.05), but did not affect (p > 0.05) the activity of α-amylase and lipase in the respective tissue. The activity of lipase in the ileum showed a tendency of reduction (p = 0.09).
3.3. Digestive Enzymes mRNA Levels
The mRNA expression levels α-amylase, lipase, trypsin, and chymotrypsin in the small intestinal were detected to assess the effects of the LP diet on digestive enzymes at transcript levels (Figure 2). The relative expression of trypsin and chymotrypsin mRNA in the duodenum and jejunum were decreased (p < 0.05) in the LP group. The LP diet tended to decrease the relative expression of trypsin (p = 0.06) and chymotrypsin mRNA (p = 0.07) in the ileum. No significant differences (p > 0.05) in the relative expression levels of α-amylase and lipase mRNA in the duodenum, jejunum, and ileum were observed between the two groups.
3.4. Plasma Free Amino Acid and Hormones Concentrations
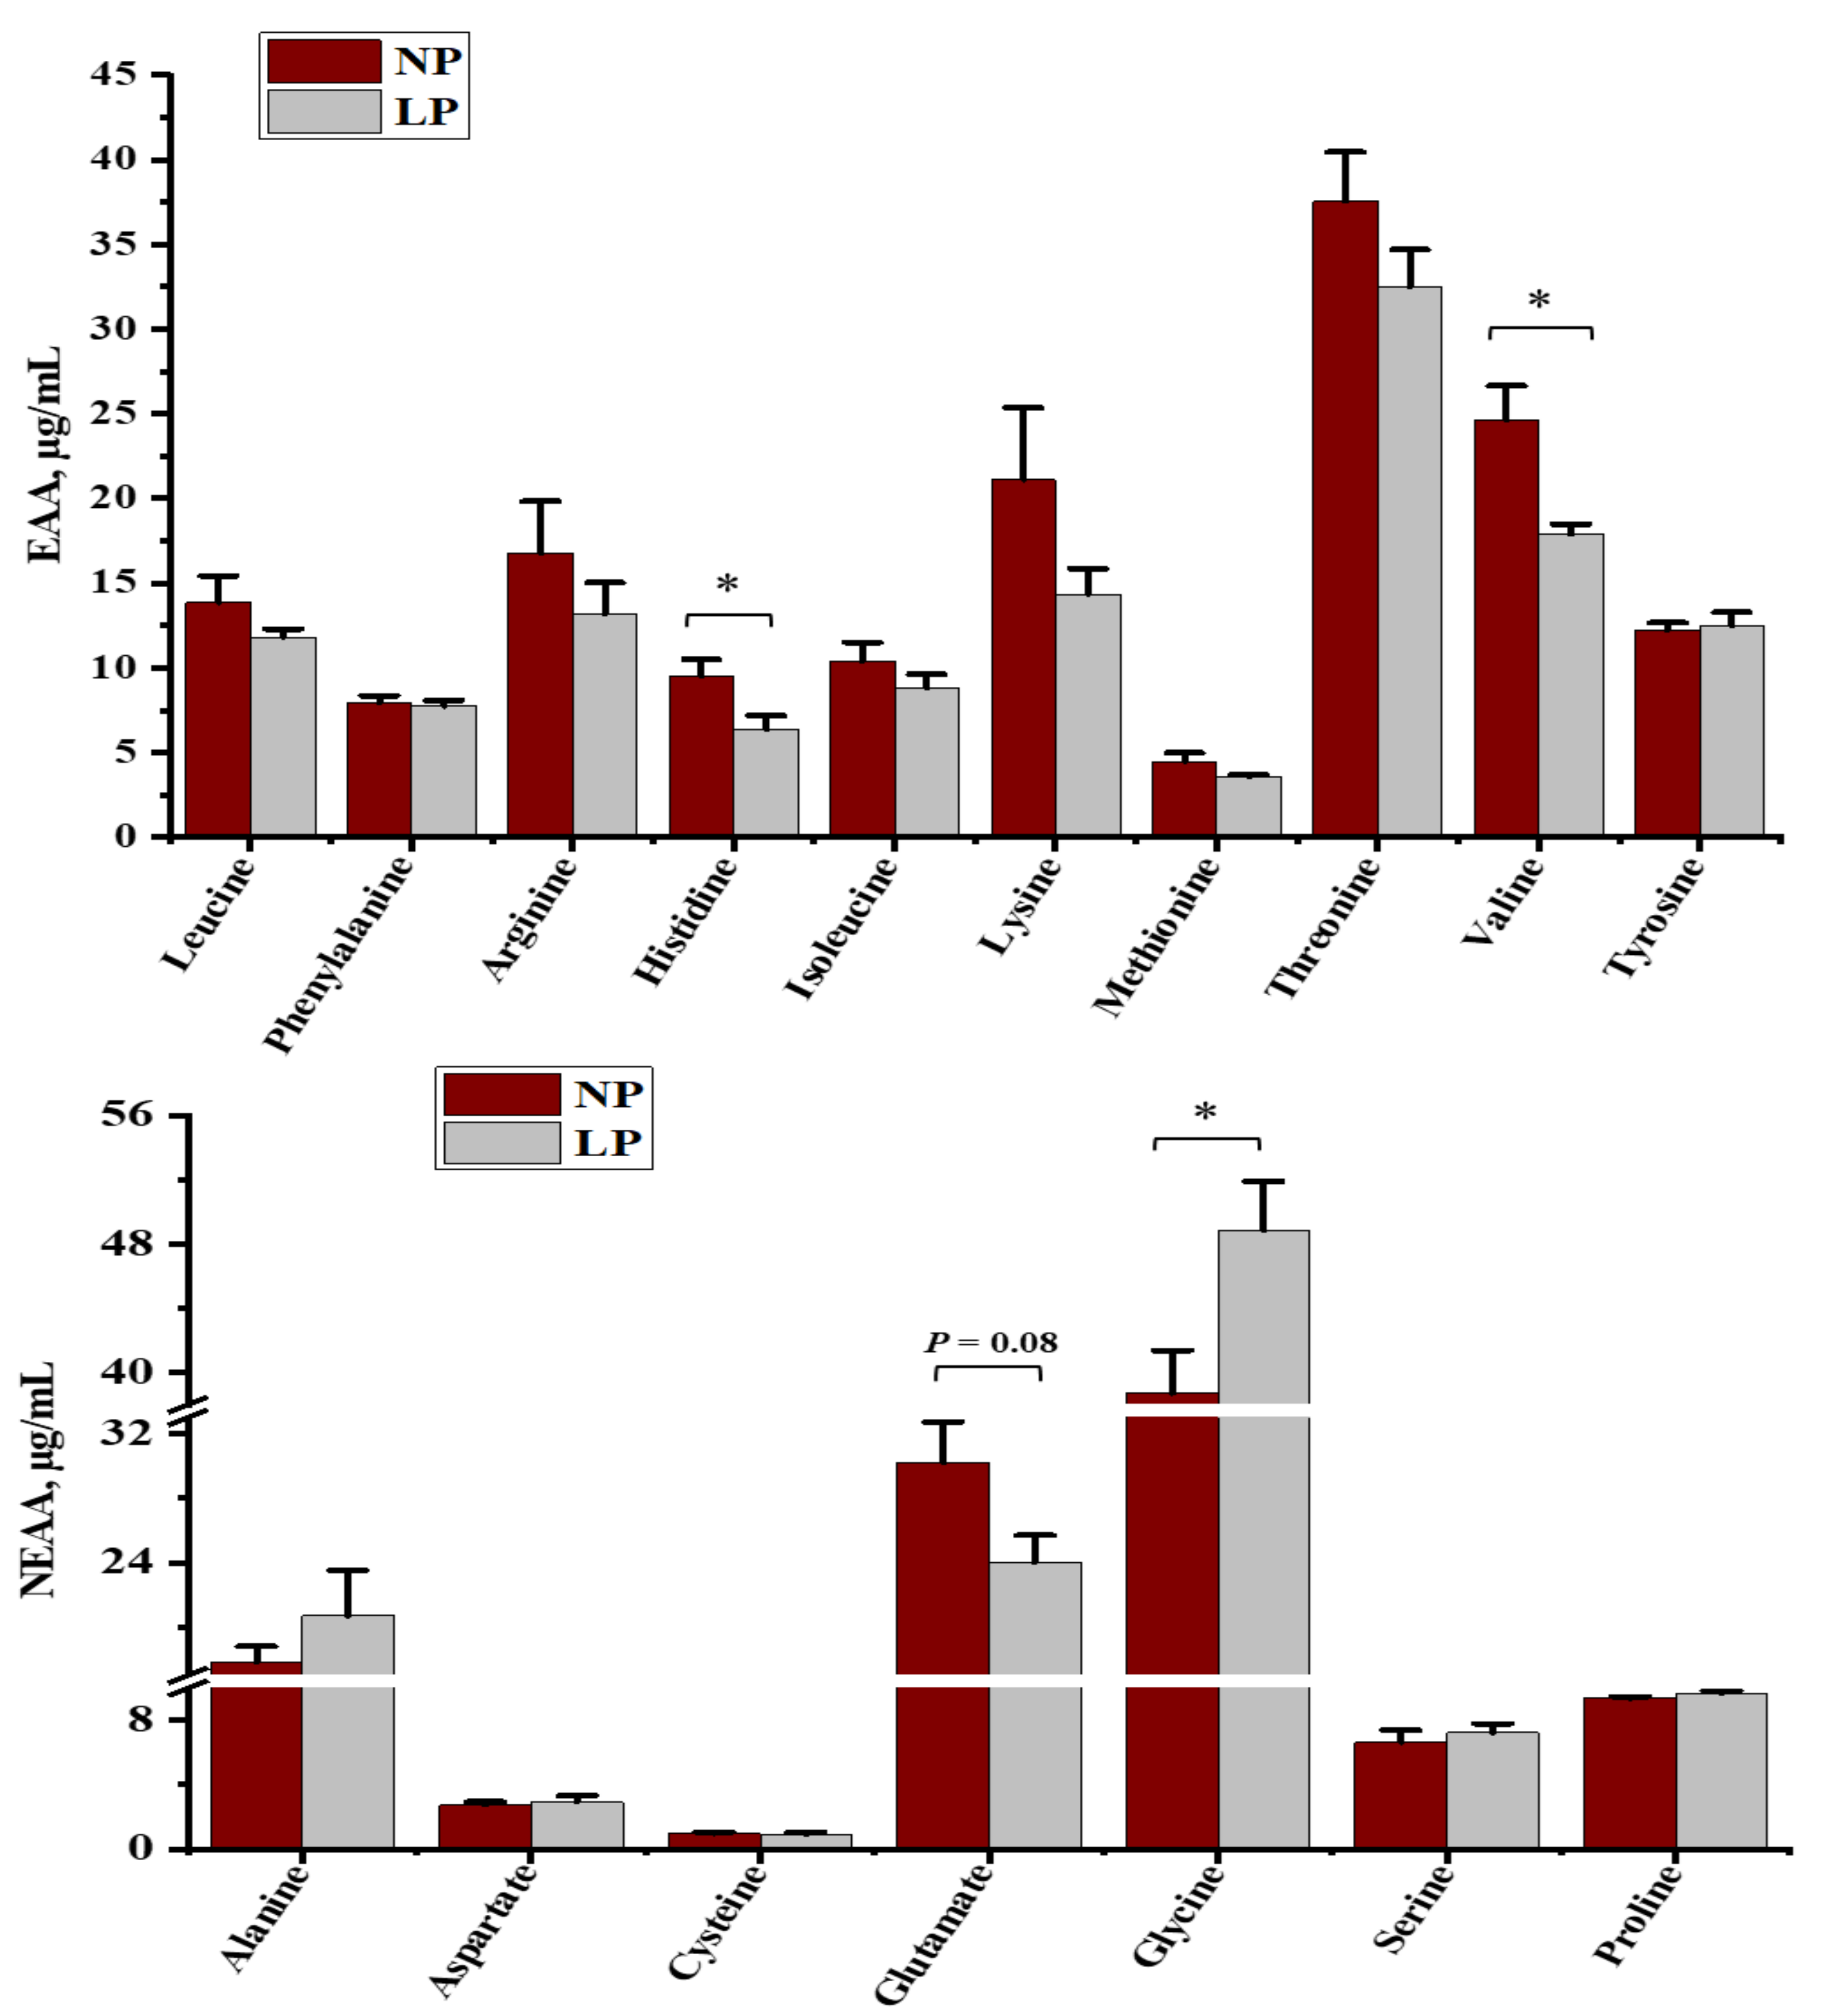
The plasma-free amino acid profiles of growing goats fed with an LP diet are summarized in Figure 3. Feeding a LP diet decreased histidine, valine, and tended to decrease glutamate (p = 0.08) but increased glycine concentrations (p < 0.05) for growing goats. Goats fed with the LP diet had higher (p < 0.05) concentrations of plasma CCK and INSU than those fed with the NP diet (Figure 4).
4. Discussion
The weight of the pancreas and the pancreas index can reflect the body’s function to a certain extent [16]. Pancreas cell size and number can be used to evaluate pancreas growth because it affects pancreas enzyme activity [16,23]. It has been documented that pancreas digestive enzymes respond to alters in tissue weight [23]. A previous study has found a relationship between pancreas α-amylase and trypsin activities and pancreas size in weaning calves [24]. Conversely, duodenal infusion of phenylalanine to adult goats can improve the total α-amylase activity by enhancing the α-amylase protein concentration without changing the size of the pancreas [25]. In this study, feeding the LP diet (5.52% CP) did not affect pancreatic weight, pancreatic protein concentrations and the protein: DNA ratio. However, it reduced the activity of trypsin and chymotrypsin in the pancreas in growing goats. This result was in line with previous findings, in which Swanson et al. [16] have found that dietary protein levels influence the pancreas enzyme activity without affecting pancreas growth in growing steers. The lack of difference in pancreatic growth would be due to the quantity of the starch reaching the small intestine.
Our data showed that feeding the LP diet had no significant influences on the activity of α-amylase and lipase in the pancreatic and small intestinal. However, it affected the trypsin and chymotrypsin activity. As pancreatic hypertrophy remained unaffected and the concentration of plasma CCK and INSU were increased in the LP diet group, we concluded that the decreased in proteolytic enzymes is not due to an overall reduction in enzyme production but a specific decrease in trypsin and chymotrypsin synthesis. Possibly, imbalance of inhibitory and stimulatory signal results in reduction of proteolytic enzymes. Alternatively, the LP diet influences secretion of proteolytic digestive enzyme independent of pancreatic cell size and CCK and INSU effects. In this sense, Lacourse et al. [26] have shown using CCK deficient mice that CCK is not compulsory for protein-induced changes in the pancreatic cell size and proteolytic enzyme synthesis, which may partially explain our results.
Postruminal digestive enzymes flow in ruminants have multifaceted nature because several neurohormonal signaling mechanisms participate in the synthesis and secretion of the digestive enzyme [27,28]. The possible mechanisms may include alterations in digestive enzymes mRNA that primarily occur at the transcriptional and translational levels [29,30]. Our data showed that LP diet supplementation significantly decreased the relative expression of the trypsin and chymotrypsin gene in the duodenum and jejunum, and tended to decrease in the ileum. Such a decrease in the relative mRNA expressions might be associated with reduced protein flow. Swanson et al. [27] have proven that an increased post-ruminal flow of protein enhances the mRNA abundance of α-amylase, but increased starch flow reduces the mRNA abundance α-amylase in lambs. Another reason for the decrease in the relative mRNA expression for the LP group may be associated with changes in free AA compositions induced by a low protein diet. The plasma free AA concentrations have shown a tendency to reduce in the LP group, particularly the histidine and valine concentrations. It would contribute to decreasing the mRNA expression by involving them in the various pathway that enables to modulate the gene expression of digestive enzyme in animals [31].
5. Conclusions
Goats fed with an LP diet decreased proteolytic enzymes synthesis without significant changes in pancreas weight, DNA, and protein concentrations. The mRNA expression of trypsin and chymotrypsin mRNA was reduced by the LP diet. Data from this study suggest that the LP diet (5.52% CP) had no profound impact on post-ruminal digestion and absorption function of Liuyang black goat evident by the unaltered pancreas hypertrophy and intestine enzyme activity and increased hormones.
Author Contributions
K.G.: laboratory and statistical analysis and writing original draft and revision including pre- and post-publication stages; W.C.: Conceptualization and conducted the trial, Z.H. and Q.Y.: Conceptualization, Visualization and Supervision; Z.H. and Z.T.: supervision and funding acquisition. All authors have read and agreed to the published version of the manuscript.
Funding
This research was funded by the National Natural Science Foundation of China [grant number: 31730092], CAS Science and Technology Service Network Initiative [grant number: KFJ-STS-ZDTP-075], and Innovation Province Project [grant number: 2019RS3021].
Institutional Review Board Statement
The study was conducted according to the guidelines of the Institute of Subtropical Agriculture, Chinese Academy of Sciences, Changsha, China, and approved by the Institutional animal care Committee (protocol code: ISA-2019-0115).
Informed Consent Statement
Not applicable.
Data Availability Statement
Not applicable.
Conflicts of Interest
The authors reported no potential conflict of interest. The funders had no role in the design of the study; in the collection, analyses, or interpretation of data; in the writing of the manuscript, or in the decision to publish the result.
Research Involving Human and Animal Rights
All applicable international, national, and/or institutional guidelines for the care and use of animals were followed. This article does not contain any studies with human participants performed by any of the authors.
References
- Sinclair, K.D.; Garnsworthy, P.C.; Mann, G.E.; Sinclair, L.A. Reducing dietary protein in dairy cow diets: Implications for nitrogen utilization, milk production, welfare and fertility. Animals 2014, 8, 262–274. [Google Scholar] [CrossRef] [Green Version]
- Cortese, M.; Segato, S.; Andrighetto, I.; Ughelini, N.; Chinello, M.; Schiavon, E.; Marchesini, G. The Effects of Decreasing Dietary Crude Protein on the Growth Performance, Feed Efficiency and Meat Quality of Finishing Charolais Bulls. Animals 2019, 9, 906. [Google Scholar] [CrossRef] [Green Version]
- Zhu, W.; Xu, W.; Wei, C.; Zhang, Z.; Jiang, C.; Chen, X. Effects of Decreasing Dietary Crude Protein Level on Growth Performance, Nutrient Digestion, Serum Metabolites, and Nitrogen Utilization in Growing Goat Kids (Capra hircus). Animals 2020, 10, 151. [Google Scholar] [CrossRef] [Green Version]
- Huhtanen, P.; Hristov, A.N. A meta-analysis of the effects of dietary protein concentration and degradability on milk protein yield and milk N efficiency in dairy cows. J. Dairy Sci. 2009, 92, 3222–3232. [Google Scholar] [CrossRef] [PubMed]
- Owens, F.N.; Dubeski, P.; Hanson, C.F. Factors that alter the growth and development of ruminants. J. Anim. Sci. 1993, 71, 3138–3150. [Google Scholar] [CrossRef] [PubMed]
- He, L.; Wu, L.; Xu, Z.; Li, T.; Yao, K.; Cui, Z.; Yin, Y.; Wu, G. Low-protein diets affect ileal amino acid digestibility and gene expression of digestive enzymes in growing and finishing pigs. Amino Acids 2016, 48, 21–30. [Google Scholar] [CrossRef] [PubMed]
- Liou, A.P. Digestive physiology of the pig symposium: G protein-coupled receptors in nutrient chemosensation and gastroin-testinal hormone secretion. J. Anim. Sci. 2013, 91, 1946–1956. [Google Scholar] [CrossRef] [PubMed] [Green Version]
- Kaji, I.; Akiba, Y.; Kaunitz, J.D. Digestive Physiology of the Pig Symposium: Involvement of gut chemosensing in the regulation of mucosal barrier function and defense mechanisms1,2. J. Anim. Sci. 2013, 91, 1957–1962. [Google Scholar] [CrossRef] [Green Version]
- Harmon, D.L. Understanding Starch Utilization in the Small Intestine of Cattle. Asian-Australas. J. Anim. Sci. 2009, 22, 915–922. [Google Scholar] [CrossRef]
- Xu, M.; Du, S.; Wang, J.; Yu, Z.P.; Harmon, D.L.; Yao, J.H. Influence of rumen escape starch on pancreatic exocrine secretion of goats. J. Anim. Physiol. Anim. Nutr. 2009, 93, 122–129. [Google Scholar] [CrossRef]
- Rinderknecht, H.; Maset, R.; Collias, K.; Carmack, C. Pancreatic secretory profiles of protein, digestive, and lysosomal enzymes in Syrian golden hamster. Dig. Dis. Sci. 1983, 28, 518–525. [Google Scholar] [CrossRef]
- Williams, J.A. Regulation of acinar cell function in the pancreas. Curr. Opin. Gastroenterol. 2010, 26, 478–483. [Google Scholar] [CrossRef] [Green Version]
- Trotta, R.J.; Sitorski, L.G.; Acharya, S.; Brake, D.W.; Swanson, K.C. Duodenal Infusions of Starch with Casein or Glutamic Acid Influence Pancreatic and Small Intestinal Carbohydrase Activities in Cattle. J. Nutr. 2020, 150, 784–791. [Google Scholar] [CrossRef] [PubMed]
- Cao, Y.C.; Yang, X.J.; Guo, L.; Zheng, C.; Wang, D.D.; Cai, C.J.; Liu, S.M.; Yao, J.H. Effects of dietary leucine and phenylalanine on pancreas development, enzyme activity, and relative gene expression in milk-fed Holstein dairy calves. J. Dairy Sci. 2018, 101, 4235–4244. [Google Scholar] [CrossRef] [PubMed] [Green Version]
- Swanson, K.C.; Kelly, N.; Salim, H.; Wang, Y.J.; Holligan, S.; Fan, M.Z.; McBride, B.W. Pancreatic mass, cellularity, and α-amylase and trypsin activity in feedlot steers fed diets differing in crude protein concentration. J. Anim. Sci. 2008, 86, 909–915. [Google Scholar] [CrossRef]
- Association of Official Analytica Chemists (AOAC). Method of Analysis, 16th ed.; The Association of Official Analytical Chemist: Washington, DC, USA, 1999. [Google Scholar]
- Van Soest, P.J.; Robertson, J.B.; Lewis, B.A. Methods for Dietary Fiber, Neutral Detergent Fiber, and Nonstarch Polysaccharides in Relation to Animal Nutrition. J. Dairy Sci. 1991, 74, 3583–3597. [Google Scholar] [CrossRef]
- Adebowale, T.; Shunshun, J.; Yao, K. The effect of dietary high energy density and carbohydrate energy ratio on digestive enzymes activity, nutrient digestibility, amino acid utilization and intestinal morphology of weaned piglets. J. Anim. Physiol. Anim. Nutr. 2019, 103, 1492–1502. [Google Scholar] [CrossRef]
- Gebeyew, K.; Yang, C.; He, Z.; Tan, Z. Low-protein diets supplemented with methionine and lysine alter the gut microbiota composition and improve the immune status of growing lambs. Appl. Microbiol. Biotechnol. 2021, 105, 8393–8410. [Google Scholar] [CrossRef] [PubMed]
- Gebeyew, K.; Chen, K.; Wassie, T.; Azad, M.A.K.; He, J.; Jiang, W.; Song, W.; Tan, Z.; He, Z. Dietary Amylose/Amylopectin Ratio Modulates Cecal Microbiota and Metabolite in Weaned Goats. Front. Nutr. 2021, 8, 774766. [Google Scholar] [CrossRef]
- Crozier, S.J.; Sans, M.D.; Lang, C.H.; D’Alecy, L.G.; Ernst, S.A.; Williams, J.A. CCK-induced pancreatic growth is not limited by mitogenic capacity in mice. Am. J. Physiol. Gastrointest. Liver Physiol. 2008, 294, G1148–G1157. [Google Scholar] [CrossRef] [Green Version]
- Livak, K.J.; Schmittgen, T.D. Analysis of relative gene expression data using real-time quantitative PCR and the 2-ΔΔCT method. Methods 2001, 25, 402–408. [Google Scholar] [CrossRef] [PubMed]
- Wang, X.B.; Ogawa, T.; Suda, S.; Taniguchi, K.; Uike, H.; Kumagai, H.; Mitani, K. Effects of nutritional level on digestive enzyme activities in the pancreas and small intestine of calves slaughtered at same body weight. Asian Australas. J. Anim. Sci. 1998, 11, 375–380. [Google Scholar] [CrossRef]
- Swanson, K.C.; Matthews, J.C.; Woods, C.A.; Harmon, D.L. Postruminal Administration of Partially Hydrolyzed Starch and Casein Influences Pancreatic α-Amylase Expression in Calves. J. Nutr. 2002, 132, 376–381. [Google Scholar] [CrossRef] [Green Version]
- Yu, Z.P.; Xu, M.; Yao, J.H.; Liu, K.; Li, F.; Liu, Y.; Wang, F.; Sun, F.F.; Liu, N.N. Regulation of pancreatic exocrine secretion in goats: Differential effects of short- and long-term duodenal phenylalanine treatment. J. Anim. Physiol. Anim. Nutr. 2012, 97, 431–438. [Google Scholar] [CrossRef]
- LaCourse, K.A.; Swanberg, L.J.; Gillespie, P.J.; Rehfeld, J.F.; Saunders, T.L.; Samuelson, L.C. Pancreatic function in CCK-deficient mice: Adaptation to dietary protein does not require CCK. Am. J. Physiol. 1999, 276, G1302–G1309. [Google Scholar] [CrossRef]
- Swanson, K.C.; Matthews, J.C.; Matthews, A.D.; Howell, J.A.; Richards, C.J.; Harmon, D.L. Dietary Carbohydrate Source and Energy Intake Influence the Expression of Pancreatic α-Amylase in Lambs. J. Nutr. 2000, 130, 2157–2165. [Google Scholar] [CrossRef]
- Swanson, K.C.; Matthews, J.C.; Woods, C.A.; Harmon, D.L. Influence of substrate and/or neurohormonal mimic on in vitro pancreatic enzyme release from calves postruminally infused with partially hydrolyzed starch and/or casein. J. Anim. Sci. 2003, 81, 1323–1331. [Google Scholar] [CrossRef]
- Cao, Y.; Yang, X.; Guo, L.; Zheng, C.; Wang, D.; Cai, C.; Yao, J. Regulation of pancreas development and enzymatic gene expression by duodenal infusion of leucine and phenylalanine in dairy goats. Livest. Sci. 2018, 216, 9–15. [Google Scholar] [CrossRef]
- Harmon, D.L.; Swanson, K.C. Review: Nutritional regulation of intestinal starch and protein assimilation in ruminants. Animal 2020, 14, s17–s28. [Google Scholar] [CrossRef] [Green Version]
- Kim, J.; Song, G.; Wu, G.; Gao, H.; Johnson, G.A.; Bazer, F.W. Arginine, Leucine, and Glutamine Stimulate Proliferation of Porcine Trophectoderm Cells Through the MTOR-RPS6K-RPS6-EIF4EBP1 Signal Transduction Pathway1. Biol. Reprod. 2013, 88, 113. [Google Scholar] [CrossRef] [Green Version]
Figure 1.
Pancreas and small intestine α-amylase, lipase, trypsin and chymotrypsin activities in goats fed a low-protein diet. The results are presented as the mean ± SE; * = p < 0.05. NP = a control protein diet; LP = a low-protein diet.
Figure 1.
Pancreas and small intestine α-amylase, lipase, trypsin and chymotrypsin activities in goats fed a low-protein diet. The results are presented as the mean ± SE; * = p < 0.05. NP = a control protein diet; LP = a low-protein diet.
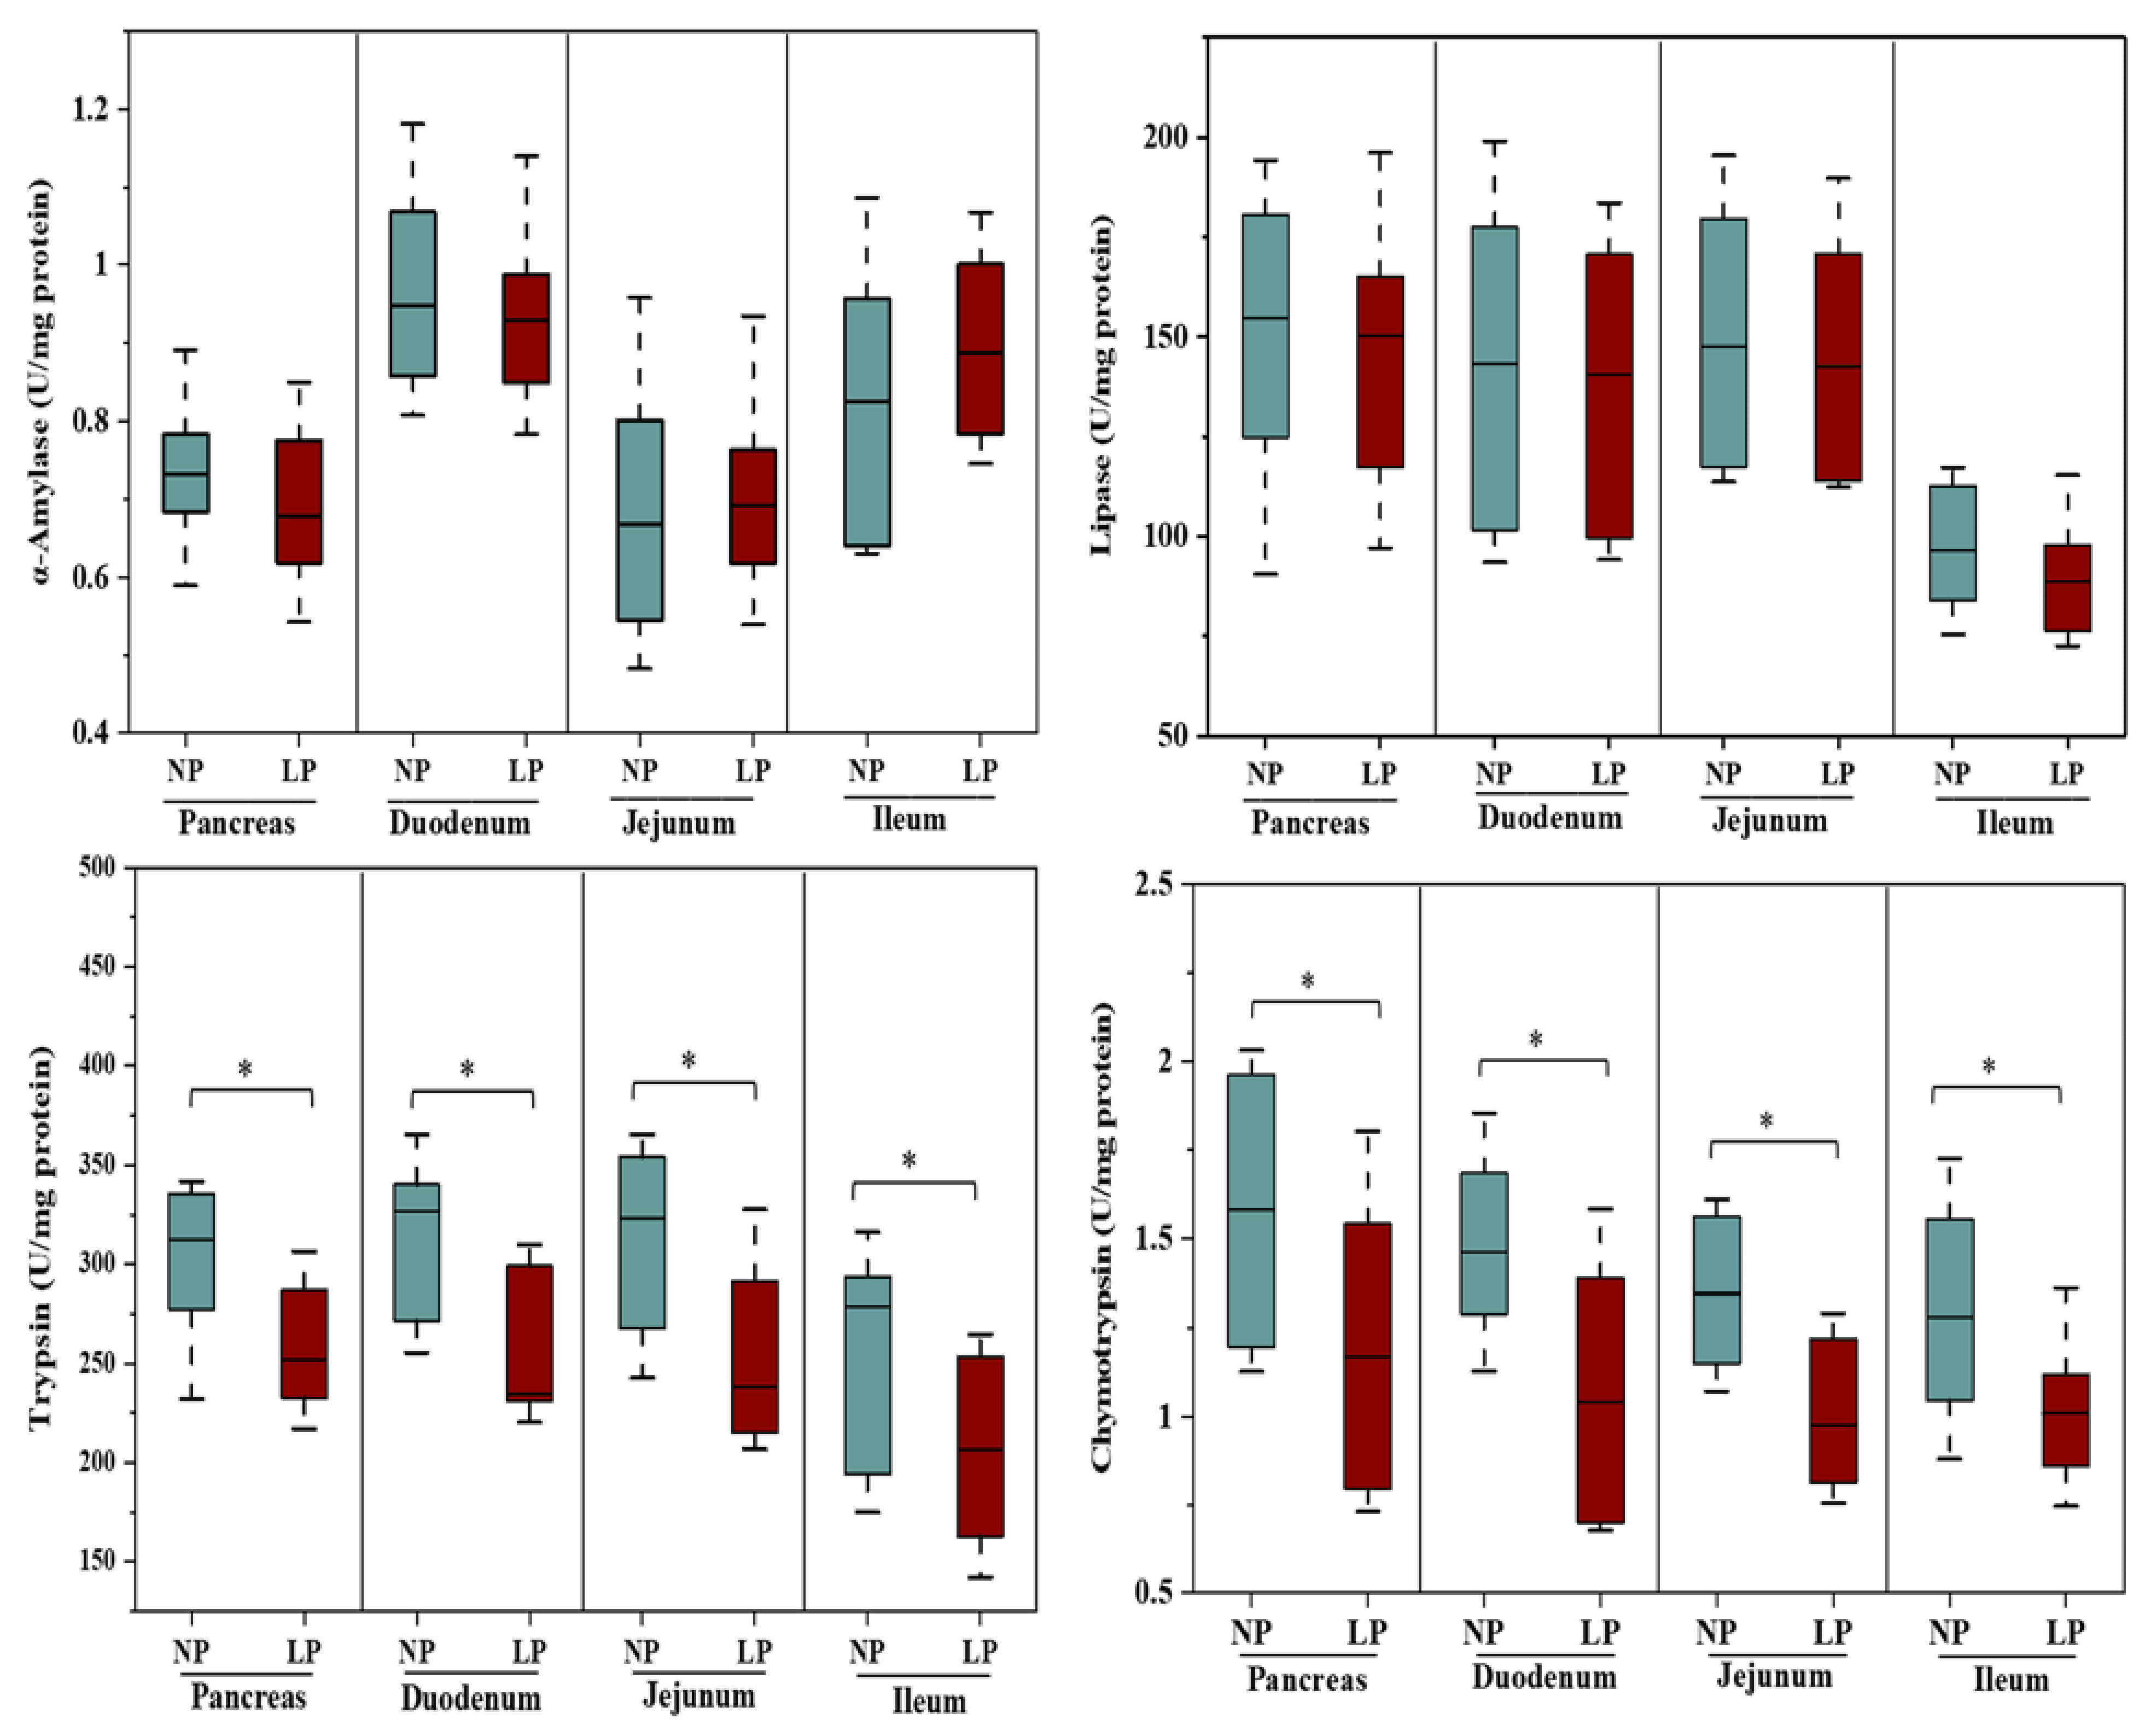
Figure 2.
The relative mRNA expressions of α-amylase, lipase, trypsin and chymotrypsin in duodenum, jejunum and ileum in goats fed a low-protein diet. The results are presented as the mean ± SE; * = p < 0.05.
Figure 2.
The relative mRNA expressions of α-amylase, lipase, trypsin and chymotrypsin in duodenum, jejunum and ileum in goats fed a low-protein diet. The results are presented as the mean ± SE; * = p < 0.05.

Figure 3.
Plasma CCK and Insulin concentrations in goats fed a low-protein diet. On each side of the gray line is a kernel density estimation to illustrate the distribution of shape of the data in a group. Wider and skinnier sections of the violin plot represent a higher and lower probability. The white dot represents the median and the thick gray bar in the center represents the interquartile range. * = significantly different means (p < 0.05).
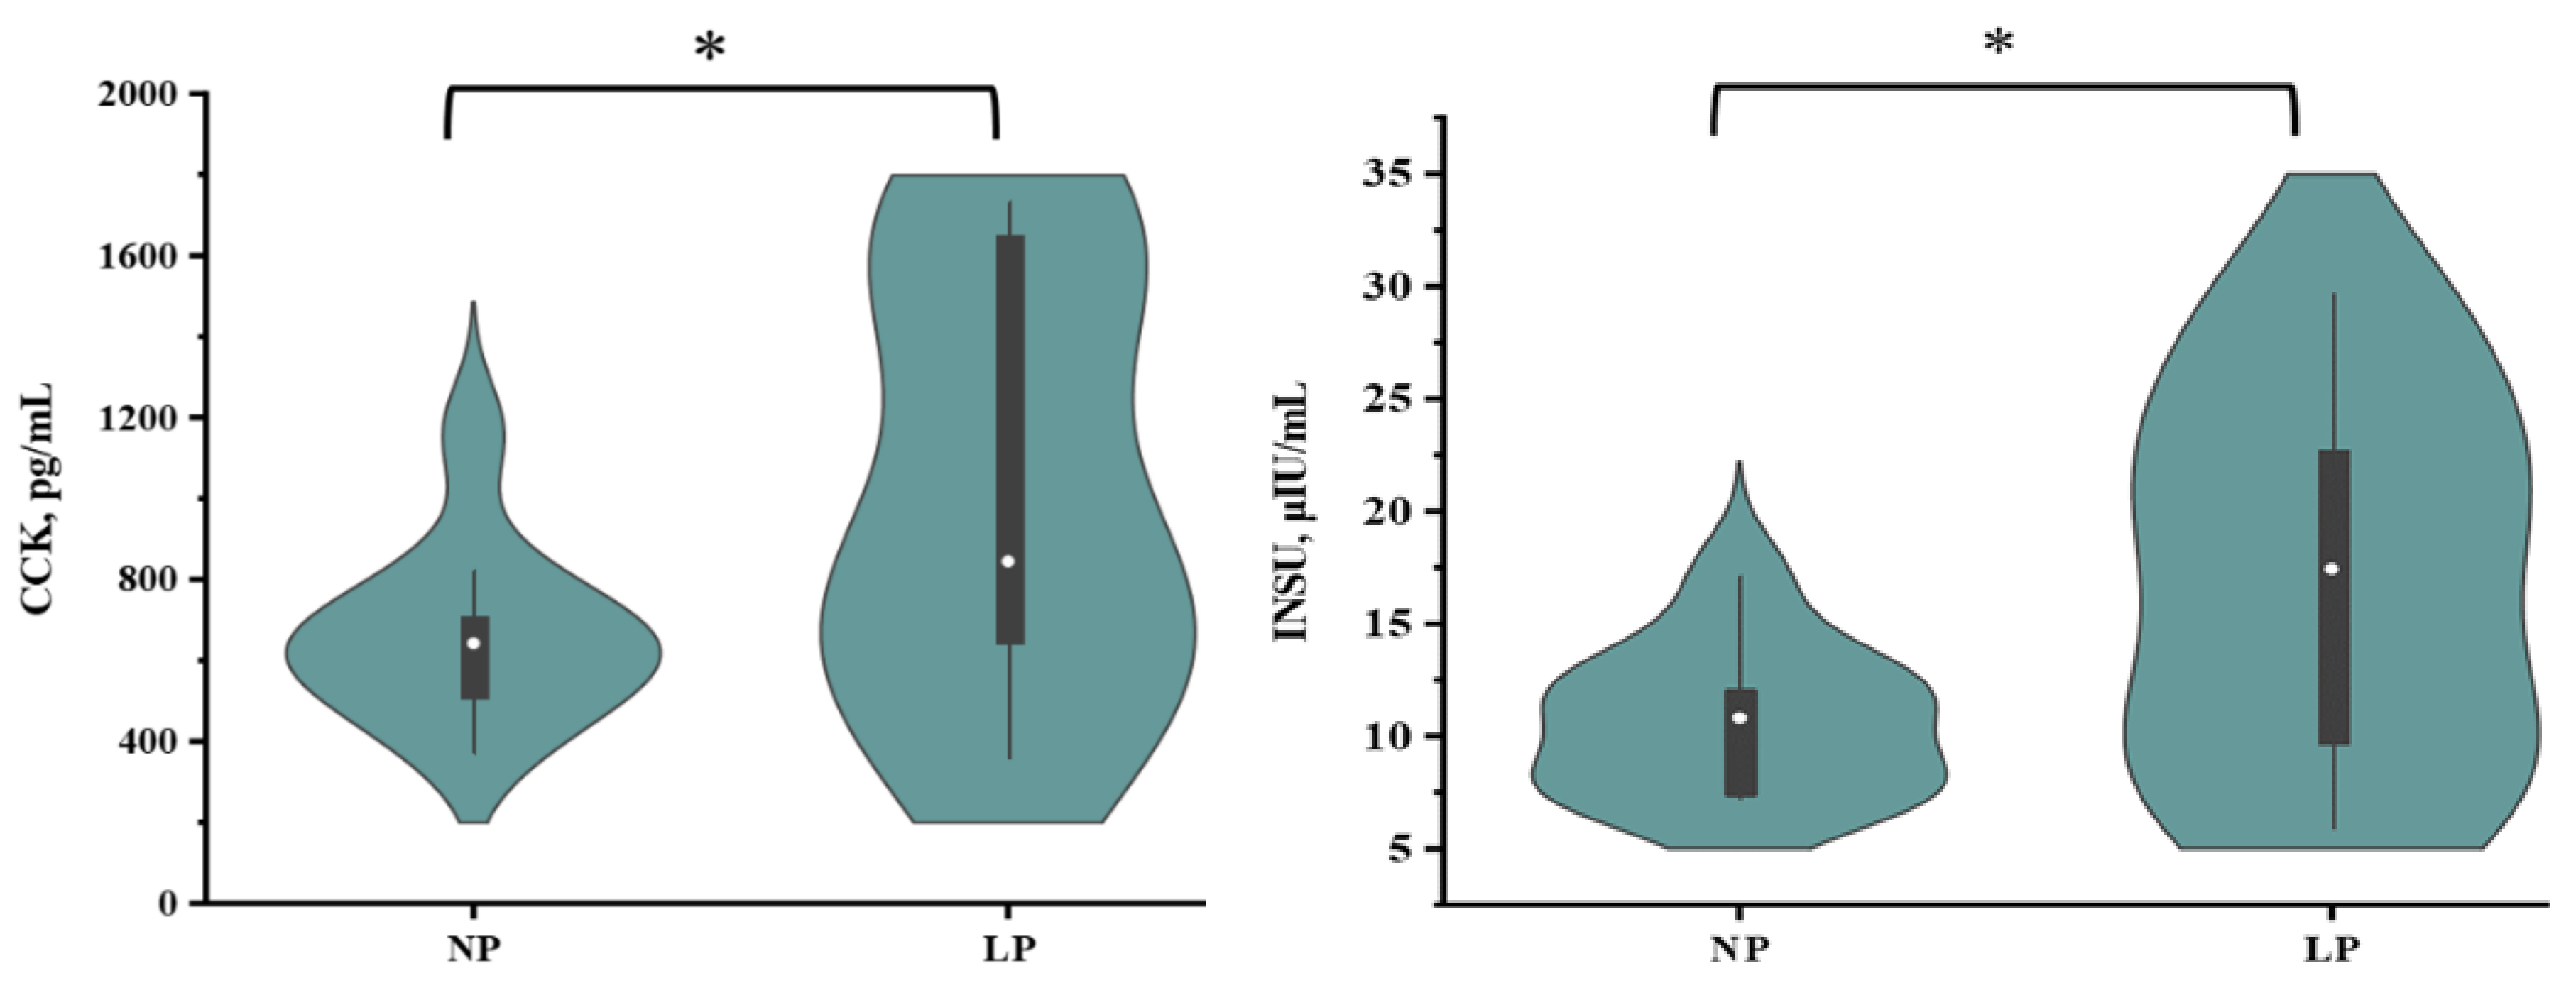
Figure 4.
Plasma free amino acid concentrations in goats fed a low-protein diet. The results are presented as the mean ± SE; * = p < 0.05. NP = a control protein diet; LP = a low-protein diet.
Figure 4.
Plasma free amino acid concentrations in goats fed a low-protein diet. The results are presented as the mean ± SE; * = p < 0.05. NP = a control protein diet; LP = a low-protein diet.

Table 1.
Ingredients and chemical composition (g/kg of DM) of experimental diets.
| Item | Treatments 1 | |
|---|---|---|
| NP | LP | |
| Ingredients, g/kg DM | ||
| Rice straw | 700 | 700 |
| Soybean | 150 | 0 |
| Corn | 82 | 230 |
| Wheat bran | 29 | 29 |
| CaCO3 | 1.0 | 1.0 |
| CaH2PO4 | 3.0 | 5.0 |
| Fat | 10 | 10 |
| NaCl | 5.0 | 5.0 |
| 2 Premix | 20 | 20 |
| Chemical composition, g/kg DM | ||
| DM | 962 | 959 |
| OM | 873 | 877 |
| CP | 108 | 55.2 |
| NDF | 498 | 509 |
| ADF | 284 | 289 |
| GE (MJ/kg) | 16.8 | 16.9 |
1 NP: a control-protein diet; LP: a low-protein diet. DM: dry matter, OM: organic matter, CP: crude protein, NDF:neutral deteregen fiber, ADF: acid deteregent fiber, GE: gross energy. 2 Premix was formulated to provide (per kg of dietary DM): 6.9 g of Fe, 4.4 g of Cu, 1.1 g of Co, 11.2 g of I, 11 g of Mn, 4.6 g of Zn, 0.3 g of Se, 15.4 g of vitamins.
Table 2.
The PCR primers used to amplify genes encoding α-amylase, lipase, trypsin, and chymotrypsin.
Table 2.
The PCR primers used to amplify genes encoding α-amylase, lipase, trypsin, and chymotrypsin.
| Item | Primer Sequence (5′-3′) | Product Size (bp) | Accession # |
|---|---|---|---|
| α-Amylase | F: GAAATGGCCGTGTGACAGAATTTA | 142 | NM_001035016 |
| R: ACAAAGACAAGTGCCCTGTCAGAA | |||
| Lipase | F: GTGGAAGCAAATGATGGACAAG | 81 | NM_001205820 |
| R: TGGGTTGAGGGTGAGCAGA | |||
| Trypsin | F: TGCCTGCGGCTCACTGCTAC | 119 | NM_001113727 |
| R: GCTGGGATGGACGATACTCTTG | |||
| Chymotrypsin | F: ATGTTGGGCATCACGGTCTT | 172 | NM 001098965.1 |
| R: TGTGCCTCCACGTGTTATCC | |||
| Β-actin 1 | F: ACCACTGGCATTGTCATGGACTCT | 152 | AF481159 |
| R: TCCTTGATGTCACGGACGATTTCC |
1 Housekeeping gene.
Table 3.
Pancreas weight, DNA and protein contents in goats fed a low-protein diet 1.
| Treatment | ||||
|---|---|---|---|---|
| Item | NP | LP | SEM | p-Value |
| BW, kg | 20.23 | 19.97 | 0.732 | 0.806 |
| Pancreatic weight | ||||
| g | 35.27 | 32.59 | 3.330 | 0.160 |
| g/kg of BW | 1.74 | 1.63 | 0.130 | 0.120 |
| Pancreatic DNA | ||||
| mg/g of pancreas | 0.82 | 0.71 | 0.084 | 0.356 |
| mg/kg of BW | 1.46 | 1.13 | 0.161 | 0.072 |
| Pancreatic protein | ||||
| mg/g of pancreas | 9.12 | 9.06 | 0.730 | 0.204 |
| mg/kg of BW | 15.60 | 14.59 | 1.070 | 0.175 |
| Protein: DNA | 22.47 | 23.29 | 2.720 | 0.444 |
1 Values are expressed as means and pooled standard error of the mean (SEM); NP = a control protein diet; LP = a low-protein diet.
Publisher’s Note: MDPI stays neutral with regard to jurisdictional claims in published maps and institutional affiliations. |
© 2021 by the authors. Licensee MDPI, Basel, Switzerland. This article is an open access article distributed under the terms and conditions of the Creative Commons Attribution (CC BY) license (https://creativecommons.org/licenses/by/4.0/).
Share and Cite
MDPI and ACS Style
Gebeyew, K.; Chen, W.; Yan, Q.; He, Z.; Tan, Z. Growth of Pancreas and Intestinal Enzyme Activities in Growing Goats: Influence of a Low-Protein Diet. Agriculture 2021, 11, 1155. https://doi.org/10.3390/agriculture11111155
AMA Style
Gebeyew K, Chen W, Yan Q, He Z, Tan Z. Growth of Pancreas and Intestinal Enzyme Activities in Growing Goats: Influence of a Low-Protein Diet. Agriculture. 2021; 11(11):1155. https://doi.org/10.3390/agriculture11111155
Chicago/Turabian StyleGebeyew, Kefyalew, Wenxun Chen, Qiongxian Yan, Zhixiong He, and Zhiliang Tan. 2021. "Growth of Pancreas and Intestinal Enzyme Activities in Growing Goats: Influence of a Low-Protein Diet" Agriculture 11, no. 11: 1155. https://doi.org/10.3390/agriculture11111155
Note that from the first issue of 2016, this journal uses article numbers instead of page numbers. See further details here.