
Elimination of Clogging of a Biogas Slurry Drip Irrigation System Using the Optimal Acid and Chlorine Addition Mode

Abstract
:1. Introduction
2. Materials and Methods
2.1. Test Material
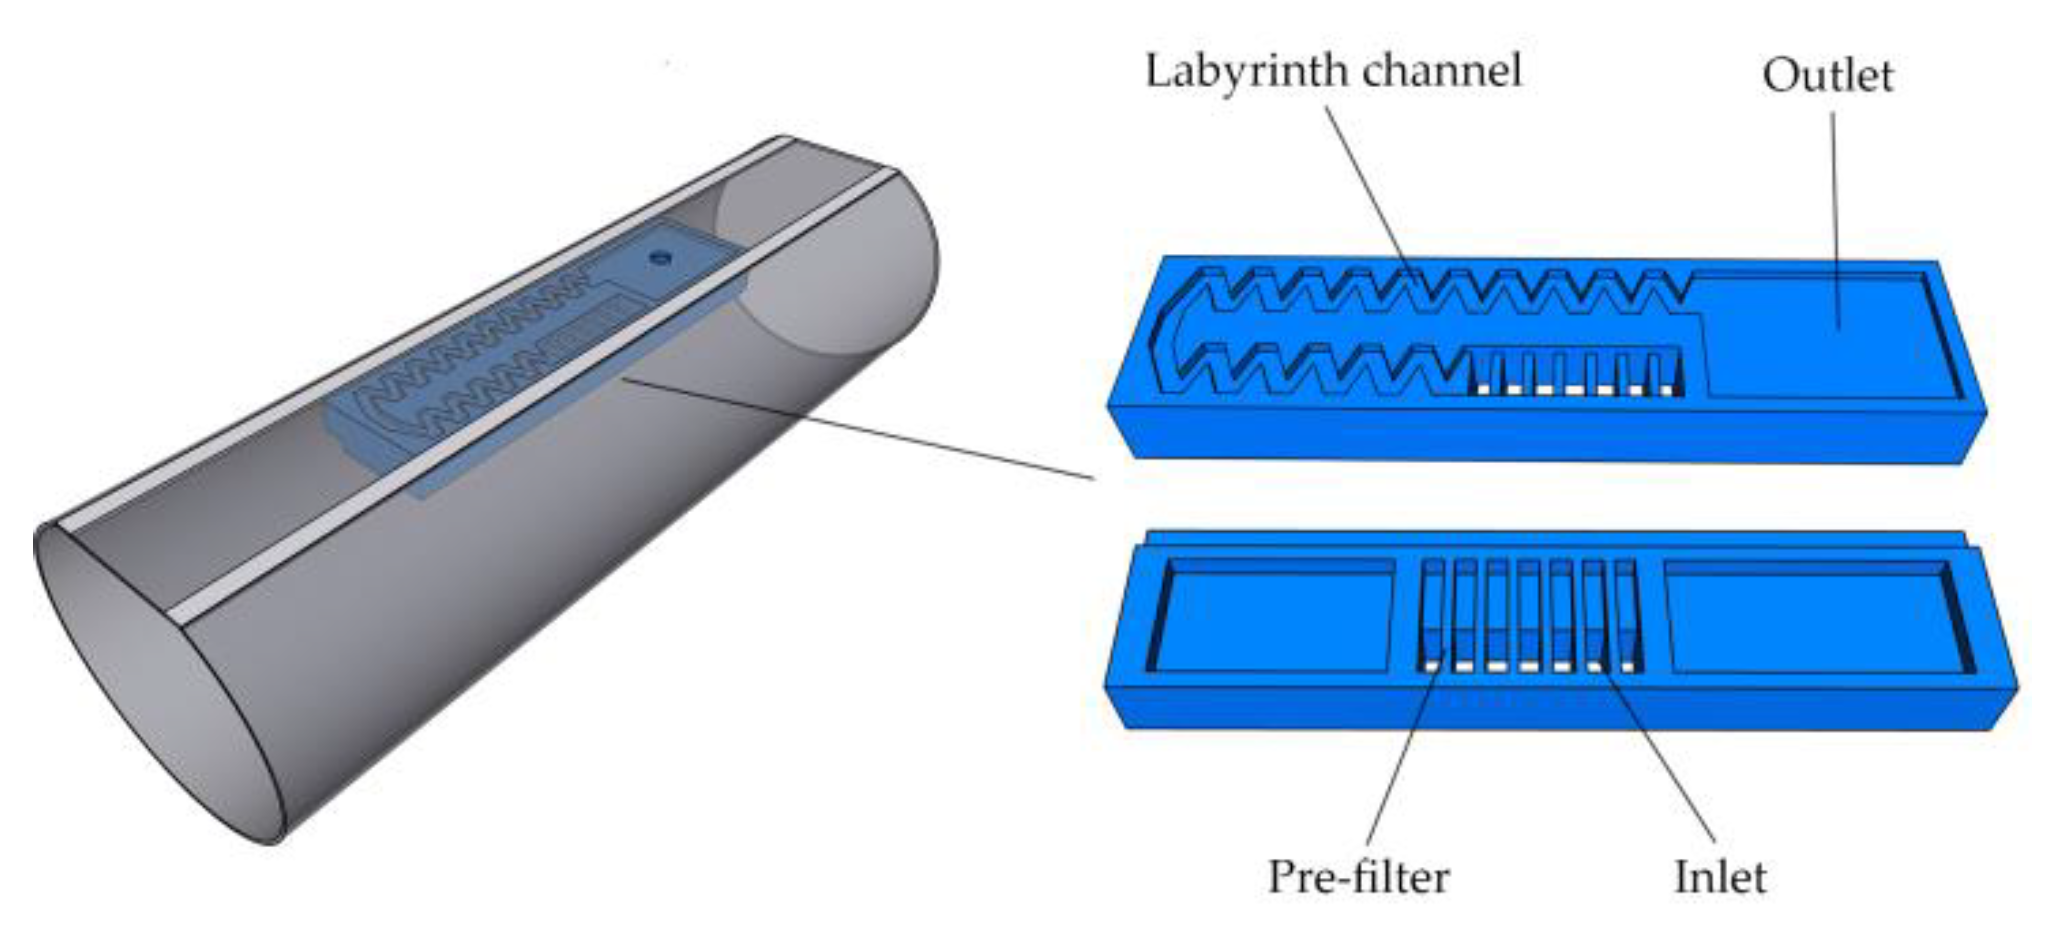
2.2. Test Device
2.3. Acid and Chlorine Treatment Design
2.4. Emitter Performance Index
2.4.1. Emitter Flow and Relative Average Discharge (Dra)
2.4.2. Clogging Rate of Emitters
2.5. Dry Weight of Clogging Substances
2.6. EPS in the Emitter
3. Results
3.1. Variation Law of Emitter Dra
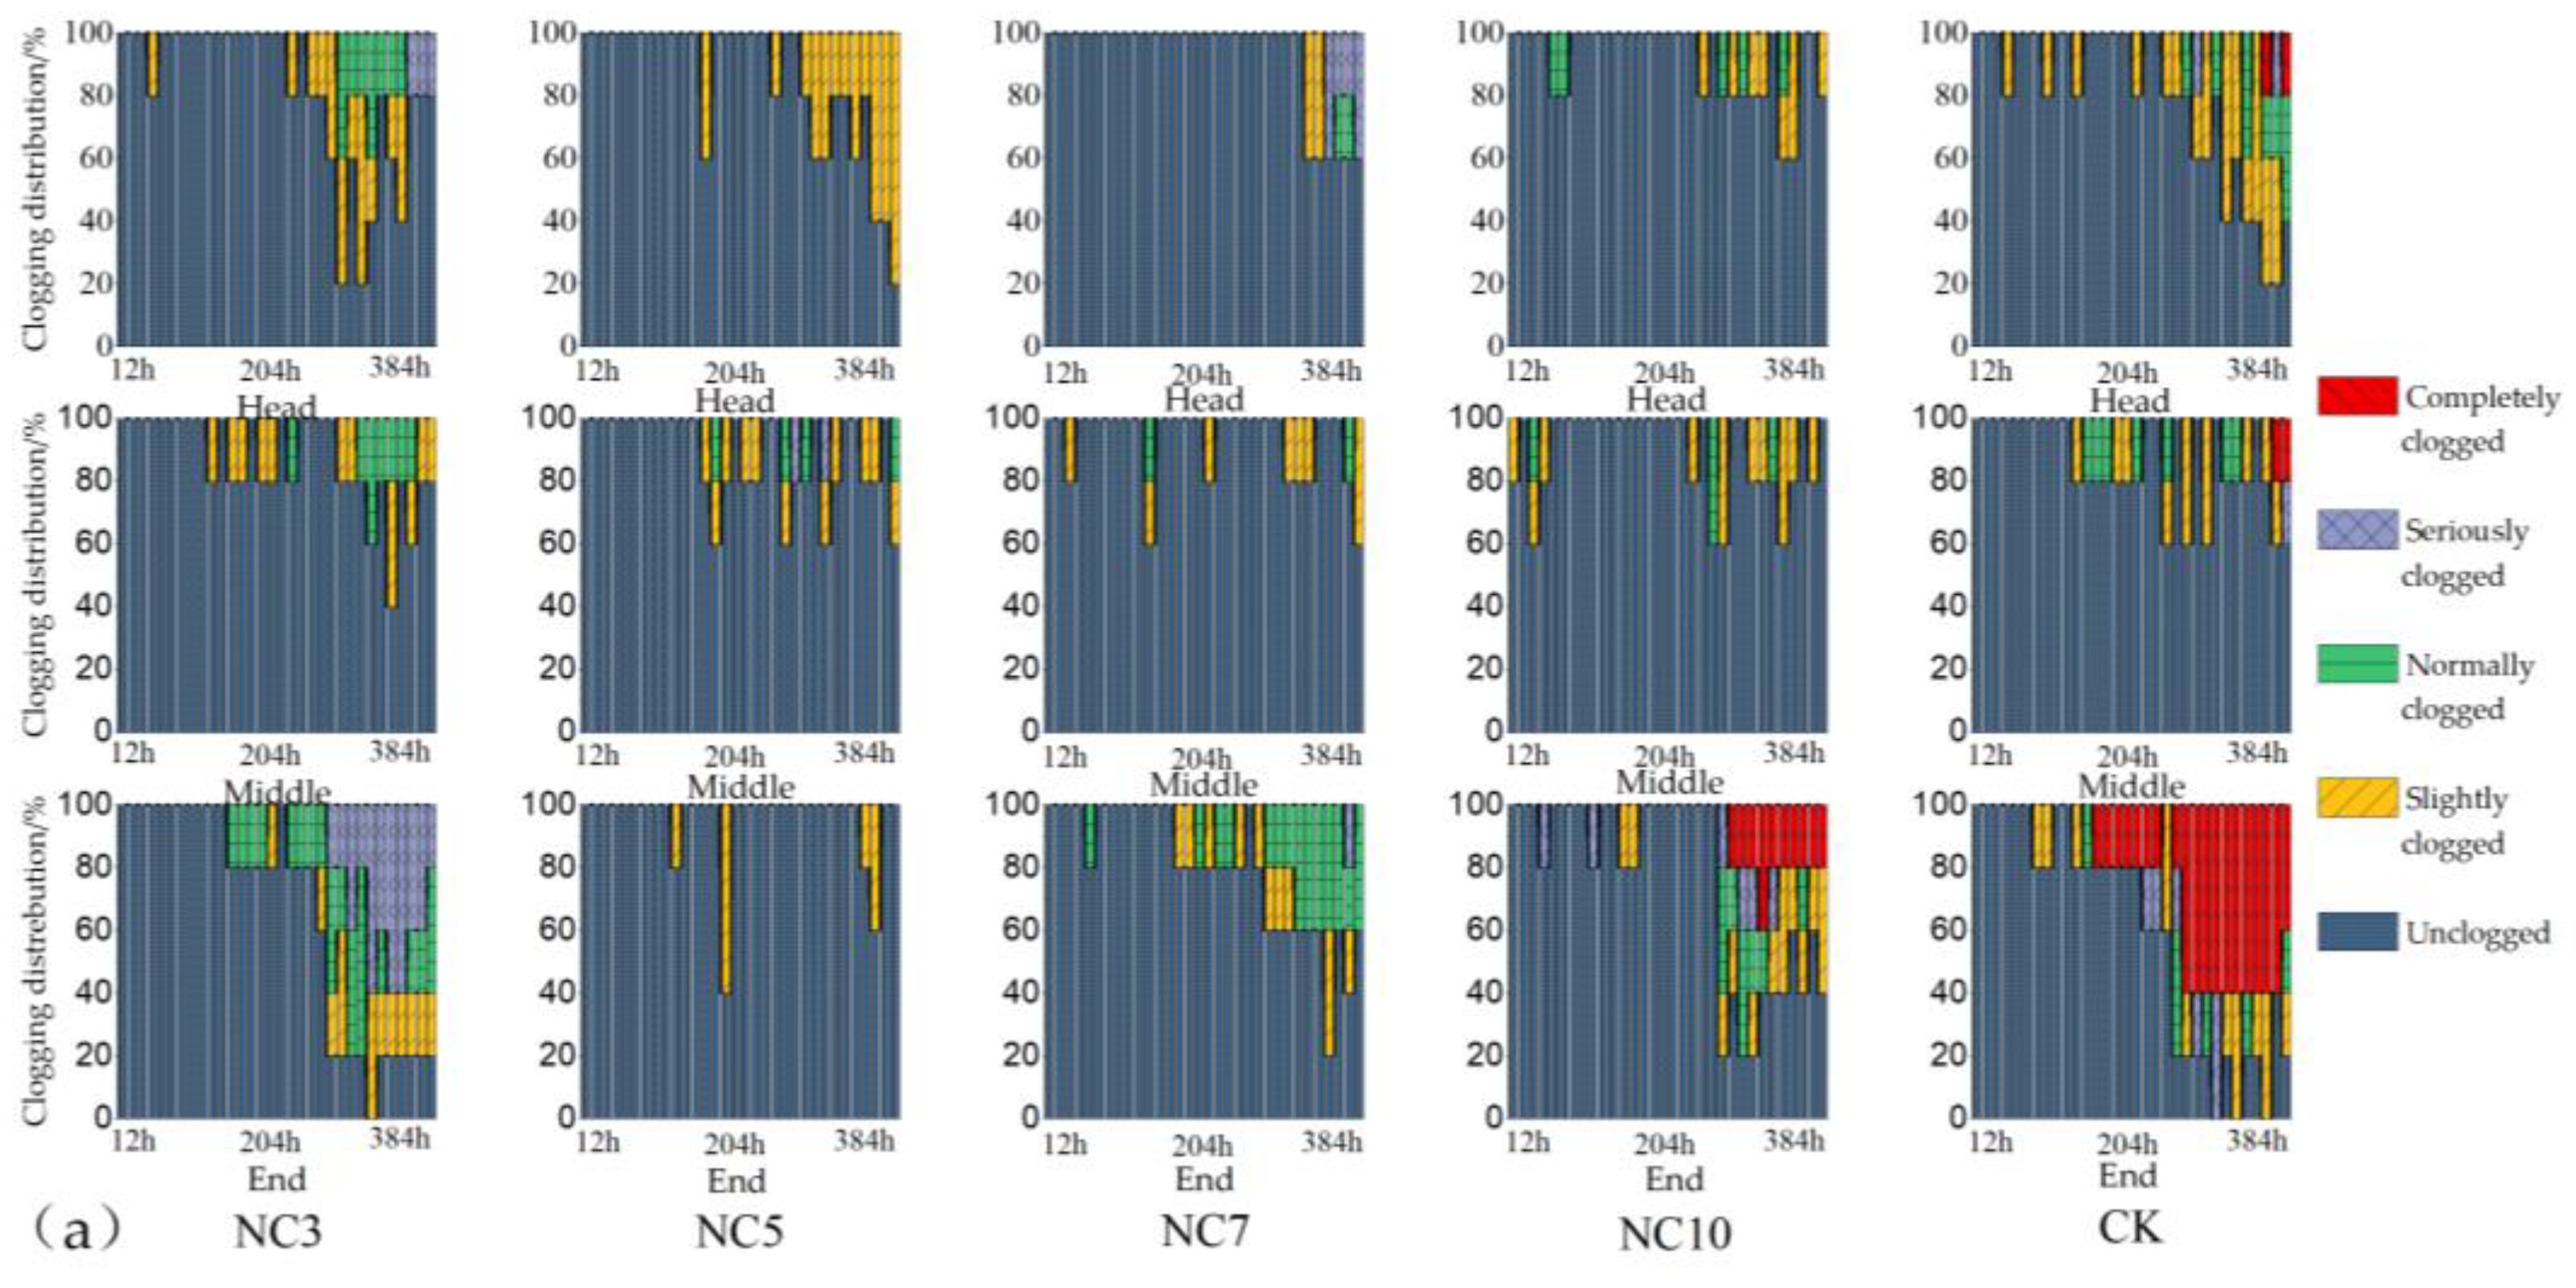
3.2. Distribution Characteristics of Emitter Clogging along Drip Irrigation Belt Direction
3.3. Dry Weight Distribution Characteristics of Clogging in Drip Irrigation Belt
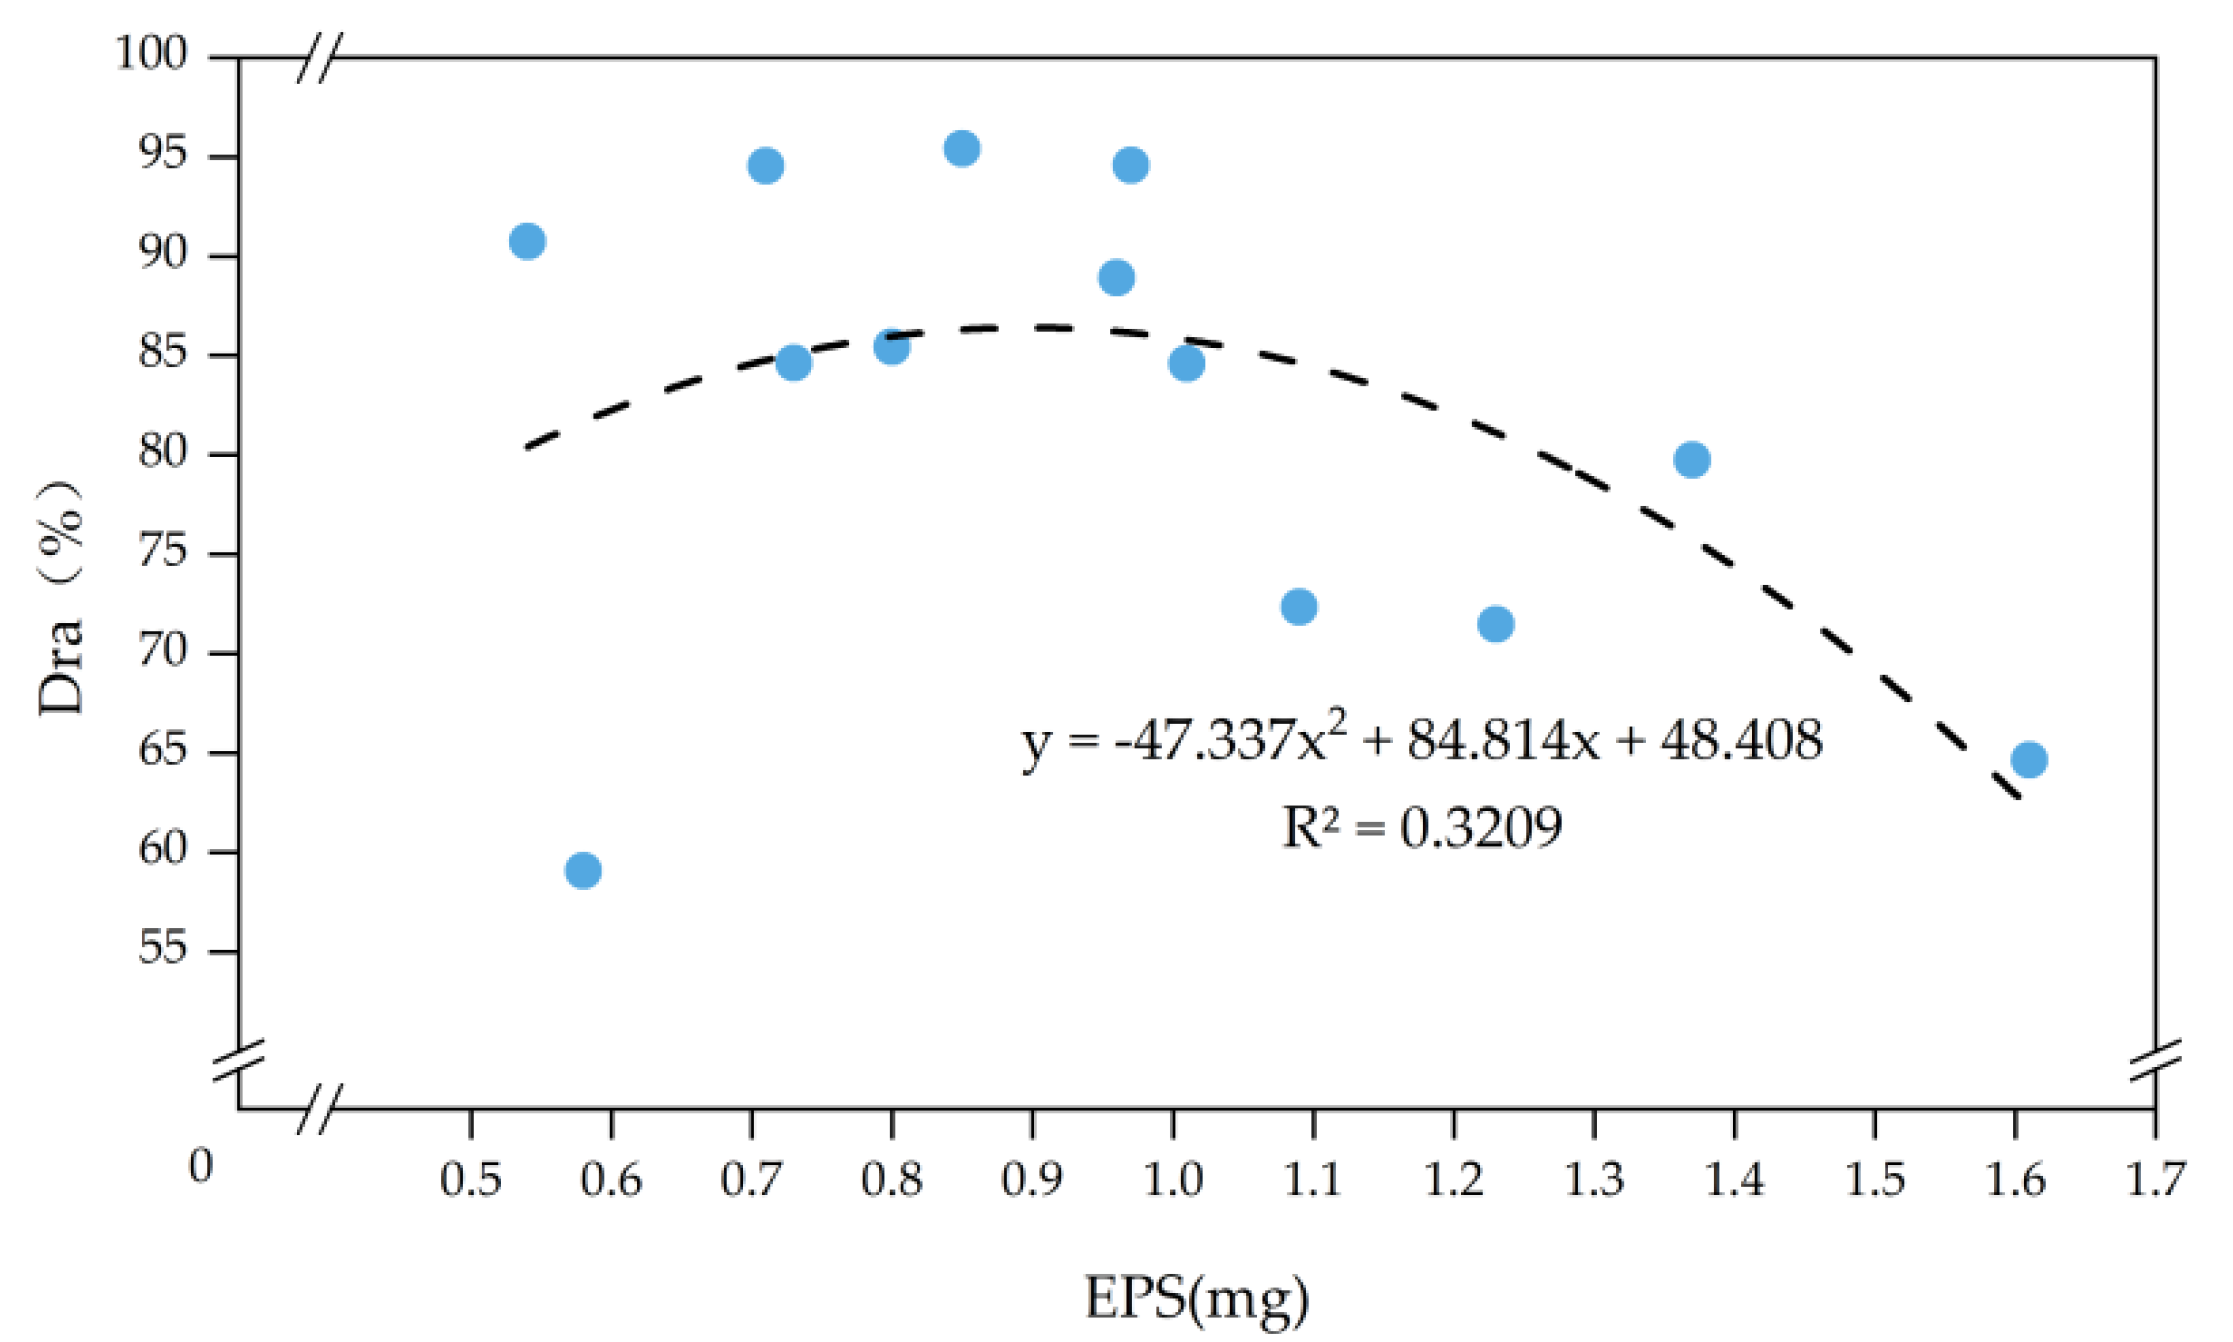
3.4. Effect of Acid and Chlorine Addition on EPS Content in Emitters
4. Discussion
4.1. Effect of Acid and Chlorine Addition on Anti-Clogging Performance of Emitters
4.2. Effect of Acid and Chlorine Addition on EPS Content in Emitters
5. Conclusions
- (1)
- Compared with CK, acid addition alone and a reasonable combination of acid and chlorine can significantly reduce the probability of serious or complete clogging of BS drip irrigation emitters. A reasonable combination of the acid and chlorine dosing cycle and chlorine dosing concentration can effectively improve the anti-clogging performance of the BS drip irrigation system, compared with acid dosing alone.
- (2)
- Acid and chlorination measures promote the migration of clogging substances to the rear of the drip irrigation belt, resulting in increased clogging of the emitters at the rear of the drip irrigation belt. Compared with low-concentration chlorination under the same acid and chlorination rate cycle, high-concentration chlorination measures further increase the concentration of clogging substances at the back of the drip irrigation belt.
- (3)
- Acid-only treatment and sequential acid and chlorine addition significantly inhibit the growth of EPS in the emitter. Compared with the measures of acid addition alone, the sequential addition of acid and chlorine can more effectively prevent the accumulation of EPS in the emitter at the back of the drip irrigation belt.
- (4)
- To ensure excellent anti-clogging performance of the BS drip irrigation system, when acid-only treatment measures are adopted, the acid dosing cycle is recommended to be 10 days. When acid and chlorination measures are adopted sequentially, the acid chlorination cycle is recommended to be 14 and 10 days when the chlorine concentration is 1–3 and 4–9 mg/L, respectively.
Author Contributions
Funding
Institutional Review Board Statement
Informed Consent Statement
Data Availability Statement
Conflicts of Interest
References
- Gong, H.; Yan, Z.; Liang, K.Q.; Jin, Z.Y.; Wang, K.J. Concentrating process of liquid digestate by disk tube-reverse osmosis system. Desalination 2013, 326, 30–36. [Google Scholar] [CrossRef]
- Augustyn, G.; Mikulik, J.; Rumin, R.; Szyba, M. Energy Self-Sufficient Livestock Farm as the Example of Agricultural Hybrid Off-Grid System. Energies 2021, 14, 7041. [Google Scholar] [CrossRef]
- Xu, M.; Xian, Y.; Wu, J.; Gu, Y.; Yang, G.; Zhang, X.; Peng, H.; Yu, X.; Xiao, Y.; Li, L. Effect of biogas slurry addition on soil properties, yields, and bacterial composition in the rice-rape rotation ecosystem over 3 years. J. Soils Sediments 2019, 19, 2534–2542. [Google Scholar] [CrossRef]
- Du, H.; Gao, W.; Li, J.; Shen, S.; Wang, F.; Fu, L.; Zhang, K. Effects of digested biogas slurry applicationmixed with irrigation water on nitrate leaching during wheat-maize rotation in the North China Plain. Agric. Water Manag. 2019, 213, 882–893. [Google Scholar] [CrossRef]
- Ai, P.; Jin, K.; Alengebawy, A.; Elsayed, M.; Meng, L.; Chen, M.; Ran, Y. Effect of application of different biogas fertilizer on eggplant production: Analysis of fertilizer value and risk assessment. Environ. Technol. Innov. 2020, 19, 101019. [Google Scholar] [CrossRef]
- Zhang, P.; Zhang, Q.; Liu, F.; Li, J.; Cao, N.; Song, C. The construction of the integration of water and fertilizer smart water saving irrigation system based on big data. In Proceedings of the 2017 IEEE International Conference on Computational Science and Engineering (CSE) and IEEE/Ifip International Conference on Embedded and Ubiquitous Computing (EUC), Guangzhou, China, 21–24 July 2017; Volume 2, pp. 392–397. [Google Scholar] [CrossRef]
- Xiao, Y.; Jiang, S.C.; Wang, X.; Muhammad, T.; Song, P.; Zhou, B.; Zhou, Y.; Li, Y. Mitigation of biofouling in agricultural water distribution systems with nanobubbles. Environ. Int. 2020, 141, 105787. [Google Scholar] [CrossRef]
- Yu, L.; Li, N.; Liu, X.; Yang, Q.; Long, J. Influence of flushing pressure, flushing frequency and flushing time on the service life of a labyrinth-channel emitter. Biosyst. Eng. 2018, 172, 154–164. [Google Scholar] [CrossRef]
- Ma, C.; Xiao, Y.; Puig-Bargués, J.; Shukla, M.K.; Tang, X.; Hou, P.; Li, Y. Using phosphate fertilizer to reduce emitter clogging of drip fertigation systems with high salinity water. J. Environ. Manag. 2020, 263, 110366. [Google Scholar] [CrossRef]
- Niu, W.; Liu, L.; Chen, X. Influence of fine particle size and concentration on the clogging of labyrinth emitters. Irrig. Sci. 2013, 31, 545–555. [Google Scholar] [CrossRef]
- Xiao, Y.; Liu, Y.; Ma, C.; Muhammad, T.; Zhou, B.; Zhou, Y.; Song, P.; Li, Y. Using electromagnetic fields to inhibit biofouling and scaling in biogas slurry drip irrigation emitters. J. Hazard. Mater. 2021, 401, 123265. [Google Scholar] [CrossRef]
- Wang, H.T.; Wang, J.; Wang, C.; Wang, S.; Qiu, X.; Sun, Y.; Li, G. Characterization of labyrinth emitter-clogging substances in biogas slurry drip irrigation systems. Sci. Total Environ. 2022, 820, 153315. [Google Scholar] [CrossRef] [PubMed]
- Song, P.; Xiao, Y.; Ren, Z.J.; Brooks, J.P.; Lu, L.; Zhou, B.; Zhou, Y.; Freguia, S.; Liu, Z.; Zhang, N.; et al. Electrochemical biofilm control by reconstructing microbial community in agricultural water distribution systems. J. Hazard. Mater. 2021, 403, 123616. [Google Scholar] [CrossRef] [PubMed]
- Li, J.-s.; Li, Y.-f.; Zhang, H. Tomato Yield and Quality and Emitter Clogging as Affected by Chlorination Schemes of Drip Irrigation Systems Applying Sewage Effluent. J. Integr. Agric. 2012, 11, 1744–1754. [Google Scholar] [CrossRef]
- Li, J.; Chen, L.; Li, Y.; Yin, J.; Zhang, H. Effects of Chlorination Schemes on Clogging in Drip Emitters during Application of Sewage Effluent. Appl. Eng. Agric. 2010, 26, 565–578. [Google Scholar] [CrossRef]
- ISO 9261:2004; Agricultural Irrigation Equipment—Emitters and Emitting Pipe—Specification and Test Methods. International Organization for Standardization: Geneva, Switzerland, 2004.
- EP405.1 FEB03; ASAE Engineering Practice EP405.1, February 03. Design and Installation of Microirrigation Systems. ASAE: St. Joseph, MI, USA, 2003; pp. 901–905.
- Capra, A.; Scicolone, B. Water quality and distribution uniformity in drip/trickle irrigation systems. J. Agric. Eng. Res. 1998, 70, 355–365. [Google Scholar] [CrossRef]
- Pei, Y.; Li, Y.; Liu, Y.; Zhou, B.; Shi, Z.; Jiang, Y. Eight emitters clogging characteristics and its suitability under on-site reclaimed water drip irrigation. Irrig. Sci. 2014, 32, 141–157. [Google Scholar] [CrossRef]
- Dubois, M.; Gilles, K.A.; Hamilton, J.K.; Rebers, P.A.; Smith, F. Colorimetric method for determination of sugars and related substances. Anal. Chem. 1956, 28, 350–356. [Google Scholar] [CrossRef]
- Lowry, O.H.; Rosebrough, N.J.; Farr, A.L.; Randall, R.J. Protein measurement with the Folin phenol reagent. J. Biol. Chem. 1951, 193, 265–275. [Google Scholar] [CrossRef]
- Hao, F.; Li, J.; Wang, Z.; Li, Y. Effect of Chlorination and Acidification on Clogging and Biofilm Formation in Drip Emitters Applying Secondary Sewage Effluent. Trans. ASABE 2018, 61, 1351–1363. [Google Scholar] [CrossRef]
- Zhou, B.; Li, Y.; Liu, Y.; Xu, F.; Pei, Y.; Wang, Z. Effect of drip irrigation frequency on emitter clogging using reclaimed water. Irrig. Sci. 2015, 33, 221–234. [Google Scholar] [CrossRef]
- Zhangzhong, L.; Yang, P.; Zheng, W.; Liu, Y.; Guo, M.; Yang, F. Effects of Drip Irrigation Frequency on Emitter Clogging using Saline Water for Processing Tomato Production. Irrig. Drain. 2019, 68, 464–475. [Google Scholar] [CrossRef]
- Yan, D.; Yang, P.; Rowan, M.; Ren, S.; Pitts, D. Biofilm accumulation and structure in the flow path of drip emitters using reclaimed wastewater. Trans. ASABE 2010, 53, 751–758. [Google Scholar] [CrossRef] [Green Version]
- Zhou, B.; Wang, T.; Li, Y.; Bralts, V. Effects of microbial community variation on bio-clogging in drip irrigation emitters using reclaimed water. Agric. Water Manag. 2017, 194, 139–149. [Google Scholar] [CrossRef]
- Abuarab, M.; Mostafa, E.; Ibrahim, M. Effect of air injection under subsurface drip irrigation on yield and water use efficiency of corn in a sandy clay loam soil. J. Adv. Res. 2013, 4, 493–499. [Google Scholar] [CrossRef] [PubMed] [Green Version]
- Li, Y.K.; Liu, Y.Z.; Li, G.B.; Xu, T.W.; Liu, H.S.; Ren, S.M.; Yan, D.Z.; Yang, P.L. Surface topographic characteristics of suspended particulates in reclaimed wastewater and effects on clogging in labyrinth drip irrigation emitters. Irrig. Sci. 2012, 30, 43–56. [Google Scholar] [CrossRef]
- Wu, X.; Li, X.; Yang, Q.; Xu, Q.; Tao, Z.; Huang, X.; Wu, Y.; Tao, L.; Pi, Z.; Chen, Z.; et al. Effect of citric acid on extracellular polymeric substances disruption and cell lysis in the waste activated sludge by pH regulation. Bioresour. Technol. 2020, 302, 122859. [Google Scholar] [CrossRef]
- Zhou, B.; Li, Y.; Pei, Y.; Liu, Y.; Zhang, Z.; Jiang, Y. Quantitative relationship between biofilms components and emitter clogging under reclaimed water drip irrigation. Irrig. Sci. 2013, 31, 1251–1263. [Google Scholar] [CrossRef]
- Song, P.; Zhou, B.; Feng, G.; Brooks, J.P.; Zhou, H.; Zhao, Z.; Liu, Y.; Li, Y. The influence of chlorination timing and concentration on microbial communities in labyrinth channels: Implications for biofilm removal. Biofouling 2019, 35, 401–415. [Google Scholar] [CrossRef]


| Original BS | Test BS | |||||||||
|---|---|---|---|---|---|---|---|---|---|---|
| EC (ms/cm) | pH | T/°C | SS (mg/L) | N (mg/L) | P (mg/L) | K (mg/L) | EC (ms/cm) | pH | T/°C | SS (mg/L) |
| 11.87 ± 0.43 | 9. 15 ± 0.74 | 22 ± 1.2 | 1984 ± 87 | 2068 ± 216 | 337 ± 35 | 513 ± 32 | 2.20 ± 0.26 | 8.71 ± 0.69 | 21 ± 2.3 | 170 ± 36 |
| Treatment | Acid | Chlorine | Cycle | ||
|---|---|---|---|---|---|
| pH | Duration (min) | Concentration (mg/L) | Duration (min) | ||
| NC3 | 5.5–6.0 | 60 | - | - | 3 |
| NC5 | 5.5–6.0 | 60 | - | - | 5 |
| NC7 | 5.5–6.0 | 60 | - | - | 7 |
| NC10 | 5.5–6.0 | 60 | - | - | 10 |
| LC3 | 5.5–6.0 | 60 | 1–3 | 30 | 3 |
| LC5 | 5.5–6.0 | 60 | 1–3 | 30 | 5 |
| LC7 | 5.5–6.0 | 60 | 1–3 | 30 | 7 |
| LC10 | 5.5–6.0 | 60 | 1–3 | 30 | 10 |
| HC3 | 5.5–6.0 | 60 | 4–9 | 30 | 3 |
| HC5 | 5.5–6.0 | 60 | 4–9 | 30 | 5 |
| HC7 | 5.5–6.0 | 60 | 4–9 | 30 | 7 |
| HC10 | 5.5–6.0 | 60 | 4–9 | 30 | 10 |
| CK | - | - | - | - | - |
| Treatment | Dra = 95% | Dra = 65% | ||||||
|---|---|---|---|---|---|---|---|---|
| Head | Middle | End | Mean Value | Head | Middle | End | Mean Value | |
| NC3 | 15.5 e | 9.4 g | 38.7 ef | 21.2 f | 10.8 g | 42.1 b | 48.4 b | 33.8 d |
| NC5 | 13.8 f | 24 de | 37.1 f | 25 e | 37.1 d | 32.7 cd | 47.5 b | 39.1 c |
| NC7 | 26.6 a | 28.1 c | 42 e | 32.2 cd | 10.3 g | 30.6 d | 40.6 c | 27.2 fg |
| NC10 | 20.2 c | 22.4 ef | 24.6 h | 22.4 ef | 18.5 f | 25.7 e | 31.8 fgh | 25.3 gh |
| LC3 | 17.6 d | 20.6 f | 60 c | 32.7 cd | 46.8 b | 50.2 a | 29.5 h | 42.2 b |
| LC5 | 12.8 f | 23.1 def | 34.8 fg | 23.6 ef | 12 g | 6.7 g | 32.9 efgh | 17.2 j |
| LC7 | 10.1 g | 30 bc | 32.1 g | 24.1 ef | 25.1 e | 9.6 f | 37 cd | 23.9 hi |
| LC10 | 19.9 c | 20.9 f | 60.4 c | 33.7 bc | 81.7 a | 34.2 c | 36.4 de | 50.8 a |
| HC3 | 20.1 c | 54.6 a | 103.1 a | 59.3 a | 24.9 e | 27.4 e | 35.4 def | 29.2 ef |
| HC5 | 21.3 c | 30.9 b | 51.8 d | 34.7 bc | 25.2 e | 4 h | 34.3 defg | 21.2 i |
| HC7 | 13.7 f | 29.8 bc | 48.6 d | 30.7 d | 18.5 f | 34.2 c | 37.9 cd | 30.2 e |
| HC10 | 14.2 ef | 21.3 f | 74.1 b | 36.5 b | 12.6 g | 44.6 b | 75.6 a | 44.3 b |
| CK | 24.9 b | 25 d | 25.2 h | 25 e | 42.2 c | 30.5 d | 30.6 gh | 34.4 d |
| Treatment | EPS (mg) | |||
|---|---|---|---|---|
| Head | Middle | End | Mean Value | |
| NC3 | 1.02 d | 0.59 d | 1.41 c | 1.01 de |
| NC5 | 0.37 f | 0.14 e | 1.64 b | 0.71 h |
| NC7 | 0.77 e | 0.62 d | 1 def | 0.8 fg |
| NC10 | 1 d | 0.88 c | 1.03 de | 0.97 e |
| LC3 | 1.17 c | 1.16 b | 0.95 ef | 1.09 d |
| LC5 | 0.71 e | 0.81 c | 0.67 h | 0.73 gh |
| LC7 | 0.41 f | 0.8 c | 0.4 i | 0.54 i |
| LC10 | 1.01 d | 1.82 a | 0.85 g | 1.23 c |
| HC3 | 0.71 e | 0.64 d | 0.4 i | 0.58 i |
| HC5 | 0.78 e | 1.13 b | 0.64 h | 0.85 f |
| HC7 | 1.27 b | 0.67 d | 0.93 fg | 0.96 e |
| HC10 | 1.28 b | 0.81 c | 2.03 a | 1.37 b |
| CK | 1.99 a | 1.79 a | 1.05 d | 1.61 a |
Publisher’s Note: MDPI stays neutral with regard to jurisdictional claims in published maps and institutional affiliations. |
© 2022 by the authors. Licensee MDPI, Basel, Switzerland. This article is an open access article distributed under the terms and conditions of the Creative Commons Attribution (CC BY) license (https://creativecommons.org/licenses/by/4.0/).
Share and Cite
Qiu, X.; Wang, J.; Wang, H.; Wang, C.; Sun, Y.; Li, G. Elimination of Clogging of a Biogas Slurry Drip Irrigation System Using the Optimal Acid and Chlorine Addition Mode. Agriculture 2022, 12, 777. https://doi.org/10.3390/agriculture12060777
Qiu X, Wang J, Wang H, Wang C, Sun Y, Li G. Elimination of Clogging of a Biogas Slurry Drip Irrigation System Using the Optimal Acid and Chlorine Addition Mode. Agriculture. 2022; 12(6):777. https://doi.org/10.3390/agriculture12060777
Chicago/Turabian StyleQiu, Xuefeng, Jiandong Wang, Haitao Wang, Chuanjuan Wang, Yuechao Sun, and Guangyong Li. 2022. "Elimination of Clogging of a Biogas Slurry Drip Irrigation System Using the Optimal Acid and Chlorine Addition Mode" Agriculture 12, no. 6: 777. https://doi.org/10.3390/agriculture12060777