
Early Plant Development in Intermediate Wheatgrass


1
Department of Plant Science, University of Manitoba, 66 Dafoe Road, Winnipeg, MB R3T 2N2, Canada
2
Swift Current Research and Development Centre, Agriculture and Agri-Food Canada, P.O. Box 1030, Swift Current, SK S9H 3X2, Canada
*
Author to whom correspondence should be addressed.
Agriculture 2022, 12(7), 915; https://doi.org/10.3390/agriculture12070915
Submission received: 4 May 2022
/
Revised: 14 June 2022
/
Accepted: 21 June 2022
/
Published: 23 June 2022
(This article belongs to the Special Issue Perennial Grains and Oilseeds: Current Status and Future Prospects)
Abstract
:Early seedling developmental morphology influences plant growth and development and ultimately crop biomass and grain yields. We used six half-sibling plants of intermediate wheatgrass (IWG) (Thinopyrum intermedium, (Host), Barkworth and Dewey) to develop an obligate outcrossing species, to develop six maternal lines. Thousand seed weights (TSW) were consistently different amongst plants, averaging from 6.28 to 9.62 g over the three harvest years. Seedlings from the largest seed of each line were studied for early plant development under controlled conditions (22 °C/18 °C, 16/8 h day/night) with destructive harvests at 21, 28, 35 and 42 days after imbibition (DAI) through six grow-outs. Haun stage, and tiller umber and origin, were noted daily, and dry weight plant−1 (DWP) measured at the dates noted above. Leaf-blade length and width were measured in four grow-outs and leaf area estimated. Seedling development data showed some differences between lines and was similar in all lines studied. Data was combined to garner an understanding of early IWG development. Tillering began as the third leaf completed emergence. Coleoptile tillers and rhizomes were infrequent. DWP was best estimated using the main stem leaf area. A large-, a medium- and a small-seeded line were statistically identical for many characteristics including DWP indicating that TSW did not influence seedling vigor. The main stem leaf area may be used non-destructively to improve plant populations for early DWP selection.
1. Introduction
Perennial grains and oilseeds are being considered for potential crop use as evidenced by breeding work taking place on numerous species [1]. While many species are in the preliminary or exploratory stage, intermediate wheatgrass (Thinopyrum intermedium, (Host), Barkworth and Dewey) (IWG), an obligate outcrossing species, is one of the few that is nearing fruition [2,3], with perennial rice being another [4]. Current development of IWG for grain production and human use was initiated approximately 35 years ago [5], with intensive efforts being employed for just over the past two decades [2]. The University of Minnesota released a cultivar of intermediate wheatgrass for grain production in 2020 [3].
Expansion of cultivated land over the past two decades has been reported to have influenced both climate change and the potential for loss of biodiversity [6]. Perennial crops have been hypothesized to provide greater ecosystem services than their annual counterparts, including reduced cultivation, increased carbon sequestration over time and maintenance of biodiversity [1]. Recent work is beginning to demonstrate that these perceived benefits are factual. For example, perennial cereal rye (Secale cereale × S. montanum) is a greater carbon sink while leaving the water balance unchanged when compared to annual rye, however, crop grain yields were significantly higher for the annual crop [7]. Reliance on dual use [8,9] and ecological goods and services will likely be drivers of producer uptake in the short-term due to the limited yields. It is hoped that intensive breeding strategies will aid in decreasing the yield gap between annual and perennial grains [10,11] with selection for and within the region of production critical to the realization of the potential of perennial grains [11,12].
Plant development is key to understanding crop development. Individual plant development can be critical to overall crop establishment and performance in perennials [13,14,15]. Competition between forage species has been noted to impact the establishment of the species seeded [16,17,18]. The ability of forage crops to establish from different seeding timings is species dependent [19]. In IWG, May and June were demonstrated to result in a greater degree of acceptable establishment (>50% visual establishment) in western Canada [19]. Examples of late fall dormant seedings (up to November 1) have demonstrated acceptable establishments in this environment [19]. Effective seedling emergence was found from depths of 5 cm or less and while line differences were significant at greater seeding depths, seed size was not found to be a factor influencing emergence [20]. In a controlled environment study, increasing soil temperature and N and P additions enhanced plant dry weights [12]. In addition, the lowest soil temperature (10 °C) had the highest overall emergence, although at a slower emergence rate [21].
Understanding the developmental aspects of plants allows for the use of phenological observations on the crop stage for the implementation and understanding of the impacts of cultural practices [22,23,24,25]. Many cultural practices such as herbicide use and their efficiency is dependent upon the timing of treatment for plant development (growth stage) [26] for both the crop and pest species e.g., [27]. However, factors impacting establishment may not necessarily be consistent amongst populations of the same species [28].
The main stem is the seminal vegetative axis, or the vegetative axis arising from the seed and can also be referred to as the main tiller [29] or main stem. Tiller growth arises from the axillary buds in the axils of the leaves [30,31] beginning with the main stem. For simplicity, the term main stem will be used hereafter to refer to the vegetative axis that emerged from the seed. The main stem is the first vegetative stem to undergo elongation in creeping bentgrass (Agrostis stolonifera L.) [32] and annual bluegrass (Poa annua L.) [33].
Leaf appearance rates appear to be related to tillering and dry matter accumulation. An exponential phase, a linear phase and a static or decreasing phase of tiller appearance is generally observed in grasses when grown from seed [34]. The attainment of the latter stages are indicators of competition (e.g., space, nutrients). Tiller proliferation in young creeping bentgrass plants, under non-competitive conditions, was found to be in the exponential growth phase up to 35 days after a germinated seed was transplanted [32]. Tiller birth and death in a naturally occurring stand of creeping bentgrass was found to be, over time, offsetting, i.e., an equilibrium was reached [35]. Tillering dynamics within perennial stands are therefore fluid, governed by processes such as source/sink dynamics (reproductive tillers versus vegetative tillers [36], or end-use management practices [37]. Influence of environmental stimuli is also involved and exerts control of reproductive effort [38,39] once the juvenile stage has passed. Finally, genetics appears to govern developmental rates, with plants or cultivars with divergent tillering rates showing similar tillering patterns [32,33]. In A. stolonifera, differential seedling tillering rates were evident in mature turf stands three years after establishment [14,37]).
The utilization of individually potted plants under controlled environments favors the expression of traits that may be masked under more competitive growth environments. For example, seeding rate is generally formulated to provide adequate plant densities of the desired specie(s) and also factors in row spacings and its impacts on productivity [40,41,42,43]. End use and fertility levels will also impact the long-term performance of the resultant stands [40,41,42,43].
To determine the competitive aspects of a crop, including perennial crop species, the developmental processes and morphological expression need to be understood. Whether these traits are of utility in crop development and production may be unknown. Each plant species generally has a relatively definable developmental pattern when an individual plant is grown under good nutrition (mineral, water, light) and without competition, although within species differences may be identifiable [33,44]. Growth and development can be quantified using different developmental scales including Haun stage [45] (leaf appearance on the main stem), (BBCH scales Biologische Bundesanstalt, Bundessortenamt, CHemische Industrie) [46], Zadoks [47] or West’s [48], to name a few, and all assign a value to the growth stage achieved. Choice and employment of developmental scale or scales are dependent upon the species and preference of the researcher e.g., [33].
Seed size is thought to be important and sometimes noted to be related to seedling vigor. Crop progenitors were taller and had “… crop progenitors have larger seed mass than wild species, germinate faster and have greater seedling size.” [49], p. 1. Larger seed mass was weakly correlated to higher growth rate and was thought to make them better competitors than smaller seeded wild species. However, a study modelling relative growth rate of reported literature indicated that smaller seed mass was associated with a higher relative growth rate [50]. Smaller seed mass tends to provide a higher relative growth rate [50]. Specific leaf area was found to be associated with faster seedling growth rates in tree species [51]. Seed mass has been shown to be associated with relative growth rate [52]. In Lolium perenne L., shoot height was used to distinguish vigor differences between seed lots within a cultivar [53]. Large differences between C4 versus C3 plant species, due in part to a higher specific leaf area (surface area/dry weight) has been demonstrated in C4′s, indicating less investment per unit area of leaf [54].
Selection for seed size can be effective for seed weight. One report found 23 QTLs for seed weight and seed size in IWG and indicated that selection can be successful for these traits [55]. A previous report indicated that seed size was not related to emergence in IWG [20], although the seed weights were well below what have been achieved through recent breeding efforts [55].
Competition during emergence and early growth will be important for success of a crop species [56]. In Pseudoroegneria spicata, increased leaf number achieved in the juvenile stage (25 days after emergence) indicated greater competitiveness with Centaurea stoebe [57]. Early appearance in stands enhances an individual’s ability to grow [58]. Perennial crop species that can achieve more rapid development could potentially be more competitive and thus may be more productive. At a meeting of perennial grain scientists at Kellogg Biological Station, Hickory Corners, MI, USA in 2011, agronomists stated the lack of perennial crop seedling competitiveness with weeds as a major detriment to agronomic success and thus to producer uptake (D. Cattani, personal communication). An understanding of the environmental parameters associated with early plant development will aid in understanding crop/weed competition.
Leaf area calculations have been modeled using leaf length and leaf width [59], and this is advantageous when non-destructive measurements are desired. In general, an increase in leaf area leads to greater photosynthesis [60]. Increased leaf area should then lead to greater growth (dry matter accumulation). Leaf area on a tiller can be increased via larger leaves or by increasing leaf appearance rate, i.e., more leaves, but the latter mechanism will likely lead to smaller individual leaves [33]. Successful selection for increased seedling weight and tiller number led to increased seedling vigor in some C4 perennial grasses [61]. It has been shown however, that both earlier germination and greater root development may benefit Bromus tectorum, a weedy species, in its early growth stages (15 to 23 days after initial watering), although its relative growth rate was lower [62].
Early plant development in intermediate wheatgrass is critical to understanding its potential to compete and may potentially be used to determine the timing of seeding. Therefore, as a perennial grain candidate, developmental patterns in IWG may be critical to understanding grain yield potential. We studied the early plant development of six open-pollinated half-sibling lines of intermediate wheatgrass, (lines developed from six plants from a single open-pollinated mother), harvested over three years, under controlled environmental conditions to ascertain plant development and associated characteristics.
2. Materials and Methods
Six half-sibling plants of IWG were initially evaluated in an open-pollinated nursery at Carman MB (49°29′46.70 N, 98°2′43.64 W) with the experimental protocols and climatic conditions previously reported [12,63]. Briefly, seed from each maternal plant was collected at seed maturity in August 2012, 2013, and 2014. Date of initiation of anthesis and harvest were noted, heads plant−1 were counted after anthesis was completed, and crown size measured post harvest to estimate plant area in each year of production. Years were used as pseudo-replicates to compare plant (genotype) performance. Seed was processed and cleaned using small scale machinery for individual plants, including a Westrup seed cleaner. Once seed cleaning had occurred, a sample (approximately 20 g) was randomly taken and dehulled to determine thousand seed weights of the individual families. This sample was then separated using sieves and a Hoffman seed blower (Hoffman Manufacturing, Albany, OR, USA) into three size/density seed fractions, i.e., large, medium and small and TSW was determined for each fraction. To remove the potential for immature seed or undersized seed, only the large fraction was used for the seedling development experiment. After processing, the seed for the seedling development experiment was stored in the long-term seed storage room (3–5 °C) in the Department of Plant Science at the University of Manitoba for at least seven months prior to use, to reduce potential dormancy/physiological or maturity issues with the seed.
2.1. Seedling Development
Average seed size plant−1 has previously been used to classify individuals for seed size in IWG [64], and was used in this study. Seed was imbibed for a single day to ensure imbibition and the identification of damaged seed prior to transplanting individual seeds into 15 cm diameter pots filled with Sunshine Mix #4 Aggregate Plus (60–70% sphagnum peat moss, perlite, dolomite) at a depth of 1 cm. Pots were watered daily or as required to ensure adequate moisture levels. Pots were immediately placed into a growth room (Conviron) with a 16 h daylength and 22 °C/18 °C day/night temperatures, simulating the daylengths in Manitoba for a mid- to late-May seeding. Light levels were measured at the beginning of each experimental run and fell within a 320–350 μmol m−2 s−1 (photosynthetic photon flux density) across the growth room benches in all runs. Light source was from fluorescent 54W T5HO. For each of the six lines, referred to hereafter as Lines A through F, there were four destructive harvest dates, 21, 28, 35 and 42 days after imbibition (DAI), with four replications. Seeding was initiated approximately seven months after harvest for each year to retain seed age similarities between harvest years and reduce potential dormancy issues. Each seeding was repeated for each harvest year, for a total of two runs for each harvest year. Beginning at 21 DAI, and then every seven days until 35 DAI, depending upon harvest treatment, plants were fertilized with 20-20-20 fertilizer solution (Plant-Prod 20-20-20 Classic) of 2 g L−1 with each pot receiving 20 mL of solution.
Seedlings were assigned to the harvest date treatments once emergence had occurred to allow for similar emergence timings to be placed into each replicate. Emergence was across a two- to three-day period for the individual experimental runs. Haun leaf stage [45] was noted daily, once emergence of the second leaf tip was observed, and tiller emergence began to be noted and individual tillers were marked with colored-coded wire hoops to denote site of origin. Plant harvests were made at 21, 28, 35 and 42 DAI. Plants were dug up and all root material removed. Plant material was dried at 60 °C for 72 h, then weighed to the nearest 0.1 mg. Prior to harvest, all fully emerged leaves (collar showing) up to the sixth leaf on the main stem were measured for total leaf blade length and leaf blade width at the mid-length point to the nearest 0.5 mm with a steel ruler. Leaf area was then calculated by multiplying length by width. A separate calibration was made utilizing other plant materials, and it was determined that a conversion multiplier of 0.91 (r2 = 0.955) accurately predicted leaf area.
Growing degree days (gdd) were calculated with a base temperature of 0 °C and a mean daily temperature [39]. As temperatures in the growth rooms were set to be consistent with a mean daily temperature of 20 °C, cumulative gdd was calculated by multiplying the DAI by 20 to provide a thermal estimate of leaf (Haun stage) and tiller appearance.
2.2. Statistical Analysis
Statistical analysis was conducted using PROC MIXED in SAS 9.4, with line and harvest date as fixed variables and replicate and run as random variables. Outliers, if present, were identified using studentized residuals in PROC UNIVARIATE. Appropriate models were determined based upon the lowest AIC values for each trait analyzed. In order to develop a general development model for the lines tested, all data was compiled to provide a composite description of early plant development. Regression analysis (PROC REG) was then run to investigate leaf area, Haun stage and tiller number impact on plant growth on both a line and an overall basis. Harvest dry weight plant−1 was square root transformed for all analysis.
3. Results
3.1. Half-Sibling Performance
Thousand seed weight (TSW) was found to be different for the individual lines, with Lines D and E having higher seed weight (Table 1). When TSW for the large portion of the seed was considered, TSW separated into three distinct groupings, Lines D and E, Lines C and F and Lines A and B. Line E produced the greatest seed yield, approximately 70% more than the nearest line and three times Line B, the lowest yielding plant. Plant area and seed yield plant−1 somewhat mirrored one another with mean values being correlated (r = 0.81, p = 0.0001). Line F showed a high standard deviation for seed yield, indicating a fluctuating yield across the years.
Reproductive tillering and biomass productivity did not appear to be linked to seed productivity. Biomass plant−1 and heads plant−1 were greatest for Lines D and E, while HI was highest for Line E while Line D was relatively low (Table 2). Heads plant−1 and heads cm−2 do not appear to be related, with Line D being in the highest grouping for both heads plant−1 and heads cm−2 (Table 2). Additionally, Line D had a high TSW and biomass plant−1 and a moderate seed yield. The small sample of this family investigated were divergent across the years tested at Carman for most traits measured.
3.2. Seedling Development Study
Plant developmental parameters were generally non-significant and or variable across individual harvest dates for the individual lines (Table 3 and Table 4). Harvest dry weight showed Lines E, F and A in the highest grouping on all dates. Haun stage of the main stem indicated Lines B, C and D in the lowest grouping at 21 and 28 DAI (Table 3) with lines A, E and F in the highest grouping for all harvest dates. Tillers at harvest reflect all remaining plants on that harvest date, i.e., plants to be harvested at a future date as well. At 21 DAI, Line E was significantly highest, followed by Lines F, A and D. Lines A and E were in the same grouping for the three following harvest timings. By 28 DAI, only Line B was lower for tillers plant−1 than the other lines.
Leaf lengths showed Lines B and C in the highest grouping with other lines showing more variable placement in the hierarchy of leaf blade lengths for the first six leaves on the main stem (Table 4). Leaf-blade width at the midpoint was much more uniform (Table 4). Overall, leaf length and widths were relatively consistent, while there were some significant differences (Table 4), for all leaf lengths. Lines B and C were in the longest grouping for leaves one, two and three, while Lines D and F were in the shortest grouping for these leaves.
3.3. Plant Development
The primary tiller (P) arising from the axillary bud in the axil of the first leaf (P1) occurred most often, generally before or coinciding with the full extension of the third leaf (Haun stage 3.0) (Figure 1). P1 appeared most frequently, with the second primary tiller (P2) arising the next most frequently. A total of 574 plants were used in these calculations as two plants died or were damaged prior to the 21-day harvest. While most plants had reached the full expansion of the third leaf by day 21, some did not, leading to some plants not producing a primary tiller prior to harvest (Table 3). Additionally, a number of plants produced P2 first. In some cases where this occurred, a P1 tiller was later produced. In rare cases, tillers arose from the coleoptile node (RP), however, these were generally after other primary tillers had appeared.
Secondary (S), tertiary and one quaternary tillers also appeared and in the order they were generally expected (Figure 1). All plants that produced RP tillers produced an RS tiller from the axil of the first leaf of the RP1 tiller.
Regression analysis indicated a significant difference for leaf blade area on the main stem and plant dry weight. Lines E (large seed), F (medium seed) and A (small seed) were found to have near identical linear regression equations for leaf area on plant dry weight (Table 5). The other three lines were also similar with respect to their slopes.
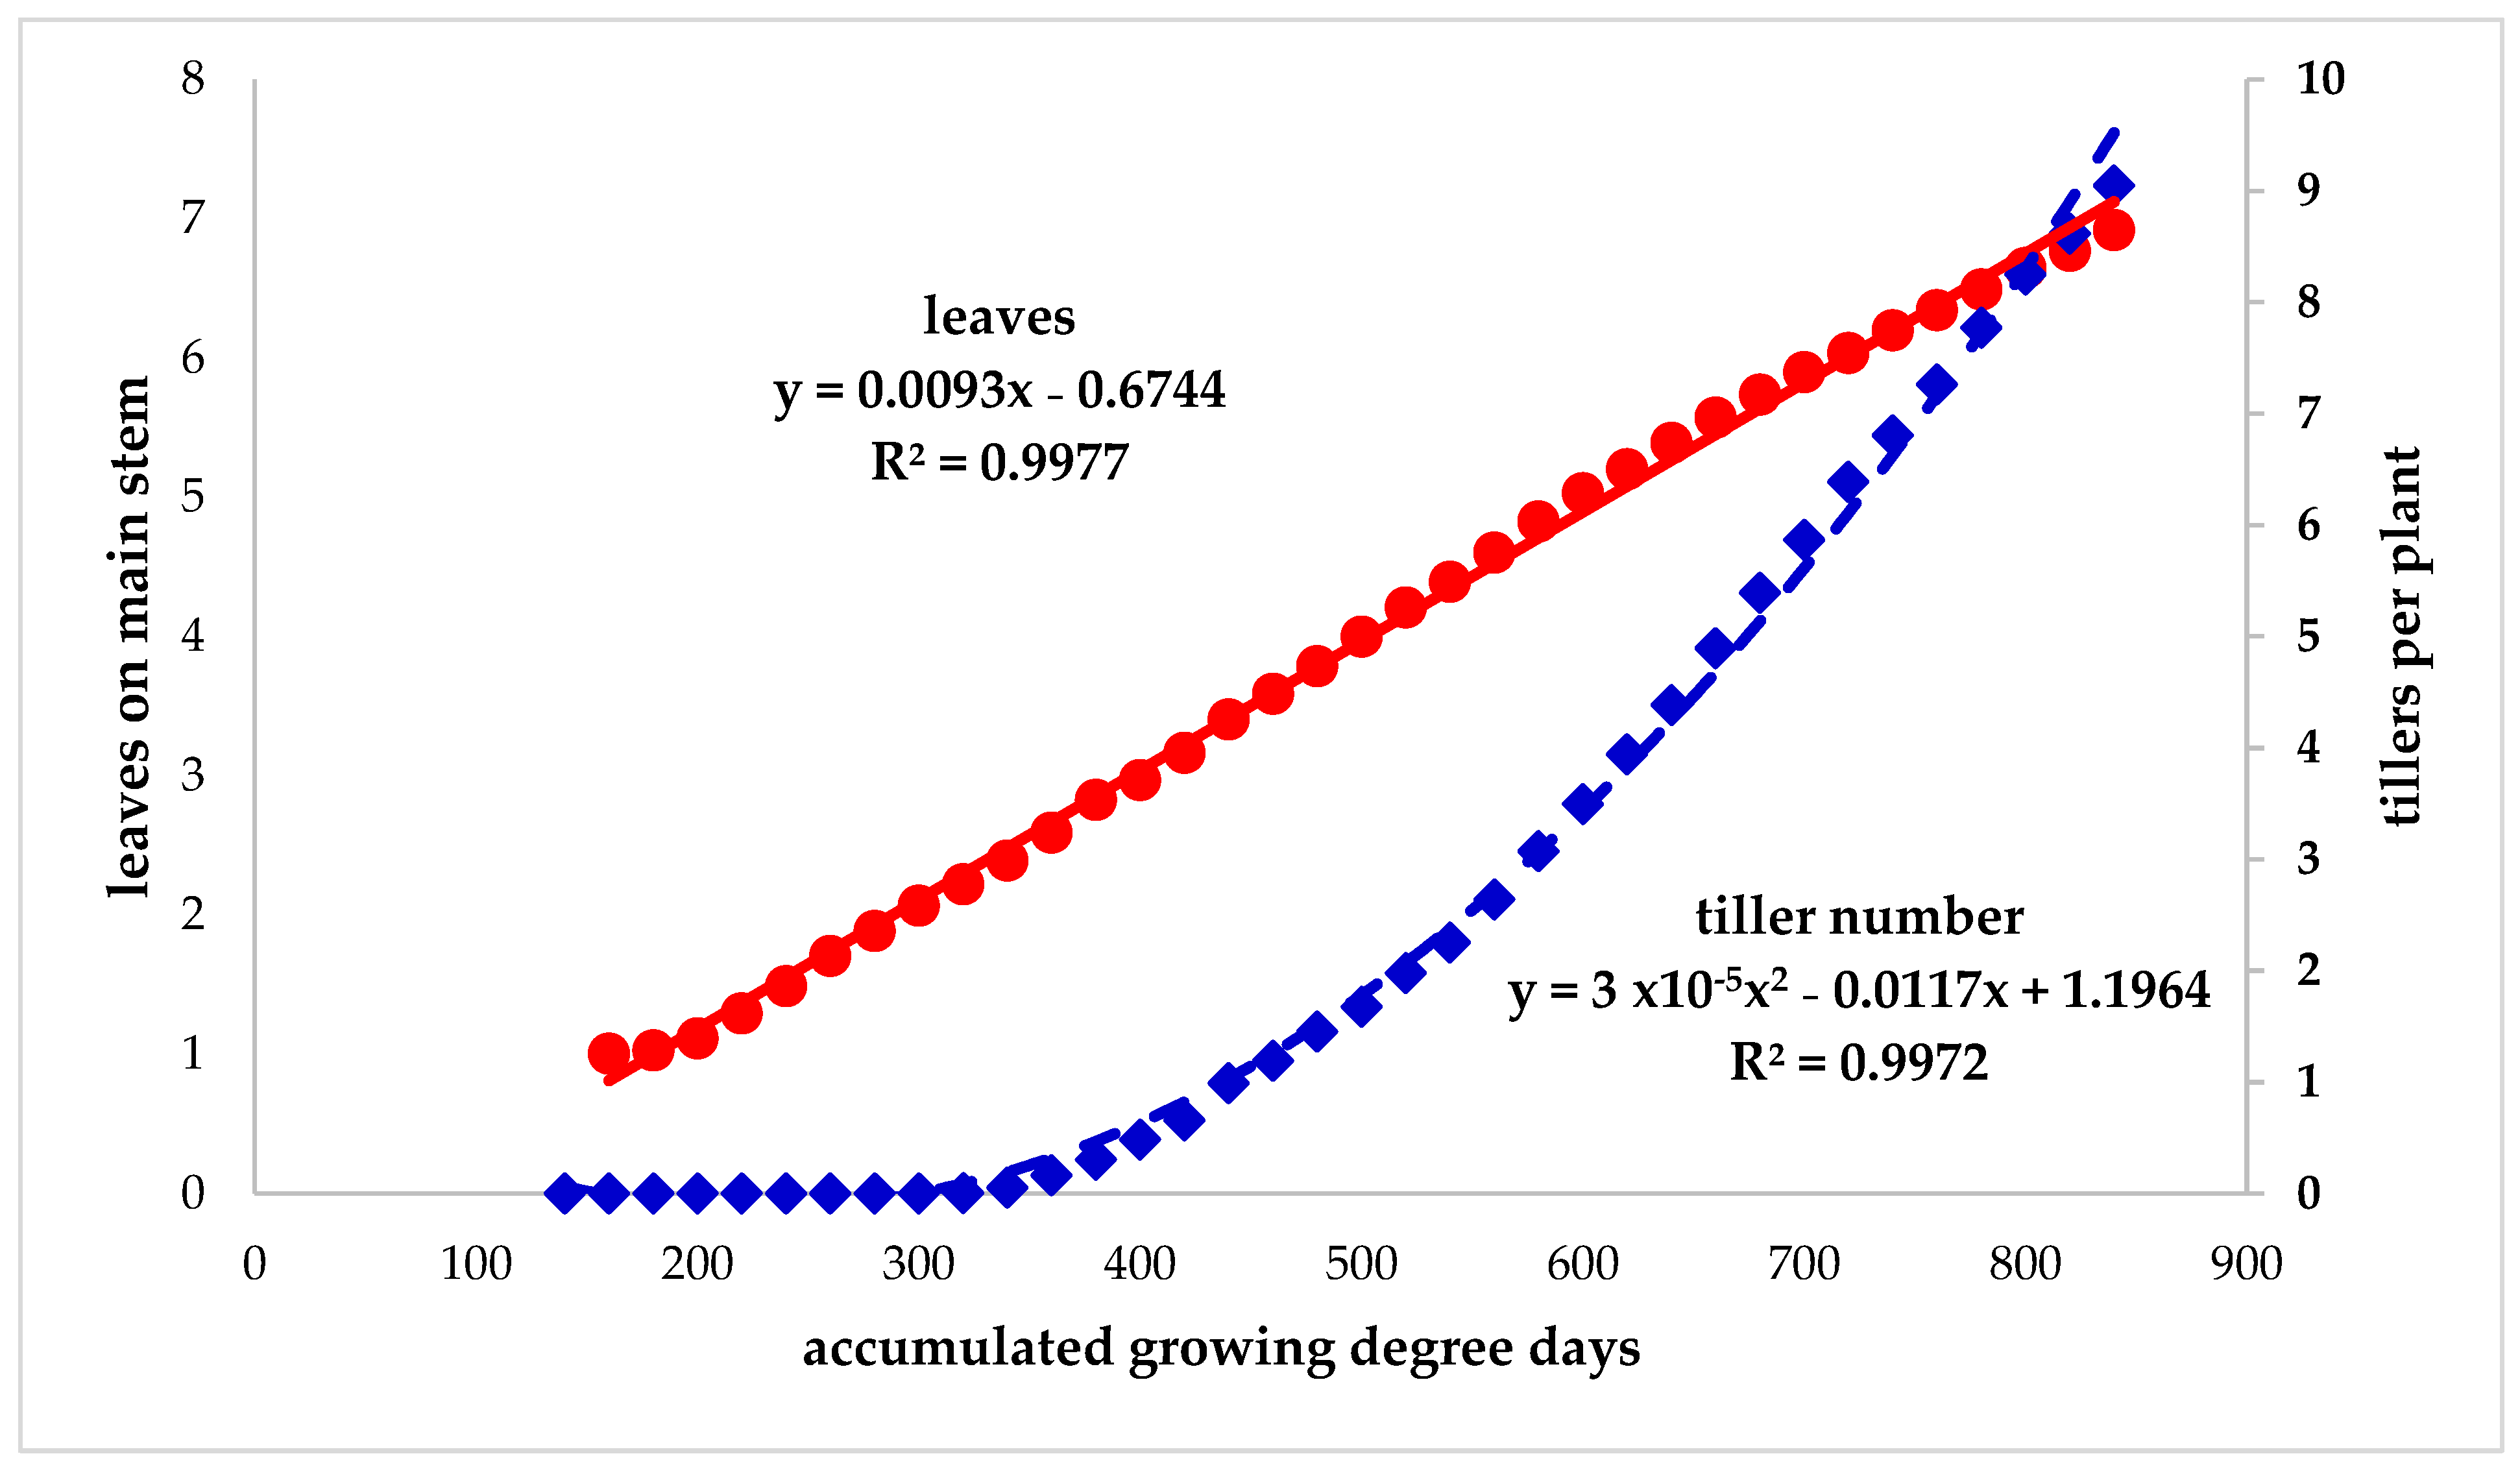
Leaf appearance is related to the growing conditions experienced. In this study the effect of gdd accumulation on leaf appearance across all plants for all lines is found in Figure 2. Appearance of leaves and tillers for the population of plants grown was very accurate for a linear equation for leaf appearance (R2 = 0.9977) and a polynomial equation for tiller appearance (R2 = 0.9972). Individuals within the lines and population are genetically unique.
4. Discussion
Plant developmental parameters were variable across individual harvest dates (Table 3 and Table 4). IWG is an obligate outcrossing species, making all individuals within lines genetically different [65] and therefore likely a large factor in variability within individual lines. The six lines used in this study are on average 25% related. Seed used was collected across three growing seasons to account for potential year and pollen source biases. TSW differences amongst lines were consistent across years, possibly indicating genetic differences between lines. Additionally, seed used was of the largest seed class and seed was aged for at least seven months to remove any bias due to potential energy deficiency or seed maturity issues. Blade length demonstrated greater differences than width at mid-blade. Leaf appearance rate is likely of greater importance in development, and of equal importance concerning the establishment and early plant competitiveness.
Plant development for IWG (Figure 1) follows the general pattern that has been described for other perennial grass species [29,30,31,32,33]. In general, the first tiller arises before the appearance of the third leaf appears to be common amongst perennial grasses [29,30,31,32,33]. Internode elongation was not found in the IWG lines tested here unlike some other species studied [32,33].
Leaf appearance rates and thus tillering, are potentially important with respect to grain yield potential in intermediate wheatgrass. The use of accumulated gdd in the controlled environment study was accurate in determining the average leaf and tiller stage. There is potential to utilize accumulated gdd to estimate timing of pest applications [22,23,24,25] or to estimate plant size after seeding to determine appropriate fall seeding dates required for adequate pre-winter development.
Perennial grass seed germination percentage has recently been shown to be similar at 21 °C and 5 °C, with the caveat that enough time must be allowed for germination at the colder temperature [65]. Fall seedings can be successful [66,67], however, in some cases have led to low first grain harvest yields [68,69], possibly due to reduced temperatures during fall growth [66]. As vernalization and reproductive induction requirements are just beginning to be worked out [39,70], the use of these studies with their variable results, and coupled with designed experiments, may help answer questions regarding plant receptivity to vernalization conditions and plant developmental requirements for adequate reproductive effort in the first harvest year (i.e., head density).
Uncovering the developmental processes, initially without inductive conditions having been met [39], can provide the potential to model timing of seeding by using climatic variables (e.g., growing degree days) within the desired growth environment to determine the potential best dates for seeding. This modeling can provide producers with a reasonable expectation of producing a good first grain yield. Each growth environment will likely have different optimal establishment dates. For example, in Manitoba, we currently utilize spring seeding to ensure adequate growth prior to vernalization (onset of winter) but this can have agronomic implications in addition to the steep economic costs associated with no crop for sale for a growing season. Understanding plant development may assist in determining the stage of growth required prior to winter needed to achieve a sufficient grain yield. Seeding timing experiments that follow or estimate developmental progress along with growing conditions (accumulated gdd) will help lead to a better understanding of pre-vernalization requirements and assist in seeding date timing.
Controlled growth environments can also be utilized to help predict requirements for vegetative growth milestones. Species, and cultivars within species, may differ in their requirements, partly due to the onset of differences in developmental processes as seen with creeping bentgrass and Poa annua var. reptans [33].
Plant development, not line seed size, was demonstrated to have a greater impact on seedling size, confirming a previous study on IWG [20]. Seed size did not improve seed yield. Line E had the highest seed yield, large seed and the highest harvest index (Table 1 and Table 2), denoting their overall agronomic and economic importance. Plant development measures can be informative. If the crop species generally produces a tiller prior to the emergence of the third leaf (Haun stage 3.0) (e.g., perennial ryegrass [29,33] and IWG in the current study), then the crop plant at the 4-leaf stage without a tiller may indicate a number of potential scenarios. First, competition may be such that the individual crop plant is unable to adequately compete for resources, thus delaying tiller appearance [71]. Secondly, high plant density, where the crop species is competing with itself, or a weed species may be important for the final crop production. When this plant does tiller (BBCH 21, but Haun 4.0+) the relative lateness of tiller formation is not captured in the assigned value. If density of the crop is too high or is suppressed by another species, production may be limited by available vernalization sites (axillary buds) due to this delayed development. These considerations will also have an impact on the profitability and sustainability of the pest control strategy being applied and may be utilized to determine the method of pest control (if any) required.
Previous work has raised questions with respect to developmental patterns, life histories and competition. For example, Poa annua and Agrostis stolonifera work demonstrated that a stressful growth environment (e.g., low light levels [32]; competition [71]) could alter developmental patterns. Also, work with Poa annua showed that life history (annual versus perennial) impacted tillering efficiency [33], (D.J. Cattani, unpublished results) where in an annual grass species, earlier flowering biotypes produced higher tillering rates (tillers per leaf on the main stem) than perennial biotypes.
Reproductive growth and tillering in ruderal plant types is relied upon for seed production to maintain the species presence. Therefore, reproductive effort is attempted to be maximized. High site usage (conversion of axillary buds to tillers) [30,31] in this type of scenario may provide the plant with a higher probability of reproductive success, thus being desirable. In perennial plants, reproductive effort is usually restricted to a defined flowering period [38,39] and vegetative growth is primarily utilized for the prolonged presence in the growth environment [35,72]. Higher tillering populations have shown a lower site usage [33], likely due to greater overall leaf number due to tillering and therefore may not necessarily subject the plant to a reduced capacity to recover from herbivory or other potential issues. Development of axillary buds in IWG indicated that the growth of coleoptile buds was relatively infrequent when observed before 42 DAI. Plant size (area covered by the plant crown) of the parentals of these half-sibling lines were different (Table 1), indicating some level of spreading capacity. Three of the parentals were on average relatively small, while the others were average or larger [73]. Plants that produced coleoptile tillers or rhizomes were evenly distributed amongst the lines tested and this variability is likely a remnant of the genetic history of the lines.
Line E was the highest yielding plant of all the IWG tested in Manitoba [12] and covered a larger than average area. Line E was the only member of this family selected for grain production from the 50 individuals grown [12,15]. This indicates that the identification of plants with good combining ability may be difficult as trait segregation was observed. It is expected that successful selection for sustained grain yield may be slow in IWG due to this inherent genetic variability imposed by its out-crossing nature. Presence of selfed individuals can be identified by albinism and poor vigor (L.R. DeHaan, personal communication). Selfed individuals would have been removed (albino) or not included due to poor development when replicates were set up after emergence.
Tillering was moderate in intermediate wheatgrass. While vernalization conditions impact reproductive tillering [70] in IWG, it is possible that the amount of plant development that takes place prior to vernalization or that needs to be achieved prior to vernalization will impact the resulting reproductive effort, i.e., inflorescence initiation as in Poa pratensis [74].
Early plant development is critical for establishment of the stand and IWG has been shown to be relatively competitive over time [75]. Plant development can lead to differences in species and cultivars/populations within species behavior. Perennial forage species can have different relative establishment ratings (seedling competitiveness [16]) and IWG would likely be in the more aggressive class of the perennial forages. This may be related to seed stores, but only in that very small seeded species, e.g., A. stolonifera produce relatively small seedlings, especially the first two leaves [33]. Relative leaf length increases in A. stolonifera were seen through leaf three, in that the relative blade length of leaf three to leaf two was greater than the relative length of leaf two to leaf one [33], whereas in the current study the relative length continuously decreased throughout until leaf lengths were similar under the experimental conditions. The impact of both inter- and intra-specific competition [58,76,77] in the field will impact development through competition for light, nutrients, water, and space.
This study investigated plant development in six half-sibling lines of IWG. The results indicate a relatively uniform developmental pattern. Other species that have shown differences in developmental rates [32,33], demonstrated similar patterns in the juvenile stage (pre-reproduction). Development of IWG is taking place in North America and Europe. Performance indicates that different characteristics are selected for in the different programs, although originating from materials selected for grain production by The Land Institute [11]. It is anticipated that the developmental patterns will be similar in these materials. Due to the obligate outcrossing nature of this speceis, segregation will be present in every generation, but selection will hopefully narrow the range of trait expression. The work herein may serve as a template for the development of a uniform method to report development in the planting year. This may then be used to develop a better understanding of the relationship between juvenile plant development and the potential yield of the crop. A similar collaborative approach was used in the phenological modeling of IWG [33].
5. Conclusions
An understanding of plant development is important for making informed agronomic decisions. Tiller development in IWG followed a similar pattern to other perennial grass species. Seedling vigor (dry weight) appears to be related to the main stem leaf area in IWG. Maternal plant seed size does not appear to influence early growth. Early plant development can provide a baseline upon which agronomic decisions may be made and will provide greater definition of the crop’s response to agronomic treatments in the seedling year. This may be utilized to determine how seedling or early plant size prior to vernalization impacts the reproductive effort of the crop. Additionally, this may then lead to plant density targets, seeding times, seeding rates, etc., to provide informed expectations to the producers adopting this novel crop.
Author Contributions
D.J.C. designed, led and conducted the research, conducted analysis and wrote the manuscript, S.R.A., consulted on experimental design, analyzed the data and edited the manuscript. All authors have read and agreed to the published version of the manuscript.
Funding
This research was in part funded by the Manitoba Wheat and Barley Growers Association, grant number GIH1000170319.
Institutional Review Board Statement
Not applicable.
Acknowledgments
The authors would like to acknowledge Ardelle Slama for their assistance in these experiments. The authors would like to thank the anonymous reviewers for the helpful comments and suggestions to improve the manuscript.
Conflicts of Interest
The authors declare no conflict of interest.
References
- Crews, T.E.; Cattani, D.J. Strategies, advances, and challenges in breeding perennial grain crops. Sustainability 2018, 10, 2192. [Google Scholar] [CrossRef] [Green Version]
- DeHaan, L.R.; Christians, M.; Crain, J.; Poland, J. Development and evolution of an intermediate wheatgrass breeding program. Sustainability 2018, 10, 1499. [Google Scholar] [CrossRef] [Green Version]
- Bajgain, P.; Zhang, X.; Jungers, J.M.; DeHaan, L.R.; Heim, B.; Sheaffer, C.C.; Wyse, D.L.; Anderson, J.A. ‘MN-Clearwater’, the first food-grade intermediate wheatgrass (Kernza perennial grain) cultivar. J. Plant Regist. 2020, 14, 288–297. [Google Scholar] [CrossRef]
- Huang, G.; Qin, S.; Zhang, S.; Cai, X.; Wu, S.; Dao, J.; Zhang, J.; Huang, L.; Harnpichitvitaya, D.; Wade, L.J.; et al. Performance, Economics and Potential Impact of Perennial Rice PR23 Relative to Annual Rice Cultivars at Multiple Locations in Yunnan Province of China. Sustainability 2018, 10, 1086. [Google Scholar] [CrossRef] [Green Version]
- Wagoner, P. Perennial grain new use for intermediate wheatgrass. J. Soil Water Conserv. 1990, 45, 81–82. [Google Scholar]
- Popkin, G. Satellites document rapid expansion of cropland. Science 2022, 375, 12. [Google Scholar] [CrossRef] [PubMed]
- Kim, K.; Daly, E.J.; Flesch, T.K.; Coates, T.W.; Hernandez-Ramirez, G. Carbon and water dynamics of a perennial versus an annual grain crop in temperate agroecosystems. Agric. For. Meteor. 2022, 304, 108805. [Google Scholar] [CrossRef]
- Bell, L.W.; Byrne (nee Flugge), F.; Ewing, M.A.; Wade, L.J. A preliminary whole-farm economic analysis of perennial wheat in an Australian dryland farming system. Agric. Systs. 2008, 96, 166–174. [Google Scholar] [CrossRef]
- Bell, L.W.; Harrison, M.T.; Kirkegaard, J.A. Dual-purpose cropping—Capitalising on potential grain crop grazing to enhance mixed-farming profitability. Crop Pasture Sci. 2015, 66, i–iv. [Google Scholar] [CrossRef] [Green Version]
- DeHaan, L.R.; Van Tassel, D.L.; Anderson, J.A.; Asselin, S.R.; Barnes, R.; Baute, G.J.; Cattani, D.J.; Culman, S.W.; Dorn, K.M.; Hulke, B.S.; et al. A pipeline strategy for grain crop domestication. Crop Sci. 2016, 56, 917–930. [Google Scholar] [CrossRef] [Green Version]
- Bajgain, P.; Anderson, J.A.; Crain, J.L.; Cattani, D.J.; Larson, S.R.; Altendorf, K.R.; Poland, J.A.; Westerbergh, A.; Crews, T.E.; Turner, M.K.; et al. Breeding Intermediate Wheatgrass for Grain Production. Plant Breed. Rev. 2022, 46. (In press) [Google Scholar]
- Cattani, D.J. Selection of a perennial grain for seed productivity across years: Intermediate wheatgrass as a test species. Can. J. Plant Sci. 2017, 97, 516–524. [Google Scholar] [CrossRef]
- Ries, R.E.; Svejcar, T.J. The grass seedling: When is it established? J. Range Man. 1991, 44, 574–596. [Google Scholar] [CrossRef]
- Cattani, D.J.; Miller, P.R.; Smith, S.R., Jr. Relationship of shoot morphology between seedlings and established turf in creeping bentgrass. Can. J. Pant Sci. 1996, 76, 283–289. [Google Scholar] [CrossRef]
- Cattani, D.J.; Smith, S.R., Jr.; Miller, P.R.; Feindel, D.E.; Gjuric, R. Seed yield and yield components of creeping bentgrass cultivars. Can. J. Plant Sci. 2004, 84, 117–124. [Google Scholar] [CrossRef]
- Blaser, R.E.; Taylor, T.; Griffith, W.; Skrdla, W. Seedling Competition in Establishing Forage Plants. Agron. J. 1956, 48, 1–6. [Google Scholar] [CrossRef]
- Blaser, R.E.; Griffeths, W.L.; Taylor, T.H. Seedling Competition in Compounding Forage Seed Mixtures. Agron. J. 1956, 48, 118–123. [Google Scholar] [CrossRef]
- Picasso, V.D.; Brummer, E.C.; Liebman, M.; Dixon, P.M.; Wilsey, B.J. Crop species diversity affects productivity and weed suppression in perennial polycultures under two management strategies. Crop Sci. 2008, 48, 331–342. [Google Scholar] [CrossRef]
- Kilcher, M.R. Fall seeding versus spring seeding in the establishment of five grasses and one alfalfa in southern Saskatchewan. J. Range Man. 1961, 14, 320–322. [Google Scholar] [CrossRef]
- Lawrence, T. Emergence of intermediate wheatgrass lines from five depths of seeding. Can. J. Plant Sci. 1957, 37, 216–219. [Google Scholar] [CrossRef] [Green Version]
- Lawrence, T.; Kilcher, M.R. Emergence, seedling growth and yield of Altai wild ryegrass and other grasses as influenced by soil temperature and fertility. Can. J. Plant Sci. 1972, 52, 795–800. [Google Scholar] [CrossRef]
- Fraser, M.; Strelkov, S.E.; Turnbull, G.D.; Ahmed, H.U.; Barton, W.; Hwang, S.-F. Evaluation of pyraclostrobin as a component in seed and foliar fungicides for the management of blackleg (Leptosphaeria maculans) of canola (Brassica napus). Can. J. Plant Sci. 2020, 100, 549–559. [Google Scholar] [CrossRef]
- Soltani, N.; Shropshire, C.; Sikkema, P.H. Control of annual ryegrass with spring-applied herbicides prior to seeding corn. Can. J. Plant Sci. 2020, 100, 372–379. [Google Scholar] [CrossRef]
- Tidemann, B.D.; O’Donovan, J.T.; Izydorczyk, M.; Turkington, T.K.; Oatway, L.; Beres, B.; Mohr, R.; May, W.E.; Harker, K.N.; Johnson, E.N.; et al. Effects of plant growth regulator applications on malting barley in western Canada. Can. J. Plant Sci. 2020, 100, 653–665. [Google Scholar] [CrossRef]
- Vollmer, J.; Johnson, B.L.; Deckard, E.L.; Rahman, M. Evaluation of simulated hail damage on seed yield and agronomic traits in canola (Brassica napus L.). Can. J. Plant Sci. 2020, 100, 597–608. [Google Scholar] [CrossRef]
- Whalley, R.D.B.; McKell, C.M.; Green, L.R. Seedling vigor and the early nonphotosynthetic stage of seedling growth in grasses. Crop Sci. 1966, 6, 147–150. [Google Scholar] [CrossRef]
- Barros, J.F.C.; Basch, G.; de Carvalho, M. Effect of reduced doses of a post-emergence herbicide to control grass and broad-leaved weeds in no-till wheat under Mediterranean conditions. Crop Protect. 2007, 26, 1538–1545. [Google Scholar] [CrossRef]
- Casler, M.D.; Undersander, D.J. Selection for establishment capacity in reed canarygrass. Crop Sci. 2006, 46, 1277–1285. [Google Scholar] [CrossRef]
- Neuteboom, J.H.; Lantinga, E.A. Tillering potential and relationship between leaf and tiller production in perennial ryegrass. Ann. Bot. 1989, 63, 265–270. [Google Scholar] [CrossRef]
- Skinner, R.H.; Nelson, C.J. Estimation of potential tiller production and site usage during tall fescue canopy development. Ann. Bot. 1992, 70, 493–499. [Google Scholar] [CrossRef]
- Van Loo, E.N. Tillering, leaf expansion and growth of plants of two cultivars of perennial. Ann. Bot. 1992, 70, 511–518. [Google Scholar]
- Cattani, D.J. Early plant development in ‘Emerald’ and ‘UM67-10′ creeping bentgrass. Crop Sci. 1999, 39, 754–762. [Google Scholar] [CrossRef]
- Cattani, D.J.; Struik, P.C.; Nowak, J.N. Comparative morphological development of divergent flowering types of annual bluegrass and tillering types of creeping bentgrass. Crop Sci. 2002, 42, 1251–1258. [Google Scholar] [CrossRef]
- Robson, M.J. The growth and development of simulated swards of perennial ryegrass. I. Leaf growth and dry weight change as related to ceiling yield of a seedling sward. Ann. Bot. London 1973, 37, 487–500. [Google Scholar] [CrossRef]
- Jonsdottir, G.A. Tiller demography in seashore populations of Agrostis stolonifera, Festuca rubra and Poa ndiangr. J. Veg. Sci. 1991, 2, 89–94. [Google Scholar] [CrossRef]
- Entz, M.H.; Smith, S.R.; Cattani, D.J.; Storgaard, A.K. Influence of post-harvest residue management on tiller dynamics and seed yield in timothy. Can. J. Plant Sci. 1994, 74, 507–513. [Google Scholar] [CrossRef]
- Cattani, D.J.; Entz, M.H.; Bamford, K.C. Tiller production and dry matter accumulation in six creeping bentgrass genotypes grown in Manitoba. Can. J. Plant Sci. 1991, 71, 595–599. [Google Scholar] [CrossRef]
- Heide, O.M. Control of flowering and reproduction in temperate grasses. New Phytol. 1994, 128, 347–362. [Google Scholar] [CrossRef]
- Duchene, O.; Dumont, B.; Cattani, D.J.; Fagnant, L.; Schlautman, B.; DeHaan, L.R.; Barriball, S.; Jungers, J.M.; Picasso, V.D.; David, C.; et al. Process-based analysis of Thinopyrum intermedium phenological development highlights the importance of dual induction for reproductive growth and agronomic performance. Agric. For. Meteorol. 2021, 301–302, 108341. [Google Scholar] [CrossRef]
- Fernandez, C.W.; Ehlke, N.; Sheaffer, C.C.; Jungers, J.M. Effects of nitrogen fertilization and planting density on intermediate wheatgrass yield. Agron. J. 2020, 112, 4159–4170. [Google Scholar] [CrossRef]
- Black, A.L.; Reitz, L.L. Row spacing and fertilization influences on forage and seed yields of intermediate wheatgrass, Canada wildrye, and green needlegrass on dryland. Agron. J. 1969, 61, 801–805. [Google Scholar] [CrossRef]
- Hunter, M.C.; Sheaffer, C.C.; Culman, S.W.; Jungers, J.M. Effects of defoliation and row spacing on intermediate wheatgrass I: Grain production. Agron. J. 2020, 112, 1748–1763. [Google Scholar] [CrossRef]
- Hunter, M.C.; Sheaffer, C.C.; Culman, S.W.; Lazarus, W.F.; Jungers, J.M. Effects of defoliation and row spacing on intermediate wheatgrass II: Forage yield and economics. Agron. J. 2020, 112, 1862–1880. [Google Scholar] [CrossRef]
- Law, R.; Bradshaw, A.D.; Putwain, P.D. Life-history variation in Poa annua. Evolution 1977, 31, 233–246. [Google Scholar] [CrossRef]
- Haun, J.R. Visual quantification of wheat development. Agron. J. 1973, 65, 116–119. [Google Scholar] [CrossRef]
- Lancashire, P.D.; Bleiholder, H.; Van Den Boom, T.; Langelüddeke, P.; Strauss, R.; Weber, E.; Witzenberger, A. A uniform decimal code for crops and weeds. Ann. Appl. Biol. 1991, 119, 561–601. [Google Scholar] [CrossRef]
- Zadoks, J.C.; Chang, T.T.; Konzak, C.F. A decimal scale code for the growth stages of cereals. Weed Res. 1974, 14, 415–421. [Google Scholar] [CrossRef]
- West, C.P. A proposed growth stage system for bermudagrass. In Proceedings of the Amer. Forage and Grassland Council, Blacksburg, VA, USA, 6–9 June 1990; Am. Forage and Grasslands Council: Georgetown, TX, USA, 1990; pp. 38–42. [Google Scholar]
- Cunniff, J.; Wilkinson, S.; Charles, M.; Jones, G.; Rees, M.; Osborne, C.P. Functional traits differ between cereal crop progenitors and other wild grasses gathered in the neolithic fertile crescent. PLoS ONE 2014, 9, e87586. [Google Scholar] [CrossRef]
- Kramer-Walter, K.R.; Bellingham, P.J.; Millar, T.R.; Smissen, R.D.; Richardson, S.J.; Laughlin, D.C. Root traits are multidimensional: Specific root length is independent from root tissue density and the plant economic spectrum. J. Ecol. 2016, 104, 1299–1310. [Google Scholar] [CrossRef]
- Larson, J.E.; Sheley, R.L.; Hardegree, S.P.; Doescher, P.S.; James, J.J. Do key dimensions of seed and seedling functional trait variation capture variation in recruitment probability? Oecologia 2016, 181, 39–53. [Google Scholar] [CrossRef]
- Happ, K.; McDonald, M.B.; Danneberger, T.K. Vigor testing in perennial ryegrass (Lolium perenne L.) seeds. Seed Sci. Technol. 1993, 21, 375–381. [Google Scholar]
- Atkinson, R.R.L.; Mockford, E.J.; Bennett, C.; Christin, P.-A.; Spriggs, E.L.; Freckleton, R.P.; Thompson, K.; Rees, M.; Osborne, C.P. C4 photosynthesis boosts growth by altering physiology, allocation and size. Nat. Plants 2016, 18, 16038. [Google Scholar] [CrossRef] [PubMed]
- Zhang, X.; Larson, S.R.; Gao, L.; Teh, S.L.; DeHaan, L.R.; Fraser, M.; Sallam, A.; Kantarski, T.; Frels, K.; Poland, J.; et al. Uncovering the genetic architecture of seed weight and size in intermediate wheatgrass through linkage and association mapping. Plant Genome 2017, 10, 22. [Google Scholar] [CrossRef] [PubMed] [Green Version]
- Crain, J.; Bajgain, P.; Anderson, J.; Zhang, X.; DeHaan, L.; Poland, J. Enhancing crop domestication through genomic selection, a case study of intermediate wheatgrass. Front. Plant Sci. 2020, 11, 319. [Google Scholar] [CrossRef] [Green Version]
- Oliveira, G.; Clemente, A.; Nunes, A.; Correia, O. Suitability and limitations of native species for seed mixtures to re-vegetate degraded areas. Appl. Veg. Sci. 2014, 17, 726–736. [Google Scholar] [CrossRef]
- Gibson, A.; Nelson, C.R.; Atwater, D.Z. Response of bluebunch wheatgrass to invasion: Differences in competitive ability among invader-experienced and invader-naïve populations. Funct. Ecol. 2018, 32, 1857–1866. [Google Scholar] [CrossRef]
- Ross, M.A.; Harper, J.L. Occupation of biological space during seedling establishment. J. Ecol. 1972, 60, 77–88. [Google Scholar] [CrossRef]
- Shi, P.; Ratkowsky, D.A.; Li, Y.; Zhang, L.; Lin, S.; Gielis, J. A general leaf area geometric formula exists for plants—Evidence from the simplified Gielis equation. Forests 2018, 9, 714. [Google Scholar] [CrossRef] [Green Version]
- Milla, R.; Reich, P.B. The scaling of leaf area and mass: The cost of light interception increases with leaf size. Proc. R. Soc. B 2007, 274, 2109–2114. [Google Scholar] [CrossRef] [Green Version]
- Sebolai, B.; Vogel, K.B. Evaluation of three breeding cycles for seedling weight of switchgrass, big bluestem, and ndiangrass. Crop Sci. 2014, 54, 1354–1360. [Google Scholar] [CrossRef]
- Ray-Mukherjee, J.; Jones, T.A.; Adler, P.B.; Monaco, T.A. Immature Seedling Growth of Two North American Native Perennial Bunchgrasses and the Invasive Grass Bromus tectorum. Range Ecol. Man. 2011, 64, 358–365. [Google Scholar] [CrossRef]
- Cattani, D.J.; Asselin, S.R. Has selection for grain yield altered intermediate wheatgrass? Sustainability 2018, 10, 688. [Google Scholar] [CrossRef] [Green Version]
- Hunt, O.J.; Miller, D.G. Coleoptile Length, Seed Size and Emergence in Intermediate Wheatgrass (Agropyron intermedium Host (Beauv)). Agron. J. 1965, 57, 192–195. [Google Scholar] [CrossRef]
- Altendorf, K.R.; Larson, S.R.; DeHaan, L.R.; Crain, J.; Neyhart, J.; Dorn, K.M.; Anderson, J.A. Nested association mapping reveals the genetic architecture of spike emergence and anthesis timing in intermediate wheatgrass. Genes Genomes Genet. G3 2021, 11, jkab025. [Google Scholar] [CrossRef]
- Jungers, J.M.; DeHaan, L.R.; Betts, K.J.; Sheaffer, C.C.; Wyse, D.L. Intermediate Wheatgrass Grain and Forage Yield Responses to Nitrogen Fertilization. Agron. J. 2017, 109, 462–472. [Google Scholar] [CrossRef] [Green Version]
- Tautges, N.E.; Jungers, J.M.; DeHaan, L.R.; Wyse, D.L.; Sheaffer, C.C. Maintaining grain yields of the perennial cereal intermediate wheatgrass in monoculture vs. bi-culture with alfalfa in the Upper Midwestern USA. 2018. J. Agric. Sci. 2018, 156, 758–773. [Google Scholar] [CrossRef]
- Dick, C.; Cattani, D.; Entz, M. Kernza Intermediate wheatgrass (Thinopyrum intermedium) grain production as influenced by legume intercropping and residue management. Can. J. Plant Sci. 2018, 98, 1376–1379. Available online: http://www.nrcresearchpress.com.uml.idm.oclc.org/doi/pdf/10.1139/CJPS-2018-0146 (accessed on 3 May 2022). [CrossRef]
- Olugbenle, O.; Pinto, P.; Picasso, V.D. Optimal Planting Date of Kernza Intermediate Wheatgrass Intercropped with Red Clover. Agronomy 2021, 11, 2227. [Google Scholar] [CrossRef]
- Ivancic, K.; Locatelli, A.; Tracy, W.F.; Picasso, V. Kernza intermediate wheatgrass (Thinopyrum intermedium) response to a range of vernalization conditions. Can. J. Plant Sci. 2021, 101, 770–773. [Google Scholar] [CrossRef]
- Cattani, D.J. Effect of turf competition on creeping bentgrass seedling establishment. In Proceedings of the 9th International Turfgrass Conference, Toronto, ON, Canada, 15–21 July 2001; pp. 850–854. [Google Scholar]
- Bond, W.J. Ancient grasslands at risk. Science 2016, 351, 120–122. [Google Scholar] [CrossRef]
- Cattani, D.J.; Asselin, S.R. Extending the growing season: Forage seed production and perennial grains. Can. J. Plant Sci. 2018, 98, 235–246. [Google Scholar] [CrossRef] [Green Version]
- Thompson, D.J.; Clark, K.W. Effects of clipping and nitrogen fertilization on tiller development and flowering in Kentucky bluegrass. Can. J. Plant Sci. 1993, 73, 569–575. [Google Scholar] [CrossRef]
- Duchene, O.; Celette, F.; Barreiro, A.; Dimitrova Mårtensson, L.-M.; Freschet, G.T.; David, C. Introducing Perennial Grain in Grain Crops Rotation: The Role of Rooting Pattern in Soil Quality Management. Agronomy 2020, 10, 1254. [Google Scholar] [CrossRef]
- Bullock, J.M.; Clear Hill, B.; Silvertown, J.; Sutton, M. Gap colonization as a source of grassland community change: Effects of gap size and grazing on the rate and mode of colonization by different species. OIKOS 1995, 72, 273–282. [Google Scholar] [CrossRef]
- Silvertown, J.; Bullock, J.M. Do seedlings in gaps interact? A field test of assumptions in ESS seed size models. OIKOS 2003, 101, 499–504. [Google Scholar] [CrossRef]
Figure 1.
Tillering flow-chart for up to 42 days of growth in the growth room. These means (standard deviations in parenthesis) are the results of plants grown from seed of six half-sib lines harvested from three successive production years and grown for 21, 28, 35 or 42 days. (Note some plants were harvested that did not tiller, especially at the 21- and 28-day harvests). P refers to primary tillers (arising from the seminal vegetative axis), S for secondary, T for tertiary and Q for quaternary tillers.
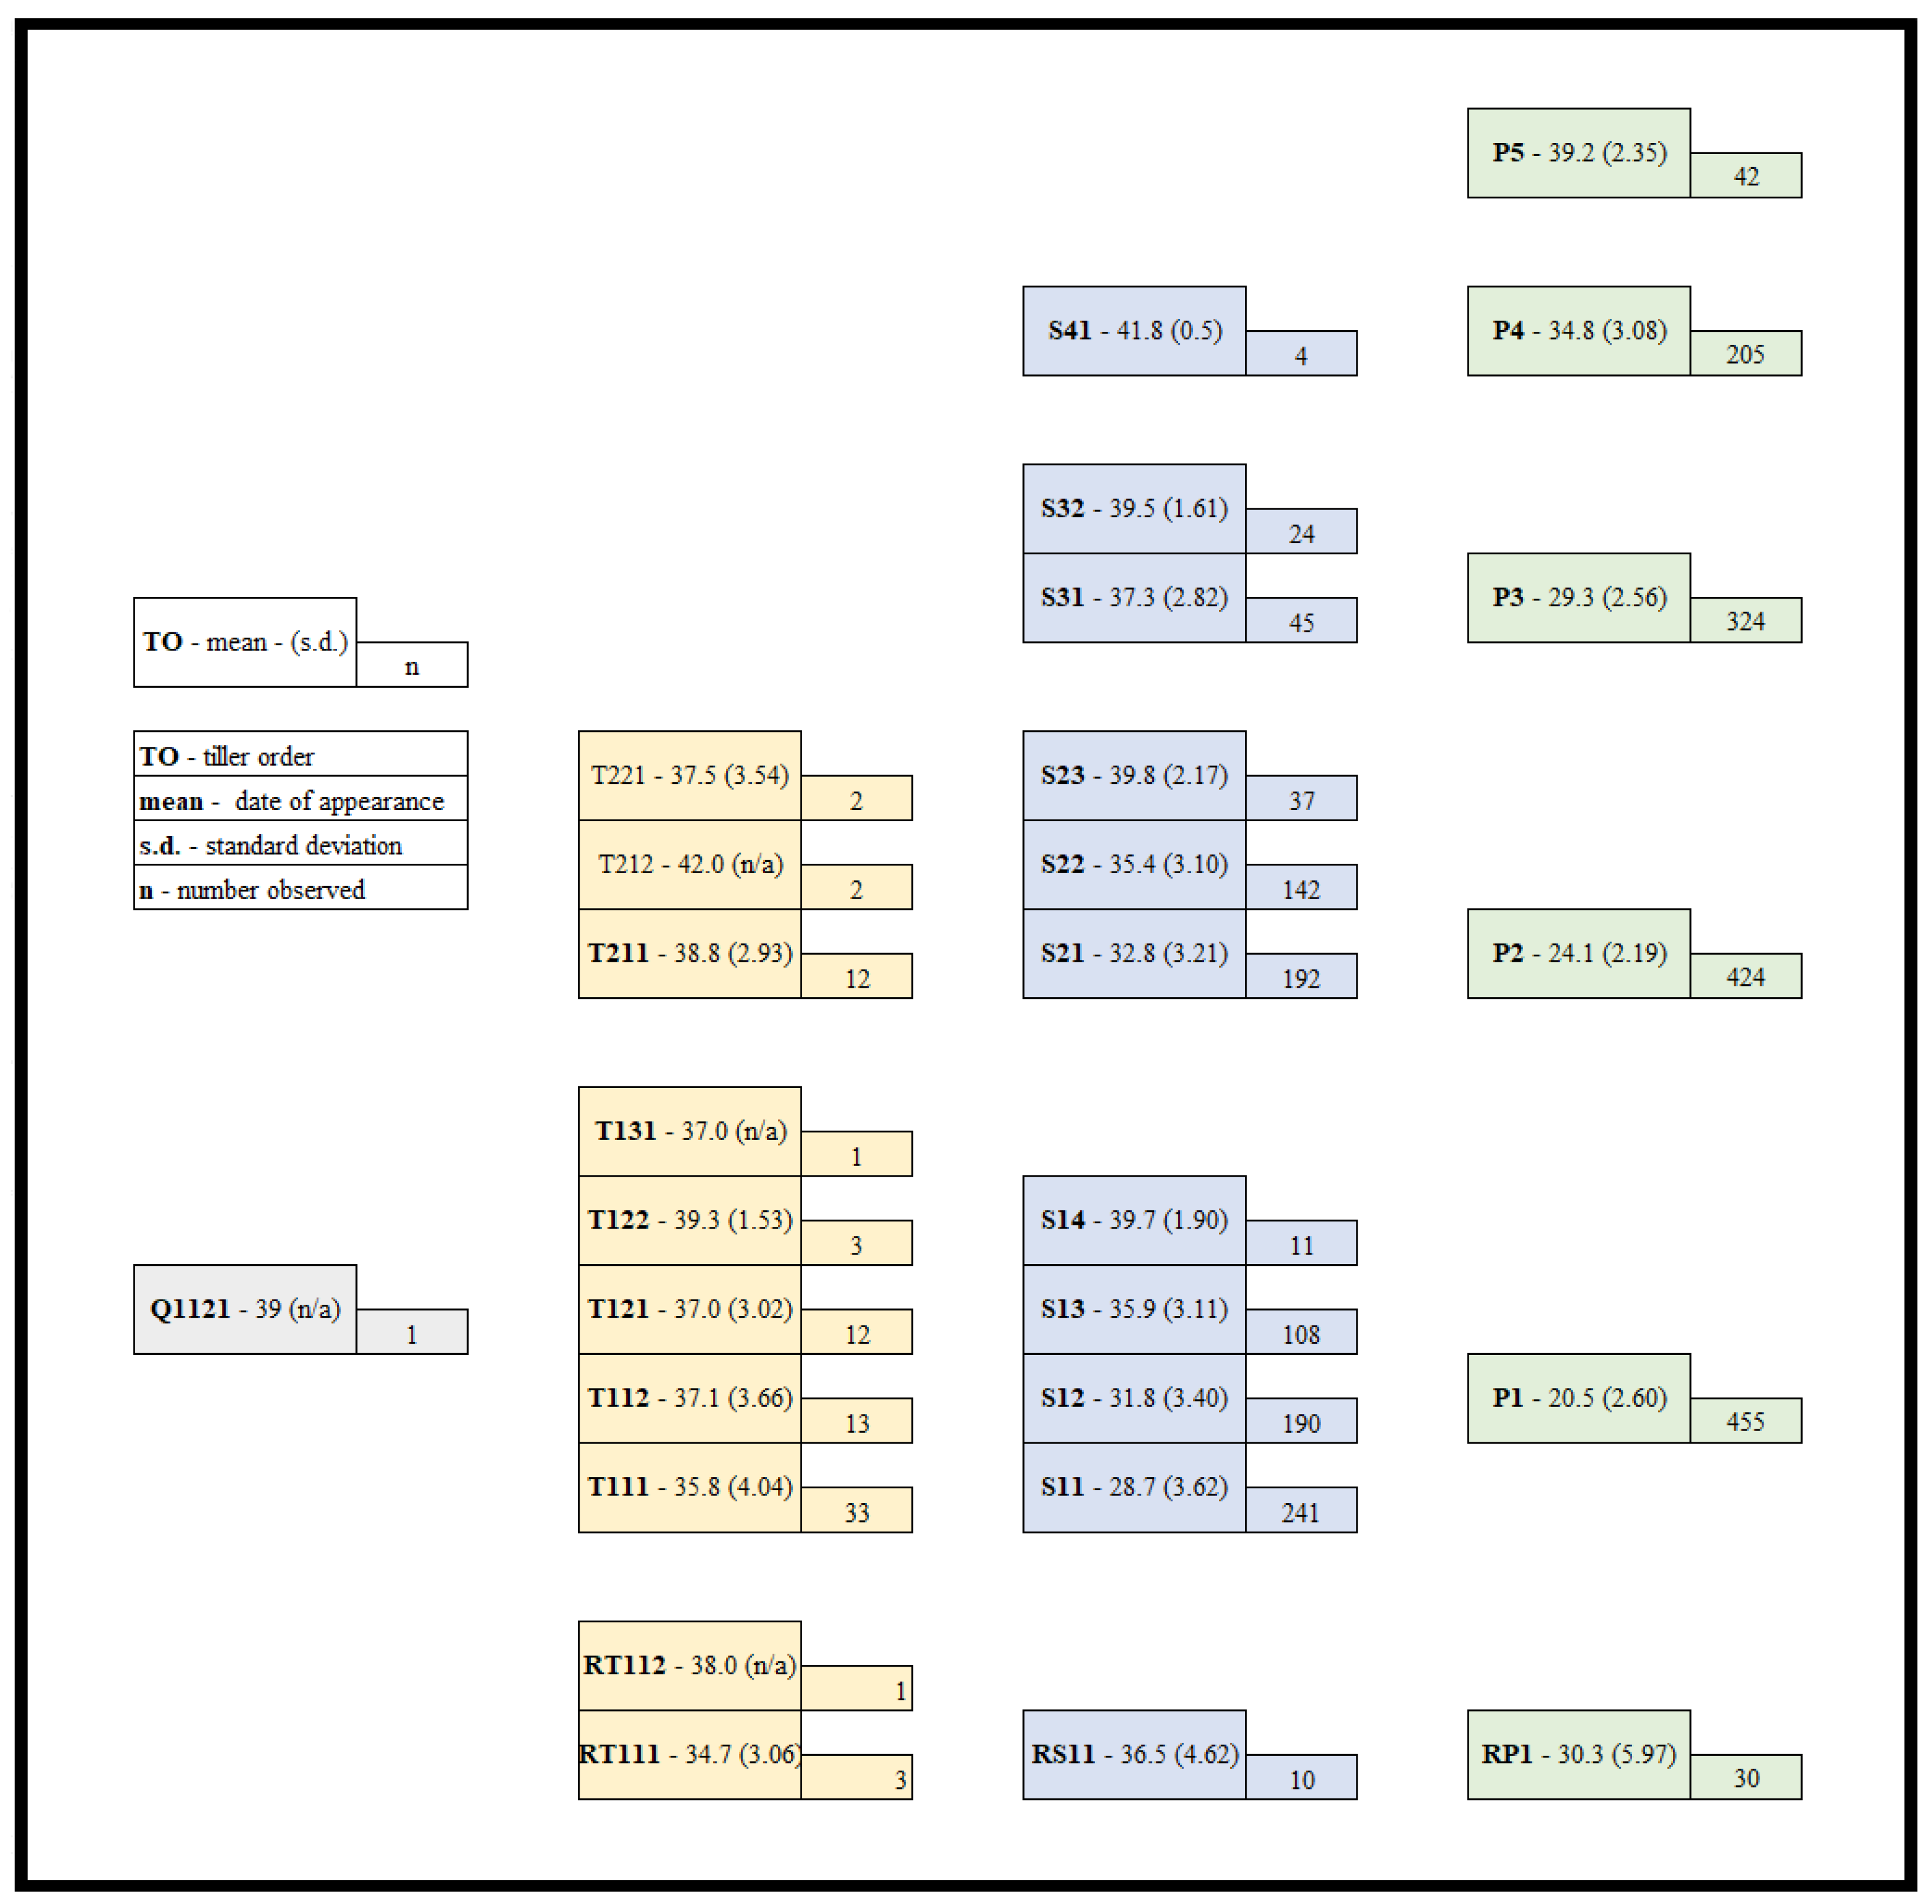
Figure 2.
Regression of accumulated growing degree days (x) for mean daily leaves on the main stem (primary y axis) (red circles) and mean daily tillers plant−1 (secondary y axis) (blue squares).
Figure 2.
Regression of accumulated growing degree days (x) for mean daily leaves on the main stem (primary y axis) (red circles) and mean daily tillers plant−1 (secondary y axis) (blue squares).

Table 1.
Overall mean thousand seed weight (TSW) for half-sibling lines of intermediate wheatgrass lines, TSW for the large seed portion, seed yield plant−1 and plant area harvested over three years at Carman, MB.
Table 1.
Overall mean thousand seed weight (TSW) for half-sibling lines of intermediate wheatgrass lines, TSW for the large seed portion, seed yield plant−1 and plant area harvested over three years at Carman, MB.
| Line | All Seed | Large Seed | Seed Yield | Plant Area |
|---|---|---|---|---|
| g thousand seeds−1 | g plant−1 | cm−2 | ||
| Line D | 9.62 ± 1.67 | 11.13 ± 0.68 | 69.52 ± 26.13 | 1039 ± 101 |
| Line E | 8.75 ± 0.81 | 11.12 ± 0.63 | 130.50 ± 38.19 | 1433 ± 493 |
| Line C | 7.96 ± 1.10 | 9.68 ± 0.36 | 47.12 ± 20.36 | 609 ± 51 |
| Line F | 7.92 ± 0.58 | 9.99 ± 0.49 | 76.62 ± 48.70 | 1227 ± 164 |
| Line B | 7.55 ± 0.35 | 8.12 ± 0.33 | 39.93 ± 15.68 | 612 ± 123 |
| Line A | 6.28 ± 0.25 | 8.00 ± 0.28 | 46.33 ± 7.83 | 607 ± 39 |
Table 2.
Mean biomass plant−1, Harvest index, heads plant−1, heads cm−2, yield cm−2 of plant areas and yield head−1 for half-sibling lines of intermediate wheatgrass at Carman, MB harvested over three successive years.
Table 2.
Mean biomass plant−1, Harvest index, heads plant−1, heads cm−2, yield cm−2 of plant areas and yield head−1 for half-sibling lines of intermediate wheatgrass at Carman, MB harvested over three successive years.
| Biomass | Harvest Index | Heads | Heads cm−2 | Yield cm−2 | Yield head−1 | |||||||
|---|---|---|---|---|---|---|---|---|---|---|---|---|
| Line | g plant−1 | % | plant−1 | cm−2 | mg cm−2 | mg | ||||||
| Line E | 661.1 ± 154 | 19.1 ± 3.5 | 248.7 ± 63 | 0.177 ± 0.02 | 92.5 ± 10.3 | 525.2 ± 64 | ||||||
| Line D | 654.4 ± 225 | 10.6 ± 1.3 | 245.0 ± 80 | 0.233 ± 0.06 | 66.7 ± 23.5 | 285.5 ± 48 | ||||||
| Line B | 488.4 ± 225 | 8.5 ± 1.4 | 143.3 ± 36 | 0.242 ± 0.08 | 65.5 ± 23.3 | 275.6 ± 62 | ||||||
| Line F | 487.8 ± 173 | 14.5 ± 5.1 | 189.7 ± 72 | 0.156 ± 0.06 | 61.9 ± 40.3 | 382.0 ± 155 | ||||||
| Line C | 466.3 ± 208 | 10.2 ± 0.7 | 165.3 ± 48 | 0.271 ± 0.07 | 77.4 ± 32.0 | 279.0 ± 48 | ||||||
| Line A | 367.8 ± 101 | 12.9 ± 2.0 | 163.0 ± 26 | 0.271 ± 0.06 | 76.2 ± 9.6 | 294.5 ± 100 | ||||||
| Biomass | ||||||||||||
| Line | g plant−1 | |||||||||||
| Line E | 661.1 | a | ||||||||||
| Line D | 654.4 | a | ||||||||||
| Line B | 488.4 | b | ||||||||||
| Line F | 487.8 | b | ||||||||||
| Line C | 466.3 | b | ||||||||||
| Line A | 367.8 | b | ||||||||||
| p value | 0.009 | |||||||||||
Table 3.
Seedling harvest dry weight, Haun stage and tillers plant−1 at harvest comparisons for 21, 28, 35 and 42 days after imbibition amongst lines over six growth room runs.
Table 3.
Seedling harvest dry weight, Haun stage and tillers plant−1 at harvest comparisons for 21, 28, 35 and 42 days after imbibition amongst lines over six growth room runs.
| Harvest Dry Weight (g) | ||||||||
|---|---|---|---|---|---|---|---|---|
| Line | 21 days | 28 days | 35 days | 42 days | ||||
| Line E | 0.080 | a 1 | 0.374 | a | 1.132 | a | 2.455 | a |
| Line C | 0.073 | a | 0.297 | ab | 0.884 | b | 1.992 | a |
| Line F | 0.072 | a | 0.305 | ab | 0.991 | ab | 2.219 | a |
| Line A | 0.064 | a | 0.307 | ab | 0.979 | ab | 2.132 | a |
| Line D | 0.064 | a | 0.249 | b | 1.004 | ab | 2.123 | a |
| Line B | 0.060 | a | 0.267 | b | 0.781 | b | 1.779 | a |
| p value | 0.510 | 0.038 | 0.012 | 0.080 | ||||
| Line | Haun stage on main stem | |||||||
| Line E | 3.27 | a | 4.88 | a | 6.03 | a | 6.95 | ab |
| Line A | 3.18 | ab | 4.60 | ab | 5.93 | a | 7.28 | a |
| Line F | 3.13 | abc | 4.61 | ab | 5.95 | a | 6.92 | ab |
| Line D | 3.05 | abc | 4.30 | c | 5.81 | a | 6.84 | ab |
| Line C | 2.95 | bc | 4.39 | bc | 5.69 | a | 6.74 | b |
| Line B | 2.93 | c | 4.44 | bc | 6.03 | a | 6.78 | b |
| p value | 0.009 | 0.002 | 0.005 | 0.113 | ||||
| Line | Tillers plant−1 | |||||||
| Line E | 2.07 | a | 2.94 | a | 5.11 | ab | 8.66 | a |
| Line F | 1.83 | b | 2.58 | ab | 5.39 | a | 9.71 | a |
| Line A | 1.81 | b | 2.74 | a | 5.43 | a | 9.59 | a |
| Line D | 1.69 | bc | 2.55 | ab | 5.52 | a | 9.80 | a |
| Line C | 1.65 | c | 2.35 | ab | 5.23 | a | 9.44 | a |
| Line B | 1.55 | c | 1.98 | b | 4.01 | b | 8.15 | a |
| p value | 0.001 | 0.013 | 0.002 | 0.442 | ||||
1 means within columns for traits followed by the same letter are not significantly different at p = 0.05 using Tukey–Kramer comparisons.
Table 4.
Leaf blade length (cm) and width at midpoint (mm) for the first six leaves on the main stem for intermediate wheatgrass lines over four growth room runs.
Table 4.
Leaf blade length (cm) and width at midpoint (mm) for the first six leaves on the main stem for intermediate wheatgrass lines over four growth room runs.
| Line | Length 1 | Length 2 | Length 3 | Length 4 | Length 5 | Length 6 |
|---|---|---|---|---|---|---|
| C | 12.67 a 1 | 19.83 a | 24.75 a | 28.09 a | 30.54 ab | 33.58 ab |
| B | 11.49 ab | 19.54 ab | 24.70 ab | 28.15 a | 32.27 a | 35.84 a |
| E | 11.22 b | 18.40 abc | 23.50 abc | 26.21 bc | 28.90 b | 32.10 b |
| D | 11.00 b | 17.72 c | 22.63 c | 25.72 c | 29.56 ab | 33.27 ab |
| A | 10.72 bc | 18.44 abc | 23.14 c | 26.44 ab | 28.56 b | 31.79 b |
| F | 10.54 c | 18.23 bc | 23.37 bc | 26.72 ab | 29.59 ab | 31.23 b |
| p value | 0.001 | 0.019 | 0.001 | 0.002 | 0.001 | 0.004 |
| Line | Width 1 | Width 2 | Width 3 | Width 4 | Width 5 | Width 6 |
| E | 2.02 a | 3.29 a | 5.9 a | 8.6 a | 10.7 a | 11.8 a |
| D | 2.02 a | 3.28 a | 5.8 a | 8.4 a | 9.9 a | 11.1 a |
| C | 2.00 a | 3.28 a | 5.6 a | 8.4 a | 9.7 a | 10.8 a |
| F | 1.99 a | 3.23 ab | 5.9 a | 8.6 a | 10.3 a | 11.4 a |
| A | 1.97 ab | 3.29 a | 6.2 a | 8.8 a | 10.5 a | 11.5 a |
| B | 1.77 b | 2.95 b | 5.7 a | 8.7 a | 10.0 a | 11.6 a |
| p value | 0.003 | 0.020 | 0.101 | 0.629 | 0.287 | 0.238 |
1 means followed by the same letter are not significantly different at p = 0.05 using Tukey–Kramer comparisons.
Table 5.
Linear regression equations of leaf area on the main stem on square root of plant dry weight for six IWG lines including intercept, slope, their standard errors and p values.
Table 5.
Linear regression equations of leaf area on the main stem on square root of plant dry weight for six IWG lines including intercept, slope, their standard errors and p values.
| Line | Intercept | S.E | p Value | Slope | S.E. | p Value |
|---|---|---|---|---|---|---|
| Line A | 0.1159 | 0.0435 | 0.0098 | 0.00151 | 0.000072 | 0.0001 |
| Line B | 0.1735 | 0.0389 | 0.0001 | 0.00125 | 0.000062 | 0.0001 |
| Line C | 0.1168 | 0.0390 | 0.0001 | 0.00135 | 0.000069 | 0.0001 |
| Line D | 0.1800 | 0.0371 | 0.0001 | 0.00128 | 0.000064 | 0.0001 |
| Line E | 0.1127 | 0.0359 | 0.0026 | 0.00157 | 0.000061 | 0.0001 |
| Line F | 0.1128 | 0.0441 | 0.0131 | 0.00155 | 0.000075 | 0.0001 |
Publisher’s Note: MDPI stays neutral with regard to jurisdictional claims in published maps and institutional affiliations. |
© 2022 by the authors. Licensee MDPI, Basel, Switzerland. This article is an open access article distributed under the terms and conditions of the Creative Commons Attribution (CC BY) license (https://creativecommons.org/licenses/by/4.0/).
Share and Cite
MDPI and ACS Style
Cattani, D.J.; Asselin, S.R. Early Plant Development in Intermediate Wheatgrass. Agriculture 2022, 12, 915. https://doi.org/10.3390/agriculture12070915
AMA Style
Cattani DJ, Asselin SR. Early Plant Development in Intermediate Wheatgrass. Agriculture. 2022; 12(7):915. https://doi.org/10.3390/agriculture12070915
Chicago/Turabian StyleCattani, Douglas John, and Sean Robert Asselin. 2022. "Early Plant Development in Intermediate Wheatgrass" Agriculture 12, no. 7: 915. https://doi.org/10.3390/agriculture12070915
Note that from the first issue of 2016, this journal uses article numbers instead of page numbers. See further details here.