Article

Photon Distribution of Sole-Source Lighting Affects the Mineral Nutrient Content of Microgreens

by
Viktorija Vaštakaitė-Kairienė
1,*,
Aušra Brazaitytė
1,
Jurga Miliauskienė
1,
Rūta Sutulienė
1,
Kristina Laužikė
1,
Akvilė Viršilė
1,
Giedrė Samuolienė
1 and
Erik S. Runkle
2,*
1
Lithuanian Research Centre for Agriculture and Forestry, Institute of Horticulture, LT-54333 Babtai, Lithuania
2
Department of Horticulture, Michigan State University, East Lansing, MI 48824, USA
*
Authors to whom correspondence should be addressed.
Agriculture 2022, 12(8), 1086; https://doi.org/10.3390/agriculture12081086
Submission received: 4 July 2022 / Revised: 16 July 2022 / Accepted: 21 July 2022 / Published: 23 July 2022
(This article belongs to the Special Issue Sprouts, Microgreens, and Baby Leaf Vegetables)

Abstract

:
In the study, we cultivated basil, beet, and mustard microgreens under different lighting treatments from light-emitting diodes (LEDs) and evaluated the contents of mineral nutrients. Microgreens grew under blue 447, red 638 and 665, far-red 731 nm LEDs, or the same spectrum but with partial substitution of 638 nm red with green 520 (BRG), yellow 595 (BRY), or orange 622 nm (BRO) LEDs (16 h photoperiod; total photon flux density of 300 μmol m −2 s −1). BRG, BRY, or BRO lighting had distinct effects on mineral contents among the microgreen species. BRG increased the content of mineral nutrients, especially in mustard and beet. In all microgreens, Ca and P were associated with BRG; in beet and mustard, Zn and Mg were associated with BRG; in basil, Zn was associated with BRY and Mg with BRO treatments. A broader photon spectrum increased Fe (up to 2.9–fold), K:Ca, P:Mg, and P:Zn in basil, and Fe:Zn in microgreens. We conclude that the partial replacement of red with green light was the most effective at enhancing the mineral nutrient content of microgreens, although responses varied among the crops studied.

1. Introduction

Mineral nutrients play crucial roles in multiple physiological processes of plants, such as the transport of assimilation products, photosynthesis, metabolism, growth, and development [1,2,3]. Depending on the concentrations required for healthy plant growth and development, the essential minerals are divided into macro- (N, K, Mg, Ca, P, S) and micro-nutrients (Fe, Zn, Cu, B) [4]. Mineral nutrients are absorbed by roots in their ionic forms as either cations or anions [5]. Absorbed minerals interact synergistically or antagonistically when the supply of one nutrient affects the absorption and utilization of other nutrients. The uptake of mineral elements and their interactions in plants are influenced by light, temperature, moisture, pH of the growing media, plant age, and growth rate [6].
Essential nutrients are also required in the human diet [7]. The satisfaction of human dietary requirements with diverse food is a priority to ensure a healthy society [8]. Mineral malnutrition is one of the most critical global challenges to humankind that can be prevented [9]. The growing population of vegetarians and vegans raised plant-based nutrition as a topic of scientific inquiry to reduce the deficiency of essential nutrients in raw-food diets. Efforts to mitigate malnourishment focus on developing biofortification strategies to increase the quantity and quality of nutrients and decrease mineral deficiencies and related adverse disorders [3].
Different horticultural plants can be consumed to receive essential minerals [10]. Recently, leafy vegetables consumed as immature greens have gained popularity. Microgreens are edible seedlings typically with two fully developed cotyledons or a pair of true leaves and are usually harvested 7–14 days after germination [11,12]. Technologically advanced horticulture enables the continuous cultivation of microgreens with variable or without natural daylight [13]. Light is an especially powerful environmental stimulus that impacts many vital physiological processes in plants [14]. Due to this reason, artificial lighting is used in climate-controlled systems, such as greenhouses and indoor farms. The use of light-emitting diodes (LEDs) has increased because of their advantages over traditional lighting fixtures, such as fluorescent and high-intensity discharge [15]. In addition, the technology of LEDs provides the option of selecting specific light wavelengths for photoreceptor absorption to influence plant physiological responses, increasing nutritional attributes, and maintaining quality during postharvest storage [16]. Previous studies indicate that light quality affects many aspects of microgreens, including growth and morphology, color, flavor, and nutritional value under LED lighting [17,18,19,20,21,22,23,24]. Thus, the target management of LED lighting is considered as a tool for biofortification to maximize the uptake of mineral nutrients in microgreens indoors.
Many studies discuss the light effect on mineral element content in plants concerning blue (B), red (R), or their composition. Literature data showed that B light, or the higher percentage in BR lighting, had a positive effect on the accumulation of mostly macro- and micronutrients in Brassicaceae microgreens [22], broccoli microgreens [24], Zn content in mustard [23], K, Mg, and P in buckwheat microgreens [25] and P, K, and Ca contents in parsley microgreens [26]. Some studies reported the contrary effects of green light on mineral nutrients in microgreens. Green light in red-blue lighting decreased its content in broccoli microgreens [25], had no effect on macronutrients in kohlrabi microgreens, and increased their content in mizuna and mustard depending on light intensity [26].
However, there is still a lack of information on how the changes in the lighting spectrum, especially the addition of orange or yellow light, affect the uptake of mineral nutrients in microgreens. Moreover, a plant’s ability to absorb nutrients from the rooting medium can differ among plant species [27,28]. Due to this reason, studies with various microgreens are necessary.
Our study aimed to evaluate the impact of lighting quality from sole-source LED lighting on mineral nutrient content and their ratios in three common microgreens species under controlled-environment conditions. We postulated that, compared to a control photon spectrum of blue, red, and far-red, partial substitutions of red with green, yellow, or orange light would differentially regulate the uptake of mineral nutrients. We also postulated that LED lighting treatments would have distinctly different effects on the absorption of minerals among species due to genetic variation. Thus, the accumulation of macro- and micro-nutrients would vary among microgreens.

2. Materials and Methods

2.1. Chemicals and Standards

Nitric acid (HNO3, 65%) and hydrogen peroxide (H2O2, 30%) were purchased from Sigma Aldrich CHEMIE GmbH (Steinheim, Germany). Multi-element calibration standard (Certipur ICP Multi-element standard solution IV) and single standard solutions of phosphorus and sulfur (Certipur ICP) were purchased from Merck KGaA (Darmstadt, Germany) and were used for inductively coupled plasma optical emission spectrometry (ICP-OES) calibration. Ultrapure deionized water was produced with a PURELAB Flex system (ELGA, Lane End, UK).

2.2. Plant Materials and Growth Conditions

Experiments were performed in closed controlled environment walk-in growth chambers (4 × 6 m) in the phytotron complex at the Institute of Horticulture (IH), Research Centre for Agriculture and Forestry. The microclimate in separate growth chambers was controlled autonomously and independently with the Phytotron Microclimate Control System developed in IH using separate microcontrollers (AL-2-24MR-D, Mitsubishi Electric, Tokyo, Japan). The air temperature was measured with resistance temperature detectors (P-100; OMEGA Engineering Ltd., Norwalk, CT, USA), which were transmitted to the microcontrollers. The relative humidity and CO2 concentration were measured by capacitive sensors (CO2RT(-D); Regin, Sweden) and controlled by additional humidifiers. Data were collected every minute, processed, and stored on the operator panel (E1000, Mitsubishi Electric, Japan).
Three different genotypes of microgreens were used in the experiments: basil (Ocimum basilicum L. ‘Sweet Genovese’), beet (Beta vulgaris L. ‘Bull’s Blood’), and mustard (Brassica juncea L. ‘Red Lion’). Depending on size and weight, 1 to 3 g of seeds (CN Seeds, Pymoor, United Kingdom) were sown on the surface of a peat-based substrate (Profi 1, Durpeta, Šepeta, Lithuania) in a 0.5 L (18 × 11 × 6 cm) plastic pot, which represented one replicate, and covered with a lightweight agro-textile until the seeds started to germinate. Three pots were used under each lighting condition and were randomized daily. The average concentration of the nutrients in the peat substrate was [mg L−1] N, 110 ± 10; P, 22 ± 5; K, 133 ± 15; Ca, 242 ± 20; Mg, 29 ± 5; S, 212 ± 20; Fe, 1,7 ± 0.1; Mn, 0.5 ± 0.03; Cu, 3 ± 0.15; B, 2 ± 0.1; and Zn, 1.6 ± 0.1. The pH (H2O) was 5.5–6.5, and the electrical conductivity (EC) was 0.5–0.7 mS cm−1 (GroLine HI9814, Hanna Instruments, Woonsocket, RI, USA). Seeds were germinated under a 16 h photoperiod (the lighting conditions described in Section 2.3), with day/night temperatures (±SD) of 21/17 ± 2 °C and relative air humidity of 60 ± 5%. Plants were watered when needed, maintaining a similar substrate moisture content. Mustard microgreens were harvested after ten days, and basil and beet microgreens were harvested after 14 days of growth above the substrate surface. The samples of microgreens used for elemental composition analysis were washed with deionized water, dried at 70 °C for 48 h in a drying oven (Venticell 222, BMT Medical Technology s.r.o., Brno—Zábrdovice, Czech Republic), and then stored in 50 mL plastic containers until analysis. The fresh and dry weight of microgreens are presented in Table S1.

2.3. Lighting Treatments

Microgreens were cultivated under custom-made lighting equipment containing separate modules for parallel growth runs under individually controlled illumination conditions [29]. The light-emitting diodes (LEDs) were mounted on a flat aluminum heat sink with reflectors and were arranged to ensure photon flux homogeneity. The surface area under the LED fixture was approximately 0.23 m2. Microgreens were grown under four lighting treatments consisting of blue (B; peak = 447 nm), red (R; peaks = 638 and 665 nm), green (G; peak = 520 nm), yellow (Y, peak = 595 nm), and orange (O; peak = 622 nm) LEDs (Luxeon Star LXHL-LR3C, LXHL-LD3C LXM3-PD01, LXHL-MM1D, LXHL-MLAC, and LXHL-MHAC, respectively; all by Philips Lumileds Co., San Jose, CA, USA), and far-red (FR; peak = 731 nm) (L735-05-AU, Epitex Inc., Kyoto, Japan) LEDs. The basal illumination (control) consisted of B light at 42 μmol m−2 s−1, R (peak = 638 nm) at 104 μmol m−2 s−1, R (peak = 665 nm) at 150 μmol m−2 s−1, and FR at 4 μmol m−2 s−1 (presented as BR). Three treatments substituted 15 μmol m−2 s−1 of R (peak = 638 nm) light with G, Y, or O at 15 μmol m−2 s−1 (BRG, BRY, and BRO, respectively). All lighting treatments delivered the same total photon flux density (TPFD) of 300 μmol m−2 s−1 (Table 1). The photosynthetic photon flux density (PPFD, 400–700 nm) was 296 μmol m−2 s−1, and the daily light integral (DLI) was 17.05 mol m−2 d−1. The photon distributions of all lighting treatments were measured using a portable photometer–radiometer at the pot surface level (RF-100, Sonopan, Białystok, Poland).

2.4. Determination of Mineral Elements Contents

The contents of macro- (K, Ca, Mg, S, P) and micro-nutrients (Fe, Zn, Mn) in microgreens were determined by modified microwave-assisted digestion technique combined with ICP-OES methods described in Araújo et al. [30] and Barbosa et al. [31]. The complete digestion of 0.5 g of powdered plant material was achieved with 5 mL 65% HNO3 and 3 mL 30% H2O2 using a microwave-assisted digestion system (Multiwave GO; Anton Paar GmbH, Graz, Austria), following a two-step heating program: (1) 3 min to 150 °C, then held for 10 min, and (2) 10 min to 180 °C, then held for 10 min, and final cooling. The mineralized samples were diluted to 50 mL with ultrapure deionized water, filtered with Whatman Grade 1 qualitative filter paper, and stored at 4 °C until analysis. The nutrient profile was analyzed by ICP-OES (SPECTRO Genesis spectrometer, Analytical Instruments GmbH, Kleve, Germany). The contents of mineral nutrients (mg L−1) were evaluated according to analytical wavebands of 766.491 nm for K, 445.478 nm for Ca, 279.079 nm for Mg, 257.611 nm for Mn, 259.941 nm for Fe, 213.856 nm for Zn, 213.618 nm for P, and 182.034 nm for S. The following plasma conditions were adopted: 1.3 kW RF power, 1.0 L min−1 auxiliary argon (Ar) flow, 0.50 L min1 nebulizer Ar flow, 12 L min−1 coolant Ar flow, and axial plasma configuration. Each sample was analyzed in triplicate. The calibration standards of mineral nutrients were prepared by diluting an ICP multi-element standard solution (1000 mg L−1) with 6.5% HNO3, and phosphorus and standard sulfur solutions (1000 mg L−1) with ultrapure deionized water (Merck KGaA, Darmstadt, Germany). A separate calibration curve was employed for each mineral nutrient using the blank 6.5% HNO3 solution, except ultrapure deionized water for S and P. Calibration solutions were prepared at the concentrations of 0.01–10 mg L−1 for Zn, Fe, and Mn, and 1.0–400 mg L−1 for K, Ca, Mg, P, and S. The content of each mineral nutrient was recounted as mg g−1 dry matter (DM).

2.5. Statistical Analysis
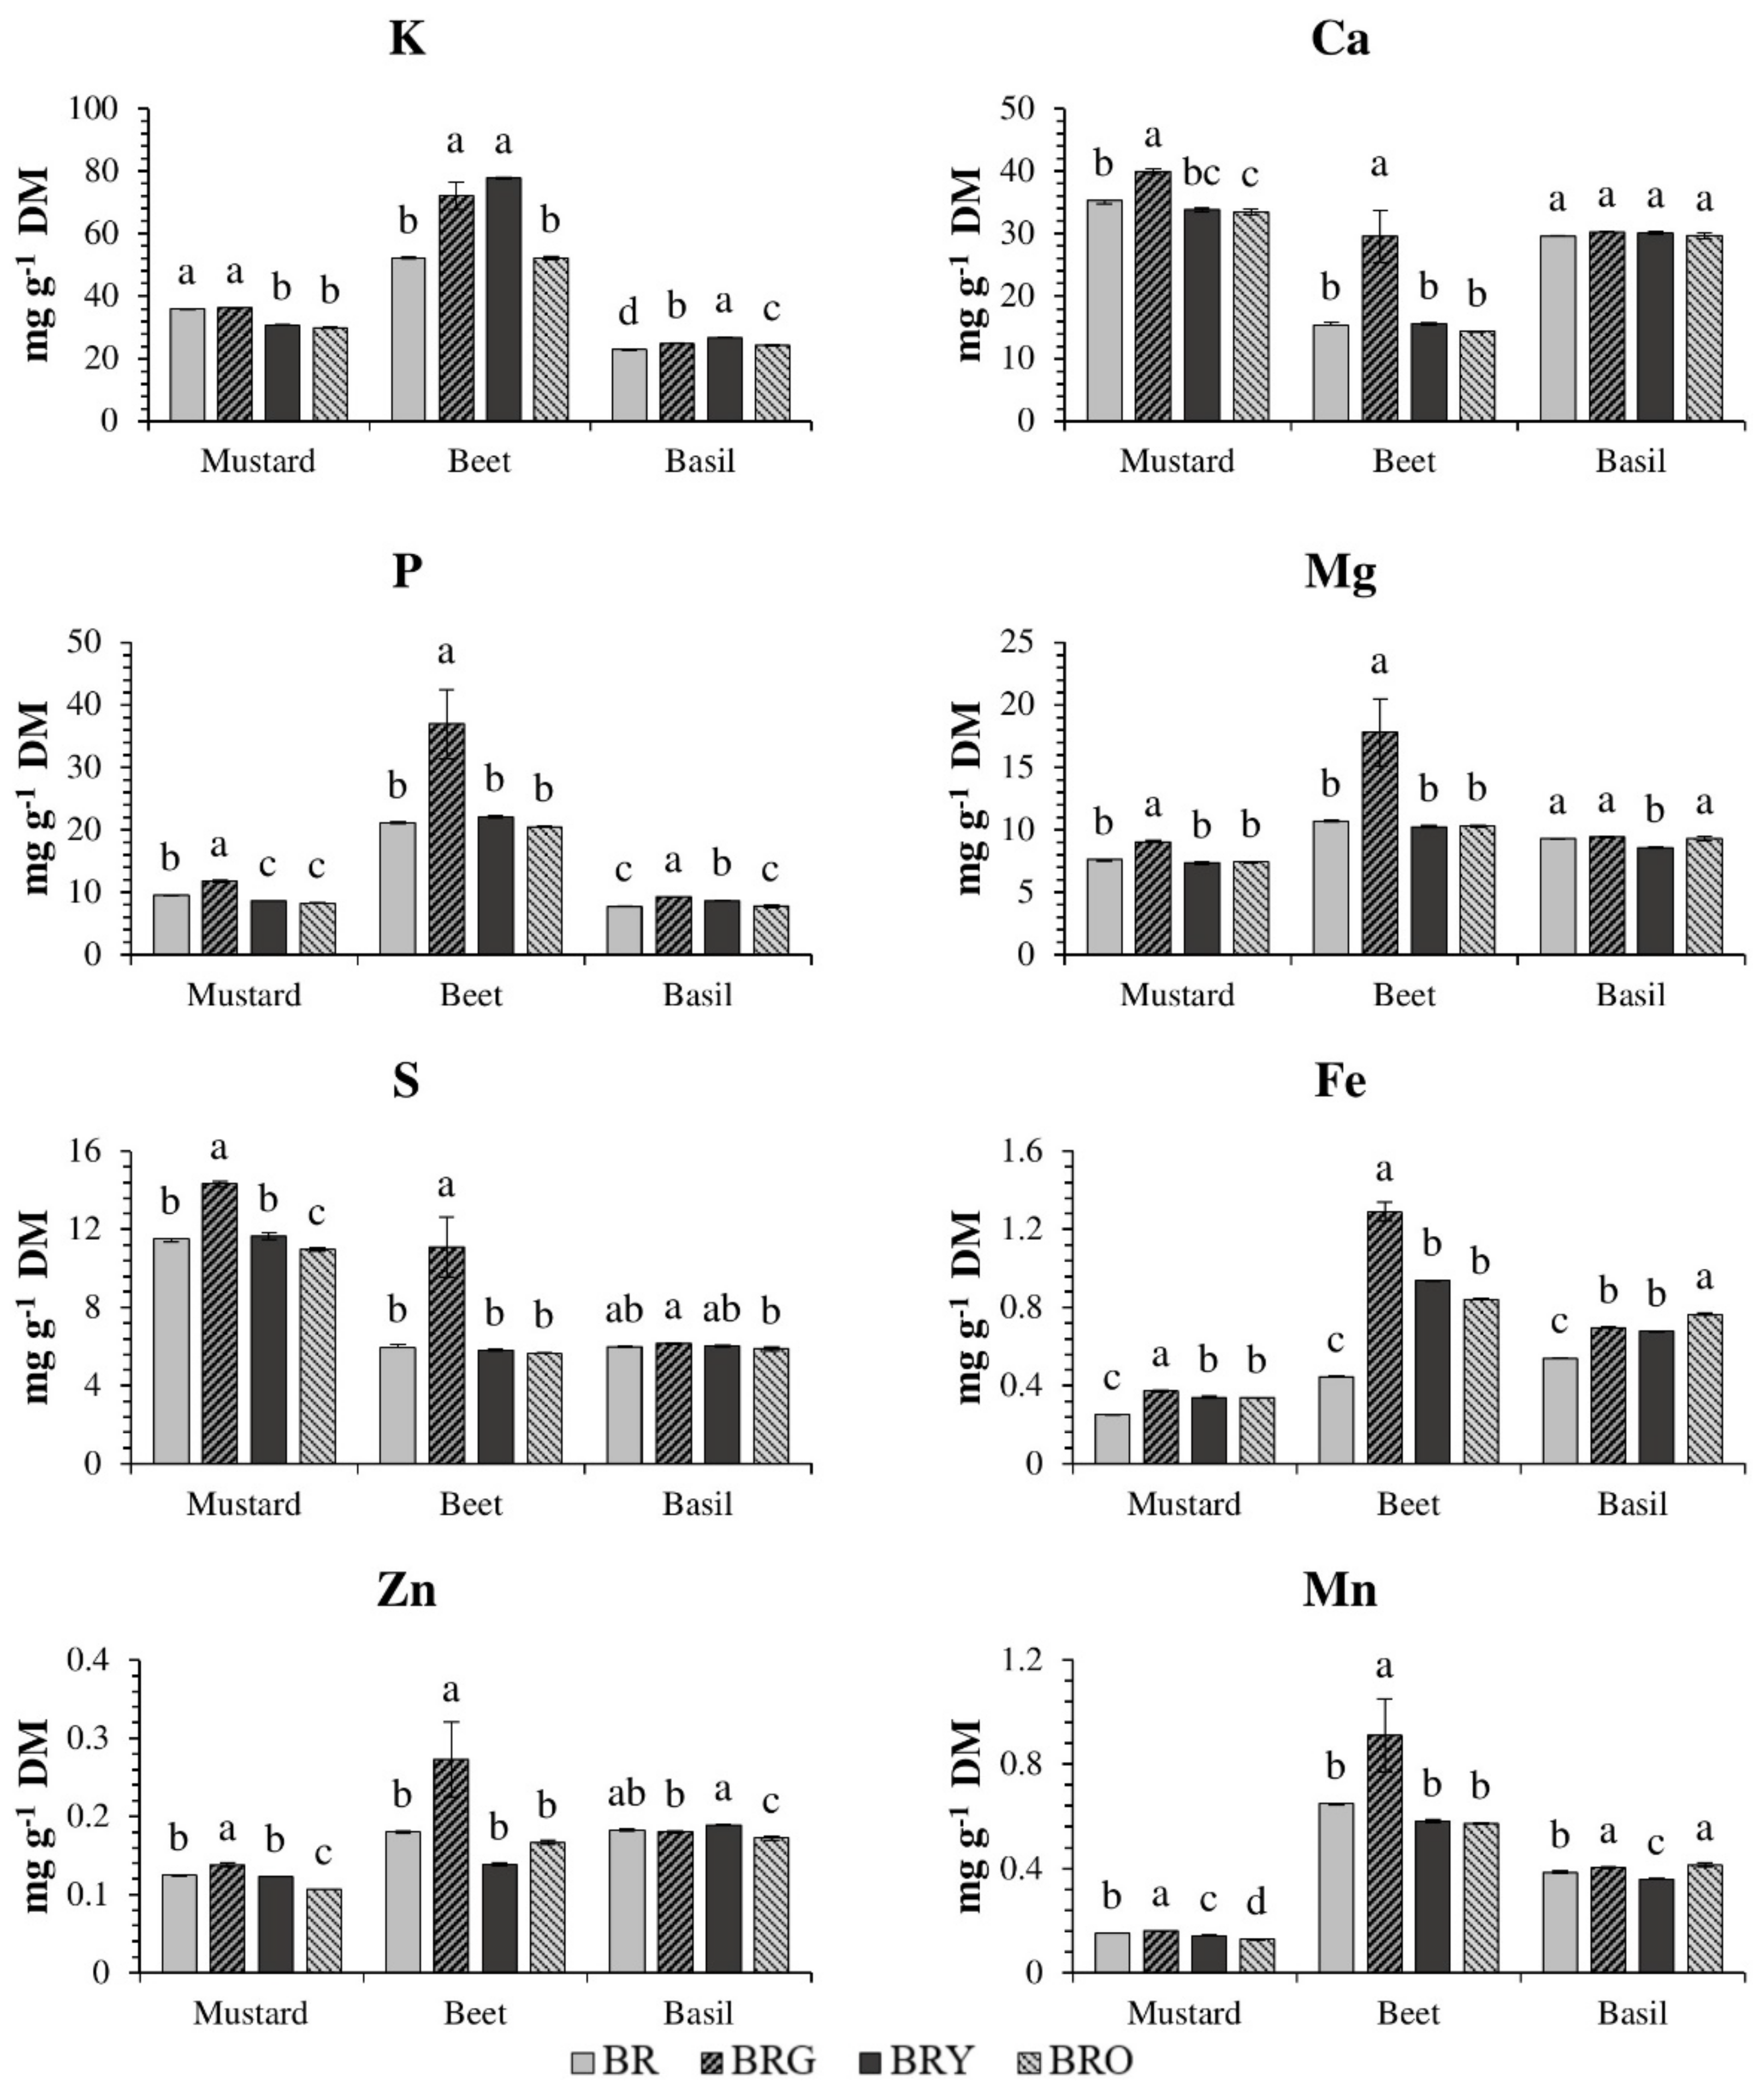
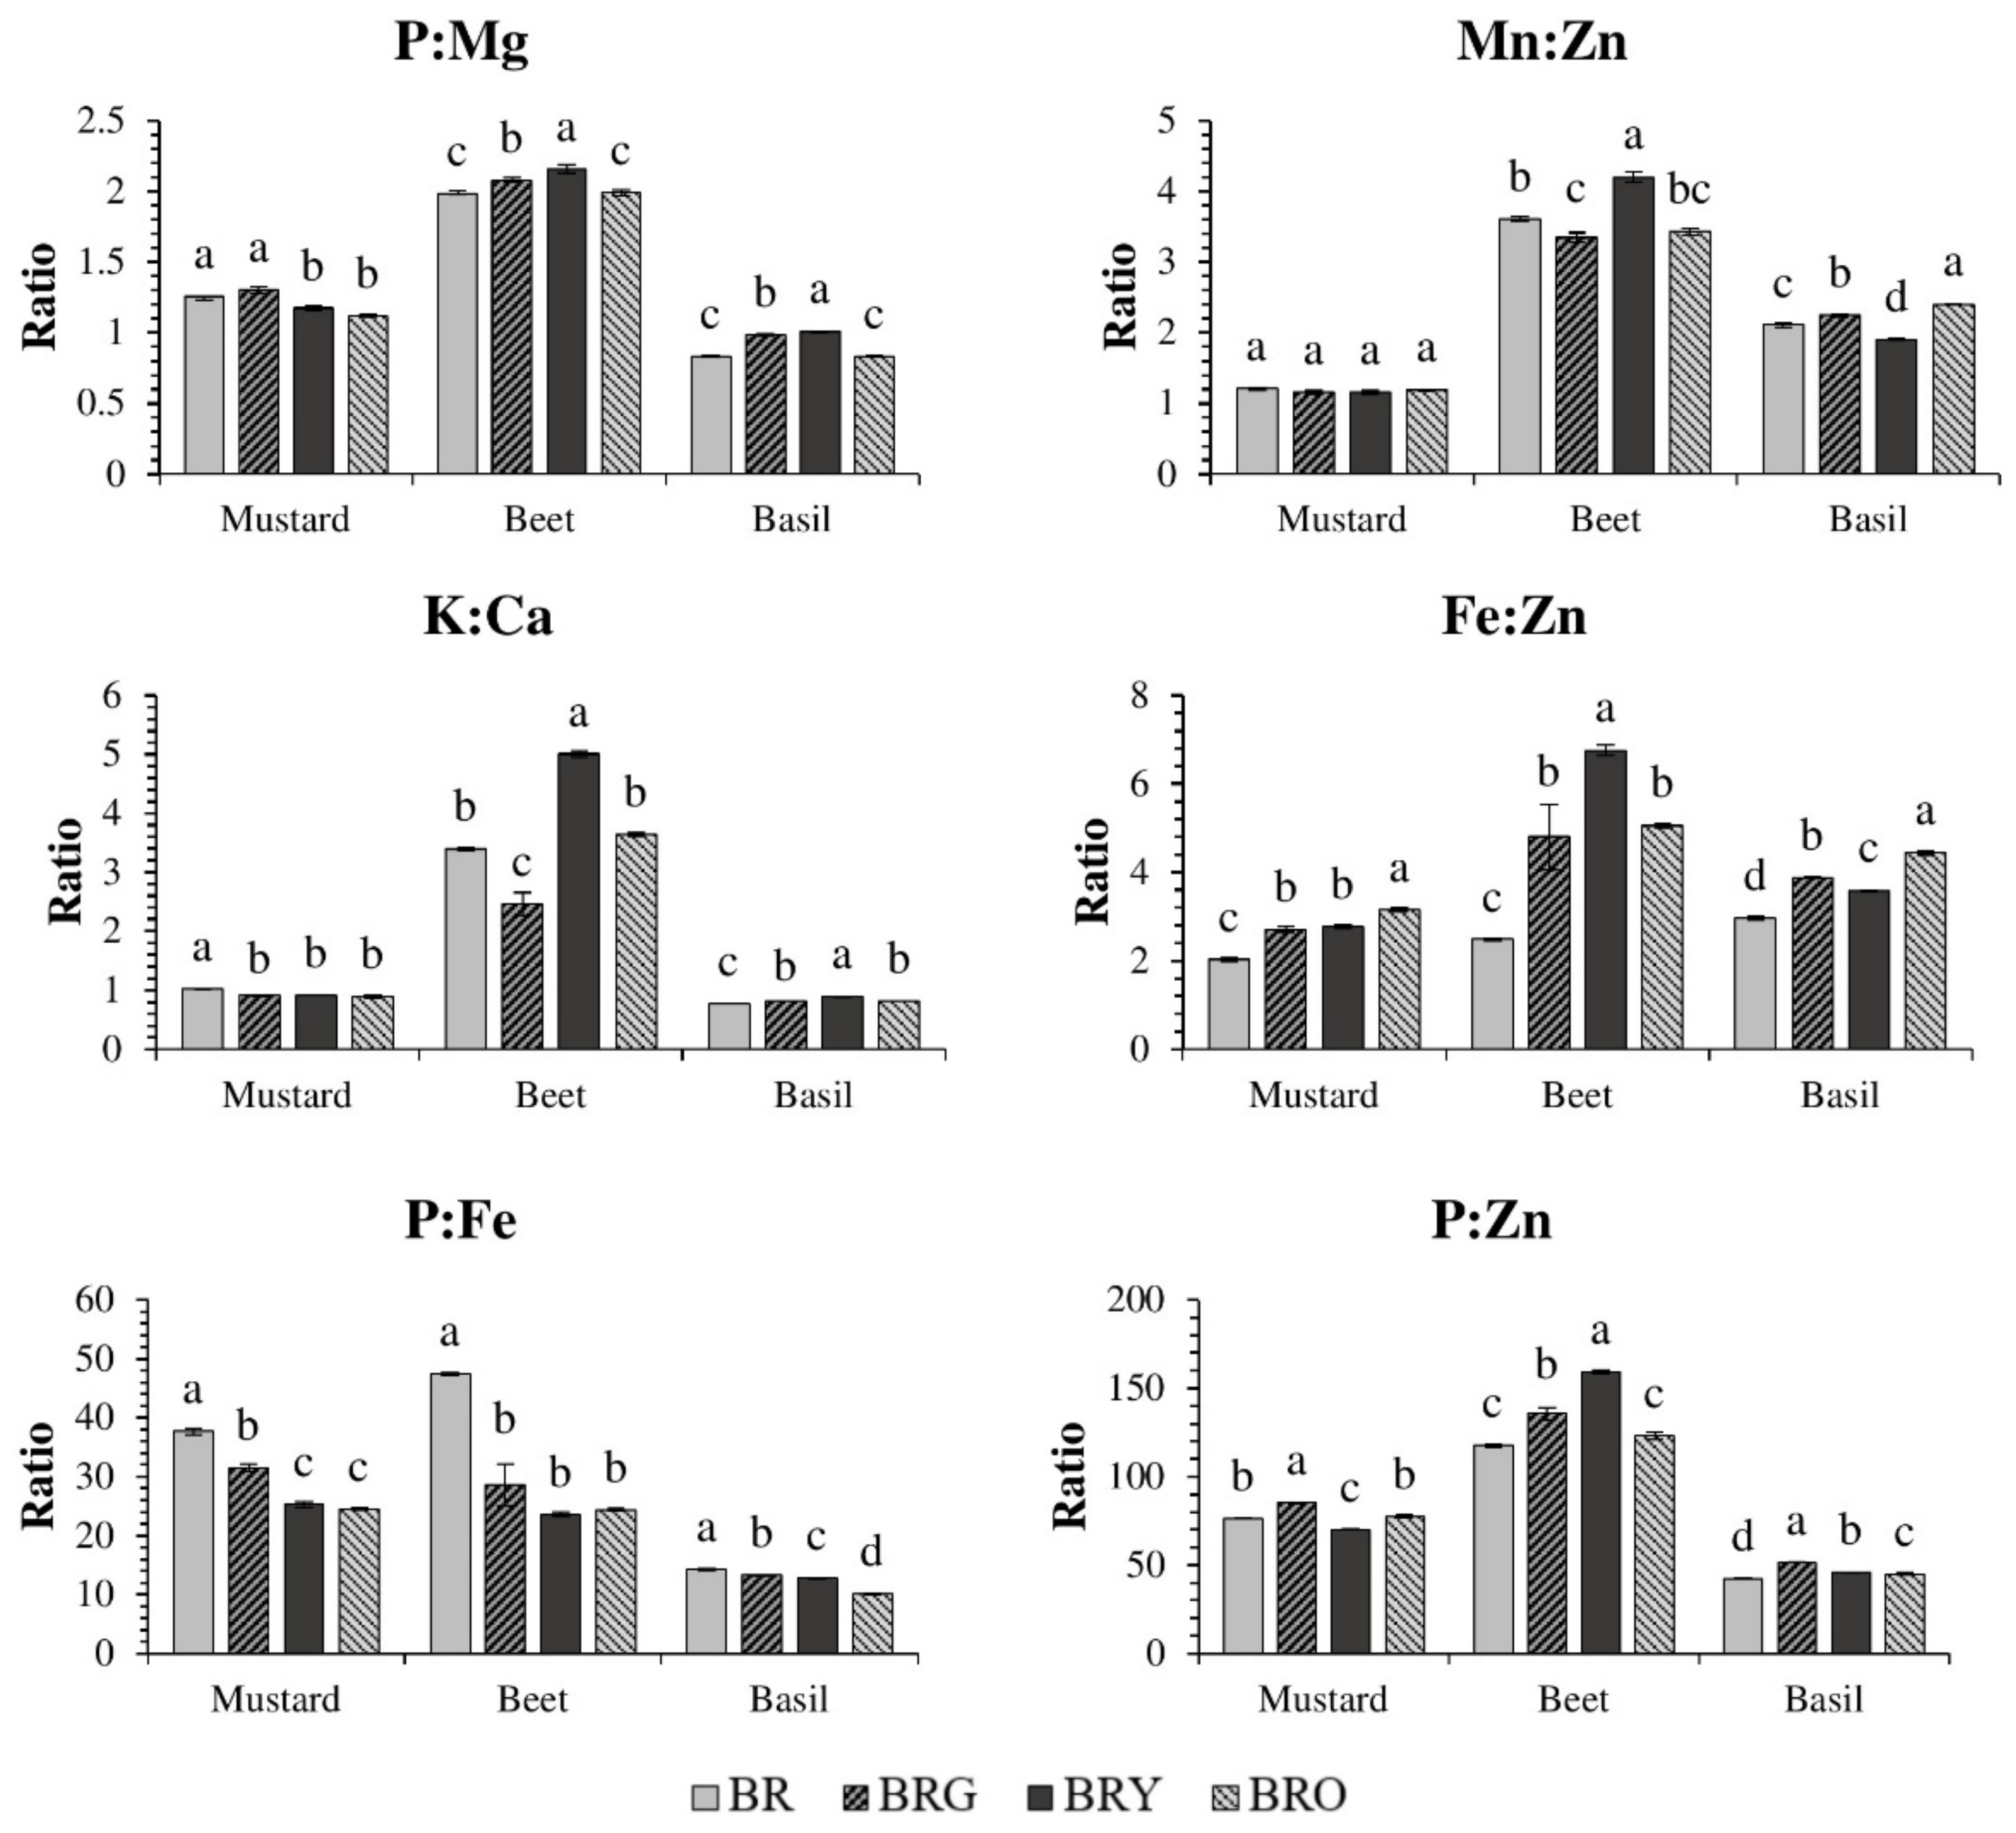
Statistical analysis was performed using Microsoft Excel 2016 and Addinsoft XLSTAT 2019.1 XLSTAT statistical and data analysis solution (Long Island, New York, NY, USA). The data are presented as a mean of three analytical replicates. One-way analysis of variance (ANOVA) followed by Tukey’s honestly significant difference test (p < 0.01) for multiple comparisons were used to evaluate differences between means of mineral nutrient contents in microgreens. The principal component analysis (PCA) was performed at a 99% significance level. The results presented in PCA biplots indicate distinct effects of lighting treatments on levels of minerals and the correlation circles (based on Pearson’s correlation matrix) that summarize relationships between investigated macro- and micro-nutrients in microgreens under the lighting treatments.

3. Results

We determined macro- (K, Ca, Mg, P, and S) and micro-nutrient (Fe, Zn, and Mn) contents and their ratios in microgreens under different lighting treatments from sole-source LED lighting. The three species studied (mustard, beet, and basil) are commonly produced in controlled environments and have notable photophysiological responses to various lighting treatments. The evaluated ratios between mineral nutrients (K:Ca, P:Mg, P:Zn, P:Fe, Fe:Zn, Mn:Zn) are limiting factors for healthy growth and other vital physiological processes in plants. Therefore, the mineral nutrient contents and ratios in microgreens under lighting treatments, in which red was partially substituted with G (treatment BRG), Y (BRY), or O (BRO) lighting, were compared with those under blue, red, and far-red (BR) lighting. These partial waveband substitutions had significant effects on mineral nutrient contents and their ratios; however, results varied among genotypes (Figure 1 and Figure 2).

3.1. Mustard

The most abundant mineral nutrients measured in mustard microgreens were, in descending order, Ca and K, followed by S, P, Mg, Fe, Mn, and Zn. Compared to the BR treatment, BRG increased the content of four of the five macro-nutrients (by 13% to 24%) and all three micro-nutrients (by 6% to 48%). There was no effect on the content of K. Moreover, BRG increased the P:Zn and Fe:Zn ratios (by 1.1- and 1.3-fold), did not affect the P:Mg and Mn:Zn, and decreased the P:Fe and K:Ca (by 0.8- and 0.9-fold). BRY lighting reduced the content of K by 14%, P by 10%, and Mn by 6%, had no effect on Ca, Mg, S, or Zn, but increased the Fe content by 34%. Among calculated nutrient values, the greatest was Fe:Zn, which increased by 1.4-fold. The values of P:Zn, P:Fe and P:Mg were lower (by 0.7- to 0.9-fold), and Mn:Zn was similar to BR lighting. Treatment BRO had similar effects as the BRY treatment; compared with microgreens under BR, those under BRO had lower contents of K, Ca, P, S, Zn, or Mn, a similar content as Mg, and increased content of Fe by 33%. There were also similar trends for ratios between nutrients in mustard under BRY as for BRO, except for P:Zn, which was similar to plants under the BR treatment.

3.2. Beet

In beet microgreens, the most abundant nutrients were, in order, K, P, Ca, Mg, S, Fe, Mn, and Zn. Treatment BRG increased the contents of all investigated macro-nutrients (by 32% to 92%) and Mn by 40%, Zn by 40%, and Fe by about three times. The K:Ca, Mn:Zn, and especially the P:Fe decreased. However, BRG slightly but significantly increased the P:Mg and P:Zn, and the Fe:Zn by nearly two-fold. Treatment BRY increased the accumulation of K (by 49%) and Fe (by two times) but did not affect other investigated nutrients, compared to BR lighting. There were more significant changes to ratios between mineral nutrients. The BRY treatment increased values of P:Mg and Mn:Zn (by 1.1- to 1.2-fold), K:Ca (by 1.5-fold) and Fe:Zn (by 2.7-fold). In contrast, the P:Fe decreased by 0.5-fold compared to plants under the BR treatment. Compared with the BR treatment, the content of Fe was 89% higher under BRO lighting. BRO did not affect most quantified nutrient ratios except Fe:Zn, which increased two-fold, and P:Fe, which decreased 0.5-fold.

3.3. Basil

The highest contents of mineral nutrients in basil microgreens were, in order, Ca, K, Mg, P, S, Fe, Mn, and Zn. Treatment BRG increased the content of K by 9%, P by 20%, Mn by 5%, and Fe by 29% compared to basil under the BR treatment. There were no significant effects on the other minerals. However, there were increases (from 1.1- to 1.3-fold) in the quantified mineral nutrient ratios except for P:Fe, which decreased by 0.9-fold. Treatment BRY increased the content of K by 17%, P by 12%, and Fe by 25% but reduced the contents of Mg and Mn by 5%. The BRY treatment caused similar ratios between minerals as the BRG treatment, except for the Mn:Zn, which decreased by 0.9-fold. The BRO treatment also increased the content of K by 6%, Mn by 8%, and Fe by 42% but decreased the content of Zn by 6%. Treatment BRO increased the K:Ca, P:Zn, Mn:Zn, and Fe:Zn ratios (by 1.1- to 1.5-fold), decreased the P:Fe by 0.7-fold but had no impact on the P:Mg compared to BR lighting.

3.4. Principal Component Analysis

The PCA biplots show relationships between the average content of individual macro- and micro-nutrients of microgreens under BR, BRG, BRO, and BRY lighting treatments (Figure 3). In general, the PCA biplots showed the distinct effects of BRG, BRY, and BRO in mustard, and BRG or BRO in beet and basil, compared to BR treatment. The scree plots of the PCA showed that the first two eigenvalues accounted for most of the variance in the dataset (Figure S1). The PCA factor loadings, scores, and eigenvalues for the first two principal components (F1 and F2) are presented in Table 2. The first two PCAs extracted from the components amounted to 96.21% of the total data variance for mustard, 96.91% for beet, and 78.23% for basil. As observed, F1 explained 78.37% and 84.54% of the total variance for mustard and beet, respectively, while a second factor (F2) was needed to explain most of the variability for basil. In Figure 3, two vectors with an angle <90° show a positive correlation, and two vectors with an angle >90° have a negative correlation. In mustard, there were significant positive correlations between K and Ca, P, Zn, and Mn (Table S1). In addition, there were positive correlations of Ca with Mg, P, S, Zn, and Mn; Mg with P, S, Zn, and Mn; P with S, Zn, and Mn, S with Zn and Mn; and Zn with Mn. There were positive correlations between all mineral nutrients except K with any other nutrient, and Fe with Zn or Mn in beet. There were negative correlations in basil microgreens between K and Mg and between Mn and Zn, and positive relationships between Ca with P or S, Mg with Mn, and P with S.
To evaluate the associations between mineral nutrients and lighting treatments, the PCA biplots were analyzed according to F1 and F2 factor loadings and scores (Table 2; Figure 3). The PCA of mustard indicates that Ca, Mg, P, Zn, and Fe were associated with the BRG treatment, which had a high positive score along with F1 and, except for Fe, a low positive score along with F2. The F1 and F2 scores of BR, BRY, and BRO did not correspond to any mineral nutrient in mustard. In addition, the nutrients K, Zn, and Mg were not associated with any lighting treatment. For beets, the PCA demonstrated that Ca, Mg, P, S, Zn, and Mn were associated with BRG lighting, which had a high positive score along F1 and a low negative score along F2. The PCA observations of basil indicate that Zn is associated with BRY lighting, which had a moderately high positive F1 score and moderate negative F2 score. K, Ca, S, and P correspond to BRG, which had moderate to high positive scores along with F1 and moderate F2 scores. The higher negative F1 and lower positive F2 scores of BRO showed associations with Mg, Mn, and Fe in basil. There were no associations between F1 and F2 scores of the BR treatment with mineral nutrients.

4. Discussion

Microgreens are usually produced in controlled environments where light is the main factor modulating their growth and nutritional quality through metabolic modifications [32]. The main role of light in plant metabolism is to provide energy for photosynthetic processes to synthesize photoassimilates that are used as substrates for all other biosynthetic pathways [33]. The deficiency of mineral nutrients negatively influences the photosynthetic apparatus by disrupting the synthesis of critical components. For example, P deficiency suppresses electron transport to photosystem I (PSI), production of ATP and NADH, and synthesis of nucleic acids and phospholipids [34]; Mg and Fe deficiency inhibits chlorophyll synthesis [35]. K facilitates diffusion of CO2 in chloroplasts [36] and regulates stomatal movement [37].
In this study, relatively small changes to the photon spectrum of sole-source LED lighting differently regulated the absorption of mineral nutrients in microgreens, and contents varied among plant species. In general, BRG, BRY, or BRO lighting treatments had a distinct effect on Fe content in all microgreens, and K in basil, compared to BR lighting. Moreover, a broader photon spectrum increased the K:Ca, P:Mg, P:Zn in basil, and Fe:Zn in all microgreens. However, some increased ratios were above those recommended for plants. For example, the Fe:Zn was higher under BRO than the recommended 4:1 in basil and in beet regardless of lighting treatment [38]. The P:Zn in beet also exceeded the recommended ratio of 100:1 [39] and suggested a Zn deficiency. A strong positive correlation between P and Zn did not indicate that minerals interacted antagonistically in beet microgreens. However, more detailed studies are needed to confirm Zn deficiency.
In the three microgreens studied, the green in a photon spectrum increased macro- and micro-nutrient content, especially P, Fe, and Mn. The results agree with Kopsell et al. [25], who reported that the highest content of K in broccoli (Brassica oleacea var. italica) shoot tissues were under BRG lighting. P, K, and Mg content also increased in beet ‘Bull’s Blood’ microgreens under HPS fixtures with supplemental G light in a greenhouse. However, additional G light decreased the contents of Mn, Fe, and Zn in kohlrabi (Brassica oleracea var. gongylodes ‘Delicacy Purple’) microgreens [40]. Our results contrast with those published by Samuolienė et al. [21], in which Fe, Mg, and Ca content in Brassica microgreens were similar under BRG and BR treatments. Together, these results demonstrate distinct lighting effects among microgreen families and species. Mickens et al. [41] showed that in mature red pak choi (Brassica rapa var. chinensis ‘Rubi F1’) plants under white (W) and G switched to W and R light at 21 days after sowing had lower contents of all the investigated mineral nutrients, except Mg, which did not differ among lighting treatments. In addition, Meng et al. [42] reported that substituting G light for R light did not affect the content of any macro- or micro-nutrients in mature lettuce (Lactuca sativa ‘Rouxai’). These contrasts suggest that the effect of G light might depend on the growth stage.
Extracted and purified chlorophyll a and b maximally absorb R and B light and much less G light. However, chlorophylls exist in conjugation with carotenoids and other non-photosynthetic and non-photoreceptor pigments, anthocyanins and flavonoids, and together absorb G light [43]. Non-photosynthetic photoreceptors allow the sensing of lighting quality and adjust physiological processes accordingly [44]. G light is absorbed by cryptochromes (CRY), which also absorb UV-A radiation and blue light [45]. CRY contains a chromophore-binding photolyase-homologous region (PHR) domain that binds non-covalently to the chromophore flavin adenine dinucleotide (FAD). Chromophore FAD is a two-electron carrier that can exist in three different redox states: oxidized (FAD), semi-reduced (FAD•− or FADH), and fully reduced flavin (FADH2 or FADH). Only the FAD and FAD•− absorb significant amounts of B light (400–500 nm) [46,47]. CRY1 can be reduced to FADH that absorbs G light, and then to fully reduced FADH2 or FADH that poorly absorbs photosynthetic photons [45]. Phototropin (PHO), another group of UV-A/B photoreceptors, mediates the CRY regulation of stomatal opening [48,49,50]. Both CRY and PHO activate guard cell plasma membrane H+–ATPases, resulting in a K+ electrical potential gradient that causes an influx of ions into the membrane [49]. Increases in guard cell volume and turgor pressure widen the stomatal pore [51,52]. Moreover, most guard cells have chloroplasts, and there is a close correlation in photosynthetic efficiency between them and mesophyll cells [53].
Supplemental G light affects plant physiology under conditions where saturated R- and B-light systems [54]. Most research revealed the reverse effect of G on B light-induced stomatal opening [55,56] Frechilla et al. [55] demonstrated that such reversibility is G fluence rate-dependent, and complete reversal occurred when G light was twice that of B. Moreover, an action spectrum revealed that 540 nm G light was the most effective wavelength at reversing B light-stimulated stomatal opening. R light was shifted by 90 nm from a maximum 450 nm peak for B-induced stomatal opening [55]. In addition, G did not inhibit R light-stimulated stomatal opening, indicating that photosynthesis-dependent opening was not reversed by G light. When B light was combined with saturating R, G light reversed only B light-specific stomatal opening. There is evidence that G light stimulates secondary metabolism, such as anthocyanin synthesis [57], which is driven by photoassimilates accumulated through photosynthesis. We speculate that partial substitution of R with G light did not completely reverse B light-induced stomatal opening in microgreens, and mineral nutrient content increased because of the greater production of photosynthates required for secondary metabolism.
Research about the influence of Y light (580–600 nm) on horticultural plants is dated to the 1980s [58]. Dougher and Bugbee [59] reported that there is sparse literature on Y light effects on plants because researchers tend to classify wavelengths from 500 to 600 nm as G light. Y light is not well absorbed by photosynthetic pigments and is a relatively ineffective energy source for driving photosynthesis [60]. Y light (peak = 595 nm) increased plant elongation but decreased leaf area and had relatively low CO2 fixation and net photosynthesis [61]. However, 595 nm light played a highly regulatory role in the abundance and activity of key proteins [62]. Yavari and Lefsrud [63] identified proteins in Arabidopsis regulated by 595 nm light and involved in photosynthesis and metabolic processes related to the abundance of mineral nutrients. For example, they observed a significant increase in photosystem II (PSII) reaction center-associated protein (CP43) expression, which stabilizes the Mn cluster in the primary water-splitting site within the PSII complex. Moreover, 595 nm light increased the expression of enzymes for ATP production (TPI, ENO2) and metabolism of N- and S-containing amino acids (MS1, MS2), or membrane-binding protein (ANN1), which increased the abundance of Ca2+.
In our study, a partial substitution of R with Y light generally increased the content of P and K in basil and beet, but they decreased in mustard microgreens. Moreover, treatment BRY increased the content of Fe in all microgreens. Samuolienė et al. [21] reported that the accumulation of Fe, Mg, and Ca in broccoli and kohlrabi was similar among BR, BRG, and BRY treatments; however, the content of Fe in mizuna microgreens was considerably higher. In another study, pulsed Y light was the most effective at increasing K, P, S, Fe, and Zn accumulation in mustard ‘Red Lion’ microgreens [19].
O light is specified as 600–625 nm [64] but is often considered a part of R light (600–700 nm), and thus, specific effects of O light are rarely published. However, our results indicate that O light can have distinct effects, and further detailed research is needed. In our study, partial substitution of R with O light increased Fe content in all three microgreens studied. Moreover, BRO increased K, Fe, and Mn content in basil. These results agree with Samuolienė et al. [21], who reported that Fe content increased under BRO in Brassica microgreens. However, BRO also enhanced Mg and Ca content compared to BR lighting, which contrasts with our results. This inconsistency could be at least partly attributed to plant species. The metabolic processes in plants are partially determined by their genotype, and photophysiological responses to light between species may occur since they produce specific amounts of photoassimilates, which are affected by mineral nutrient status. In addition, we compared our O light results with studies that investigated the effects of R light. Supplemental pulsed R (peak = 627 nm) light increased uptake of K, P, and Fe in mustard microgreens [19], which is in partial agreement with our results and those of Samuolienė et al. [21]. Compared with a peak wavelength of 640 nm, R light with a peak of 660 nm increased the uptake of N, P, K, Mg, Cu, and Fe in lettuce [65].

5. Conclusions

In this study, we evaluated the effects of different light quality treatments on mineral nutrient uptake in three common species of microgreens. The results indicate that targeted management of the LED lighting spectrum can increase the plant biofortification of essential and nutritive mineral elements in controlled-environment agriculture systems. Although the accumulation of macro- and micro-nutrients and their ratios varied among the three crops studied, the partial replacement of red with green light was the most effective at enhancing the mineral nutrient content of microgreens. However, the absorption of minerals in plants is controlled by lighting quality, intensity, duration, and other environmental factors, and the content can vary among plant parts and with age. Therefore, further research is needed to better understand how growing conditions can be optimized to increase the nutritional value of specialty crops, such as microgreens, in controlled-environment production.

Supplementary Materials

The following supporting information can be downloaded at: https://www.mdpi.com/article/10.3390/agriculture12081086/s1. Figure S1: Scree plot of mustard (A), beet (B), and basil (C) microgreens under radiation treatments. Table S1: Correlation matrix (Pearson (n)) between mineral nutrients in mustard (A), beet (B) and basil (C) microgreens.

Author Contributions

Conceptualization, A.B. and V.V.-K.; methodology, A.B.; software, R.S. and K.L.; validation, A.B., E.S.R. and V.V.-K.; formal analysis, V.V.-K.; investigation, A.B. and V.V.-K.; resources, A.B., G.S. and V.V.-K.; data curation, A.B., V.V.-K., G.S. and A.V.; writing—original draft preparation, V.V.-K.; writing—review and editing, V.V.-K., E.S.R., A.B. and J.M.; visualization, V.V.-K.; supervision, A.B. and E.S.R.; project administration, A.B.; funding acquisition, A.B. All authors have read and agreed to the published version of the manuscript.

Funding

This project has received funding from the Research Council of Lithuania (LMTLT), agreement No. S-MIP-19-2.

Data Availability Statement

Not applicable.

Conflicts of Interest

The authors declare no conflict of interest.

References

  1. Waterland, N.L.; Moon, Y.; Tou, J.C.; Kim, M.J.; Pena-Yewtukhiw, E.M.; Park, S. Mineral content differs among microgreen, baby leaf, and adult stages in three cultivars of kale. HortScience 2017, 52, 566–571. [Google Scholar] [CrossRef] [Green Version]
  2. Marschner, H. Marschner’s Mineral Nutrition of Higher Plants; Academic Press: Cambridge, MA, USA, 2011; ISBN 0123849063. [Google Scholar]
  3. White, P.J.; Broadley, M.R. Biofortifying crops with essential mineral elements. Trends Plant Sci. 2005, 10, 586–593. [Google Scholar] [CrossRef] [PubMed]
  4. Singh, U.M.; Sareen, P.; Sengar, R.S.; Kumar, A. Plant ionomics: A newer approach to study mineral transport and its regulation. Acta Physiol. Plant. 2013, 35, 2641–2653. [Google Scholar] [CrossRef]
  5. Bryson, G.M.; Mills, H.A.; Sasseville, D.N.; Jones, J.B., Jr.; Barker, A. Plant Analysis Handbook III: A Guide to Sampling, Preparation, Analysis, and Interpretation for Agronomic and Horticultural Crops; Micro-Macro Publishing Inc.: Athens, Greece, 2014. [Google Scholar]
  6. Fageria, V.D. Nutrient interactions in crop plants. J. Plant Nutr. 2001, 24, 1269–1290. [Google Scholar] [CrossRef]
  7. Santos, J.; Herrero, M.; Mendiola, J.A.; Oliva-Teles, M.T.; Ibáñez, E.; Delerue-Matos, C.; Oliveira, M. Fresh-cut aromatic herbs: Nutritional quality stability during shelf-life. LWT-Food Sci. Technol. 2014, 59, 101–107. [Google Scholar] [CrossRef]
  8. Weber, C.F. Broccoli microgreens: A mineral-rich crop that can diversify food systems. Front. Nutr. 2017, 4, 7. [Google Scholar] [CrossRef]
  9. Miller, D.D.; Welch, R.M. Food system strategies for preventing micronutrient malnutrition. Food Policy 2013, 42, 115–128. [Google Scholar] [CrossRef] [Green Version]
  10. Desjardins, Y. Fruit and vegetables and health: An overview. In Horticulture: Plants for People and Places; Springer: Berlin/Heidelberg, Germany, 2014; Volume 3, pp. 965–1000. [Google Scholar]
  11. Xiao, Z.; Rausch, S.R.; Luo, Y.; Sun, J.; Yu, L.; Wang, Q.; Chen, P.; Yu, L.; Stommel, J.R. Microgreens of Brassicaceae: Genetic diversity of phytochemical concentrations and antioxidant capacity. LWT 2019, 101, 731–737. [Google Scholar] [CrossRef]
  12. Kyriacou, M.C.; de Pascale, S.; Kyratzis, A.; Rouphael, Y. Microgreens as a component of space life support systems: A cornucopia of functional food. Front. Plant Sci. 2017, 8, 1587. [Google Scholar] [CrossRef]
  13. Benke, K.; Tomkins, B. Future food-production systems: Vertical farming and controlled-environment agriculture. Sustain. Sci. Pract. Policy 2017, 13, 13–26. [Google Scholar] [CrossRef] [Green Version]
  14. Kopsell, D.A.; Sams, C.E.; Morrow, R.C. Blue Wavelengths from Led Lighting Increase Nutritionally Important Metabolites in Specialty Crops. HortScience 2015, 50, 1285–1288. [Google Scholar] [CrossRef] [Green Version]
  15. Mitchell, C.A.; Sheibani, F. LED Advancements for plant-factory artificial lighting. In Plant Factory; Elsevier: Amsterdam, The Netherlands, 2020; pp. 167–184. [Google Scholar]
  16. Massa, G.D.; Kim, H.H.; Wheeler, R.M.; Mitchell, C.A. Plant productivity in response to LED lighting. HortScience 2008, 43, 1951–1956. [Google Scholar] [CrossRef]
  17. Brazaityte, A.; Sakalauskiene, S.; Samuoliene, G.; Jankauskiene, J.; Viršile, A.; Novičkovas, A.; Sirtautas, R.; Miliauskiene, J.; Vaštakaite, V.; Dabašinskas, L.; et al. The effects of LED illumination spectra and intensity on carotenoid content in Brassicaceae microgreens. Food Chem. 2015, 173, 600–606. [Google Scholar] [CrossRef] [PubMed]
  18. Brazaityte, A.; Sakalauskiene, S.; Virsile, A.; Jankauskiene, J.; Samuoliene, G.; Sirtautas, R.; Vastakaite, V.; Miliauskiene, J.; Duchovskis, P.; Novickovas, A.; et al. The Effect of Short-Term Red Lighting on Brassicaceae Microgreens Grown Indoors. Acta Hortic. 2016, 1123, 177–184. [Google Scholar] [CrossRef]
  19. Vaštakaitė-Kairienė, V.; Brazaitytė, A.; Viršilė, A.; Samuolienė, G.; Miliauskienė, J.; Jankauskienė, J.; Duchovskis, P. Pulsed light-emitting diodes for higher contents of mineral elements in mustard microgreens. Acta Hortic. 2020, 1271, 149–154. [Google Scholar] [CrossRef]
  20. Brazaitytė, A.; Viršilė, A.; Samuolienė, G.; Vaštakaitė-Kairienė, V.; Jankauskienė, J.; Miliauskienė, J.; Novičkovas, A.; Duchovskis, P. Response of mustard microgreens to different wavelengths and durations of UV-A LEDs. Front. Plant Sci. 2019, 10, 1–14. [Google Scholar] [CrossRef] [Green Version]
  21. Samuolienė, G.; Brazaitytė, A.; Virsile, A.; Miliauskienė, J.; Vaštakaite-Kairiene, V.; Duchovskis, P. Nutrient levels in Brassicaceae microgreens increase under tailored light-emitting diode spectra. Front. Plant Sci. 2019, 10, 1475. [Google Scholar] [CrossRef] [Green Version]
  22. Kamal, K.Y.; Khodaeiaminjan, M.; El-Tantawy, A.A.; Moneim, D.A.; Salam, A.A.; Ash-Shormillesy, S.M.A.I.; Attia, A.; Ali, M.A.S.; Herranz, R.; El-Esawi, M.A.; et al. Evaluation of growth and nutritional value of brassica microgreens grown under red, blue and green LEDs combinations. Physiol. Plant. 2020, 169, 625–638. [Google Scholar] [CrossRef]
  23. Jones-Baumgardt, C.; Llewellyn, D.; Ying, Q.; Zheng, Y. Intensity of sole-source light-emitting diodes affects growth, yield, and quality of Brassicaceae microgreens. HortScience 2019, 54, 1168–1174. [Google Scholar] [CrossRef] [Green Version]
  24. Zhang, X.; Bian, Z.; Yuan, X.; Chen, X.; Lu, C. A review on the effects of light-emitting diode (LED) light on the nutrients of sprouts and microgreens. Trends Food Sci. Technol. 2020, 99, 203–216. [Google Scholar] [CrossRef]
  25. Kopsell, D.A.; Sams, C.E.; Barickman, T.C.; Morrow, R.C. Sprouting broccoli accumulate higher concentrations of nutritionally important metabolites under narrow-band light-emitting diode lighting. J. Am. Soc. Hortic. Sci. 2014, 139, 469–477. [Google Scholar] [CrossRef]
  26. Gerovac, J.R.; Craver, J.K.; Boldt, J.K.; Lopez, R.G. Light intensity and quality from sole-source light-emitting diodes impact growth, morphology, and nutrient content of brassica microgreens. HortScience 2016, 51, 497–503. [Google Scholar] [CrossRef] [Green Version]
  27. Ghandilyan, A.; Vreugdenhil, D.; Aarts, M.G.M. Progress in the genetic understanding of plant iron and zinc nutrition. Physiol. Plant. 2006, 126, 407–417. [Google Scholar] [CrossRef]
  28. Clark, R.B. Plant genotype differences in the uptake, translocation, accumulation, and use of mineral elements required for plant growth. In Genetic Aspects of Plant Nutrition, Proceedings of the First International Symposium on Genetic Aspects of Plant Nutrition, Organized by the Serbian Academy of Sciences and Arts, Belgrade, Serbia, 30 August–4 September 1982; Sarić, M.R., Loughman, B.C., Eds.; Springer: Dordrecht, The Netherlands, 1983; pp. 49–70. ISBN 978-94-009-6836-3. [Google Scholar]
  29. Tamulaitis, G.; Duchovskis, P.; Bliznikas, Z.; Breive, K.; Ulinskaite, R.; Brazaityte, A.; Novičkovas, A.; Žukauskas, A. High-power light-emitting diode based facility for plant cultivation. J. Phys. D Appl. Phys. 2005, 38, 3182. [Google Scholar] [CrossRef]
  30. Araújo, G.C.L.; Gonzalez, M.H.; Ferreira, A.G.; Nogueira, A.R.A.; Nóbrega, J.A. Effect of acid concentration on closed-vessel microwave-assisted digestion of plant materials. Spectrochim. Acta Part B At. Spectrosc. 2002, 57, 2121–2132. [Google Scholar] [CrossRef]
  31. Barbosa, J.T.P.; Santos, C.M.M.; Peralva, V.N.; Flores, E.M.M.; Korn, M.; Nóbrega, J.A.; Korn, M.G.A. Microwave-assisted diluted acid digestion for trace elements analysis of edible soybean products. Food Chem. 2015, 175, 212–217. [Google Scholar] [CrossRef]
  32. Turner, E.R.; Luo, Y.; Buchanan, R.L. Microgreen nutrition, food safety, and shelf life: A review. J. Food Sci. 2020, 85, 870–882. [Google Scholar] [CrossRef] [Green Version]
  33. Lewis, C.E.; Noctor, G.; Causton, D.; Foyer, C.H. Regulation of assimilate partitioning in leaves. Funct. Plant Biol. 2000, 27, 507–519. [Google Scholar] [CrossRef]
  34. Carstensen, A.; Herdean, A.; Schmidt, S.B.; Sharma, A.; Spetea, C.; Pribil, M.; Husted, S. The impacts of phosphorus deficiency on the photosynthetic electron transport chain. Plant Physiol. 2018, 177, 271–284. [Google Scholar] [CrossRef] [Green Version]
  35. Steccanella, V.; Hansson, M.; Jensen, P.E. Linking chlorophyll biosynthesis to a dynamic plastoquinone pool. Plant Physiol. Biochem. 2015, 97, 207–216. [Google Scholar] [CrossRef] [Green Version]
  36. Jákli, B.; Tavakol, E.; Tränkner, M.; Senbayram, M.; Dittert, K. Quantitative limitations to photosynthesis in K deficient sunflower and their implications on water-use efficiency. J. Plant Physiol 2017, 209, 20–30. [Google Scholar] [CrossRef] [PubMed]
  37. Fischer, R.A. Stomatal opening: Role of potassium uptake by guard cells. Science 1968, 160, 784–785. [Google Scholar] [CrossRef] [PubMed]
  38. Linder, S. Foliar analysis for detecting and correcting nutrient imbalances in Norway spruce. Ecol. Bull. 1995, 44, 178–190. [Google Scholar]
  39. Camberato, J.; Maloney, S. Zinc Deficiency in Corn. Soil Fertil. Update 2012, 580. [Google Scholar]
  40. Brazaitytė, A.; Vaštakaitė, V.; Viršilė, A.; Jankauskienė, J.; Samuolienė, G.; Sakalauskienė, S.; Novičkovas, A.; Miliauskienė, J.; Duchovskis, P. Changes in mineral element content of microgreens cultivated under different lighting conditions in a greenhouse. Acta Hortic. 2018, 1227, 507–516. [Google Scholar] [CrossRef]
  41. Mickens, M.A.; Torralba, M.; Robinson, S.A.; Spencer, L.E.; Romeyn, M.W.; Massa, G.D.; Wheeler, R.M. Growth of red Pak choi under red and blue, supplemented white, and artificial sunlight provided by LEDs. Sci. Hortic. 2019, 245, 200–209. [Google Scholar] [CrossRef]
  42. Meng, Q.; Boldt, J.; Runkle, E.S. Blue radiation interacts with green radiation to influence growth and predominantly controls quality attributes of lettuce. J. Am. Soc. Hortic. Sci. 2020, 1, 1–13. [Google Scholar] [CrossRef] [Green Version]
  43. Smith, H.L.; McAusland, L.; Murchie, E.H. Don’t ignore the green light: Exploring diverse roles in plant processes. J. Exp. Bot. 2017, 68, 2099–2110. [Google Scholar] [CrossRef] [Green Version]
  44. Mawphlang, O.I.L.; Kharshiing, E.V. Photoreceptor mediated plant growth responses: Implications for photoreceptor engineering toward improved performance in crops. Front. Plant Sci. 2017, 8, 1–14. [Google Scholar] [CrossRef]
  45. Bouly, J.-P.; Schleicher, E.; Dionisio-Sese, M.; Vandenbussche, F.; van der Straeten, D.; Bakrim, N.; Meier, S.; Batschauer, A.; Galland, P.; Bittl, R.; et al. Cryptochrome blue light photoreceptors are activated through interconversion of flavin redox states. J. Biol. Chem. 2007, 282, 9383–9391. [Google Scholar] [CrossRef] [Green Version]
  46. Lin, C.; Ahmad, M.; Gordon, D.; Cashmore, A.R. Expression of an Arabidopsis cryptochrome gene in transgenic tobacco results in hypersensitivity to blue, UV-A, and green light. Proc. Natl. Acad. Sci. USA 1995, 92, 8423–8427. [Google Scholar] [CrossRef] [Green Version]
  47. Liu, H.; Liu, B.; Zhao, C.; Pepper, M.; Lin, C. The action mechanisms of plant cryptochromes. Trends Plant Sci. 2011, 16, 684–691. [Google Scholar] [CrossRef] [PubMed] [Green Version]
  48. Kinoshita, T.; Doi, M.; Suetsugu, N.; Kagawa, T.; Wada, M.; Shimazaki, K. Phot1 and Phot2 mediate blue light regulation of stomatal opening. Nature 2001, 414, 656–660. [Google Scholar] [CrossRef] [PubMed]
  49. Mao, J.; Zhang, Y.-C.; Sang, Y.; Li, Q.-H.; Yang, H.-Q. A role for Arabidopsis cryptochromes and COP1 in the regulation of stomatal opening. Proc. Natl. Acad. Sci. USA 2005, 102, 12270–12275. [Google Scholar] [CrossRef] [PubMed] [Green Version]
  50. Kang, C.-Y.; Lian, H.-L.; Wang, F.-F.; Huang, J.-R.; Yang, H.-Q. Cryptochromes, phytochromes, and COP1 regulate light-controlled stomatal development in Arabidopsis. Plant Cell 2009, 21, 2624–2641. [Google Scholar] [CrossRef] [PubMed] [Green Version]
  51. Franks, P.J.; Farquhar, G.D. The mechanical diversity of stomata and its significance in gas-exchange control. Plant Physiol. 2007, 143, 78–87. [Google Scholar] [CrossRef] [Green Version]
  52. Shimazaki, K.; Doi, M.; Assmann, S.M.; Kinoshita, T. Light regulation of stomatal movement. Annu Rev. Plant Biol. 2007, 58, 219–247. [Google Scholar] [CrossRef] [Green Version]
  53. Matthews, J.S.A.; Vialet-Chabrand, S.; Lawson, T. Role of blue and red light in stomatal dynamic behaviour. J. Exp. Bot. 2020, 71, 2253–2269. [Google Scholar] [CrossRef]
  54. Folta, K.M.; Maruhnich, S.A. Green light: A signal to slow down or stop. J. Exp. Bot. 2007, 58, 3099–3111. [Google Scholar] [CrossRef]
  55. Frechilla, S.; Talbott, L.D.; Bogomolni, R.A.; Zeiger, E. Reversal of blue light-stimulated stomatal opening by green light. Plant Cell Physiol. 2000, 41, 171–176. [Google Scholar] [CrossRef] [Green Version]
  56. Talbott, L.D.; Nikolova, G.; Ortiz, A.; Shmayevich, I.; Zeiger, E. Green light reversal of blue-light-stimulated stomatal opening is found in a diversity of plant species. Am. J. Bot. 2002, 89, 366–368. [Google Scholar] [CrossRef] [PubMed] [Green Version]
  57. Johkan, M.; Shoji, K.; Goto, F.; Hashida, S.-N.; Yoshihara, T. Blue light-emitting diode light irradiation of seedlings improves seedling quality and growth after transplanting in red leaf lettuce. HortScience 2010, 45, 1809–1814. [Google Scholar] [CrossRef] [Green Version]
  58. Mortensen, L.M.; Strømme, E. Effects of light quality on some greenhouse crops. Sci. Hortic. 1987, 33, 27–36. [Google Scholar] [CrossRef]
  59. Dougher, T.A.O.; Bugbee, B. Evidence for yellow light suppression of lettuce growth. Photochem. Photobiol. 2001, 73, 208–212. [Google Scholar] [CrossRef]
  60. Wang, D.; Hayashi, Y.; Enoki, T.; Nakahara, K.; Arita, T.; Higashi, Y.; Kuno, Y.; Terazawa, T.; Namihira, T. Influence of pulsed electric fields on photosynthesis in light/dark-acclimated lettuce. Agronomy 2022, 12, 173. [Google Scholar] [CrossRef]
  61. Wang, H.; Gu, M.; Cui, J.; Shi, K.; Zhou, Y.; Yu, J. Effects of light quality on CO2 assimilation, chlorophyll-fluorescence quenching, expression of calvin cycle genes and carbohydrate accumulation in Cucumis sativus. J. Photochem. Photobiol. B Biol. 2009, 96, 30–37. [Google Scholar] [CrossRef]
  62. Yu, W.; Liu, Y.; Song, L.; Jacobs, D.F.; Du, X.; Ying, Y.; Shao, Q.; Wu, J. Effect of differential light quality on morphology, photosynthesis, and antioxidant enzyme activity in Camptotheca acuminata seedlings. J. Plant Growth Regul. 2017, 36, 148–160. [Google Scholar] [CrossRef]
  63. Yavari, N.; Lefsrud, M.G. Proteomic analysis provides insights into Arabidopsis thaliana response under narrow-wavelength LED of 595 nm light. J. Proteom. Bioinform. 2019, 12, 507. [Google Scholar] [CrossRef] [Green Version]
  64. Schubert, E.F.; Gessmann, T.; Kim, J.K. Light emitting diodes. In Kirk-Othmer Encyclopedia of Chemical Technology; John Wiley & Sons: Hoboken, NJ, USA, 2005. [Google Scholar] [CrossRef]
  65. Pinho, P.; Jokinen, K.; Halonen, L. The influence of the LED light spectrum on the growth and nutrient uptake of hydroponically grown lettuce. Lighting Res. Technol. 2017, 49, 866–881. [Google Scholar] [CrossRef]
Figure 1. Content of macro-nutrients potassium (K), calcium (Ca), magnesium (Mg), phosphorus (P), and sulfur (S), and micro-nutrients iron (Fe), zinc (Zn), and manganese (Mn) in mustard, beet, and basil microgreens. BR—blue (peak = 447 nm), red (peak = 638 and 665 nm), far-red (peak = 731 nm); BRG—BR with green (peak = 520 nm); BRY—BR with yellow (peak = 595 nm); BRO—BR with orange (peak = 622 nm). Total PFD was maintained at 300 μmol m−1 s−2, changing the input of red (peak = 638 nm). Means with different letters are significantly different at the p < 0.01 level by Tukey’s honestly significant difference test. Error bars show SD. Different letters represent different significance.
Agriculture 12 01086 g001
Figure 2. Ratios between mineral nutrients in mustard, beet, and basil microgreens. BR—blue (peak = 447 nm), red (peak = 638 and 665 nm), far-red (peak = 731 nm); BRG—BR with green (peak = 520 nm); BRY—BR with yellow (peak = 595 nm); BRO—BR with orange (peak = 622 nm). Total PFD was maintained at 300 μmol m−1 s−2, changing the input of red (peak = 638 nm). Means with different letters are significantly different at the p < 0.01 level by Tukey’s honestly significant difference test. Error bars show SD.
Agriculture 12 01086 g002
Figure 3. The PCA biplots, indicating distinct differences in mineral elements in mustard (A), beet (B), and basil (C) microgreens. BR—blue (peak = 447 nm), red (peaks = 638 and 665 nm), far-red (peak = 731 nm); BRG—BR with green (peak = 520 nm); BRY—BR with yellow (peak = 595 nm); BRO—BR with orange (peak = 622 nm).
Agriculture 12 01086 g003
Table 1. Photon distribution of sole-source lighting for four lighting treatments used in experiments.
Lighting TreatmentBlue, 447 nmRed, 638 nmRed,
665 nm
Far-Red, 731 nmGreen,
520 nm
Yellow,
595 nm
Orange,
622 nm
TPFD
Photon Flux Density (μmol m−2 s−1)
BR421041504300
BRG4289150415
BRY4289150415
BRO4289150415
BR—blue (peak = 447 nm), red (peaks = 638 and 665 nm), far-red (peak = 731 nm); BRG—BR with green (peak = 520 nm); BRY—BR with yellow (peak = 595 nm); BRO—BR with orange (peak = 622 nm); TPFD: total photon flux density (in μmol m−2 s−1). Wavelength for each color represents the peak for each LED type.
Table 2. Factor loadings, eigenvalue, variability (%), cumulative variability (%) and score for the first two principal (F1–F2) components for mineral nutrients in microgreens under different lighting treatments.
MustardBeetBasil
FactorsF1F2F1F2F1F2
Eigenvalue6.2691.4276.6831.0693.8822.376
Variability (%)78.36817.84383.54313.36948.52429.705
Cumulative variability (%)96.21296.91278.229
Factor Loadings
K0.829−0.5390.5200.8160.8430.066
Ca0.9760.0810.997−0.0480.7750.540
Mg0.9490.2300.993−0.117−0.6380.628
P0.9920.0160.999−0.0170.7530.575
S0.9610.2640.995−0.0850.6460.549
Fe0.3280.9390.7970.464−0.0100.595
Zn0.936−0.1370.935−0.3520.839−0.428
Mn0.914−0.3290.968−0.205−0.6890.719
Factor Score
BR−0.027−2.044−1.561−1.182−1.246−1.470
BRG4.0090.7274.251−0.0800.8322.118
BRY−1.2780.417−1.0701.6352.704−1.180
BRO−2.7050.901−1.620−0.373−2.2900.532
BR—blue (peak = 447 nm), red (peaks = 638 and 665 nm), far-red (peak = 731 nm); BRG—BR with green (peak = 520 nm); BRY—BR with yellow (peak = 595 nm); BRO—BR with orange (peak = 622 nm).
Publisher’s Note: MDPI stays neutral with regard to jurisdictional claims in published maps and institutional affiliations.

