
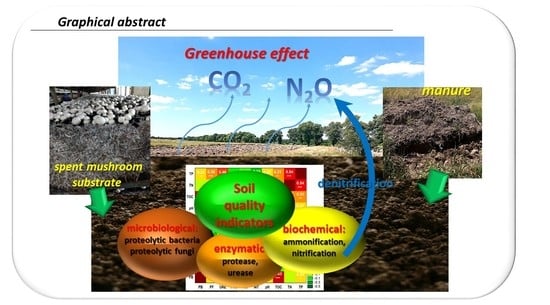
Assessment of the Effects of Soil Fertilization with Spent Mushroom Substrate in the Context of Microbial Nitrogen Transformations and the Potential Risk of Exacerbating the Greenhouse Effect


Abstract
:
1. Introduction
2. Materials and Methods
2.1. Research Area and Characteristics of Experimental Plots
- −
- Soil without fertilizing, control (C);
- −
- Soil + spent mushroom substrate (SMS);
- −
- Soil + spent mushroom substrate + N1P1K1 (SMS + N1P1K1);
- −
- Soil + spent mushroom substrate + N2P2K2 (SMS + N2P2K2);
- −
- Soil + manure (M).
2.2. Meteorological Conditions
2.3. Soil Sampling
2.4. Chemical Analyses
2.5. Microbiological Analyses
2.6. Enzymatic Analyses
2.7. Biochemical Analyses
2.8. Statistical Analysis
3. Results
3.1. Abundance of Microorganisms
3.2. Enzymatic Activity
3.3. Biochemical Activity
4. Discussion
4.1. Abundance of Microorganisms
4.2. Enzymatic Activity
4.3. Biochemical Activity
5. Conclusions
Author Contributions
Funding
Institutional Review Board Statement
Informed Consent Statement
Data Availability Statement
Conflicts of Interest
References
- Lehmann, J.; Bossio, D.A.; Kögel-Knabner, I.; Rillig, M.C. The concept and future prospects of soil health. Nat. Rev. Earth Environ. 2020, 1, 544–553. [Google Scholar] [CrossRef] [PubMed]
- Trasar-Cepeda, C.; Sotres, F.G.; Bello, D. Use of enzyme activities to monitor pollution of agricultural land. EQA—Int. J. Environ. Qual. 2016, 22, 15–24. [Google Scholar] [CrossRef]
- Santorufo, L.; Memoli, V.; Panico, S.C.; Esposito, F.; Vitale, L.; Di Natale, G.; Trifuoggi, M.; Barile, R.; De Marco, A.; Maisto, G. Impact of Anthropic activities on soil quality under different land uses. Int. J. Environ. Res. Public Health 2021, 18, 8423. [Google Scholar] [CrossRef] [PubMed]
- Rutkowska, A.; Pikuła, D. Effect of crop rotation and nitrogen fertilization on the quality and quantity of soil organic matter. In Soil Processes and Current Trends in Quality: Assessment; Hernandez Soriano, M.C., Ed.; Intech Open: London, UK, 2013; pp. 249–267. ISBN 978-953-51-1029-3. [Google Scholar] [CrossRef]
- Komatsuzaki, M.; Ohta, H. Soil management practices for sustainable agroecosystems. Sustain. Sci. 2007, 2, 103–120. [Google Scholar] [CrossRef]
- Osman, K.T. Management of soil problems. In Sandy Soils; Osman, K.T., Ed.; Springer International Publishing: Cham, Switzerland, 2018; pp. 37–65. ISBN 978-3-319-75525-0. [Google Scholar] [CrossRef]
- Peake, L.R.; Reid, B.J.; Tang, X. Quantifying the influence of biochar on the physical and hydrological properties of dissimilar soils. Geoderma 2014, 235, 182–190. [Google Scholar] [CrossRef]
- Usowicz, B.; Lipiec, J. Spatial variability of saturated hydraulic conductivity and its links with other soil properties at the regional scale. Sci. Rep. 2021, 11, 8293. [Google Scholar] [CrossRef]
- Yost, J.L.; Hartemink, A.E. Chapter Four—Soil organic carbon in sandy soils: A review. In Advances in Agronomy, 1st ed.; Sparks, D.L., Ed.; Academic Press: Newark, DE, USA, 2019; Volume 158, pp. 217–230. [Google Scholar]
- Zhou, H.; Fang, H.; Zhang, Q.; Wang, Q.; Chen, C.; Mooney, S.J.; Peng, X.; Du, Z. Biochar enhances soil hydraulic function but not soil aggregation in a sandy loam. Eur. J. Soil Sci. 2019, 70, 291–300. [Google Scholar] [CrossRef]
- Gonet, S. Protection of organic matter resources. In The Role of Organic Matter in the Environment; Markiewicz, M., Ed.; PTSH: Wrocław, Poland, 2007; pp. 7–29. [Google Scholar]
- Wiśniewska-Kadżajan, B. Assessment of usefulness of the substrate after mushrooms growing to plant fertilization. Environ. Prot. Nat. Resour. 2012, 54, 165–176. [Google Scholar]
- Cele, E.N.; Maboeta, M. Response of soil enzyme activities to synergistic effects of biosolids and plants in iron ore mine soils. Int. J. Environ. Sci. Technol. 2016, 13, 2117–2126. [Google Scholar] [CrossRef] [Green Version]
- Frąc, M.; Pertile, G.; Panek, J.; Gryta, A.; Oszust, K.; Lipiec, J.; Usowicz, B. Mycobiome composition and diversity under the long-term application of spent mushroom substrate and chicken manure. Agronomy 2021, 11, 410. [Google Scholar] [CrossRef]
- Lipiec, J.; Usowicz, B.; Kłopotek, J.; Turski, M.; Frąc, M. Effects of Application of Recycled Chicken Manure and Spent Mushroom Substrate on Organic Matter, Acidity, and Hydraulic Properties of Sandy Soils. Materials 2021, 14, 4036. [Google Scholar] [CrossRef] [PubMed]
- Medina, E.; Paredes, C.; Bustamante, M.A.; Moral, R.; Moreno-Caselles, J. Relationships between soil physico-chemical, chemical and biological properties in a soil amended with spent mushroom substrate. Geoderma 2012, 173, 152–161. [Google Scholar] [CrossRef]
- Nicolas, C.; Hernandez, T.; Garcia, C. Organic amendments as strategy to increase organic matter in particle-size fractions of a semi-arid soil. Appl. Soil Ecol. 2012, 57, 50–58. [Google Scholar] [CrossRef]
- Owaid, M.N.; Abed, I.A.; Al-Saeedi, S.S.S. Applicable properties of the bio-fertilizer spent mushroom substrate in organic systems as a byproduct from the cultivation of Pleurotus spp. Inform. Process. Agric. 2017, 4, 78–82. [Google Scholar] [CrossRef]
- Zaborowska, M.; Kucharski, J.; Wyszkowska, J. Biological activity of soil contaminated with cobalt, tin and molybdenum. Environ. Monit. Assess. 2016, 188, 398. [Google Scholar] [CrossRef] [Green Version]
- Gapiński, M. Mushroom compost. Mushroom Producer’s Bulletin. Mushroom. Pub. Hortpress 1996, 3, 22–25. [Google Scholar]
- Catal, S.; Peksen, A. Physical, chemical and biological properties of spent mushroom substrates of different mushroom species. Acta Hortic. 2020, 1287, 353–360. [Google Scholar] [CrossRef]
- Kadiri, M.; Mustapha, Y. The use of spent mushroom substrate of L. subnudus Berk as a soil condition for vegetables. Bayero J. Pure Appl. Sci. 2010, 3, 16–19. [Google Scholar] [CrossRef] [Green Version]
- Álvarez-Martín, A.; Sánchez-Martín, M.J.; Pose-Juan, E.; Rodríguez-Cruz, M.S. Effect of different rates of spent mushroom substrate on the dissipation and bioavailability of cymoxanil and tebuconazole in an agricultural soil. Sci. Total Environ. 2016, 550, 495–503. [Google Scholar] [CrossRef]
- Corral-Bobadilla, M.; González-Marcos, A.; Vergara-González, E.P.; Alba-Elías, F. Bioremediation of Waste Water to Remove Heavy Metals Using the Spent Mushroom Substrate of Agaricus bisporus. Water 2019, 11, 454. [Google Scholar] [CrossRef] [Green Version]
- Kwiatkowski, C.A.; Harasim, E. The Effect of Fertilization with Spent Mushroom Substrate and Traditional Methods of Fertilization of Common Thyme (Thymus vulgaris L.) on Yield Quality and Antioxidant Properties of Herbal Material. Agronomy 2021, 11, 329. [Google Scholar] [CrossRef]
- Paula, F.S.; Tatti, E.; Abram, F.; Wilson, J.; O’Flahert, V. Stabilisation of spent mushroom substrate for application as a plant growth-promoting organic amendment. J. Environ. Manag. 2017, 196, 476–486. [Google Scholar] [CrossRef] [PubMed]
- Rinker, D.L. Spent mushroom substrate uses. In Edible and Medicinal Mushrooms: Technology and Applications; Zied, D.C., Pardo-Gimenez, A., Eds.; Wiley-Blackwell: West Sussex, UK, 2017; pp. 427–454. [Google Scholar]
- Zied, D.C.; Sánchez, J.E.; Noble, R.; Pardo-Giménez, A. Use of spent mushroom substrate in new mushroom crops to promote the transition towards a circular economy. Agronomy 2020, 10, 1239. [Google Scholar] [CrossRef]
- Becher, M. Chemical composition of spent mushroom substrate after cultivation of Agaricus bisporus as a waste organic material. Econ. Environ. 2013, 4, 207–213. [Google Scholar]
- Zisopoulos, F.V.; Becerra, H.A.; van der Goot, A.J.; Boom, R.M. A resource efficiency assessment of the industrial mushroom production chain: The influence of data variability. J. Clean. Prod. 2016, 126, 394–408. [Google Scholar] [CrossRef]
- FAOSTAT. Crops and Livestock Products. 2022. Available online: https://fao.org/faostat/en/#data/QCL (accessed on 28 July 2022).
- Salazar, S.; Sánchez, L.E.; Alvarez, J.; Valverde, A.; Galindo, P.; Igual, J.M.; Peix, A.; Santa-Regina, I. Correlation among soil enzyme activities under different forest system management practices. Ecol. Eng. 2011, 37, 1123–1131. [Google Scholar] [CrossRef]
- Joniec, J. Enzymatic activity as an indicator of regeneration processes in degraded soil reclaimed with various types of waste. Int. Environ. Sci. Technol. 2018, 15, 2241–2252. [Google Scholar] [CrossRef] [Green Version]
- Barton, L.L.; McLean., R.J.C. Environmental Microbiology and Microbial Ecology, 1st ed.; John Wiey & Sons. Inc.: Hoboken, NJ, USA, 2019; pp. 1–446. ISBN 978-1-118-96626-6. [Google Scholar]
- Joniec, J.; Furczak, J.; Kwiatkowska, E. Application of biological indicators for estimation of remediation of soil degraded by sulphur industry. Ecol. Chem. Eng. 2015, 22, 269–283. [Google Scholar] [CrossRef] [Green Version]
- Sadhukhan, R.; Jatav, H.S.; Sen, S.; Sharma, L.D.; Rajput, V.D.; Thangjam, R.; Devedee, A.K.; Singh, S.K. Biological nitrification inhibition for sustainable crop production. In Plant Perspectives to Global Climate Changes: Developing Climate-Resilient Plants; Academic Press: Cambridge, MA, USA, 2022; pp. 135–150. [Google Scholar] [CrossRef]
- Jezierska-Tys, S.; Joniec, J.; Bednarz, J.; Kwiatkowska, E. Microbiological nitrogen transformations in soil treated with pesticides and their impact on soil greenhouse gas emissions. Agriculture 2021, 11, 787. [Google Scholar] [CrossRef]
- Rees, R.M.; Maire, J.; Florence, A.; Cowan, N.; Skiba, U.; van der Weerden, T.; Ju, X. Mitigating nitrous oxide emissions from agricultural soils by precision management. Front. Agric. Sci. Eng. 2020, 7, 75–80. [Google Scholar] [CrossRef] [Green Version]
- IPCC. Climate Change 2013, the Physical Science Basis; Cambridge University Press: Cambridge, UK, 2013; p. 1535.
- Draft Investory of U.S. Greenhouse Gas Emissions and Sinks: 1990–2019; The Environmental Protection Agency of United States: Washington, WA, USA, 2021. Available online: https://www.epa.gov/ghgemissions/inventory-us-greenhouse-gas-emissions-and-sinks (accessed on 30 April 2021).
- Shukla, G.; Varma, A. (Eds.) Soil Enzymology. In Soil Biology; Springer Science & Business Media: Berlin, Germany, 2011; Volume 22. [Google Scholar]
- Gianfreda, L.; Rao, M.A. (Eds.) Enzymes in Agricultural Sciences; OMICS International: Hyderabad, India, 2014. [Google Scholar]
- Lee, S.H.; Kim, M.S.; Kim, J.G.; Kim, S.O. Use of Soil Enzymes as Indicators for Contaminated Soil Monitoring and Sustainable Management. Sustainability 2020, 12, 8209. [Google Scholar] [CrossRef]
- Burns, R.G.; DeForest, J.L.; Marxsen, J.; Sinsabaugh, R.L.; Stromberger, M.E.; Wallenstein, M.D.; Weintraub, M.N.; Zoppini, A. Soil enzymes in a changing environment: Current knowledge and future directions. Soil Biol. Biochem. 2013, 58, 216–234. [Google Scholar] [CrossRef]
- Kujur, M.; Patel, A.K. Kinetics of soil enzyme activities under different ecosystems: An index of soil quality. Chilean J. Agric. Res. 2014, 74, 96–104. [Google Scholar] [CrossRef] [Green Version]
- WRB IUSS Working Group. World Reference Base for Soil Resources 2014. update 2015. International Soil Classification System for Naming Soils and Creating Legends for Soil Maps; In World Soil Resources Reports; FAO: Rome, Italy, 2015. [Google Scholar]
- Polish Society of Soil Science. Particle size distribution and textural classes of soils and mineral materials—Classification of Polish Society of Soil Science 2008. Soil Sci. Ann. 2009, 60, 5–16. [Google Scholar]
- Foght, J.; Aislabie, J. Enumeration of Soil Microorganisms. In Monitoring and Assessing Soil Bioremediation. Soil Biology Part 5; Margesin, R., Schinner, F., Eds.; Springer: Berlin/Heidelberg, Germany, 2005; pp. 261–280. ISBN 978-3-540-25346-4. [Google Scholar] [CrossRef]
- Rodina, A. Microbiological Methods for the Study of Waters; PWRiL: Warszawa, Poland, 1968. [Google Scholar]
- Martin, J. Use of acid, rose bengal and streptomycin in the plate method for estimating soil fungi. Soil Sci. 1950, 69, 215–232. [Google Scholar] [CrossRef]
- Ladd, J.N.; Butler, J.A.H. Short-term assays of soil proteolytic enzyme activities using proteins and dipeptide derivatives as substrates. Soil Biol. Biochem. 1972, 4, 19–30. [Google Scholar] [CrossRef]
- Zantua, M.J.; Bremner, J.M. Comparison of methods of assaying urease activity in soils. Soil Biol. Biochem. 1975, 7, 291–295. [Google Scholar] [CrossRef]
- Nowosielski, O. Methods for Determination of Fertilization Requirements, 2nd ed.; PWRiL: Warsaw, Poland, 1974. [Google Scholar]
- Schloter, M.; Nannipieri, P.; Sorensen, S.J.; van Elsas, J.D. Microbial indicators for soil quality. Biol. Fertil. Soils 2018, 54, 1–10. [Google Scholar] [CrossRef] [Green Version]
- Sivojiene, D.; Kacergius, A.; Baksiene, E.; Maseviciene, A.; Zickiene, L. The influence of organic fertilizers on the abundance of soil microorganism communities, agrochemical indicators, and yield in east lithuanian light soils. Plants 2021, 10, 2648. [Google Scholar] [CrossRef]
- Zhou, X.; Leite, M.F.; Zhang, Z.; Tian, L.; Chang, J.; Ma, L.; Kuramae, E.E. Facilitation in the soil microbiome does not necessarily lead to niche expansion. Environ. Microbiome 2021, 16, 4. [Google Scholar] [CrossRef]
- Becher, M.; Banach-Szott, M.; Godlewska, A. Organic Matter Properties of Spent Button Mushroom Substrate in the Context of Soil Organic Matter Reproduction. Agronomy 2021, 11, 204. [Google Scholar] [CrossRef]
- Wang, H.W.; Xu, M.; Cai, X.Y.; Tian, F. Evaluation of soil microbial communities and enzyme activities in cucmber continuous cropping soil treated with spent mushroom (Flammulina velutipes) substrate. J. Soils Sediments 2021, 21, 2938–2951. [Google Scholar] [CrossRef]
- Joniec, J. Indicators of microbial activity in the assessment of soil condition subjected to several years of reclamation. Ecol. Indic. 2019, 98, 686–693. [Google Scholar] [CrossRef]
- Joniec, J.; Oleszczuk, P.; Jezierska-Tys, S.; Kwiatkowska, E. Effect of reclamation treatments on microbial activity and phytotoxicity of soil degraded by the sulphur mining industry. Environ. Pollut. 2019, 252, 1429–1438. [Google Scholar] [CrossRef] [PubMed]
- Chen, J.; Song, D.; Liu, D.; Sun, J.; Wang, X.; Zhou, W.; Liang, G. Soil Aggregation Shaped the Distribution and Interaction of Bacterial-Fungal Community Based on a 38-Year Fertilization Experiment in China. Front. Microbiol. 2022, 13, 824681. [Google Scholar] [CrossRef] [PubMed]
- Li, W.; Jiang, L.; Zhang, Y.; Teng, D.; Wang, H.; Wang, J.; Lv, G. Structure and driving factors of the soil microbial community associated with Alhagi sparsifolia in an arid desert. PLoS ONE 2021, 16, e0254065. [Google Scholar] [CrossRef]
- Stanaszek-Tomal, E. Environmental factors causing the development of microorganisms on the surfaces of national cultural monuments made of mineral building materials—Review. Coatings 2020, 10, 1203. [Google Scholar] [CrossRef]
- Atiyeh, R.M.; Domínguez, J.; Subler, S.; Edwards, C.A. Changes in biochemical properties of cow manure during processing by earthworms (Eisenia andrei, Bouché) and the effects on seedling growth. Pedobiologia 2000, 44, 709–724. [Google Scholar] [CrossRef] [Green Version]
- Vranova, V.; Rejsek, K.; Formanek, P. Proteolytic activity in soil: A review. Appl. Soil Ecol. 2013, 70, 23–32. [Google Scholar] [CrossRef]
- Sinsabaugh, R.L.; Lauber, C.L.; Weintraub, M.N.; Ahmed, B.; Allison, S.D.; Crenshaw, C.; Contosta, A.R.; Cusack, D.; Frey, S.; Gallo, M.E.; et al. Stoichiometry of soil enzyme activity at global scale. Ecol. Lett. 2008, 11, 1252–1264. [Google Scholar] [CrossRef]
- Kuziemska, B.; Wysokiński, A.; Klej, P. Effect of different zinc doses and organic fertilization on soil’s enzymatic activity. J. Elem. 2020, 25, 1089–1099. [Google Scholar] [CrossRef]
- Ma, Z.; Zhang, Y.-Q.; Wang, L.-J.; Hu, G.-L.; Gong, X.-Q.; Bai, Q.; Su, S.-C.; Qi, J.-X. Short-term effects of spent mushroom substrate mulching thickness on the soil nnvironment, weed suppression, leaf nutrients, and nut characteristics in a hazelnut orchard. Agronomy 2021, 11, 1122. [Google Scholar] [CrossRef]
- Lori, M.; Piton, G.; Symanczik, S.; Legay, N.; Brussaard, L.; Jaenicke, S.; Nascimento, E.; Reis, F.; Sousa, J.P.; Mader, P.; et al. Compared to conventional, ecological intensive management promotes beneficial proteolytic soil microbial communities for agro-ecosystem functioning under climate change-induced rain regimes. Sci. Rep. 2020, 10, 7296. [Google Scholar] [CrossRef] [PubMed]
- Graham, E.B.; Yang, F.; Bell, S.; Hofmockel, K.S. High Genetic potential for proteolytic decomposition in Northern Peatland ecosystems. Appl. Environ. Microbiol. 2019, 85, e02851-18. [Google Scholar] [CrossRef] [PubMed] [Green Version]
- Prangnell, D.I.; Samocha, T.M.; Staresinic, N. Water. In Sustainable Biofloc Systems for Marine Shrimp; Samocha, T.M., Ed.; Academic Press: Cambridge, MA, USA, 2019; pp. 37–58. ISBN 9780128180402. [Google Scholar] [CrossRef]
- Sierra, J.; Roig, N.; Marti, E.; Nadal, M.; Schuhmacher, M. Amendment of soils with composted sewage sludge. In Long Term Effects on C and N Transformation; Trasar-Cepeda, C., Hernandez, T., Garcia, C., Gonzalez-Carcedo, S., Eds.; Springer: London, UK; New York, NY, USA, 2012; pp. 271–282. [Google Scholar] [CrossRef]
- Yoon, S.; Song, B.; Phillips, R.L.; Chang, J.; Song, M.J. Ecological and physiological implications of nitrogen oxide reduction pathways on greenhouse gas emissions in agroecosystems. FEMS Microbiol. Ecol. 2019, 95, fiz066. [Google Scholar] [CrossRef] [PubMed]
- Lai, T.V.; Farquharson, R.; Denton, M.D. High soil temperatures alter the rates of nitrification, denitrification and associated N2O emissions. J. Soils Sediments 2019, 19, 2176–2189. [Google Scholar] [CrossRef]
- Jezierska-Tys, S.; Frąc, M. CO2, N2O AND NH3 emisssions from two different type of soils as affected by applications of dairy sewage sludge. Int. Agrophys. 2007, 21, 323–328. [Google Scholar]


 C—control;
  SMS—soil + spent mushroom substrate;
  SMS + N1P1K1—soil + spent mushroom substrate + mineral fertilization N1P1K1;
  SMS + N2P2K2—soil + spent mushroom substrate + mineral fertilization N2P2K2;
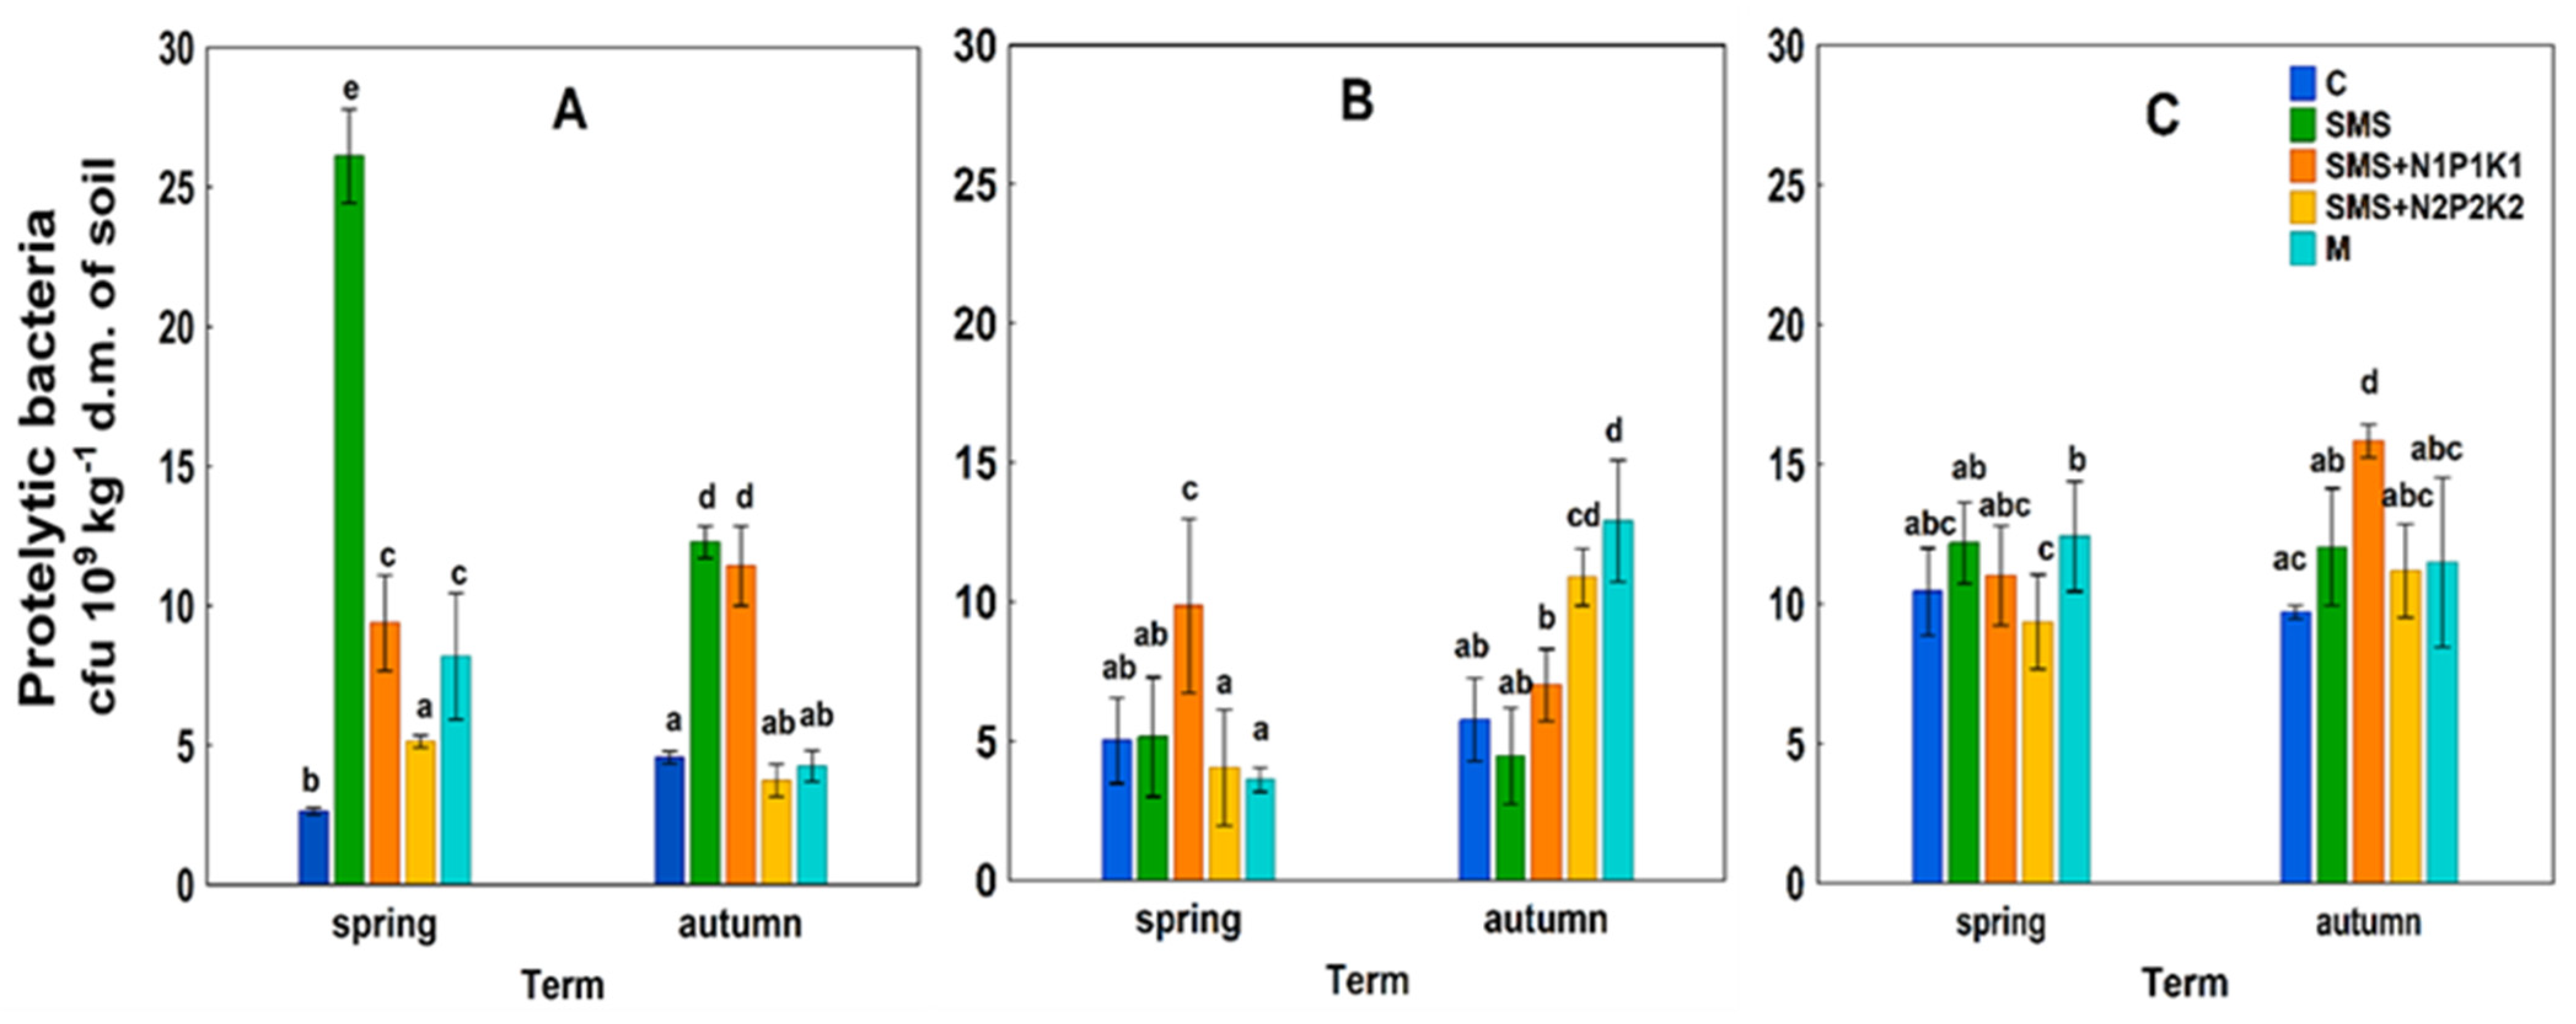
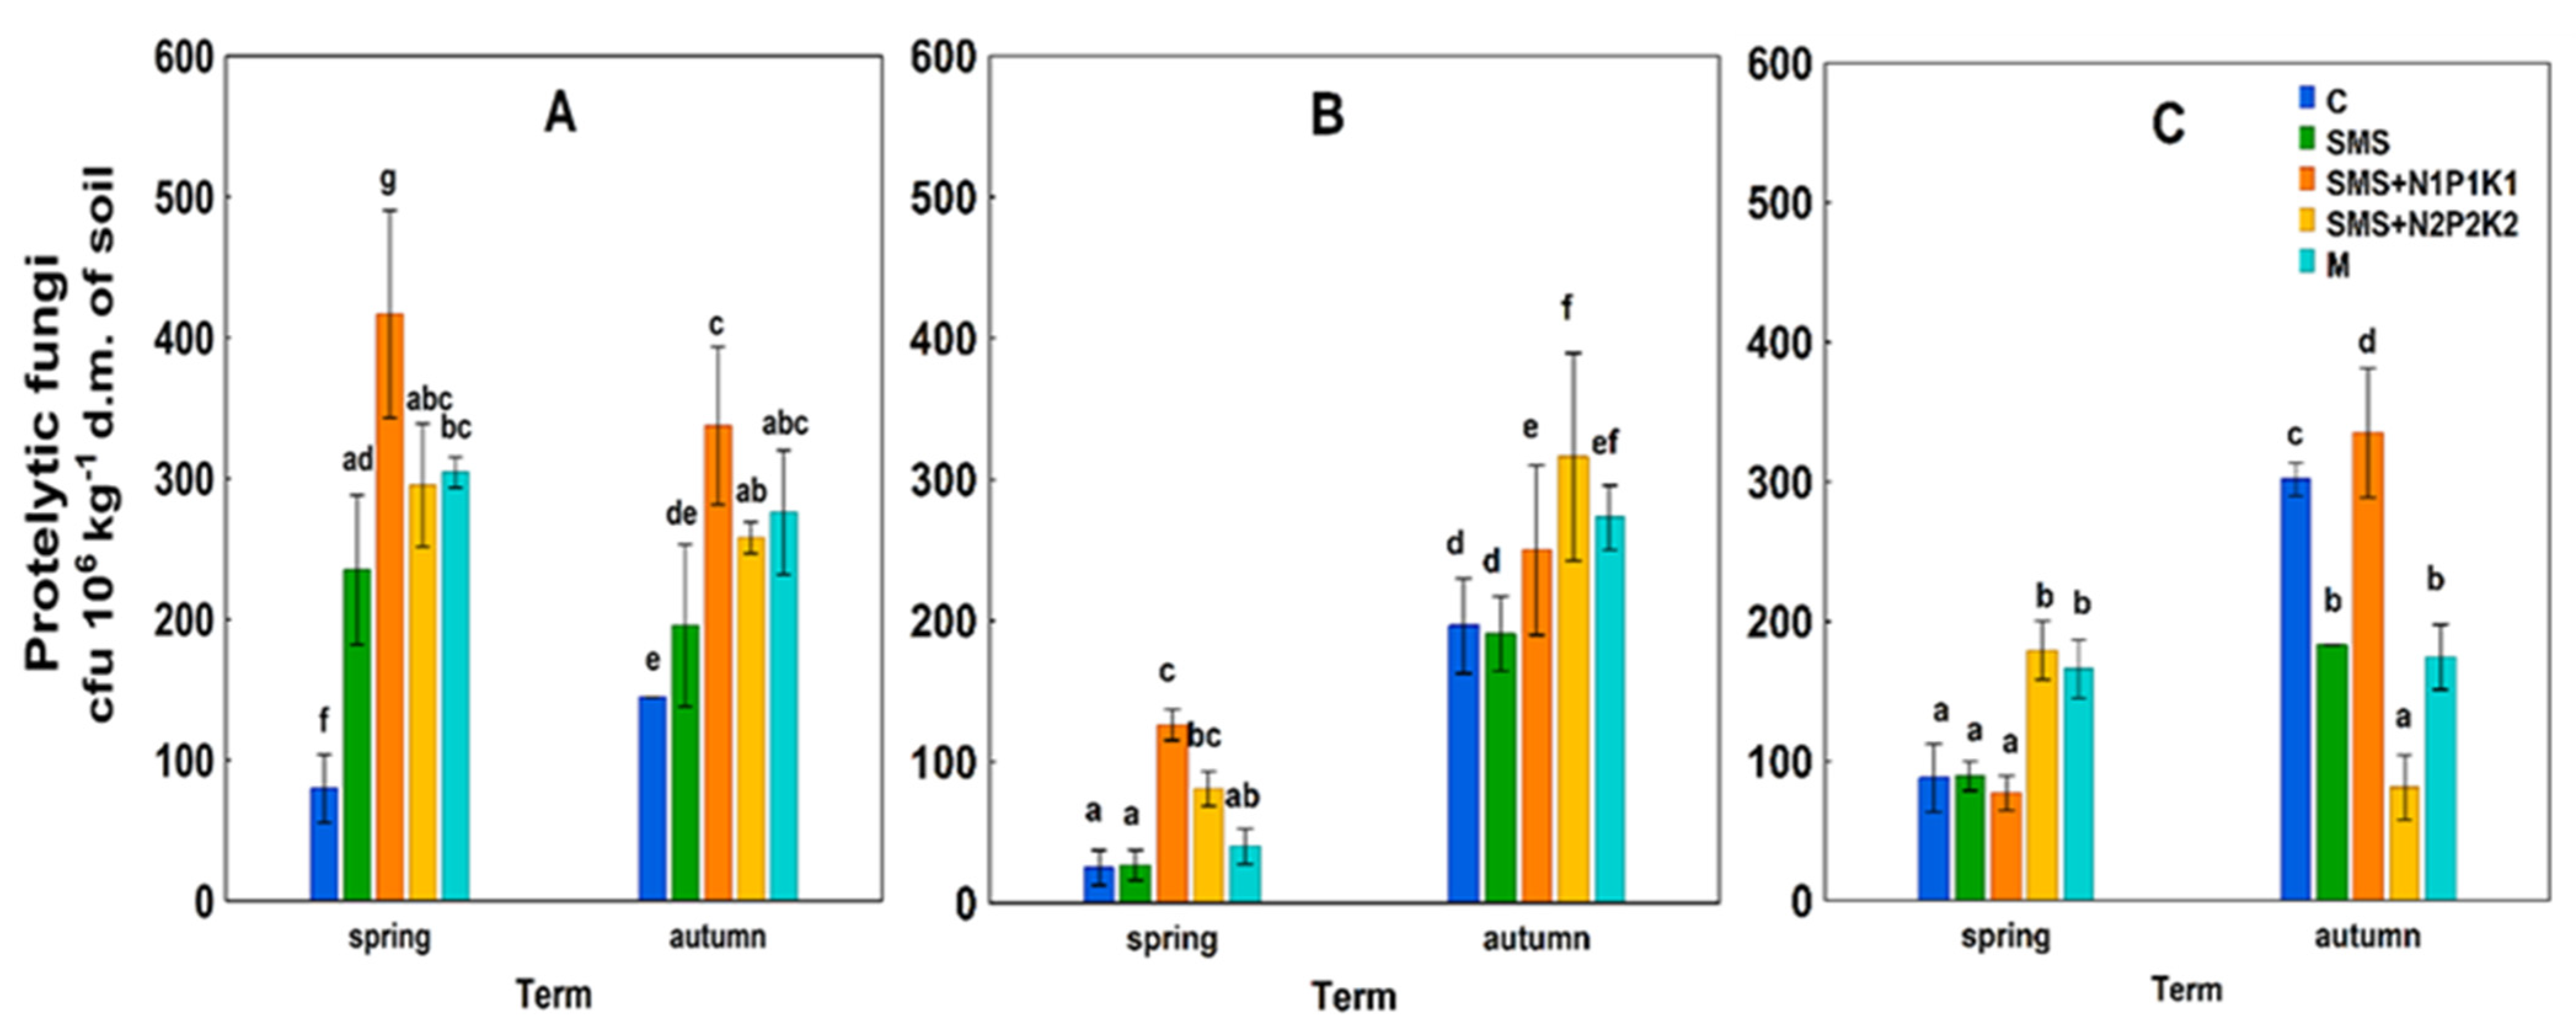
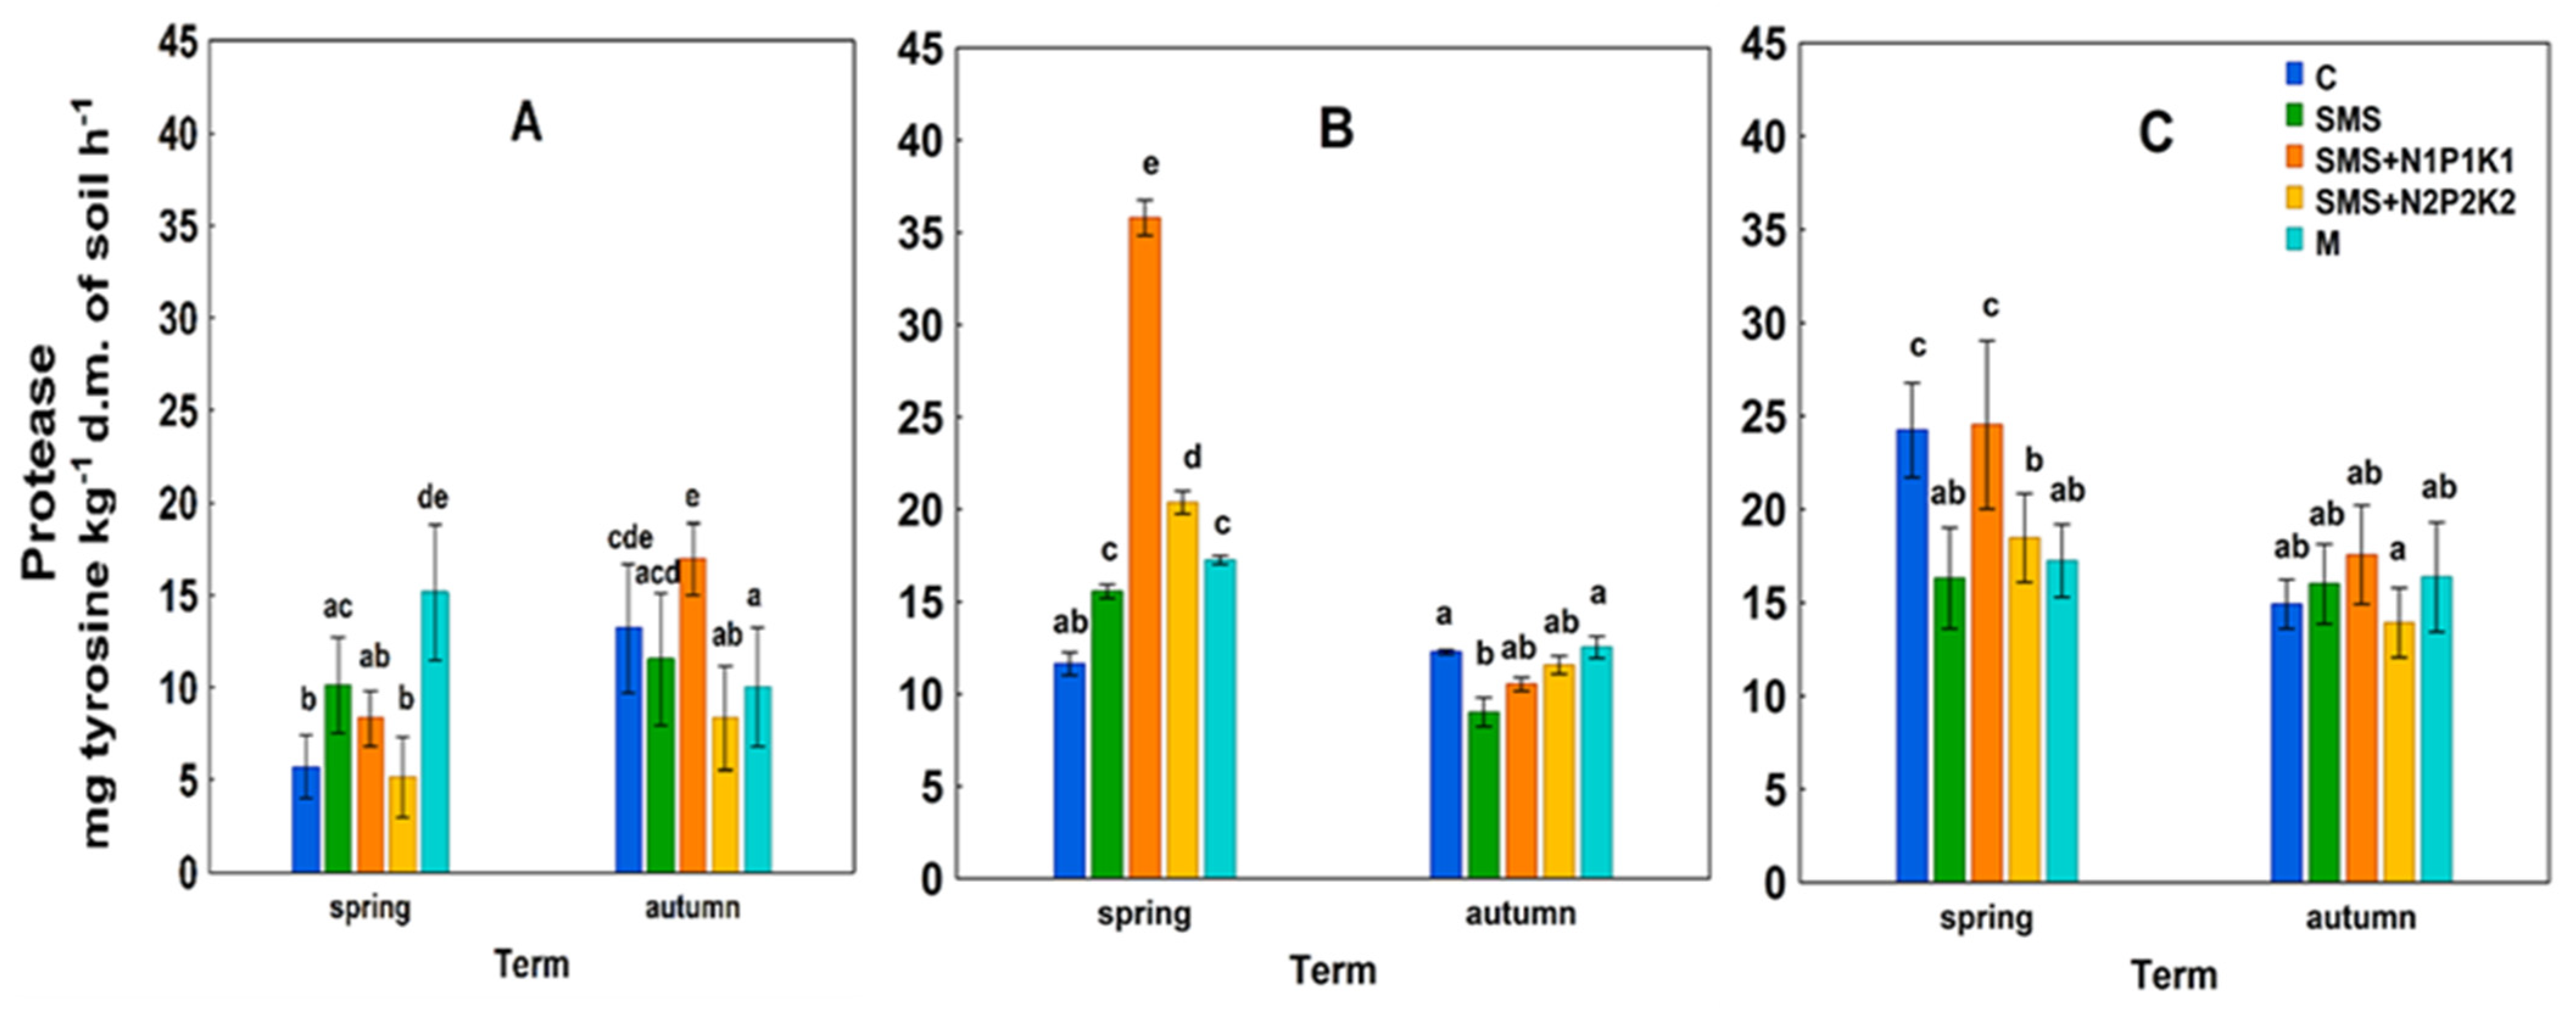
  M—soil + manure; (A)—1st year; (B)—2nd year; (C)—3rd year. The vertical lines indicate the standard deviation. Different letters above the columns indicate significant differences, each year was analyzed independently of each other.
C—control; SMS—soil + spent mushroom substrate; SMS + N1P1K1—soil + spent mushroom substrate + mineral fertilization N1P1K1; SMS + N2P2K2—soil + spent mushroom substrate + mineral fertilization N2P2K2; M—soil + manure; (A)—1st year; (B)—2nd year; (C)—3rd year. The vertical lines indicate the standard deviation. Different letters above the columns indicate significant differences, each year was analyzed independently of each other.
M—soil + manure; (A)—1st year; (B)—2nd year; (C)—3rd year. The vertical lines indicate the standard deviation. Different letters above the columns indicate significant differences, each year was analyzed independently of each other.
C—control; SMS—soil + spent mushroom substrate; SMS + N1P1K1—soil + spent mushroom substrate + mineral fertilization N1P1K1; SMS + N2P2K2—soil + spent mushroom substrate + mineral fertilization N2P2K2; M—soil + manure; (A)—1st year; (B)—2nd year; (C)—3rd year. The vertical lines indicate the standard deviation. Different letters above the columns indicate significant differences, each year was analyzed independently of each other. C—control; SMS—soil + spent mushroom substrate; SMS + N1P1K1—soil + spent mushroom substrate + mineral fertilization N1P1K1; SMS + N2P2K2—soil + spent mushroom substrate + mineral fertilization N2P2K2; M—soil + manure; (A)—1st year; (B)—2nd year; (C)—3rd year. The vertical lines indicate the standard deviation. Different letters above the columns indicate significant differences, each year was analyzed independently of each other.
C—control; SMS—soil + spent mushroom substrate; SMS + N1P1K1—soil + spent mushroom substrate + mineral fertilization N1P1K1; SMS + N2P2K2—soil + spent mushroom substrate + mineral fertilization N2P2K2; M—soil + manure; (A)—1st year; (B)—2nd year; (C)—3rd year. The vertical lines indicate the standard deviation. Different letters above the columns indicate significant differences, each year was analyzed independently of each other.
C—control; SMS—soil + spent mushroom substrate; SMS + N1P1K1—soil + spent mushroom substrate + mineral fertilization N1P1K1; SMS + N2P2K2—soil + spent mushroom substrate + mineral fertilization N2P2K2; M—soil + manure; (A)—1st year; (B)—2nd year; (C)—3rd year. The vertical lines indicate the standard deviation. Different letters above the columns indicate significant differences, each year was analyzed independently of each other.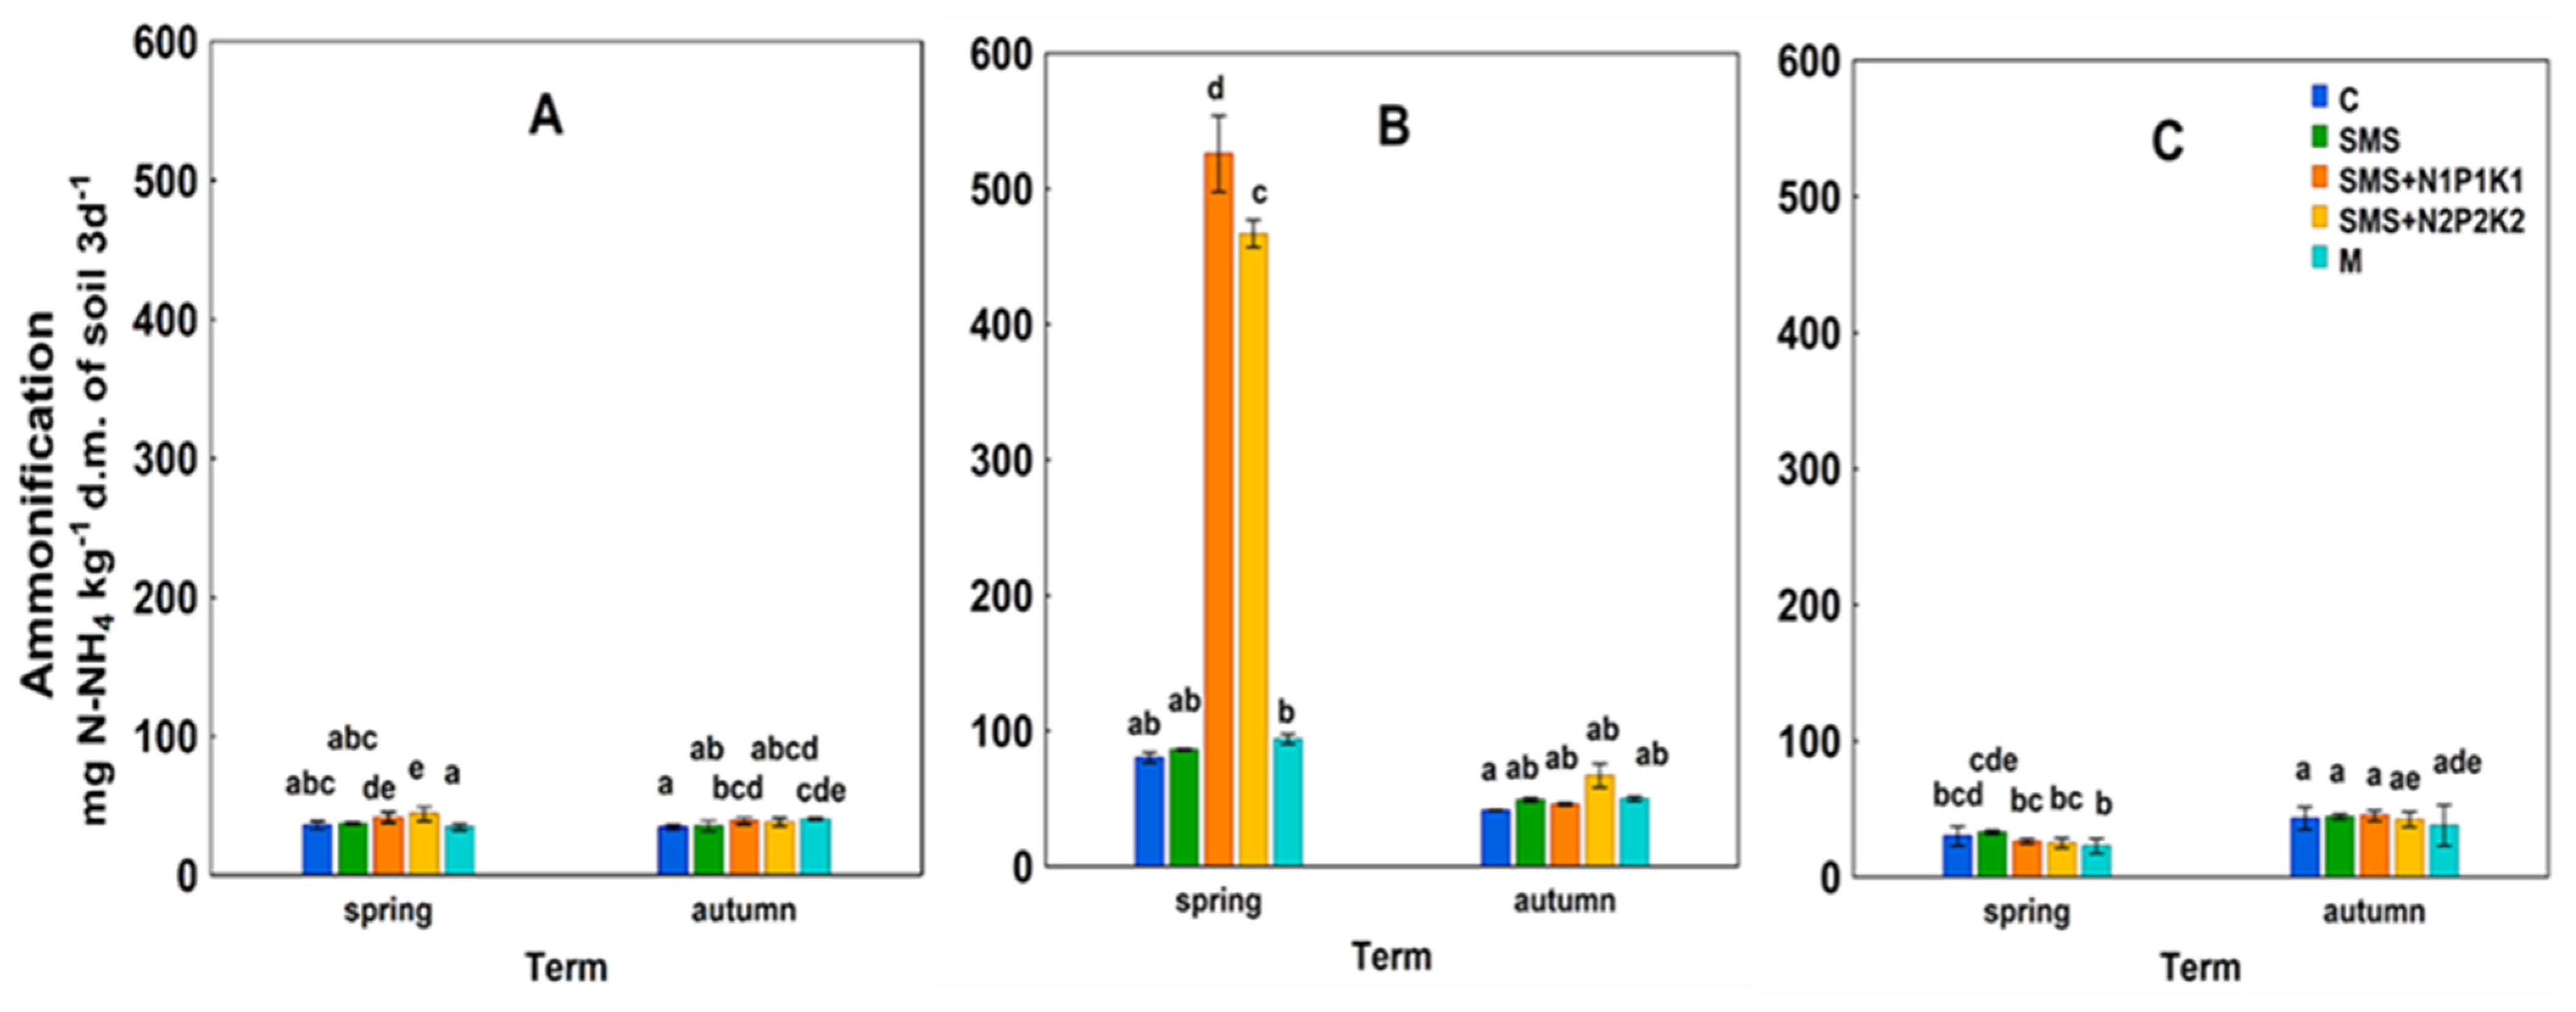 C—control; SMS—soil + spent mushroom substrate; SMS + N1P1K1—soil + spent mushroom substrate + mineral fertilization N1P1K1; SMS + N2P2K2—soil + spent mushroom substrate + mineral fertilization N2P2K2; M—soil + manure; (A)—1st year; (B)—2nd year; (C)—3rd year. The vertical lines indicate the standard deviation. Different letters above the columns indicate significant differences, each year was analyzed independently of each other.
C—control; SMS—soil + spent mushroom substrate; SMS + N1P1K1—soil + spent mushroom substrate + mineral fertilization N1P1K1; SMS + N2P2K2—soil + spent mushroom substrate + mineral fertilization N2P2K2; M—soil + manure; (A)—1st year; (B)—2nd year; (C)—3rd year. The vertical lines indicate the standard deviation. Different letters above the columns indicate significant differences, each year was analyzed independently of each other.
C—control; SMS—soil + spent mushroom substrate; SMS + N1P1K1—soil + spent mushroom substrate + mineral fertilization N1P1K1; SMS + N2P2K2—soil + spent mushroom substrate + mineral fertilization N2P2K2; M—soil + manure; (A)—1st year; (B)—2nd year; (C)—3rd year. The vertical lines indicate the standard deviation. Different letters above the columns indicate significant differences, each year was analyzed independently of each other.

| Property | Unit | Soil | Spent Mushroom Substrate | Manure |
|---|---|---|---|---|
| pHKCl | 1 mol KCl | 7.0 | 6.6 | 7.3 |
| TOC | g kg−1 | 14.98 | 105.0 | 135.8 |
| TN | g kg−1 | 1.51 | 6.50 | 9.47 |
| TP | g kg−1 | 0.19 | 0.25 | 0.25 |
| Ca | mg kg−1 | 1660 | 15,800 | 2240 |
| K | 2350 | 6330 | 11,100 | |
| Mg | 1390 | 1240 | 1550 | |
| Zn | mg kg−1 | n.o. | 86.0 | n.o. |
| Cu | 16.6 | |||
| Ni | 2.81 | |||
| Cr | 1.84 | |||
| Cd | 0.055 | |||
| Pb | 0.956 | |||
| Hg | 0.07 |
| Year | Season | C | SMS | SMS + N1P1K1 | SMS + N2P2K2 | M | |
|---|---|---|---|---|---|---|---|
| pH 1 mol KCl | 2018 | spring | 7.03 | 7.20 | 6.41 | 5.16 | 7.47 |
| autumn | 6.86 | 7.60 | 5.98 | 6.60 | 5.44 | ||
| 2019 | spring | 6.42 | 6.75 | 5.88 | 5.84 | 6.20 | |
| autumn | 6.34 | 6.04 | 6.18 | 5.53 | 6.24 | ||
| 2020 | spring | 6.87 | 6.85 | 6.68 | 6.79 | 6.56 | |
| autumn | 6.25 | 6.13 | 6.33 | 6.64 | 6.50 | ||
| TOC g kg−1 | 2018 | spring | 14.98 | 19.50 | 17.21 | 12.83 | 13.45 |
| autumn | 13.59 | 14.39 | 14.34 | 11.46 | 12.16 | ||
| 2019 | spring | 12.19 | 12.99 | 14.75 | 15.60 | 14.89 | |
| autumn | 12.02 | 10.63 | 13.25 | 13.28 | 18.18 | ||
| 2020 | spring | 15.62 | 16.30 | 14.90 | 15.33 | 17.75 | |
| autumn | 13.34 | 12.54 | 13.85 | 14.91 | 14.78 | ||
| TN g kg−1 | 2018 | spring | 1.51 | 1.82 | 2.13 | 1.46 | 1.36 |
| autumn | 1.37 | 1.44 | 1.39 | 1.18 | 1.28 | ||
| 2019 | spring | 1.50 | 1.10 | 1.00 | 1.30 | 1.10 | |
| autumn | 0.96 | 0.97 | 1.30 | 0.84 | 1.00 | ||
| 2020 | spring | 1.70 | 1.20 | 0.98 | 1.40 | 1.10 | |
| autumn | 0.97 | 0.80 | 1.20 | 0.55 | 1.10 | ||
| TP g kg−1 | 2018 | spring | 0.19 | 0.21 | 0.21 | 0.17 | 0.22 |
| autumn | 0.16 | 0.16 | 0.14 | 0.15 | 0.18 | ||
| 2019 | spring | 0.15 | 0.13 | 0.19 | 0.10 | 0.10 | |
| autumn | 0.11 | 0.10 | 0.11 | 0.13 | 0.15 | ||
| 2020 | spring | 0.10 | 0.15 | 0.12 | 0.16 | 0.15 | |
| autumn | 0.12 | 0.13 | 0.14 | 0.11 | 0.14 |
| Year | Experimental Treatments | PB | PF | URE | PRO | AM | NIT |
|---|---|---|---|---|---|---|---|
| 2018 | C | 3.60 a | 112.31 a | 417.75 g | 9.45 b | 35.29 a | 8.79 ab |
| SMS | 19.20 j | 215.39 f | 887.20 i | 10.84 bc | 36.32 a | 12.99 abc | |
| SMS + N1P1K1 | 10.40 gh | 377.14 h | 508.27 h | 12.63 cd | 40.37 a | 5.95 a | |
| SMS + N2P2K2 | 4.44 ab | 276.58 g | 156.63 a | 6.76 a | 41.25 ab | 12.83 abc | |
| M | 6.22 bc | 290.16 g | 412.21 g | 12.60 cd | 37.45 a | 21.22 bcd | |
| 2019 | C | 5.39 ab | 110.68 a | 193.39 a | 11.96 bc | 60.98 bc | 17.59 abcd |
| SMS | 4.81 ab | 108.78 a | 275.76 bcd | 12.29 cd | 67.76 c | 65.77 h | |
| SMS + N1P1K1 | 8.43 def | 188.25 def | 251.21 b | 23.17 g | 285.94 d | 43.05 fg | |
| SMS + N2P2K2 | 7.48 cd | 198.65 ef | 306.82 cd | 15.97 e | 267.04 d | 44.65 fg | |
| M | 8.25 de | 156.62 bcd | 325.29 de | 14.90 de | 72.04 c | 79.29 i | |
| 2020 | C | 10.07 efg | 194.96 ef | 311.10 cd | 19.58 f | 36.72 a | 38.41 ef |
| SMS | 12.11 hi | 136.28 abc | 362.48 ef | 16.17 e | 38.82 a | 27.15 de | |
| SMS + N1P1K1 | 13.42 i | 206.27 ef | 382.99 fg | 21.05 fg | 35.89 a | 36.04 ef | |
| SMS + N2P2K2 | 10.26 fgh | 130.27 ab | 413.97 g | 16.21 e | 33.85 a | 22.68 cd | |
| M | 11.95 ghi | 170.38 cde | 397.90 fg | 16.82 e | 30.58 a | 53.64 gh |
Publisher’s Note: MDPI stays neutral with regard to jurisdictional claims in published maps and institutional affiliations. |
© 2022 by the authors. Licensee MDPI, Basel, Switzerland. This article is an open access article distributed under the terms and conditions of the Creative Commons Attribution (CC BY) license (https://creativecommons.org/licenses/by/4.0/).
Share and Cite
Joniec, J.; Kwiatkowska, E.; Kwiatkowski, C.A. Assessment of the Effects of Soil Fertilization with Spent Mushroom Substrate in the Context of Microbial Nitrogen Transformations and the Potential Risk of Exacerbating the Greenhouse Effect. Agriculture 2022, 12, 1190. https://doi.org/10.3390/agriculture12081190
Joniec J, Kwiatkowska E, Kwiatkowski CA. Assessment of the Effects of Soil Fertilization with Spent Mushroom Substrate in the Context of Microbial Nitrogen Transformations and the Potential Risk of Exacerbating the Greenhouse Effect. Agriculture. 2022; 12(8):1190. https://doi.org/10.3390/agriculture12081190
Chicago/Turabian StyleJoniec, Jolanta, Edyta Kwiatkowska, and Cezary A. Kwiatkowski. 2022. "Assessment of the Effects of Soil Fertilization with Spent Mushroom Substrate in the Context of Microbial Nitrogen Transformations and the Potential Risk of Exacerbating the Greenhouse Effect" Agriculture 12, no. 8: 1190. https://doi.org/10.3390/agriculture12081190