

An Improved Multi-Objective Optimization Decision Method Using NSGA-III for a Bivariate Precision Fertilizer Applicator

1
School of Vehicle and Traffic Engineering, Henan University of Science and Technology, Luoyang 471000, China
2
School of Electrical Engineering, Henan University of Science and Technology, Luoyang 471000, China
3
China Petroleum First Construction Corporation Ltd., Luoyang 471023, China
*
Author to whom correspondence should be addressed.
Agriculture 2022, 12(9), 1492; https://doi.org/10.3390/agriculture12091492
Submission received: 8 August 2022
/
Revised: 10 September 2022
/
Accepted: 14 September 2022
/
Published: 17 September 2022
(This article belongs to the Special Issue Digital Innovations in Agriculture)
Abstract
:In order to boost the performance of a bivariable granular fertilizer applicator and simplify the control methodology of fertilization rate regulation, this paper proposed a fertilization decision method to obtain the optimal combination of rotational speed and opening length by selecting the accuracy, uniformity, adjustment time, and breakage rate as the optimization objectives. We processed the outlier data collected using the indoor bench test, segmented the data with the fertilization growth rate as the index, and proved the rationality of the data segmentation by an independent sample t-test. SVM, BPNN, ELM, and RVM were used to train the two data sections to create the fertilization rate prediction model, and the models with the highest accuracy in the two data sections were selected for the assembly of the final prediction model used to describe the fertilization process of the bivariate fertilizer applicator. Moreover, the fertilization performance problem model was established with the objectives of accuracy, uniformity, adjustment time, and breakage rate and was solved using the NSGA-III algorithm to gain an optimal fertilization decision. Compared with GA and MOEA-D-DE methods, the results show that, using the new method, the average relative error declines from 8.64% and 6.05% to 3.09%, and the average coefficient of variation reduces from 6.67% and 6.81% to 6.41%, respectively. In addition, the adjustment time lowers from 2.01 s and 1.33 s to 0.78 s, and the average breakage rate drops from 1.084% and 0.845% to 0.803%, respectively. It is indicated that the presented method offers the most notable improvements in accuracy and adjustment time, while the advancements in regard to uniformity and breakage rate is slight, but both are within a reasonable range.
1. Introduction
From the perspective of environmental protection, precision agriculture (PA) can manage crop production inputs in an environmentally friendly way by determining the fertilizer, seed, and pesticide utilization rates through site-specific knowledge [1]. As an essential element of PA, variable rate fertilization can supply the most suitable fertilizer input for the fertilizer application areas in the field, resulting in an increased crop yield, reduced environmental pollution, decreased agricultural costs, and boosted economic income [2,3].
The variable granular fertilizer applicators can be divided into single variable fertilizer applicators and bivariate fertilizer applicators according to the number of control variables. The single variable fertilizer applicator primarily adjusts the degree of fertilizer application by regulating the rotational speed of the fertilizer discharging shaft or the opening length of the feeding inlet [4]. For instance, a subsoiling variable rate fertilization machine for conservation tillage developed by Qi et al. [5] can alter the rotational speed of the fertilizer discharging shaft through a direct current (DC) motor to achieve the variation in the fertilization rate. Moreover, Su et al. [6] designed a variable fertilization system using a servo-driven actuator to modify the opening length of the feed inlet and obtained an average fertilization uniformity of 8.4%, and the time needed to switch the fertilization rate from 204 kg ha−1 to 314 kg ha−1 was identified as about 4.2 s. Since the single-variable fertilizer applicator requires the adaption of only one parameter, the control mode is definitely more straightforward than that of the bivariate fertilizer applicator, but the adjustment range of the fertilizer application rate is also limited. In addition, in the case of low fertilization requirements, the pulse phenomenon of fertilizer discharge unavoidably occurs due to the low speed of the fertilizer discharging shaft, thus affecting the uniformity of the fertilization [7,8]. In contrast, the bivariate fertilizer applicator modifies the fertilization rate by changing these two control parameters simultaneously. For example, a control system of a bivariable fertilizer applicator introduced by Liu et al. [9] can manipulate the change in the fertilization rate by accommodating the rotational speed of the fertilizer discharging shaft and the opening length of the feeding inlet, leading to the increased scope of the fertilization rate. However, the bivariate fertilizer applicator not only enhances the fertilization performance, but also transforms the fertilization rate regulation into a nonlinear and strongly coupled process, causing the control of the fertilizer applicator to become more complicated [10]. Meanwhile, an individual fertilization rate may correspond to multiple combinations of rotational speeds and opening lengths. Once the fertilization operation is carried out with a non-optimal strategy, the accuracy and uniformity of the fertilization will be inevitably affected [11]. Therefore, it is necessary to adopt the optimal fertilization decision to perform efficiently under the best-coordinated parameters [12].
To date, a significant number of studies have systematically investigated the control optimization techniques of bivariate fertilizer applicators. For example, Yuan et al. [13] obtained the optimal control parameters by the iterative multi-objective optimization method based on the GA (genetic algorithm), which combined fertilizing accuracy with energy-saving and fertilizing consistency objectives. Zhang et al. [10] established a three-objective problem model with accuracy, uniformity, and adjustment time as the objectives and solved the problem of the optimal fertilization control decision through the MOEA-D (multi-objective evolutionary algorithm based on decomposition) based on DE (differential evolution) algorithm. Nevertheless, data distortion may be introduced by manual errors or data entry errors during the bench test of a fertilizer applicator and will directly impact the quality of the machine learning technology and predicted results [14,15]. Therefore, it is critical to properly preprocess the original experimental data before using machine learning models. Although the control methods in the above studies have enhanced the fertilization performance compared with the traditional variable rate fertilization, they all neglect the importance of the pretreatment of the original data. Moreover, the accuracy of the fertilization rate prediction model obtained by the experimental data essentially determines the final fertilization performance. The changing trend of the data caused by the diverse range of rotational speeds and opening lengths will affect the forecast accuracy, and the adequate segmentation of data can be helpful for advancing the generalization ability of a model by improving the accuracy [16].
Furthermore, the high rotational speed of the fertilizer discharging shaft inevitably reduces the precision of the fertilization and increases the breakage of fertilizer particles [17,18]. Accordingly, the breakage rate should also be used as one of the evaluation parameters of the fertilization performance. However, these studies on the decision-making methods did not include the breakage rate in the optimization objectives. With the expansion of the objective dimension of the optimization problem, the proportion of non-dominant solutions in the population grows exponentially, slowing down the calculation process and making it challenging to distinguish the good and bad individuals through the Pareto dominance relationship [19]. The non-dominated sorting genetic algorithm III (NSGA-III), recommended by Jain et al. [20], has an excellent performance in unravelling optimization problems with more than three objectives and has been widely applied to practical problems, providing a potential solution to this problem [21].
In view of the above-mentioned problems, a multi-objective optimization decision method based on NSGA-III for a bivariate granular fertilizer applicator is proposed in this study. Firstly, after the outliers are excluded from the data acquired in the bench experiment using Grubbs’ criterion, the residual data are divided into two sections according to the variation trend of the fertilization growth rate and the differences between the two sections are verified by the independent sample t-test. Secondly, four machine learning algorithms, including a support vector machine (SVM) [22], back propagation neural network (BPNN) [23], extreme learning machine (ELM) [24], and relevance vector machine (RVM) [25], are used to train the prediction model of the fertilization rate by adopting the segmented data, respectively, and the multi-objective problem model is constructed with the accuracy, uniformity, adjustment time, and breakage rate as the optimization objectives. Finally, the optimal combination of the rotational speed of the fertilizer discharging shaft and the opening length of the feeding inlet is achieved by resolving the problem model through NSGA-III, and the diversity and convergence of the solution are verified using the hypervolume indicator. Moreover, the practicality and feasibility of the proposed method are proved by bench experiments.
The main contributions and innovations of this study are as follows:
- The data utilized to build the prediction model of the fertilization rate is more consistent with the actual operation, eliminating outliers and using data segment modeling to effectively enhance the prediction accuracy of the model.
- The breakage rate is suggested as one of the optimization objectives to reduce the impairment level in the case of high fertilizer demands.
- NSGA-III is used to calculate the multi-objective optimization problem in this paper, so that the feasible solution has a more remarkable diversity and convergence.
2. Materials and Methods
2.1. Design of the Variable Granular Fertilizer Applicator
The designed fertilizer distributor is shown in Figure 1, which is mainly composed of a feeding box, a fertilizer particle baffle, a baffle connector, a screw conveyor, a fertilizer discharging shaft, a rolling bearing, and a bearing cap. The overall structure of the developed fertilization platform is illustrated in Figure 2. There, the baffle connector is linked with the guide screw, and the guide screw is connected to the opening-length-regulating motor (Motor 1) through a coupler. The fertilizer discharging shaft is fastened to the rotational-speed-regulating motor (Motor 2) by another coupler. In the fertilization phase, the PLC (programmable logic controller) controls the motor operation to adjust the rotational speed of the fertilizer discharging shaft N and the opening length of the fertilizer particle baffle L. Once the fertilizer particle baffle is opened, the fertilizer particles drop into the fertilizer distributor from the fertilizer hopper, and Motor 2 forces the screw conveyor to rotate spirally so that the fertilizer particles are transported to the fertilizer outlet. Finally, the fertilizer particles fall into the weighing container through the fertilizer feeding pipe to complete the fertilization process.
2.2. Acquisition of the Fertilization Rate Data
The physical characteristics of a granular fertilizer play an influential impact on the fertilization performance [13], and the fertilizer used in the data acquisition stage should match the fertilizer used in the actual fertilization process in order to prevent the obtained fertilization control decision from being unsuitable for the fertilization of various crops. In this study, a compound fertilizer for wheat, corn, soybean, fruit trees, and other crops was used to collect experimental data. The total nutrient mass fraction of the fertilizer used is ≥45% (nitrogen-phosphorus-potassium: 15-15-15), and the particle density is 1716.3 kg m−3. According to our method, an indoor bench test is conducted to obtain fertilization data under different rotational speeds and opening lengths. The ranges of the rotational speed and opening length are listed in Table 1. The change range in the rotational speed is 10–150 r min−1, and the step size is set to 10 r min−1. In addition, due to the considerable growth variation in the fertilization rate at a small opening length, to accurately acquire the characteristics of the fertilization data, the size step of the opening length is set to 0.5 mm, 1 mm, and 2 mm for the ranges of 6–12 mm, 12–16 mm, and 16–28 mm, respectively. Each combination of the rotational speed and opening length is sampled 20 times, lasting for 30 s each time. The discharged fertilizer for each test is weighed, and the corresponding fertilization rate is recorded. Finally, 345 groups of fertilization rate data with 20 samples in each group are obtained, of which 20 samples are the fertilization rate data measured under a fixed rotation speed and opening length.
2.3. Data Preprocessing
In the method used in our study, the prediction model of the fertilization rate is established using the data from the bench test. Since the model is directly applied to the subsequent objective-solving process, the data reliability significantly affects the final fertilization performance. Therefore, to elevate the prediction accuracy, a series of processing steps, such as an outlier test, data segmentation, and normalization, are carried out using the original data.
2.3.1. Outlier Test
In the method used in this paper, Grubbs’ criterion is used to test the outliers in order to prevent the distortion of the fertilization rate data caused by manual measurement errors or data entry errors during the data acquisition and decrease the influence of outliers on the overall data. Since Grubbs’ criterion requires the data to be inspected in order to obey the normal distribution, the SW (Shapiro–Wilks) test method is used to prove the normality of the data at the significance level of 0.05 before the outlier test. If the result is p > 0.05, the data set is assumed to follow the normal distribution. Conversely, for data subject to the normal distribution, if a particular value xp in a set of data satisfies the condition of Equation (1), then xp is considered as an anomalous data item and should be excluded from the set of data, and the removed data will be replaced by the mean of the set of data:
where expresses the mean of the data set that xp belongs to, G(α,n)S indicates the critical value of Grubbs’ test, α refers to the significance level, n signifies the number of samples in the set of data, and S is the standard deviation of this data set. Particularly, in the case of α = 0.05 and n = 20, the corresponding G(α,n)S is equal to 2.557. Furthermore, after the outlier test, 345 samples of the fertilization rate with the averages of 20 measured data under every combination of the rotation speed and opening length are obtained.
2.3.2. Data Segmentation
It is observed that the fertilization rate is more sensitive to the small opening length operation, and the variation in the fertilization rate gradually becomes stable with the increase in the opening length. Thus, to relieve the impact of the growth rate difference on the accuracy of the prediction model, the average growth rate of the fertilization rate corresponding to each opening length and its previous opening length is calculated, and the fertilization rate data are divided into two segments, labelled as A and B, according to the changing trend of the average growth rate. The average growth rate of the fertilization rate can be obtained by:
where Rmeani is the average fertilization growth rate of the ith opening length compared with the i-1th opening length, rj is the fertilization rate corresponding to the ith opening length and the jth rotational speed, rpj is the fertilization rate corresponding to the i-1th opening length and the jth rotational speed, and n is the total number of rotational speeds.
The average growth rate Rmean is grouped according to the set range of the opening length. The number of samples in each group is increased by one compared with the previous group, and the first group has at least two samples. During the calculation of the variance in the samples in each group, we chose the median value of the maximum variance and minimum variance as the segmented reference and selected the data group with the minimum difference between the variance and reference value as segment A and the remaining data as segment B.
After the data segmentation, the independent sample t-test is performed on the segmented data to determine whether there is a significant difference at the significance level of 0.05. If the p-value achieved from the test result is less than 0.05, the data are supposed to be split reasonably.
2.4. Establishment of the Fertilization Rate Prediction Model
The machine learning (ML) technique addresses the question of how we can build computers that self-improve automatically through experience [26]. It is one of today’s most rapidly growing technical fields, lying at the intersection of computer science and statistics and at the core of artificial intelligence and data science. Currently, the mainstream ML algorithms are primarily used to complete the classification and regression of data and to implement predictions for data outside the sample set through model training. In the method used in this paper, the data obtained from the bench experiment of the fertilizer applicator are used as the sample set, the rotational speed and opening length are regarded as inputs, and the actual fertilization rate is adopted as the output. Then, the model trained by the ML algorithms is used to forecast the unknown fertilization rate. The four algorithms, including SVM, BPNN, ELM, and RVM, are selected to build the prediction model of the fertilization rate, and the model with the most suitable generalization ability for each data segment is accepted as the final model.
2.4.1. Dataset Partition and Performance Evaluation
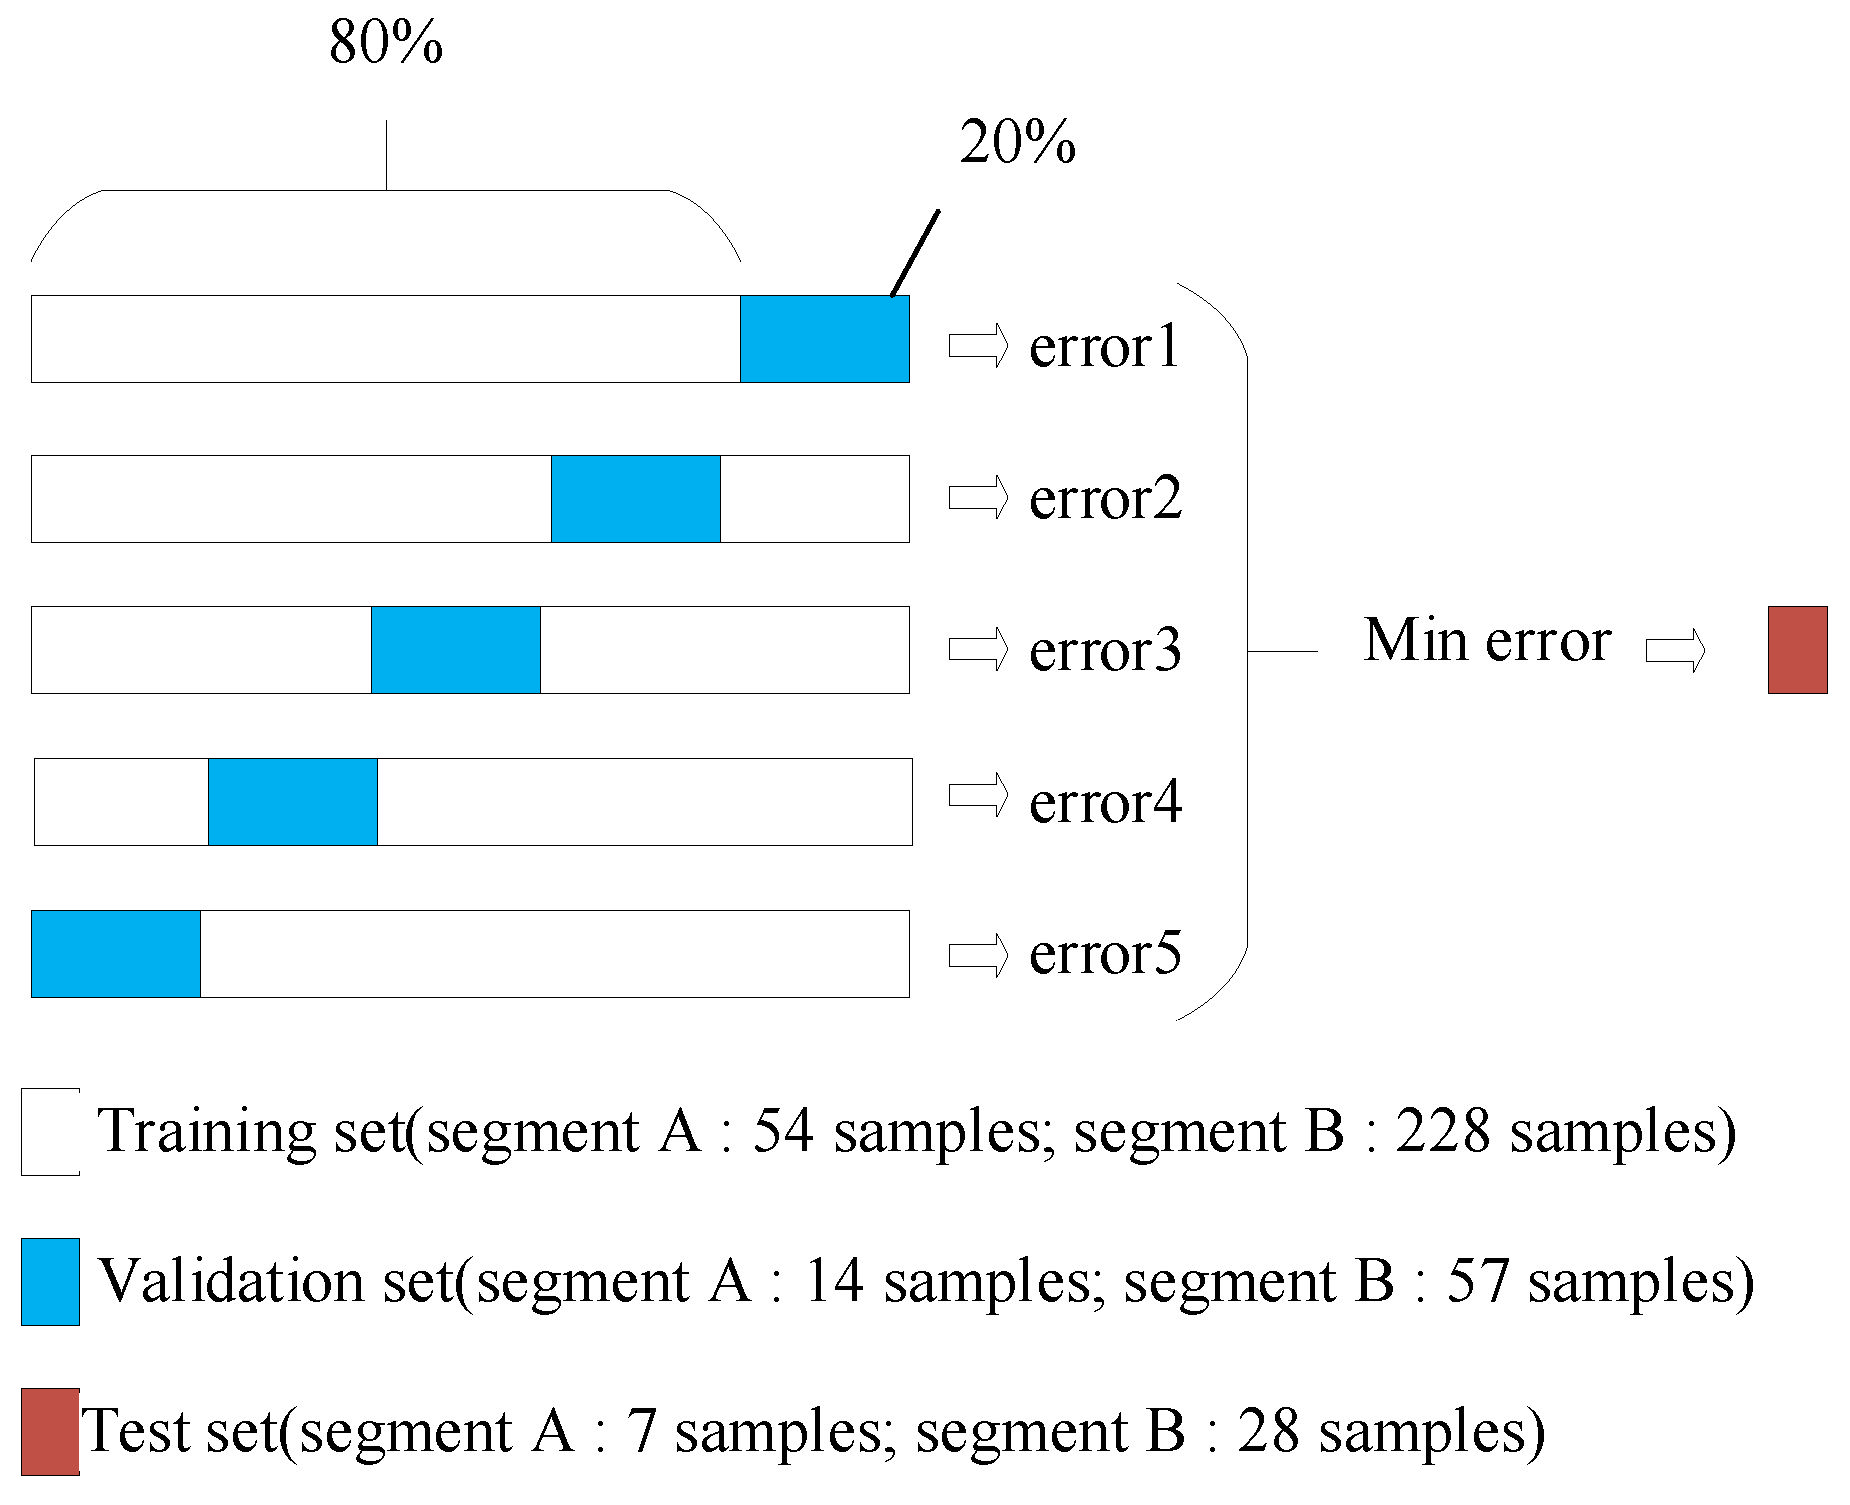
The data sets in the two data segments (A, B) are separated before the model training (Figure 3), and each data segment is divided into 10 groups, one of which is used as a test set to assess the generalization faculty of the established model. Among them, there are 54 samples in the training set, 14 samples in the verification set, and 7 samples in the test set of the data of section A. There are 205 samples in the training set, 52 samples in the validation set, and 28 samples in the test set of the data of segment B. Since the samples, at the point of segmentation, are the commonly shared by the two sections of data, the total amount of the two sections of data reaches 360 samples. For the remaining 9 sets, 20% of the data are utilized as the validation set in the training process, and 80% of the data are applied for the model training. Moreover, the mean absolute percentage error (MAPE) and the coefficient of determination R2 are employed as the evaluation indicators for the prediction effect. MAPE is defined as follows:
R2 can be expressed as:
where n is the total number of samples, is the original value, is the predicted value, and is the mean of the original samples. According to the above dataset division, these four algorithms are trained and tested using the five combinations of the training and validation sets of each data segment, respectively, and the built model of each algorithm with the most minor errors for the validation set is chosen to participate in the subsequent error comparison using the test set.
Figure 3.
Dataset partitioning.
2.4.2. Comparison of the Fertilization Rate Prediction Models
By utilizing the identical test sets to compare the prediction errors of the four selected models for a data segment, we can choose the model with the minimum error as the final model of an individual data segment. In the model training phase, the samples corresponding to the segment point of the opening length are the co-shared samples of the two data segments, and the models constructed by various segments are obviously different. Therefore, the segment point is a repeat point for the fertilization rate prediction model, resulting in the two sets of different forecasted fertilization rates at this point. To solve this problem, we determine each data segment’s opening length variation range by comparing the average relative errors between the predicted value and the actual value, corresponding to the prediction models of the two data segments at the specific point.
In addition, SVM, BPNN, ELM, and RVM are used to train the unsegmented data to evaluate whether the accuracy of the fertilization rate prediction model has been effectively improved before and after the data segmentation. The test sets of the models established by two algorithms are consistent with those used for the performance assessment of the fertilization rate prediction model, and the average prediction error of the test sets is used as the assessment index.
2.5. Modeling and Optimization of the Fertilization Decision
For a preset fertilization rate, there may be multiple combinations of rotational speeds and opening lengths used to satisfy the requirement of the fertilizer application rate [13]. However, the bivariate granular fertilizer applicator is affected by discharge pulsation at a low rotational speed of the fertilizer discharging shaft, resulting in an uneven fertilization. Meanwhile, at a high rotational speed of the fertilizer discharging shaft, the fertilization accuracy will decline, and the breakage rate of the fertilizer particles will conversely increase [11]. Furthermore, in the case where the target fertilization rate varies dramatically, if merely one variable is adjusted, the transition time of the fertilization rate will be unavoidably prolonged, thereby lowering the fertilization accuracy during the regulation process. Through these analyses, we aimed to use NSGA-III to obtain the optimal fertilization decision by solving the combinatorial optimization problem of the accuracy, uniformity, adjustment time, and breakage rate.
2.5.1. Objective Model
In the method used in this study, the target fertilization rate is derived from the fertilization prescription map, and the fertilization accuracy is determined by the absolute value of the difference between the target value and the predicted value. Therefore, the objective function of the fertilization accuracy is defined as follows:
where q is the target fertilization rate, is the predicted fertilization rate, and ε is the maximum permissible error of the fertilizer applicator.
As it is affected by the structure of the fertilizer distributor, the fertilization operation is not a continuous process. For the fertilizer distributor developed in this study, once the blade of the fertilizer discharge shaft is situated at the fertilizer outlet, the bivariate fertilizer applicator has a non-discharge status. Only when the gap between the two blades is aligned with the fertilizer outlet will the fertilizer particles be discharged, resulting in the pulse phenomenon in the fertilization process. Specifically, the lower the rotational speed of the fertilizer discharging shaft is, the more observable the phenomenon will be. Therefore, a greater rotational speed should be selected for a target fertilization rate to promote the uniformity of the fertilization. In this paper, the uniformity is depicted by the magnitude of the polar angle θ corresponding to the rotational speed and opening length.
For instance, both point a and point b correspond to the fertilization rate of 500 g 30 s−1, as illustrated in Figure 4. We assume that the horizontal axis is the polar axis; thus, the included angles formed by the connection lines between the two points and the origin of the coordinates and the horizontal axis are defined as the polar angles. Apparently, under a fixed fertilization rate, the polar angle will increase with the growing rotational speed, while the polar angle will drop with the rise in the opening length. Hence, increasing the polar angle is helpful for obtaining a more suitable uniformity. Similarly, subsequent objective models of the adjustment time and breakage rate are built on the basis of this approach. The polar angle θ is expressed as follows:
and the objective model of uniformity can be given by:
The adjustment time refers to the duration of time required for the fertilizer applicator to transition from one target fertilization rate to another [10]. The length of the adjustment time is directly related to the efficiency, timeliness, and precision of the variable fertilization. Accordingly, it is essential to minimize the variation range of the rotational speed and opening length corresponding to adjacent fertilization rates. The objective model of the adjustment time is described as follows:
where and are the polar angles corresponding to the present and previous fertilization rates, respectively.
To determine the object model of the breakage rate, the breakage rate experiments at the speeds of 150 r min−1, 125 r min−1, and 100 r min−1 are conducted to determine the trend of the breakage rate with the rotational speed in order to select a recommended speed that can satisfy both the breakage rate and uniformity. Moreover, the opening length has an insignificant effect on the breakage rate. To gain a shorter adjustment time, the opening length can be quadratically constrained simultaneously with the breakage rate optimization by minimizing the difference in the opening length between adjacent fertilization rates. The objective model of the breakage rate can be depicted by:
where is the polar angle of the current fertilization rate and is the polar angle of the opening length corresponding to the previous fertilization rate at a recommended target rotational speed.
2.5.2. Multi-Objective Optimization Solution Based on NSGA-III
NSGA-III was proposed by Deb et al. [19] in 2014 on the basis of NSGA-II. The essential architecture of this algorithm is identical to NSGA-II, and the primary difference between NSGA-II and NSGA-III relates to the individual selection mechanisms. In particular, the individual selection method of NSGA-II is based on the crowding distance, while that of NSGA-III is founded on reference points. This paper uses the method proposed by Das and Dennis [27] to generate reference points. Assuming that the hyperplane boundary corresponding to each objective is evenly divided into p parts, then the total number of reference points H corresponding to M objectives is given by:
For the t-th generation population, the archive set is established after the completion of the reference point setting. Furthermore, the genetic algorithm is used to generate offspring population from parent population , and population is formed by merging and . Through non-dominated sorting, the population is split into different levels of non-dominated layers, and individuals with higher non-dominated levels are stored in . If | | > K, it is necessary to carry out an adaptive normalization, reference point correlation, and individual retention operations for the individuals of the last non-dominated layer in s until || = K, where K means the population size. Among these factors, adaptive normalization constitutes the ideal point of the population by selecting the minimum value of each objective and translates the population through Equation (11), causing the ideal point become a zero vector:
where is the i-th objective value of the population, is the ideal value of the i-th objective, and is the i-th objective value after translation.
The extremum point corresponding to each objective can be obtained by Equation (12), which is expressed as:
where w is the normalized direction vector of the coordinate axes. For , we replace it with a smaller number .
An M dimensional linear hyperplane is formed by connecting the extreme points corresponding to the number of fertilizer performance objectives M. Then, the intercept ai of the i-th objective axis and the linear hyperplane can be computed, and the objective functions can be normalized as follows:
where .
The detailed implementation process is shown in Algorithm 1. In this paper, the maximum number of iterations T of NSGA-III is set to 100, the objective number M of the problem to be solved is 4, and p is assigned as 6. Then, according to Equation (12), the total number of reference points is 84. Meanwhile, the population size K is designated as 84.
| Algorithm 1 Optimization of the fertilization decision based on NSGA-III |
|
2.5.3. Performance Comparison of the Multi-Objective Optimization Results
The hypervolume (HV) indicator is a metric approach commonly used to compare the results of an evolutionary multi-objective optimization algorithm (EMOA) [28]. This method was first proposed by Zitzler et al. [29] and is employed to calculate the volume of the space surrounded by the Pareto solution set and reference points [30]. The greater the value of the HV indicator is, the more satisfactory the convergence and diversity of the solution set will be [31]. In the method used in this paper, the NSGA-III and MOEA-D algorithms are used to calculate the solution sets of different target fertilization rates under the same conditions, and the mean values of the HV indicators of these two algorithms are computed. Thereafter, the convergence and diversity of the solution set acquired by NSGA-III are estimated by comparing the differences between the mean values.
2.6. Evaluation Criteria of the Fertilization Performance
The proposed method is compared with the GA, suggested by Yuan et al. [13], and MOEA-D-DE, recommended by Zhang et al. [10], to prove its feasibility and practicality. Using the accuracy, uniformity, adjustment time, and breakage rate as evaluation criteria, eight groups of fertilization decisions acquired by the three methods corresponding to the target fertilization rates are verified and compared using the fertilization platform under identical testing situations. The specific descriptions of the assessment criteria are as follows.
2.6.1. Accuracy
Using the fertilization platform to verify the optimal rotational speed and opening length solved by these algorithms, the accuracy is defined as the relative error between the measured value and the target value of the fertilization rate and is expressed explicitly as:
where y is the fertilization rate obtained from the actual experiment and is the target fertilization rate.
2.6.2. Uniformity
The uniformity test is conducted 15 times under the optimal rotational speed and opening length determined by these three algorithms, and the duration of the fertilization each time is 3 s. The coefficient of variation (CV) is used to measure the uniformity of the fertilization as follows:
where is the fertilization rate acquired by the i-th test and is the average fertilization rate.
2.6.3. Adjustment Time
In the method used in this paper, the maximum time required to transition from the current fertilization rate to the following fertilization rate, so as to alter the rotational speed and opening length, is used to express the adjustment time. Obviously, the shorter the adjustment time is, the faster the response of the fertilizer applicator will be.
2.6.4. Breakage Rate
The breakage rate test is carried out at the optimal rotational speed corresponding to the target fertilization rate. During the experiment, a sieve with holes of 1.5 mm is used to ensure that the measured fertilizer is not damaged. After documenting the weight, the treated fertilizer is poured into the fertilizer applicator, and the discharged fertilizer is sifted and weighed again. The breakage rate is calculated as follows:
where B is the breakage rate, b1 is the weight of the fertilizer before the fertilizer discharge, and b2 is the weight of the fertilizer after the fertilizer application.
3. Results and Discussion
3.1. Data Pretreatment Effect
A total of 345 groups of data must be tested for outliers, and each group comprises 20 samples. A normal test is performed for each group of data. For the data subject to a normal distribution, Grubbs’ criterion is adopted to screen the data measured during the indoor bench test under the significance level of 0.05, as shown in Table 2. Thirteen abnormal data are filtered out, and every excluded outlier datum is replaced by the corresponding intra-group mean.
The data are sectioned according to the variation trend of the fertilization growth rate. The maximum and minimum variances for all the possible groups of the average fertilization growth rate are 0.6965 and 0.2452, respectively, and the reference value is 0.4708. The variance is 0.5427 in the case where the opening range varies from 6 to 8 mm, which is the smallest compared with the reference value. Thus, the corresponding fertilization rate data are classified as segment A, and the remaining data are designated as segment B. The data in segment A (L ≤ 8 mm) include 75 samples, and the data in segment B (L ≥ 8 mm) consist of 285 samples in total. The rationality of the data segmentation is verified by the independent sample t-test, and the SW test is first used to test the normality of the two segments of fertilization growth rate data, as shown in Table 3. At the significance level of 0.05, the significance of the data of segment A and segment B is 0.873 and 0.325, respectively, and the significance of the data of both segments is greater than 0.05. Thus, the data of these two segments follow the normal distribution.
The results of the independent sample t-test are shown in Table 4. First, Levin’s homogeneity test of variance is applied to inspect the homogeneity of the variances in the two data segments. The outcome (p = 0) indicates that the variances exhibit heterogeneity. In that case, the p-value is 0.049, less than the given significance level (p = 0.05). Consequently, we can infer that there is a significant difference between the two data sections, and it is reasonable to segment them in terms of this range.
In this study, the main purpose of the data preprocessing is to improve the degree of approximation between the data and the actual fertilization process and reduce the impact of the data variation on the accuracy of the fertilization rate prediction model. However, the two methods that we compared do not include the relevant technique. In addition, for the MOEA/D-DE method, only three repeated tests are conducted for each group of data during the data acquisition, and the average is taken as the true fertilization rate of a certain combination of the opening length and rotation speed. It should be noted that, once there is a serious deviation between the measured data and the actual fertilization rate caused by operational errors or other reasons, a subsequent erroneous result will inevitably be generated. Therefore, a feasible method is to enhance the accuracy of the data by increasing the number of tests and detect the outliers after the measurements.
3.2. Performance of the Fertilization Rate Prediction Model
The performance of the fertilization rate prediction model based on SVM, BPNN, ELM, and RVM is evaluated using the two test sets of segments A and B, respectively. The numbers of samples in the test sets of segment A and segment B are 7 and 28, respectively, as shown in Table 5 and Table 6.
In addition, the prediction results of segment A are shown in Figure 5. The effect of SVM is the most acceptable among these four algorithms, corresponding to an R2 of 0.9995 and MAPE of 5.7209%. The data forecast results of segment B are illustrated in Figure 6, and BPNN demonstrates a remarkable performance, with an R2 of 0.9997 and MAPE of 0.8658%.
The optimal models (SVM and BPNN) for the above two data segments are selected to predict the fertilization rate at the opening length of 8 mm, respectively, and the relative errors between the predicted value and the actual fertilization rate of the two models are compared, as shown in Table 7. The average relative errors of the SVM-based model for segment A and the BPNN-based model for segment B are 0.019824% and 0.007116%, respectively. It can be seen that the deviation between the predicted value and the actual value of the data in segment B is less than that of segment A. Therefore, the final fertilization rate prediction model is established as follows:
where Q signifies the predicted fertilization rate.
SVM, BPNN, ELM, and RVM are used to train the unsegmented data in order to set up the fertilization rate prediction models, and the performance of the trained models is evaluated using the test sets used for the two data segments, as shown in Table 8. For the prediction model training using the unsegmented and segmented data, the averages of R2 and MAPE correspond to 6–8 mm opening length increases from 0.9734 and 24.4065% to 0.9966 and 13.3858%, respectively, and the averages of R2 and MAPE correspond to 8–28 mm opening length increases from 0.9824 and 17.5236% to 0.9986 and 1.3476%, respectively. It can clearly be concluded that the forecast accuracy can be effectively improved by adequately processing the data before training the fertilization rate prediction model.
By using different machine learning algorithms to train the fertilizer rate prediction models corresponding to the two data segments and combining the models of the two data segments, the prediction accuracy is obviously improved. Moreover, BPNN and SVM, which were adopted in this study, can be further improved by hyper-parameter optimization.
3.3. Performance of the Multi-Objective Optimization Based on NSGA-III
The fertilizer breakage rate is measured at the speeds of 150 r min−1, 125 r min−1, and 100 r min−1. The breakage rate of each rotational speed is measured using three different amounts of fertilizer, and the results of the breakage rate for the three rotating speeds are shown in Table 9. The results indicated that the maximum average breakage rate is 3.5% at 150 r min−1, 1.87% at 125 r min−1, and 0.69% at 100 r min−1. Hence, the rotational speed should be maintained at around 100 r min−1 to lower the breakage rate and ensure the uniformity of the fertilization.
In the method used in this study, NSGA-III is used to solve the multi-objective optimization problem to obtain the optimized combination of the rotational speed and opening length of the bivariate fertilizer applicator. Furthermore, the optimization results are compared with those of the algorithms proposed by Yuan et al. and Zhang et al. The optimal combination of the three methods corresponding to the target fertilization rate is shown in Table 10.
As demonstrated in Table 11, the HV indicators of NSGA-III and MOEA/D under the four objectives (accuracy, uniformity, adjustment time, and breakage rate) are estimated. The average of the various HV indicators of NSGA-III is greater than that of MOEA-D, implying that the application of NSGA-III shows better convergence and diversity so as to determine the fertilization decision model. In addition, it is worth noting that both algorithms show a significant downward trend in regard to HV5. This is mainly because, in the case of a greater target fertilization rate, it is necessary to increase the variation range of the rotational speed and opening length to ensure the accuracy of the fertilization. However, once the rotational speed exceeds 100 r min−1, the breakage rate will unavoidably increase. The rotational speed needs to be decreased to lower the breakage rate, leading to a decline in accuracy and uniformity. Therefore, the solution convergence used for fertilization decisions at a high target fertilization rate is inferior to that at a low target fertilization rate.
The difference in accuracy between the three methods is illustrated in Figure 7. The average relative error of the fertilization rate obtained by the method proposed in this paper is 3.09%, 8.64% for GA and 6.05% for MOEA-D-DE. It can be noticed that the method proposed in this paper clearly and dramatically improved the fertilization accuracy. Because these three methods were carried out under the same testing conditions, except for the rotational speed and opening length, the difference in accuracy is mainly generated by the diverse forecast results of the fertilization rate prediction models. Therefore, it can be concluded that the method proposed in this paper can effectively enhance the predictive accuracy by improving the generalization ability of the prediction model. In addition, segmented training is valuable for increasing the model’s accuracy.
As shown in Figure 8, the average CV of the fertilization measured by the proposed method in the bench test is 6.41%, slightly higher than that of GA (6.67%) and MOEA-D-DE (6.81%). It is worth noting that the CV of the proposed method is relatively low for lower fertilization rate demands, while the uniformity of the proposed method is insufficient compared with that of GA for higher fertilization rate demands. The possible reason for this is that this study considered that the increase in the rotational speed would unavoidably lead to an upsurge in the breakage rate. Hence, to decrease the breakage rate, the high rotational speed is restricted, with the aim of optimizing the fertilization decision while maintaining a more appropriate uniformity of the fertilization.
As displayed in Figure 9, the average adjustment time measured by the proposed method is 0.78 s, while that of GA is 2.01 s and that of MOEA-D-DE is 1.33 s. Since the experiment used for the adjustment time in this study is a static test conducted through an indoor bench test, the influencing factor of the adjusting time is primarily mechanical lag, which is affected by the regulation of the rotational speed and opening length during the change in the fertilization rate. Since the method proposed in this paper, combined with MOEA-D-DE, optimizes the adjustment range of the rotational speed and opening length, it can effectively speed up the adjustment process and lower the mechanical lag compared with GA. Moreover, in optimizing the breakage rate, the proposed method enforced a quadratic constraint on the variation range of the opening length to further shorten the adjustment time of the equipment.
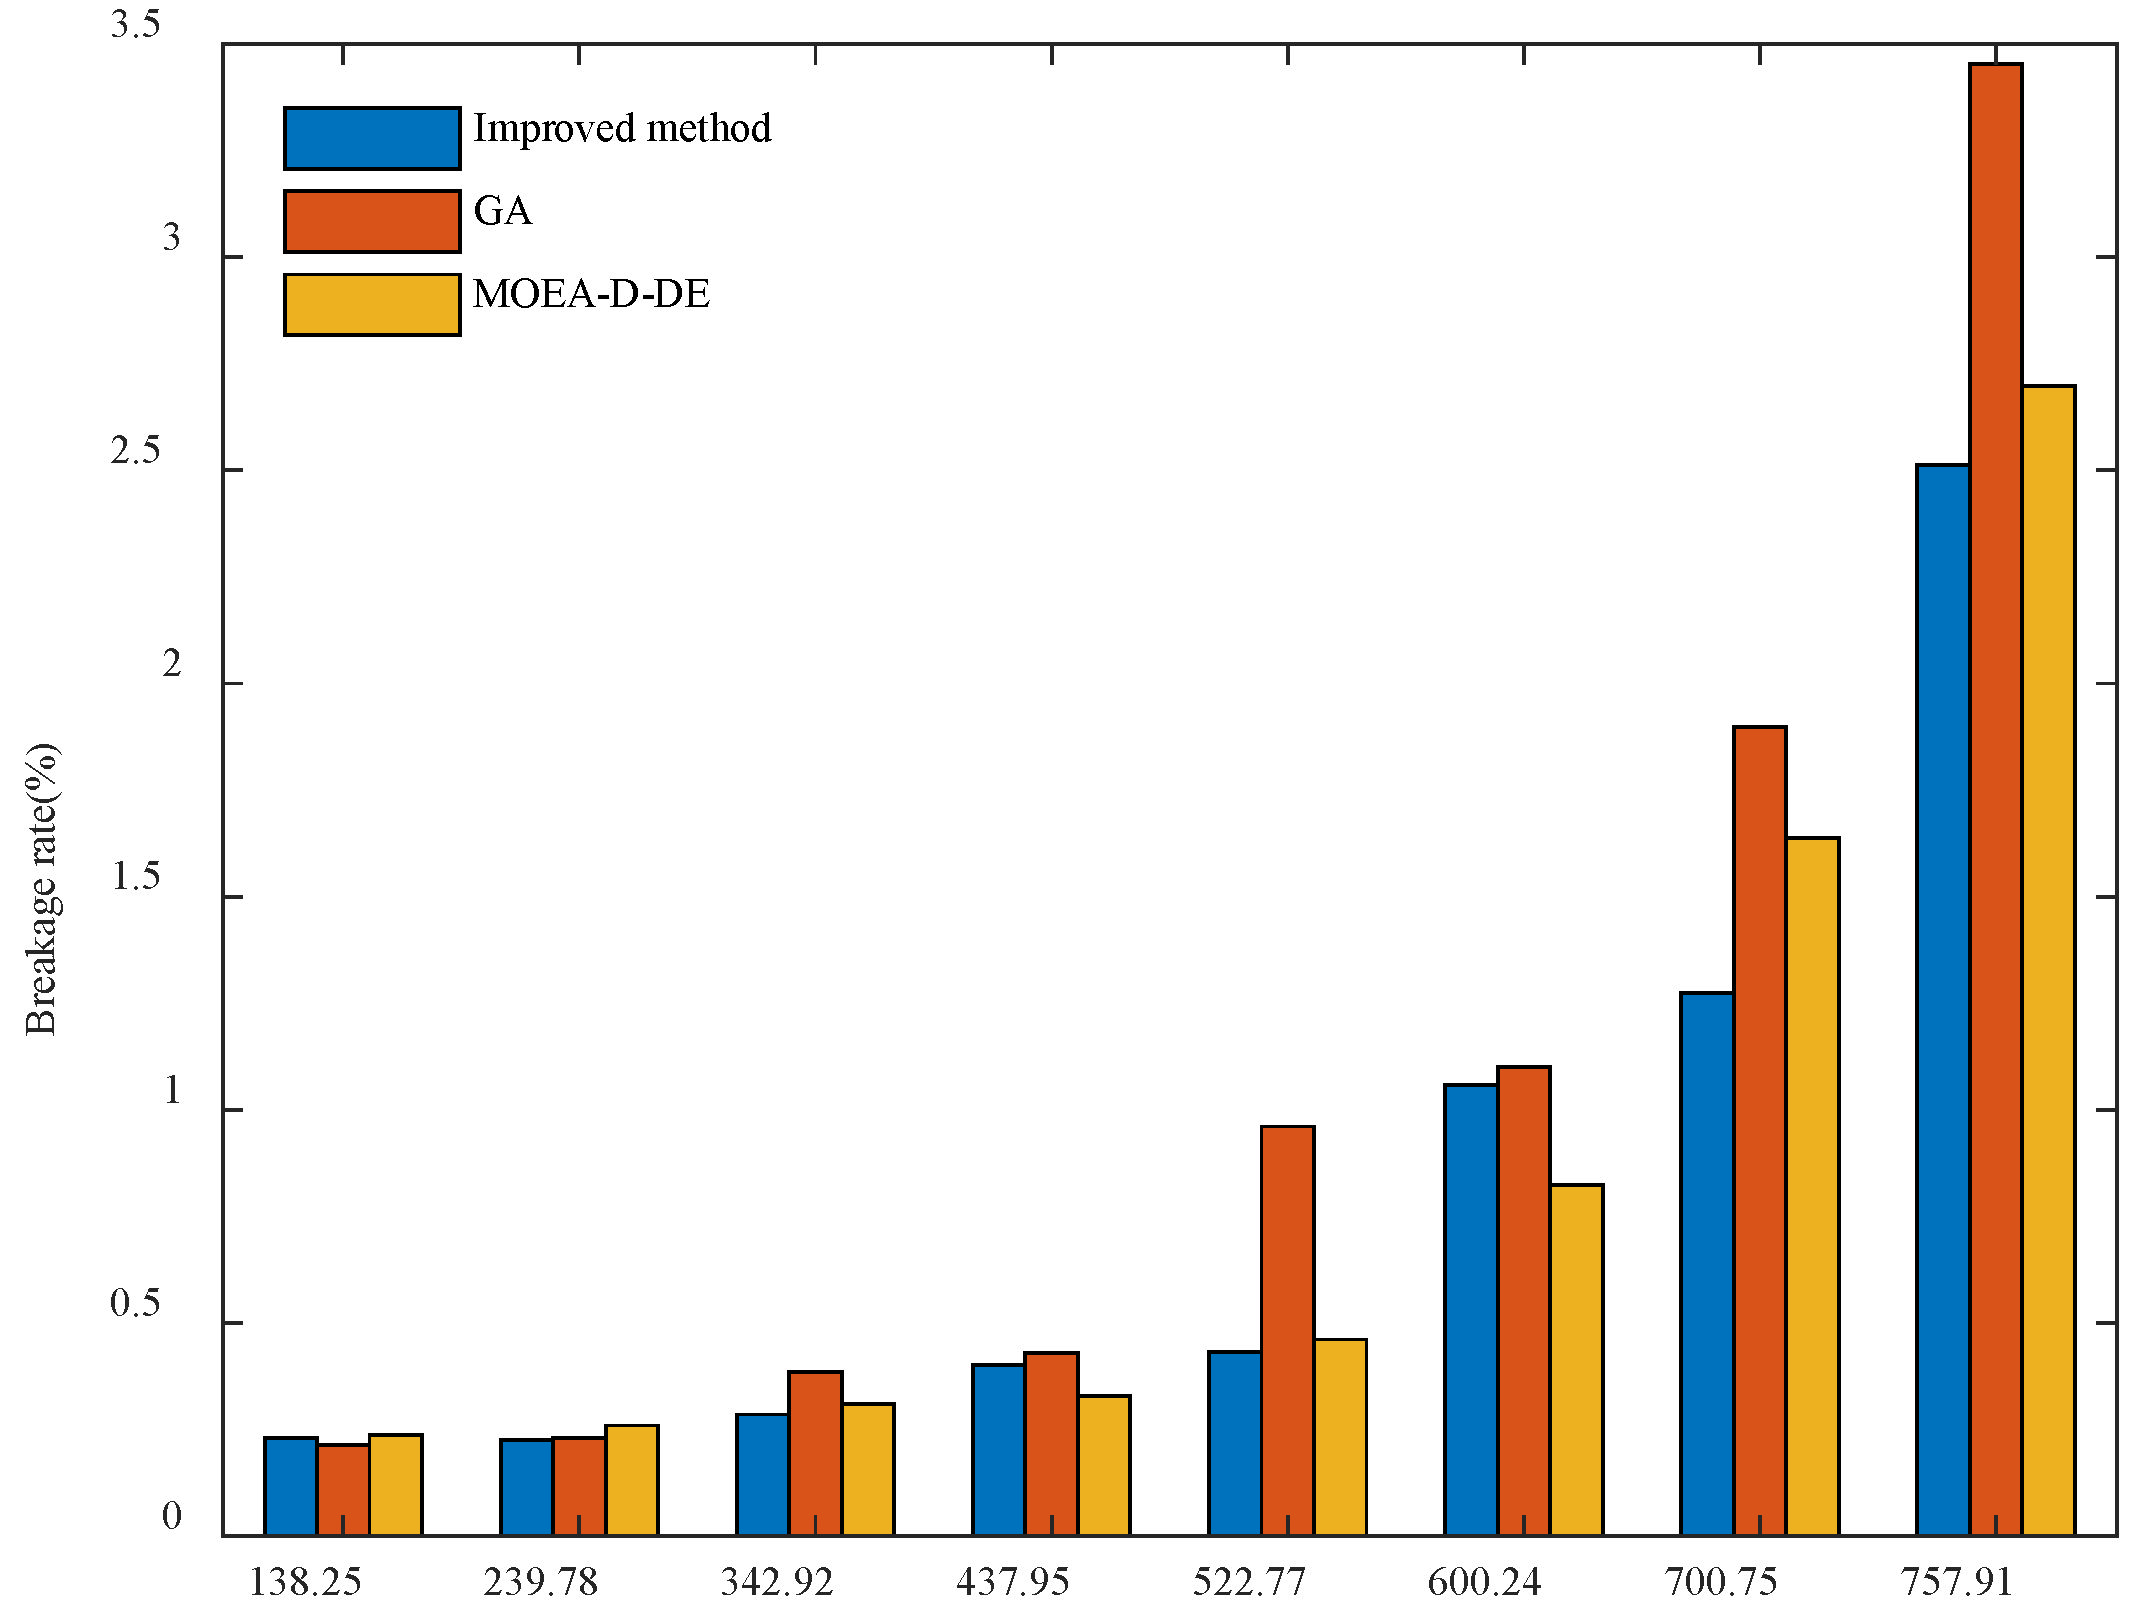
As exhibited in Figure 10, in the case of lower fertilization rate demands, there is little difference in the breakage rate between the three methods due to the low speed of the fertilizer discharging shaft. However, with the increase in the target fertilization rate, the corresponding speed and breakage rate also increase markedly. The maximum breakage rates of the method proposed, GA, and MOEA-D-DE are 2.51%, 3.45%, and 2.7%, respectively. Furthermore, the averages of the presented method, GA, and MOEA-D-DE are 0.803%, 1.084%, and 0.845%, respectively. From the perspective of the average breakage rate, there is a slight dissimilarity between the three methods, and the difference is more apparent at a higher fertilization rate. GA has the highest breakage rate among the three methods because it does not consider the optimization of the breakage rate. Contrarily, MOEA-D-DE defines the objective function of uniformity as the minimum Euclidean distance between the rotational speed and opening length to be optimized and the corresponding rotational speed and opening length of the center of the adjusted region, which limits the rotational speed to a certain extent and causes a decline in the breakage rate.
Through the analysis of the above results, it can be concluded that the accuracy of the fertilization mainly depends on the accuracy of the prediction model, and the uniformity of the fertilization can be enhanced by increasing the rotational speed. Meanwhile, the adjustment time is indirectly affected by the limitation of the breakage rate. In addition, the selection of the recommended target speed in the objective model of the breakage rate is not confined to 100 r min−1 and can be readjusted according to the actual situation. Once the breakage rate is relatively lower at a high rotation speed due to the physical characteristics of the fertilizer particles, the recommended target rotational speed can be appropriately increased to improve the uniformity of the fertilization.
4. Conclusions
This paper presents a novel decision method designed for a developed bivariate granular fertilizer applicator based on a screw conveyor. Among the four machine learning algorithms for segment B, the prediction accuracy of BPNN is comparatively greater. For segment A, the prediction accuracy of SVM is relatively higher, benefiting from the advantage of SVM in the context of a small sample size. By combining the best models for the two data segments, the accuracy of the prediction model is significantly improved, indicating that the segmentation method proposed in this paper is valuable for the subsequent fertilizer decision optimization. Moreover, the high-precision prediction model of the fertilization rate can reduce the influence of prediction errors on the fertilization performance and accurately reproduce the actual fertilizer discharge process as a substitute for the online measurement of the fertilization rate. Through the optimization of the fertilization performance by NSGA-III, the optimal solution set matching the target fertilization rate is obtained, and the HV indicators are used as the evaluation indicators of the solution set. The results of the HV indicators show that the solution set generated by NSGA-III has better convergence and diversity. Compared with the experimental results of GA and MOEA-D-DE, the method proposed in this paper is most effective in improving the accuracy of the fertilization due to the outstanding performance of the prediction model. Meanwhile, this outcome further verifies the importance of data pretreatment. In this study, the breakage rate was used as one of the optimization objectives to restrict the high rotational speed of the fertilizer discharging shaft. In the face of a higher target fertilizer rate, the target fertilizer rate is more effectively achieved by boosting the opening length to decrease the breakage rate. With the transformation of the target fertilization rate, the decreased change range of the opening length accelerates the adjustment process and is helpful for reducing the influence of mechanical lag on the accuracy of the fertilization.
In future studies, the index table of the optimal rotational speed and opening length corresponding to the required fertilization rate in each area of the prescription map can be further established in order to guide the operation of the fertilizer applicator for the purpose of greatly reducing the control complexity of the process of fertilization.
Author Contributions
Conceptualization, Y.D.; methodology, H.M. and J.W.; software, Z.Z.; validation, Z.Z. and Z.X.; formal analysis, H.M.; investigation, Y.D. and J.W.; resources, J.W.; data curation, Z.X. and H.M.; writing—original draft preparation, Y.D., H.M., and J.W.; writing—review and editing, H.M. and J.W.; visualization, H.M.; supervision, J.W.; project administration, J.W.; funding acquisition, Y.D. and J.W. All authors have read and agreed to the published version of the manuscript.
Funding
This research was funded by the Program for Science & Technology Innovation Talents of the Universities of Henan Province (grant no. 20HASTIT029), Key Scientific Research Projects of the Universities of Henan Province (grant no. 19A460021), and the Key Science and Technology Project of Henan Province (grant no. 2221022102164, 212102210352).
Institutional Review Board Statement
Not applicable.
Informed Consent Statement
Not applicable.
Data Availability Statement
The data used to support the findings of this study are available from the corresponding author upon request.
Conflicts of Interest
The authors declare no conflict of interest.
References
- Bongiovanni, R.; Lowenberg-DeBoer, J. Precision agriculture and sustainability. Precis. Agric. 2004, 5, 359–387. [Google Scholar] [CrossRef]
- Tola, E.; Kataoka, T.; Burce, M.; Okamoto, H.; Hata, S. Granular fertiliser application rate control system with integrated output volume measurement. Biosyst. Eng. 2008, 101, 411–416. [Google Scholar] [CrossRef]
- Forouzanmehr, E.; Loghavi, M. Design, development and field evaluation of a map-based variable rate granular fertilizer application control system. Agric. Eng. Int. CIGR J. 2012, 14, 255–261. [Google Scholar] [CrossRef]
- Jafari, M.; Hemmat, A.; Sadeghi, M. Development and performance assessment of a DC electric variable-rate controller for use on grain drills. Comput. Electron. Agric. 2010, 73, 56–65. [Google Scholar] [CrossRef]
- Qi, J.; Tian, X.; Li, Y.; Fan, X.; Yuan, H.; Zhao, J.; Jia, H. Design and experiment of a subsoiling variable rate fertilization machine. Int. J. Agric. Biol. Eng. 2020, 13, 118–124. [Google Scholar] [CrossRef]
- Su, N.; Xu, T.S.; Song, L.T.; Wang, R.; Wei, Y.Y. Variable rate fertilization system with adjustable active feed-roll length. Int. J. Agric. Biol. Eng. 2015, 8, 19–26. [Google Scholar] [CrossRef]
- Shi, Y.Y.; Hu, Z.C.; Wang, X.C.; Odhiambo, M.O.; Sun, G.X. Fertilization strategy and application model using a centrifugal variable-rate fertilizer spreader. Int. J. Agric. Biol. Eng. 2018, 11, 41–48. [Google Scholar] [CrossRef]
- Sugirbay, A.M.; Zhao, J.; Nukeshev, S.O.; Chen, J. Determination of pin-roller parameters and evaluation of the uniformity of granular fertilizer application metering devices in precision farming. Comput. Electron. Agric. 2020, 179, 105835. [Google Scholar] [CrossRef]
- Liu, C.; Yuan, J.; Liu, J.; Li, C.; Zhou, Z.; Gu, Y. ARM and DSP-based bivariable fertilizing control system design and implementation. Trans. CSAM 2010, 41, 233–238. [Google Scholar]
- Zhang, J.Q.; Liu, G.; Luo, C.M.; Hu, H.; Huang, J.Y. MOEA/D-DE based bivariate control sequence optimization of a variable-rate fertilizer applicator. Comput. Electron. Agric. 2019, 167, 105063. [Google Scholar] [CrossRef]
- Yuan, J.; Liu, C.; Gu, Y.; Miao, Z. Bivariate fertilization control sequence optimization based on relevance vector machine. Trans. Chin. Soc. Agric. Mach. 2011, 42, 184–189. [Google Scholar]
- Zhang, J.Q.; Liu, G. Effects of control sequence optimisation on the performance of bivariate fertiliser applicator. Comput. Electron. Agric. 2022, 192, 106594. [Google Scholar] [CrossRef]
- Yuan, J.; Liu, C.L.; Li, Y.M.; Zeng, Q.B.; Zha, X.F. Gaussian processes based bivariate control parameters optimization of variable-rate granular fertilizer applicator. Comput. Electron. Agric. 2010, 70, 33–41. [Google Scholar] [CrossRef]
- Kartashov, O.O.; Chernov, A.V.; Polyanichenko, D.S.; Butakova, M.A. XAS Data Preprocessing of Nanocatalysts for Machine Learning Applications. Materials 2021, 14, 7884. [Google Scholar] [CrossRef]
- Khalil, A.; Salahuddin; Mashwani, W.K.; Shafiq, M.; Hassan, S.; Kumam, W. New advanced outliers detection tests. Commun. Stat.-Theory Methods 2021, 50, 1640–1655. [Google Scholar] [CrossRef]
- Guilizzoni, M.; Eizaguirre, P.M. Trend Lines and Japanese Candlesticks Applied to the Forecasting of Wind Speed Data Series. Forecasting 2022, 4, 165–181. [Google Scholar] [CrossRef]
- Gu, Y.; Yuan, J.; Liu, C. FIS-based method to generate bivariate control parameters regulation sequence for fertilization. Trans. Chin. Soc. Agric. Eng. 2011, 27, 134–139. [Google Scholar] [CrossRef]
- Wang, L.; Liao, Q.; Liao, Y.; Gao, L.; Xiao, W.; Chen, H. Effects of distributor types on fertilizing performance in an air-assisted applicator. Trans. Chin. Soc. Agric. Eng. 2021, 37, 24–34. [Google Scholar] [CrossRef]
- Deb, K.; Jain, H. An Evolutionary Many-Objective Optimization Algorithm Using Reference-Point-Based Nondominated Sorting Approach, Part I: Solving Problems With Box Constraints. IEEE Trans. Evol. Comput. 2014, 18, 577–601. [Google Scholar] [CrossRef]
- Jain, H.; Deb, K. An Evolutionary Many-Objective Optimization Algorithm Using Reference-Point Based Nondominated Sorting Approach, Part II: Handling Constraints and Extending to an Adaptive Approach. IEEE Trans. Evol. Comput. 2014, 18, 602–622. [Google Scholar] [CrossRef]
- Wang, C.; Ji, Z.C.; Wang, Y. Many-objective flexible job shop scheduling using NSGA-III combined with multi-attribute decision making. Mod. Phys. Lett. B 2018, 32, 1840110. [Google Scholar] [CrossRef]
- Yeganefar, A.; Niknam, S.A.; Asadi, R. The use of support vector machine, neural network, and regression analysis to predict and optimize surface roughness and cutting forces in milling. Int. J. Adv. Manuf. Technol. 2019, 105, 951–965. [Google Scholar] [CrossRef]
- Liang, W.; Wang, G.W.; Ning, X.J.; Zhang, J.L.; Li, Y.J.; Jiang, C.H.; Zhang, N. Application of BP neural network to the prediction of coal ash melting characteristic temperature. Fuel 2020, 260, 116324. [Google Scholar] [CrossRef]
- Ding, S.F.; Zhao, H.; Zhang, Y.N.; Xu, X.Z.; Nie, R. Extreme learning machine: Algorithm, theory and applications. Artif. Intell. Rev. 2015, 44, 103–115. [Google Scholar] [CrossRef]
- Tipping, M.E. Sparse Bayesian learning and the relevance vector machine. J. Mach. Learn. Res. 2001, 1, 211–244. [Google Scholar] [CrossRef]
- Jordan, M.I.; Mitchell, T.M. Machine learning: Trends, perspectives, and prospects. Science 2015, 349, 255–260. [Google Scholar] [CrossRef]
- Das, I.; Dennis, J.E. Normal-boundary intersection: A new method for generating the Pareto surface in nonlinear multicriteria optimization problems. SIAM J. Optim. 1998, 8, 631–657. [Google Scholar] [CrossRef]
- Beume, N.; Naujoks, B.; Emmerich, M. SMS-EMOA: Multiobjective selection based on dominated hypervolume. Eur. J. Oper. Res. 2007, 181, 1653–1669. [Google Scholar] [CrossRef]
- Zizler, E. Multiobjective optimization using evolutionary algorithms: A comparative study. Parallel Probl. Solving Nat. 1998, 1498, 292–301. [Google Scholar] [CrossRef]
- Zitzler, E.; Thiele, L. Multiobjective evolutionary algorithms: A comparative case study and the strength Pareto approach. IEEE Trans. Evol. Comput. 1999, 3, 257–271. [Google Scholar] [CrossRef] [Green Version]
- Tiwari, A.; Sharma, K.; Trivedi, M.K. NSGA-III-Based Time–Cost–Environmental Impact Trade-Off Optimization Model for Construction Projects. In Artificial Intelligence and Sustainable Computing; Springer: Singapore, 2022; pp. 11–25. [Google Scholar]
Figure 1.
Structure of the granular fertilizer distributor: (a) front view of the fertilizer distributor; (b) top view of the fertilizer distributor; (c) screw conveyor.
Figure 1.
Structure of the granular fertilizer distributor: (a) front view of the fertilizer distributor; (b) top view of the fertilizer distributor; (c) screw conveyor.
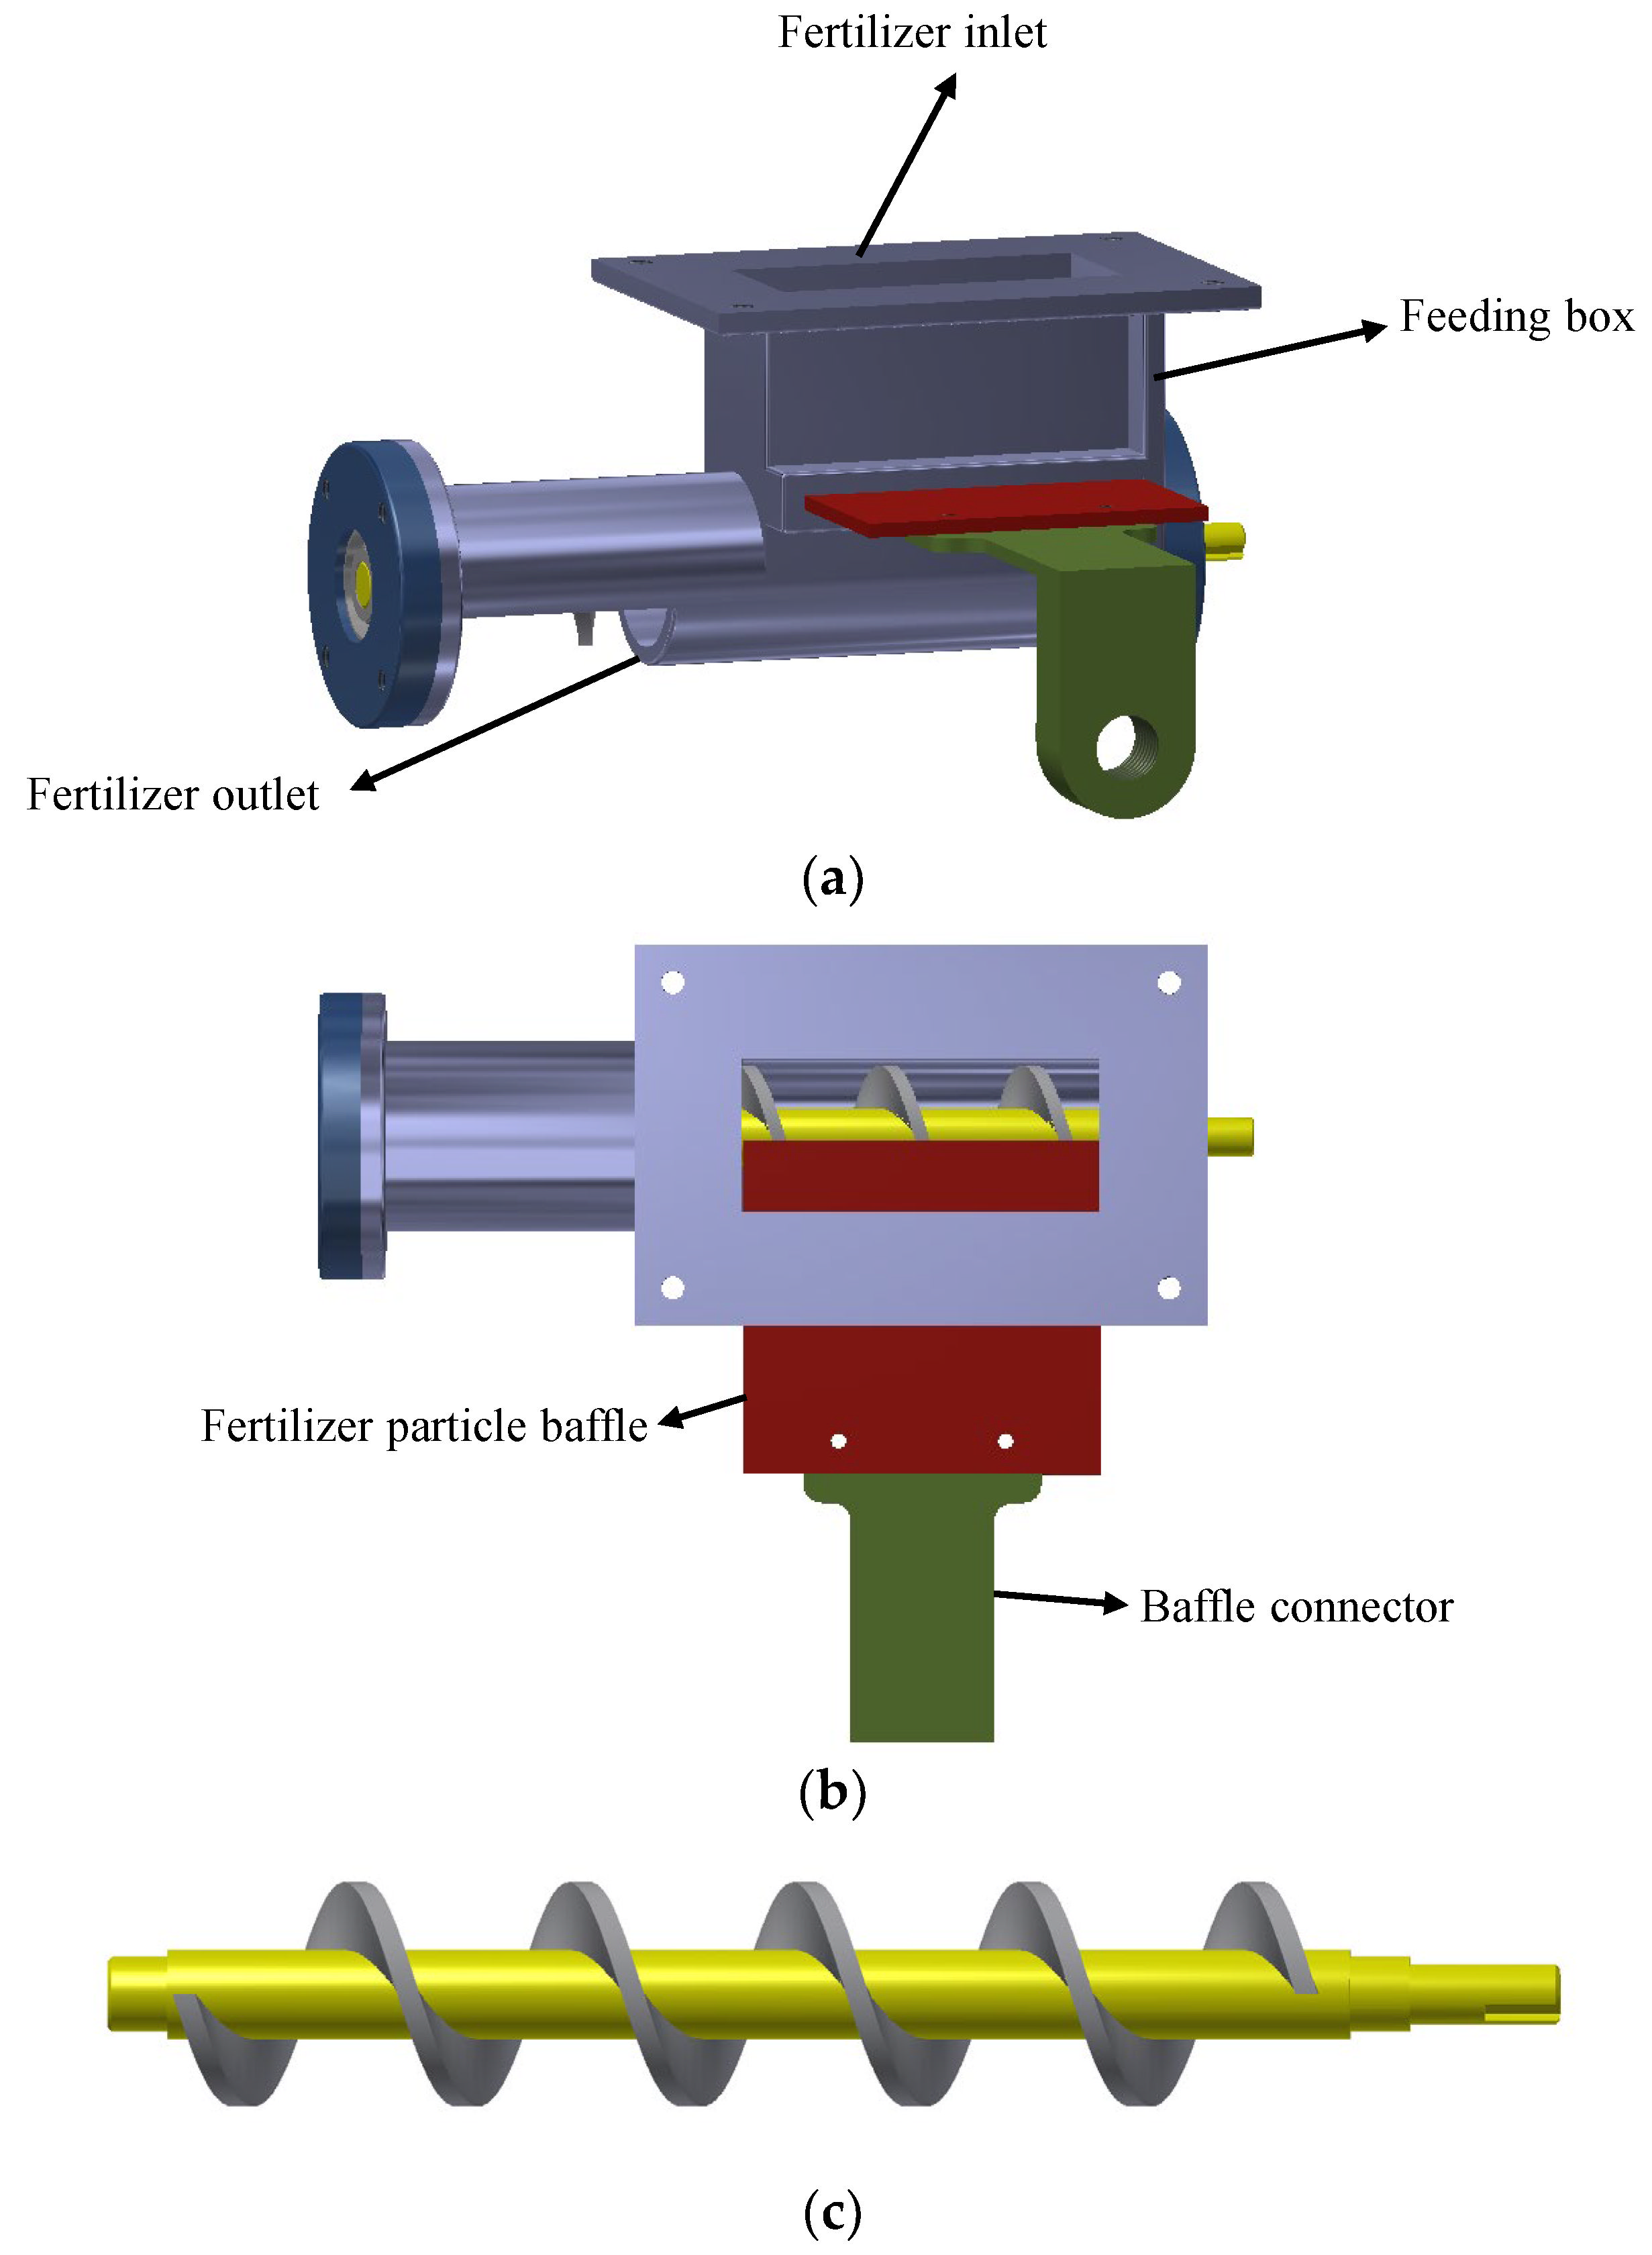
Figure 2.
Overall structure of the fertilization platform: (a) structure of the test platform; (b) real image of the test platform.
Figure 2.
Overall structure of the fertilization platform: (a) structure of the test platform; (b) real image of the test platform.
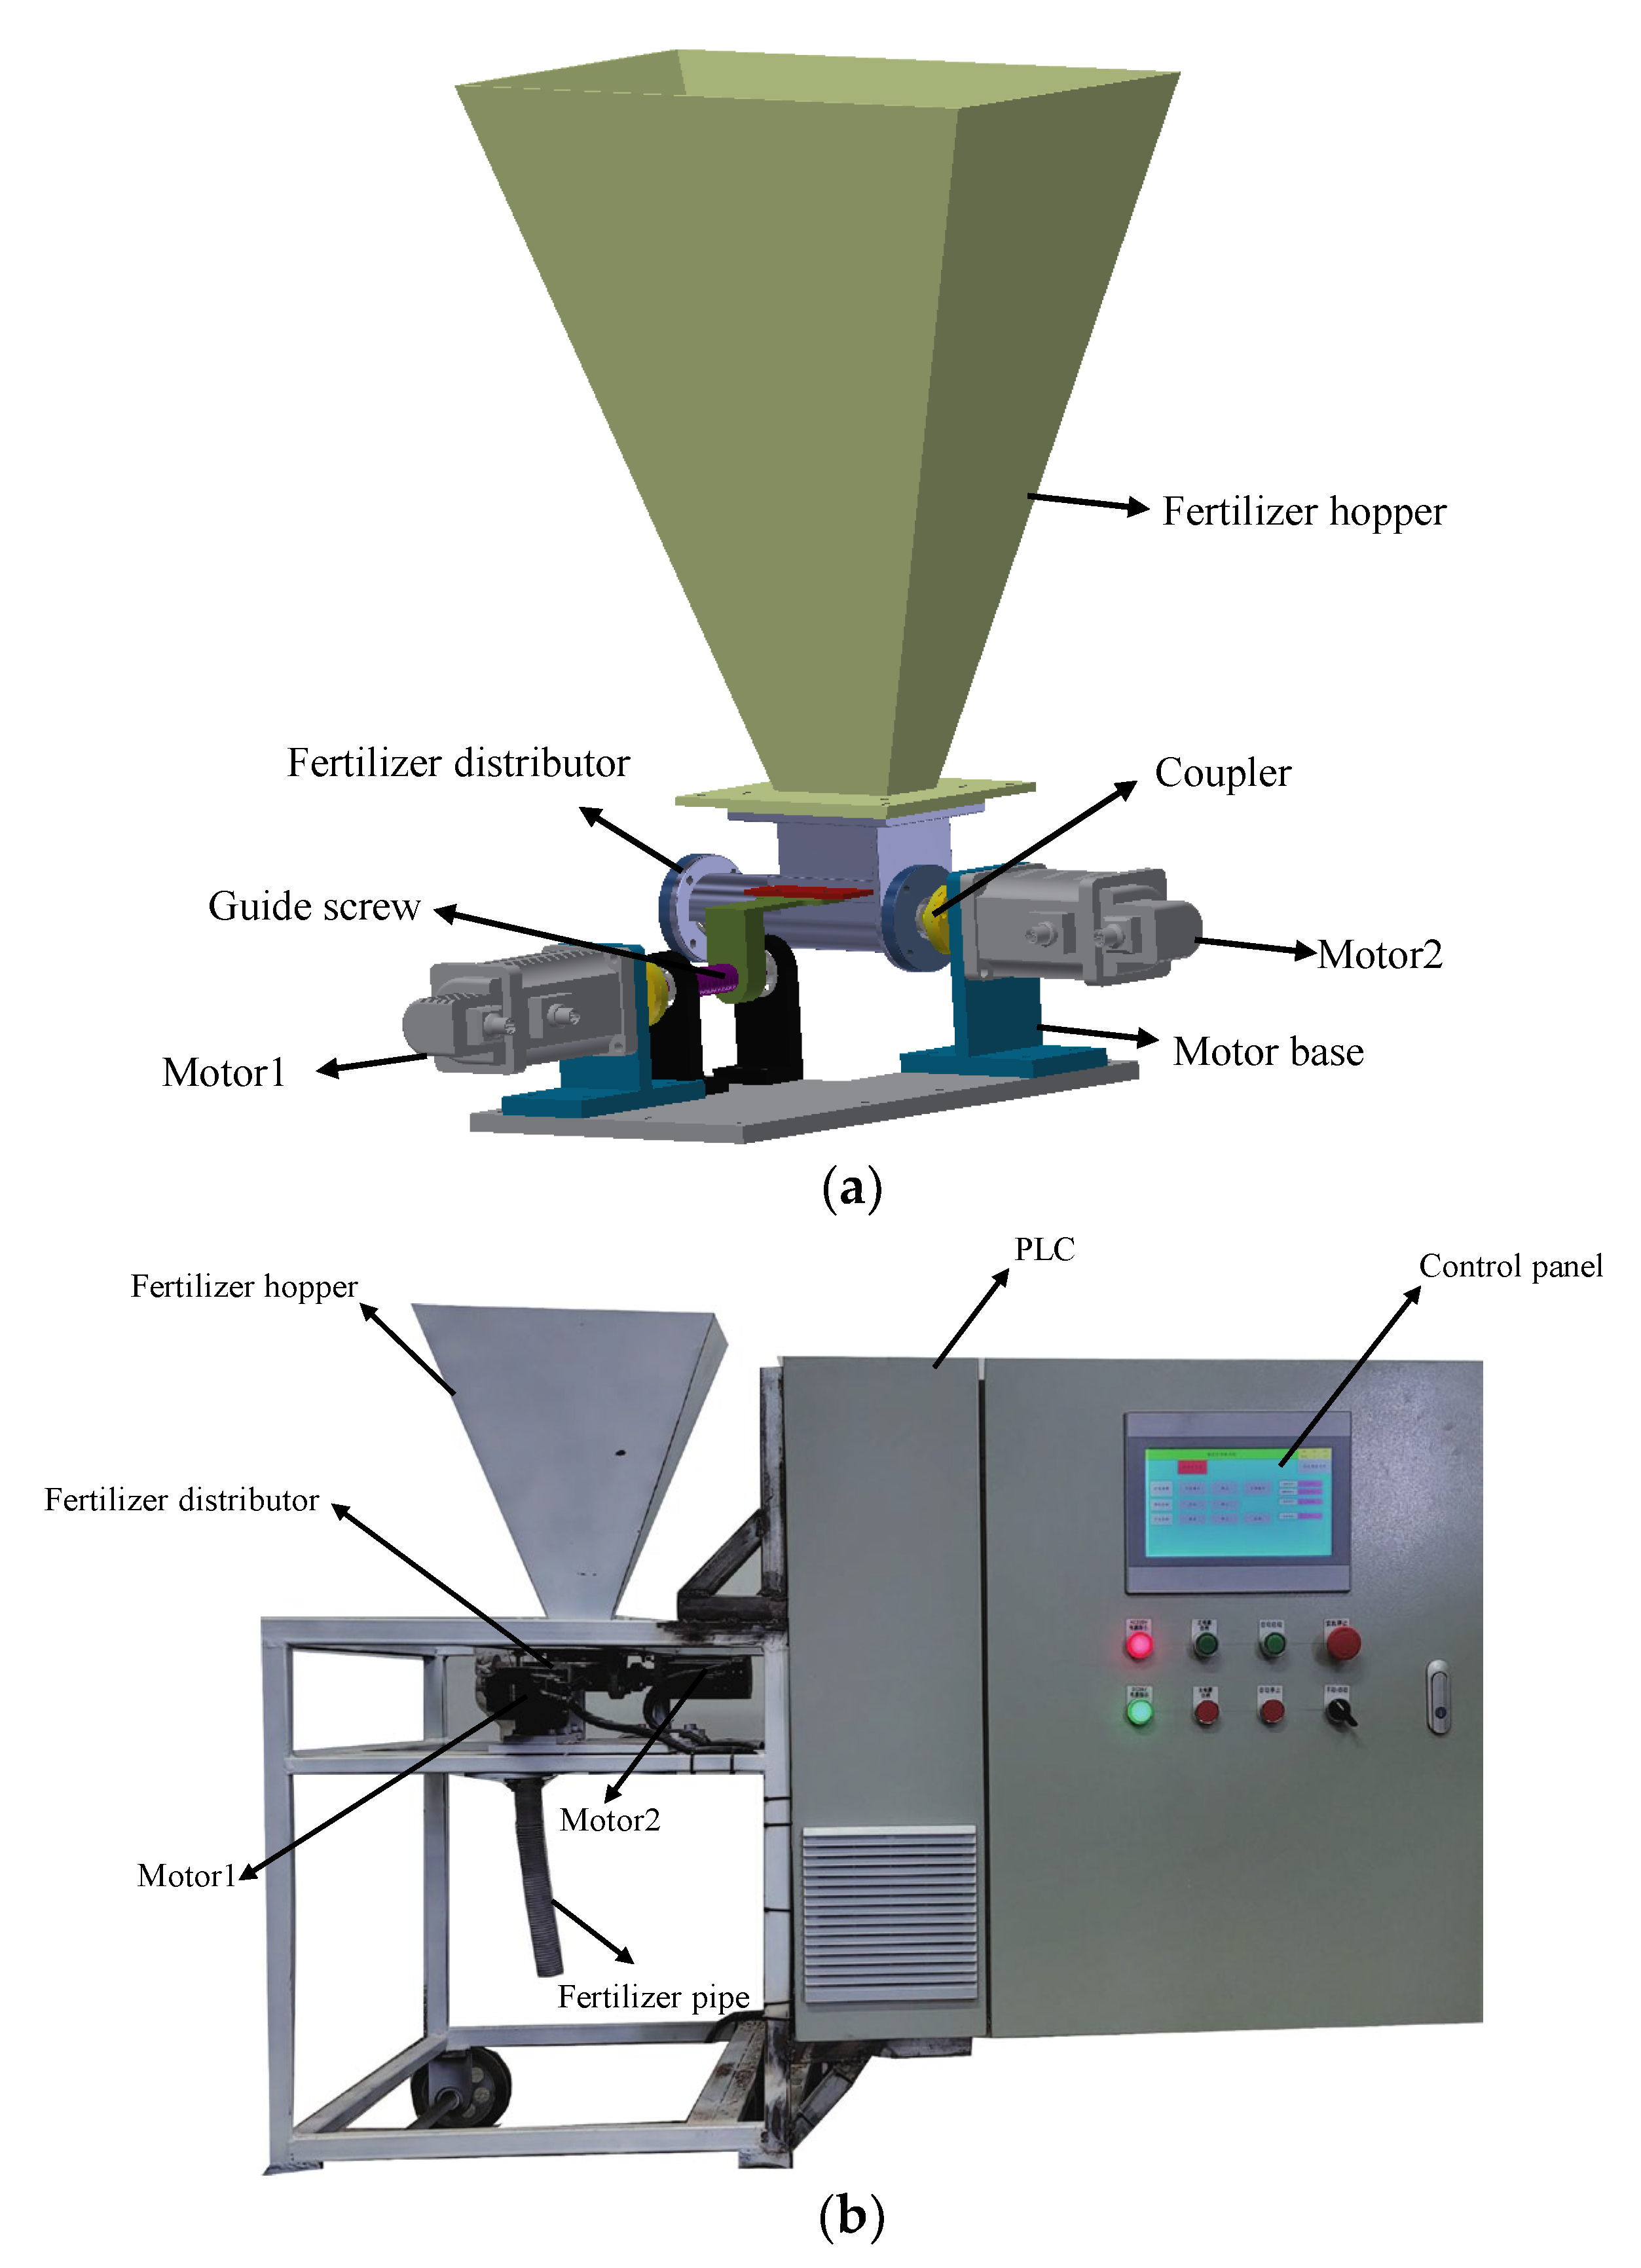
Figure 4.
Schematic diagram of uniformity.
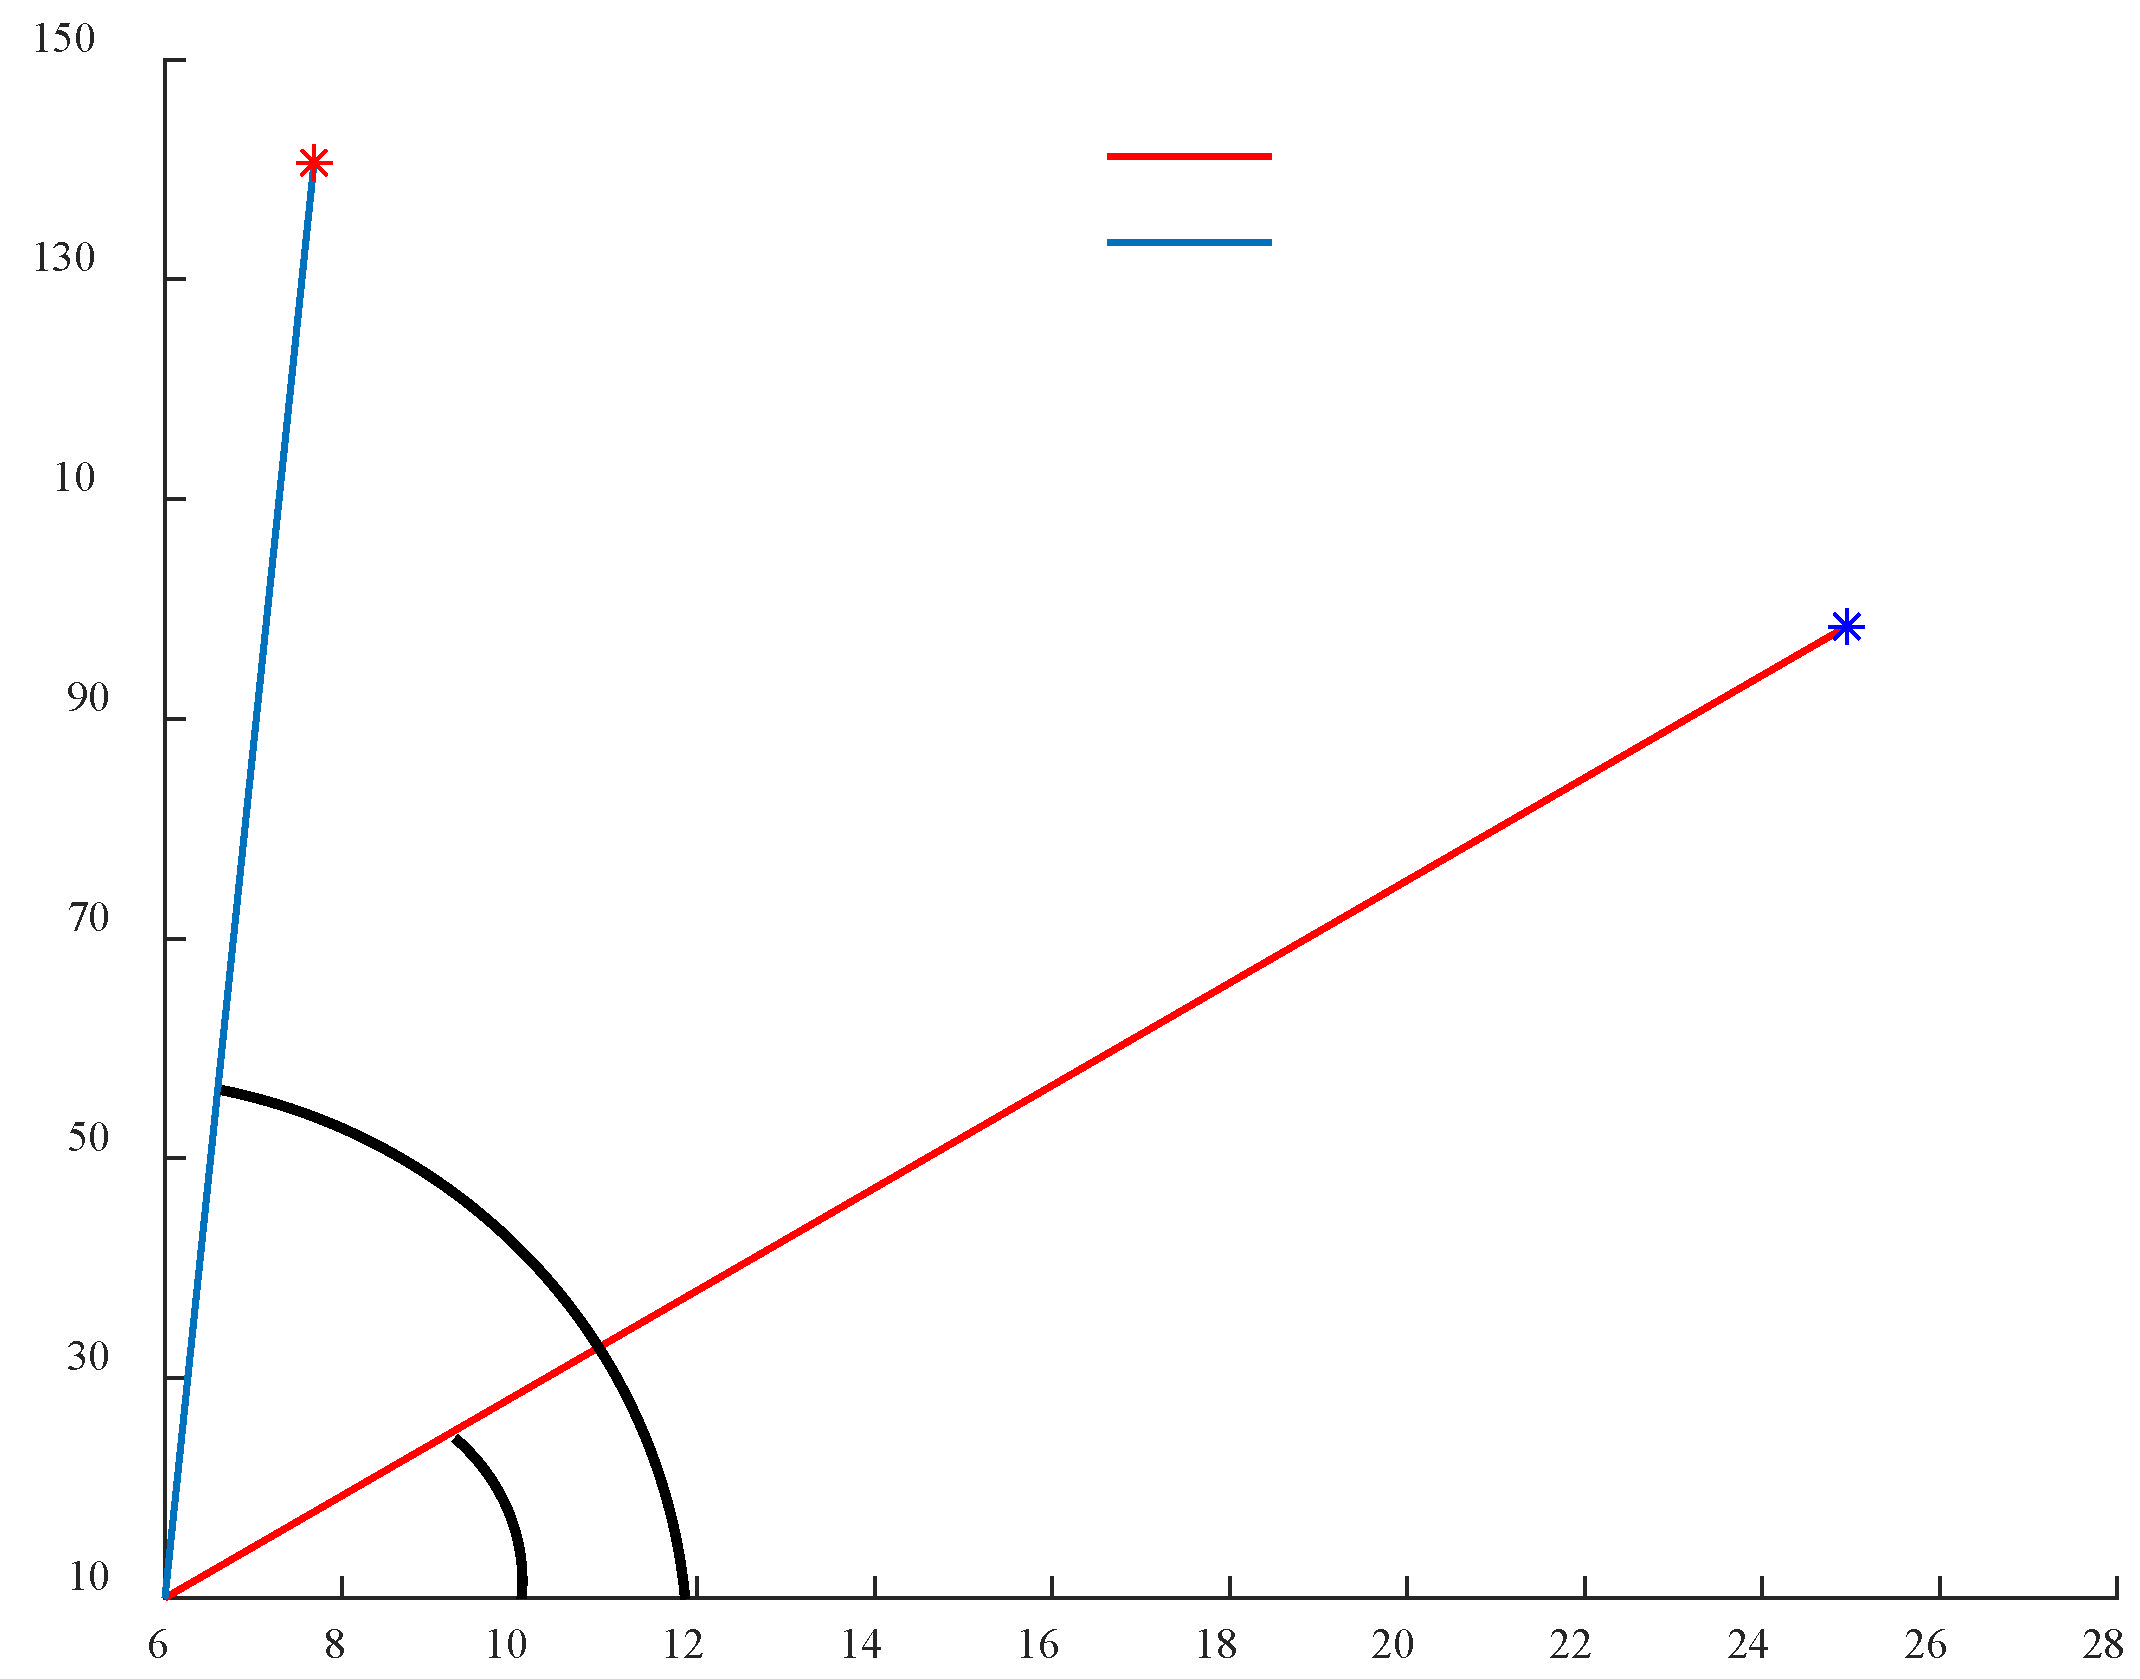
Figure 5.
Differences between the experimental data and predicted data for four machine learning algorithms with an opening length range of 6–8 mm: (a) BPNN; (b) ELM; (c) RVM; (d) SVM.
Figure 5.
Differences between the experimental data and predicted data for four machine learning algorithms with an opening length range of 6–8 mm: (a) BPNN; (b) ELM; (c) RVM; (d) SVM.
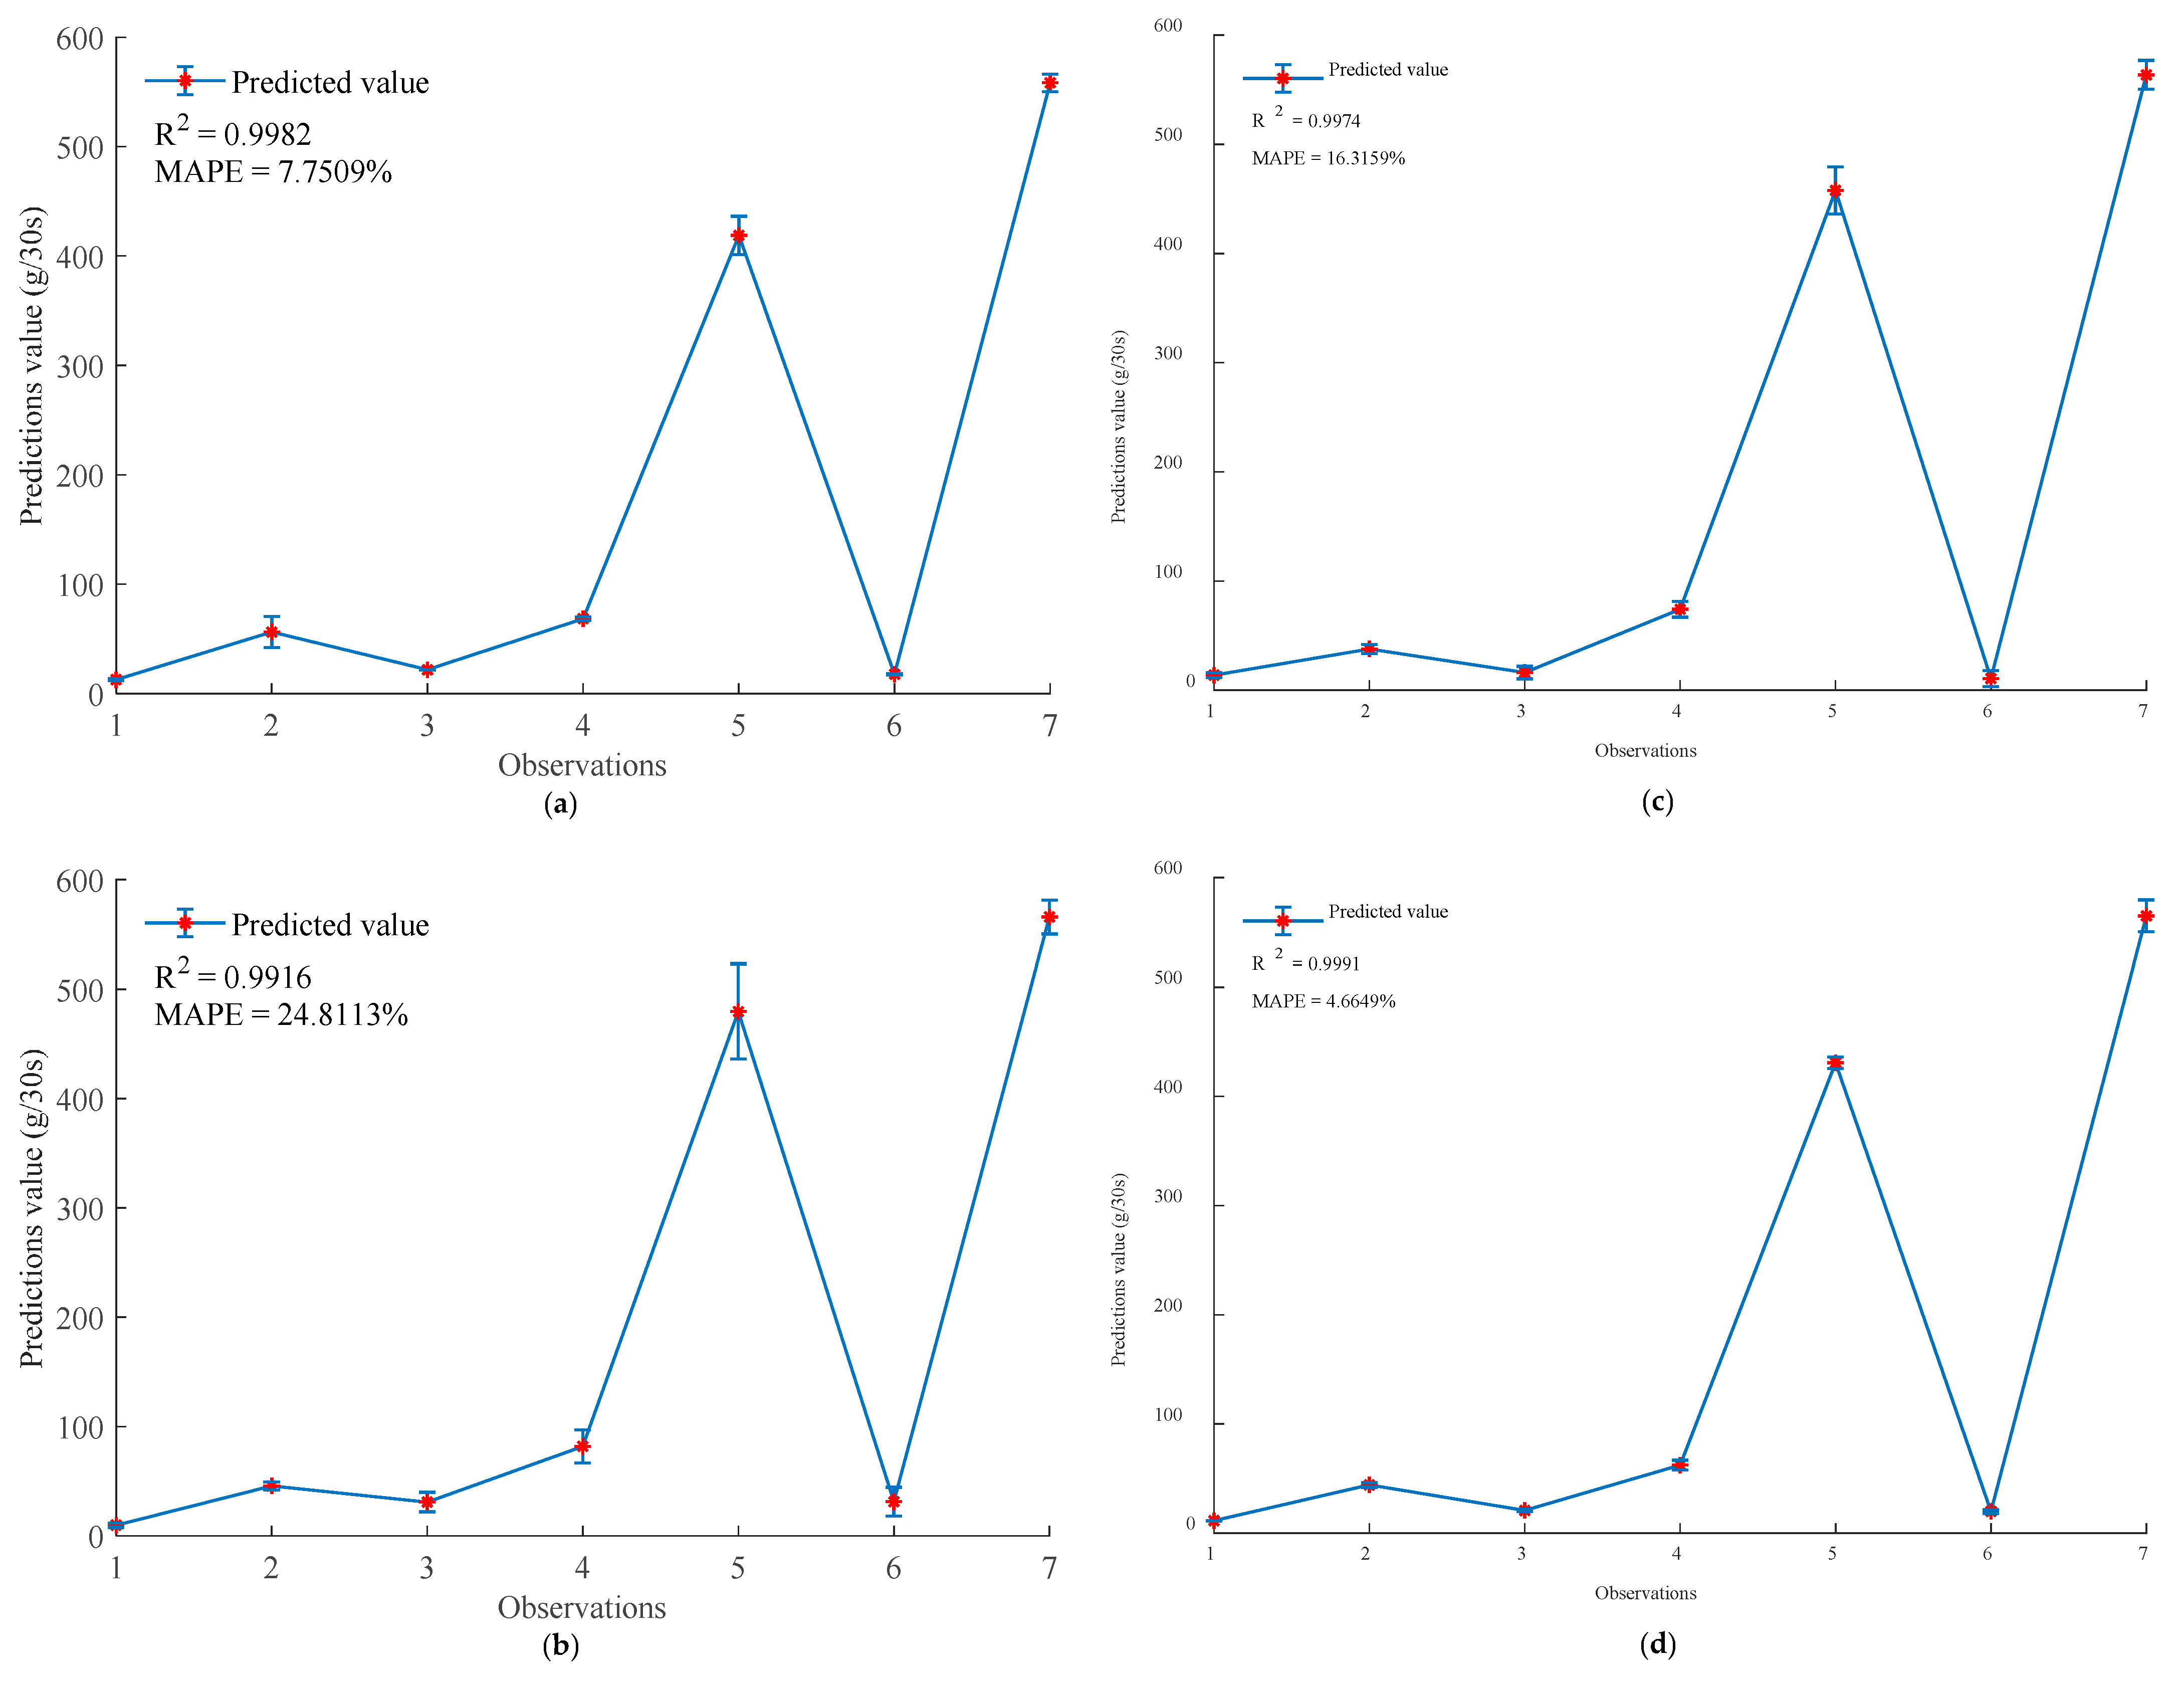
Figure 6.
Deviations between the experimental data and predicted data for four machine learning algorithms with an opening length range of 8–28 mm: (a) BPNN; (b) ELM; (c) RVM; (d) SVM.
Figure 6.
Deviations between the experimental data and predicted data for four machine learning algorithms with an opening length range of 8–28 mm: (a) BPNN; (b) ELM; (c) RVM; (d) SVM.
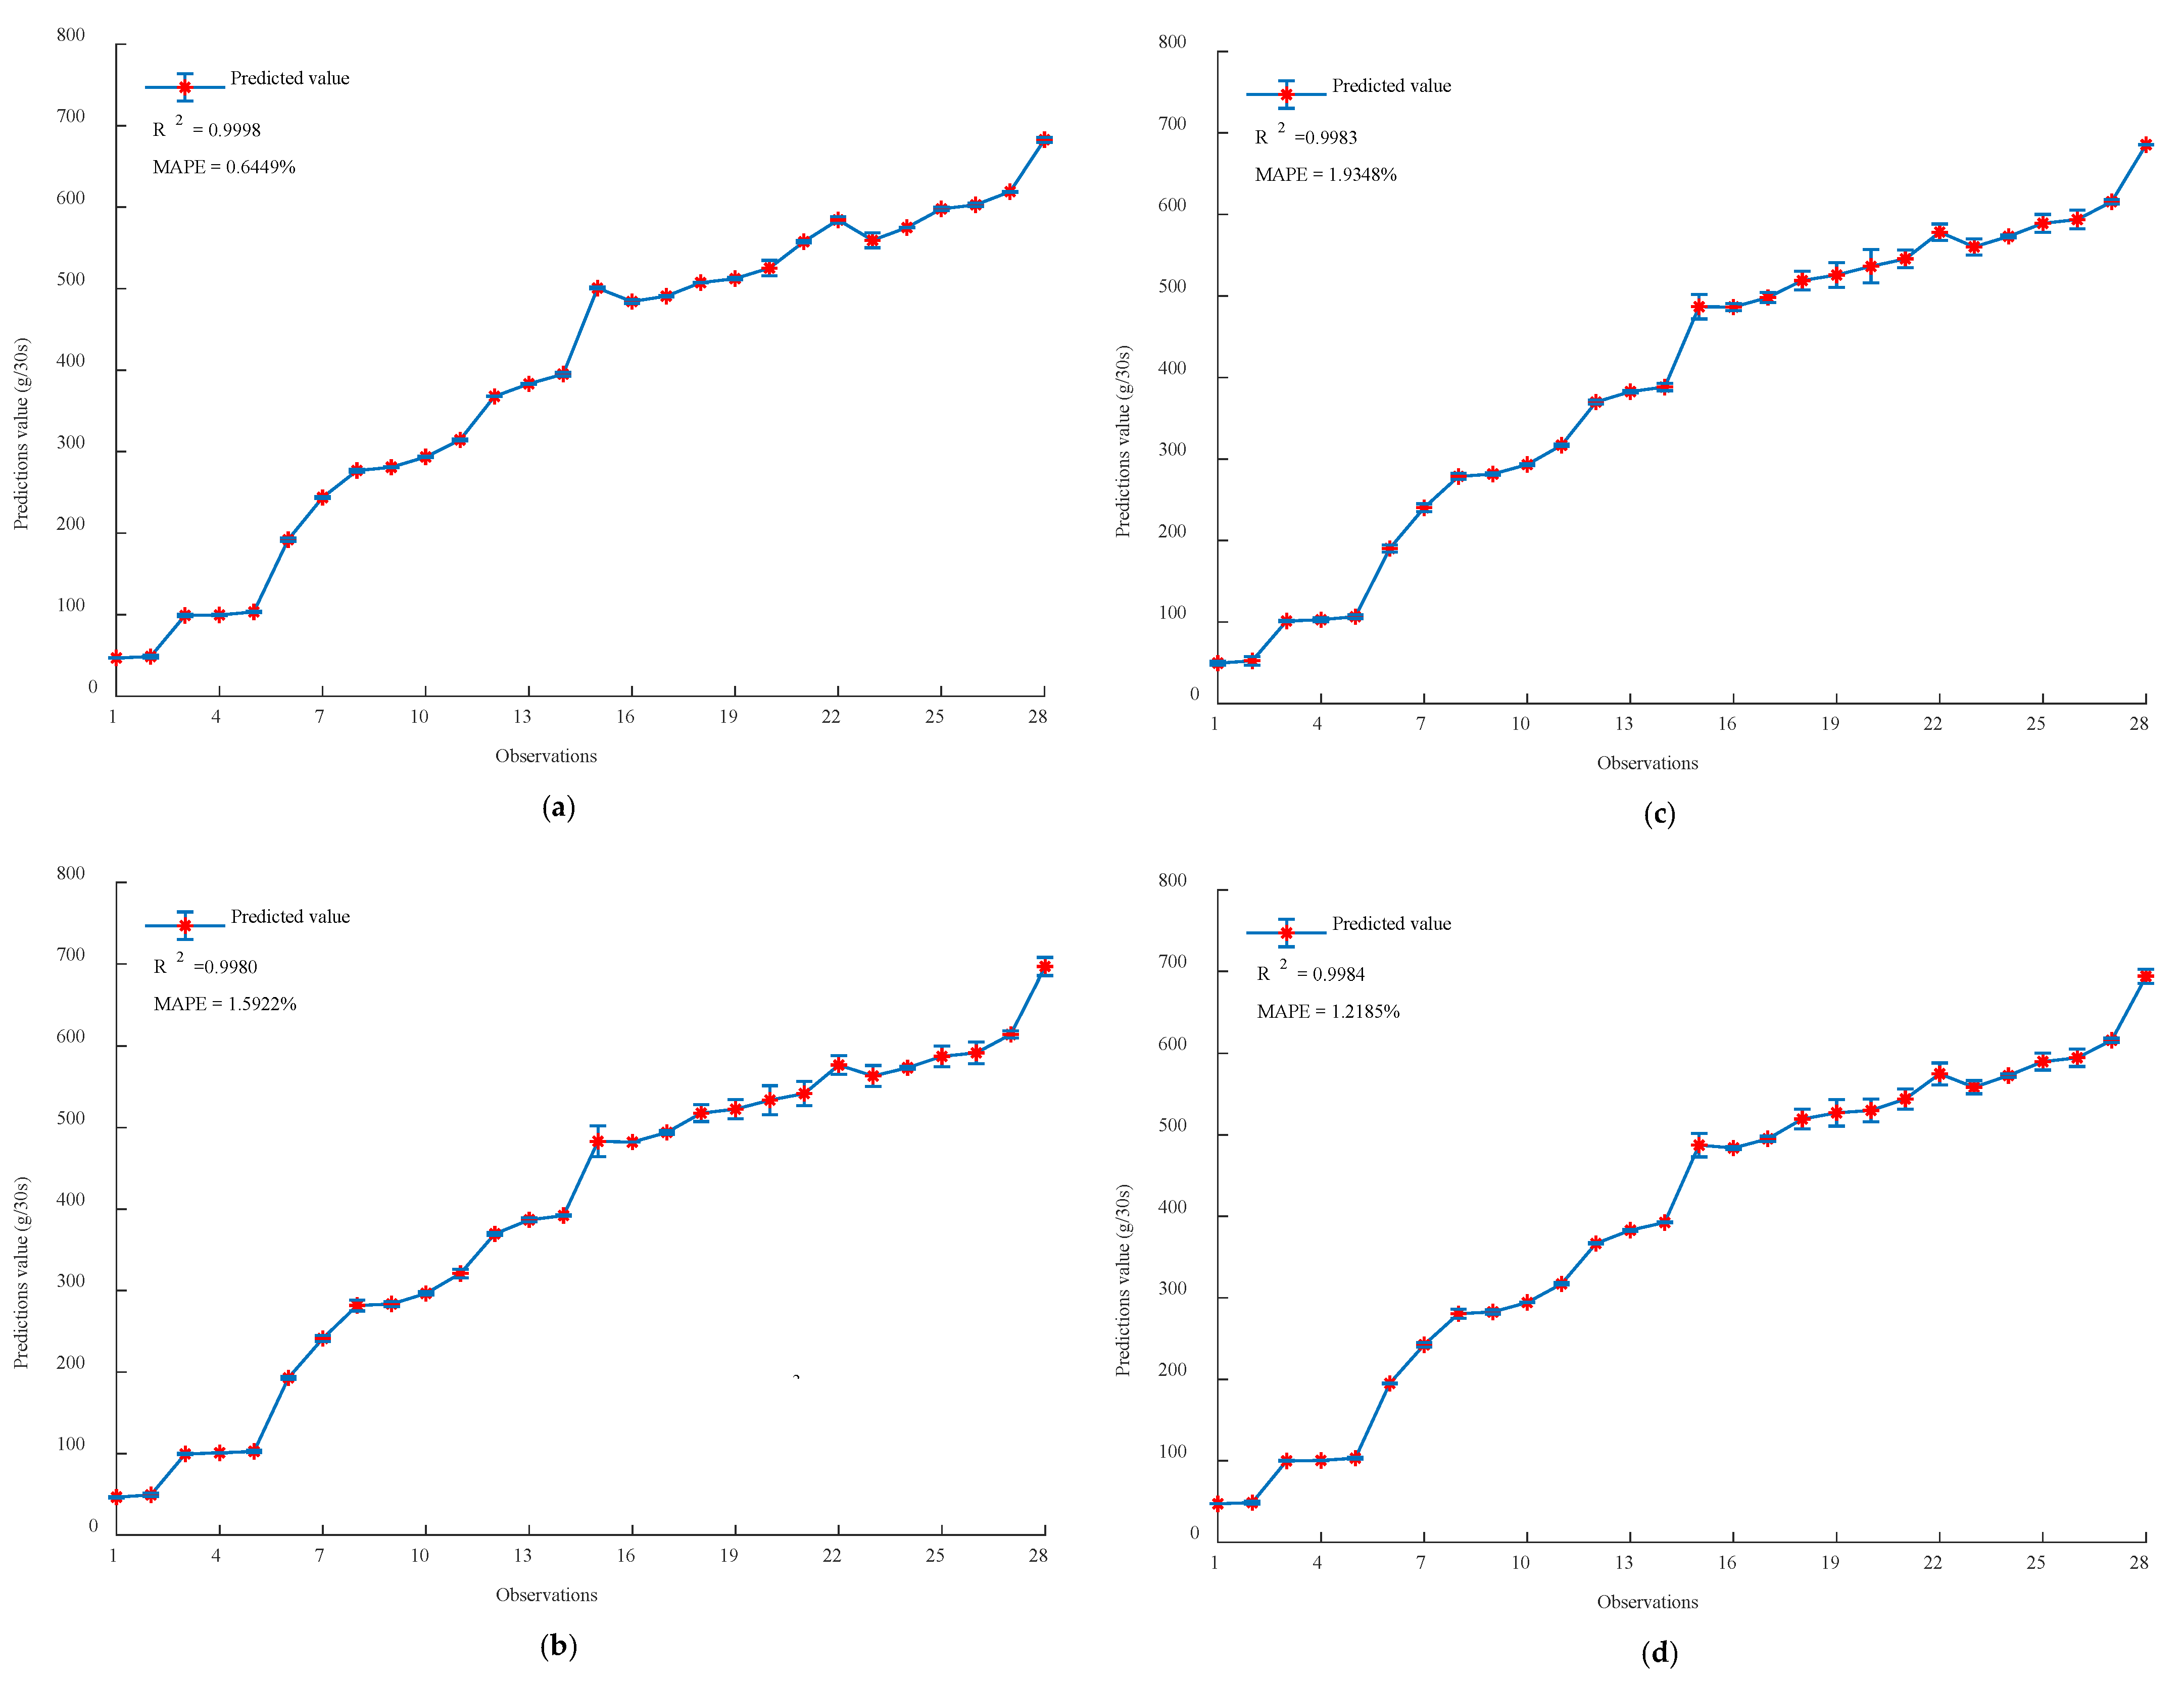
Figure 7.
Comparison of the fertilization accuracies.
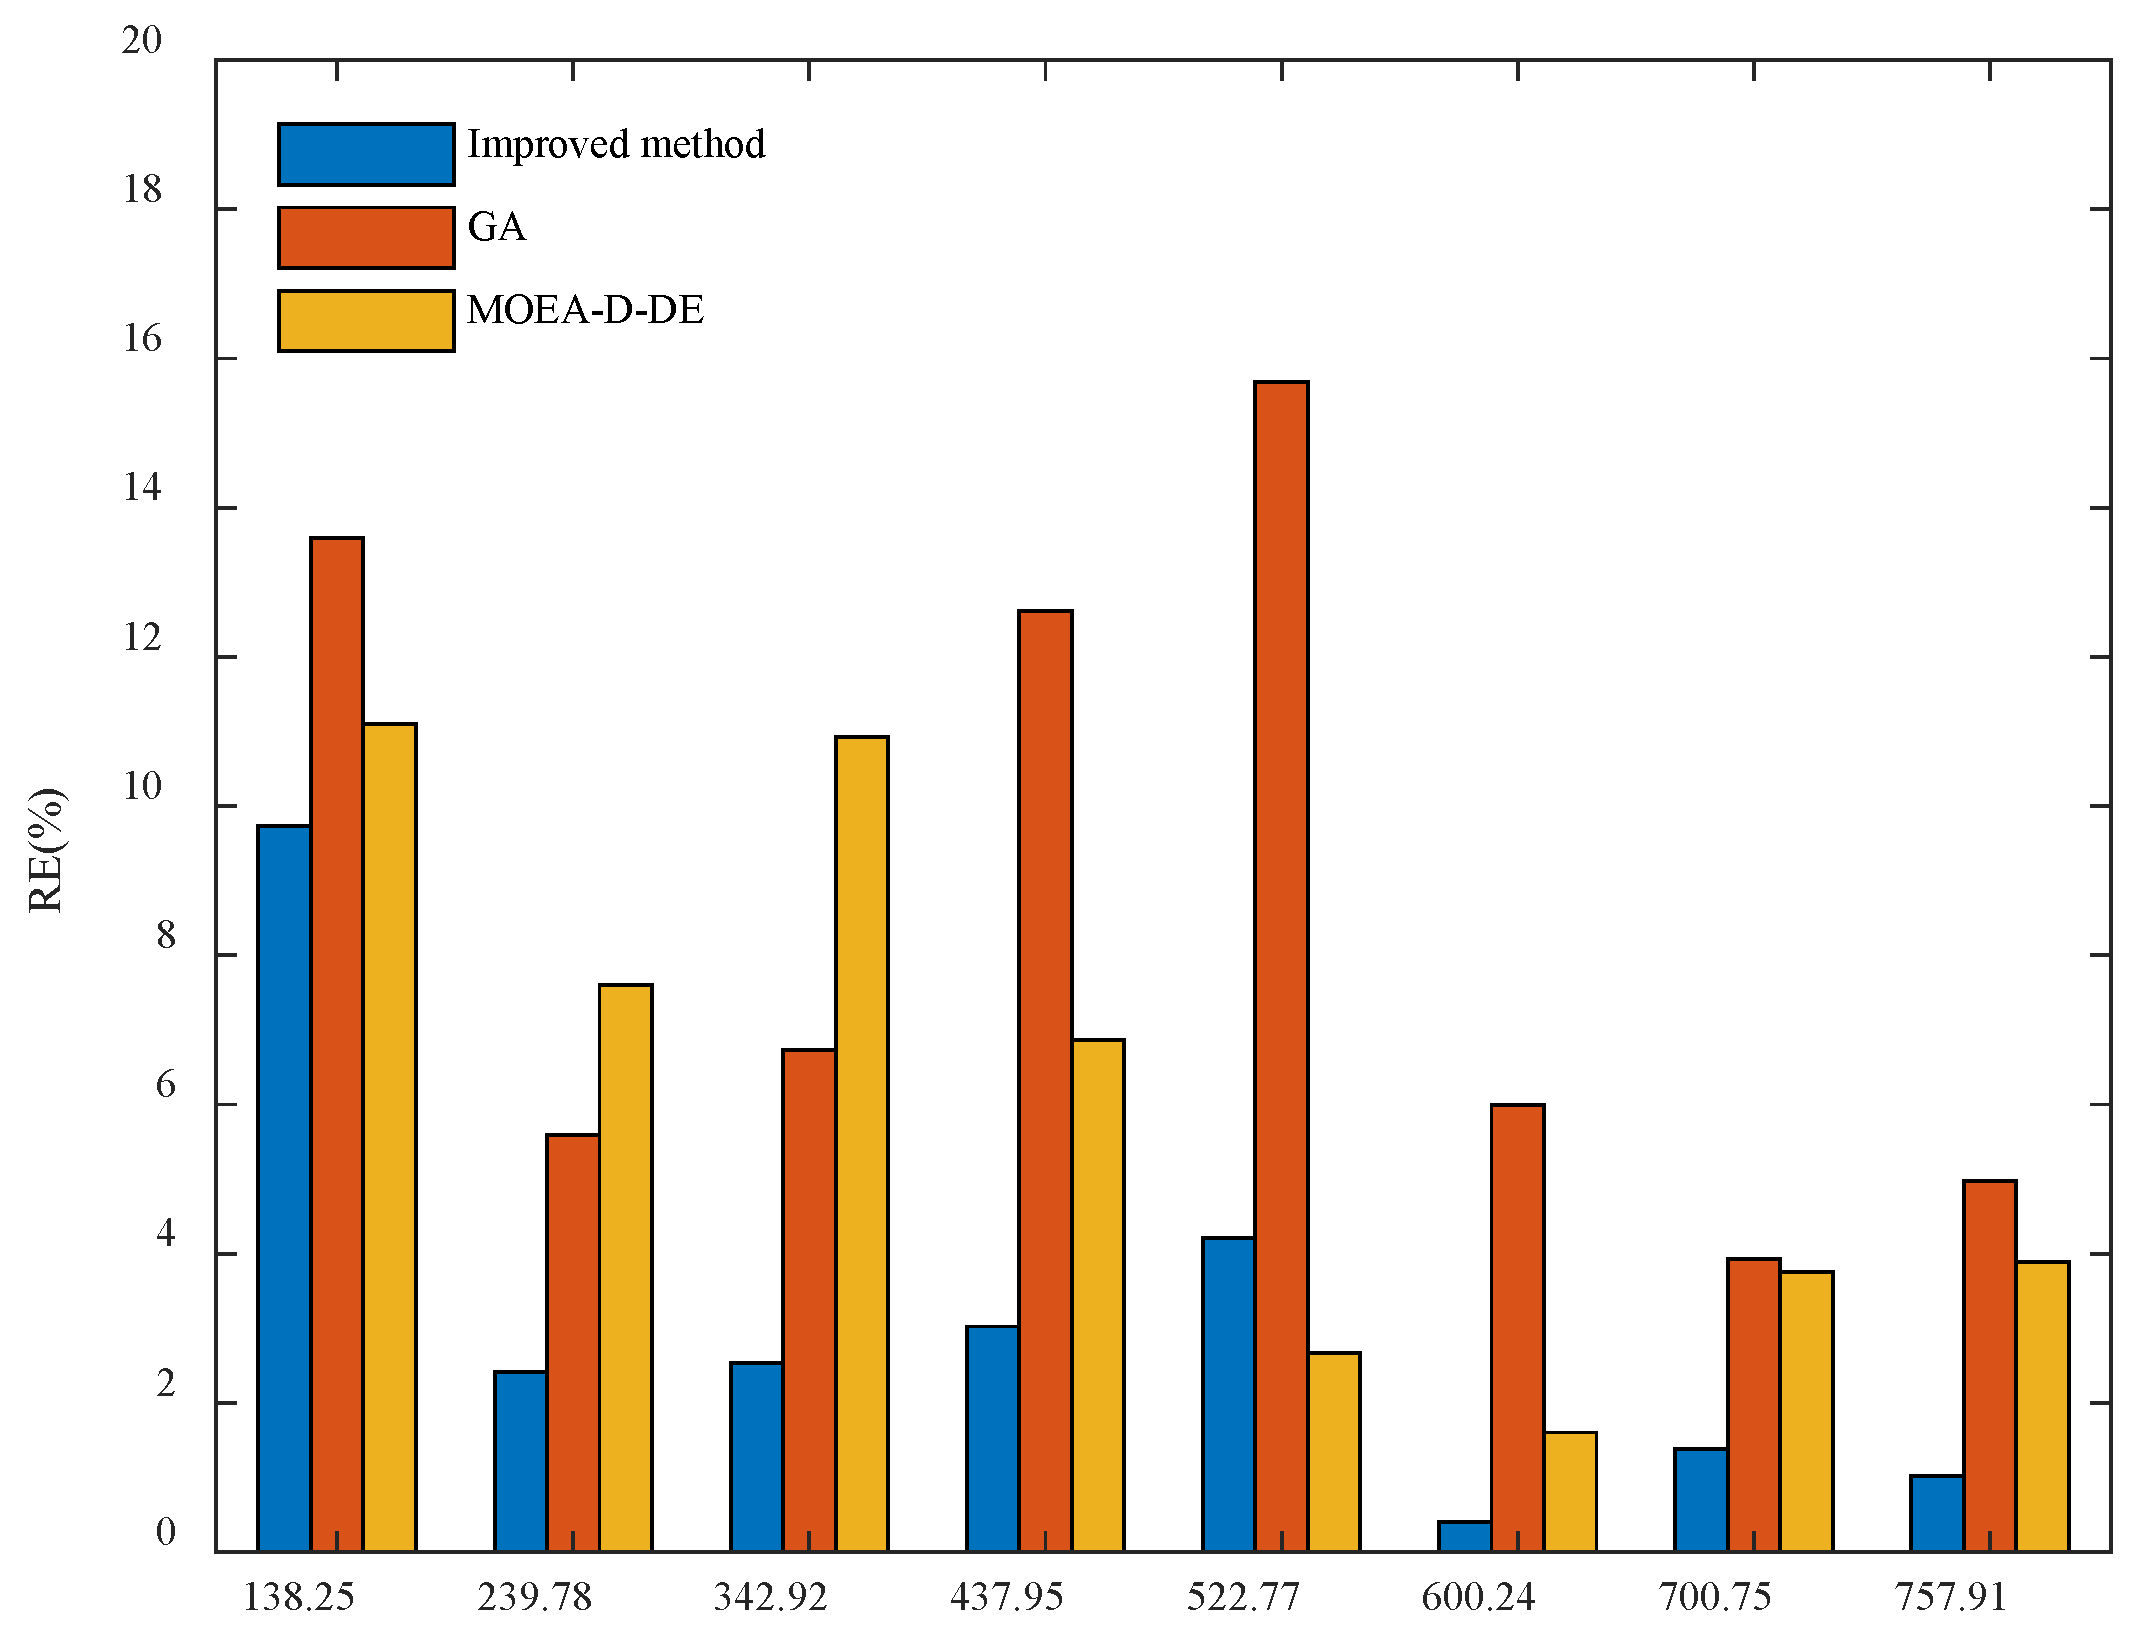
Figure 8.
Comparison of the fertilization uniformities.
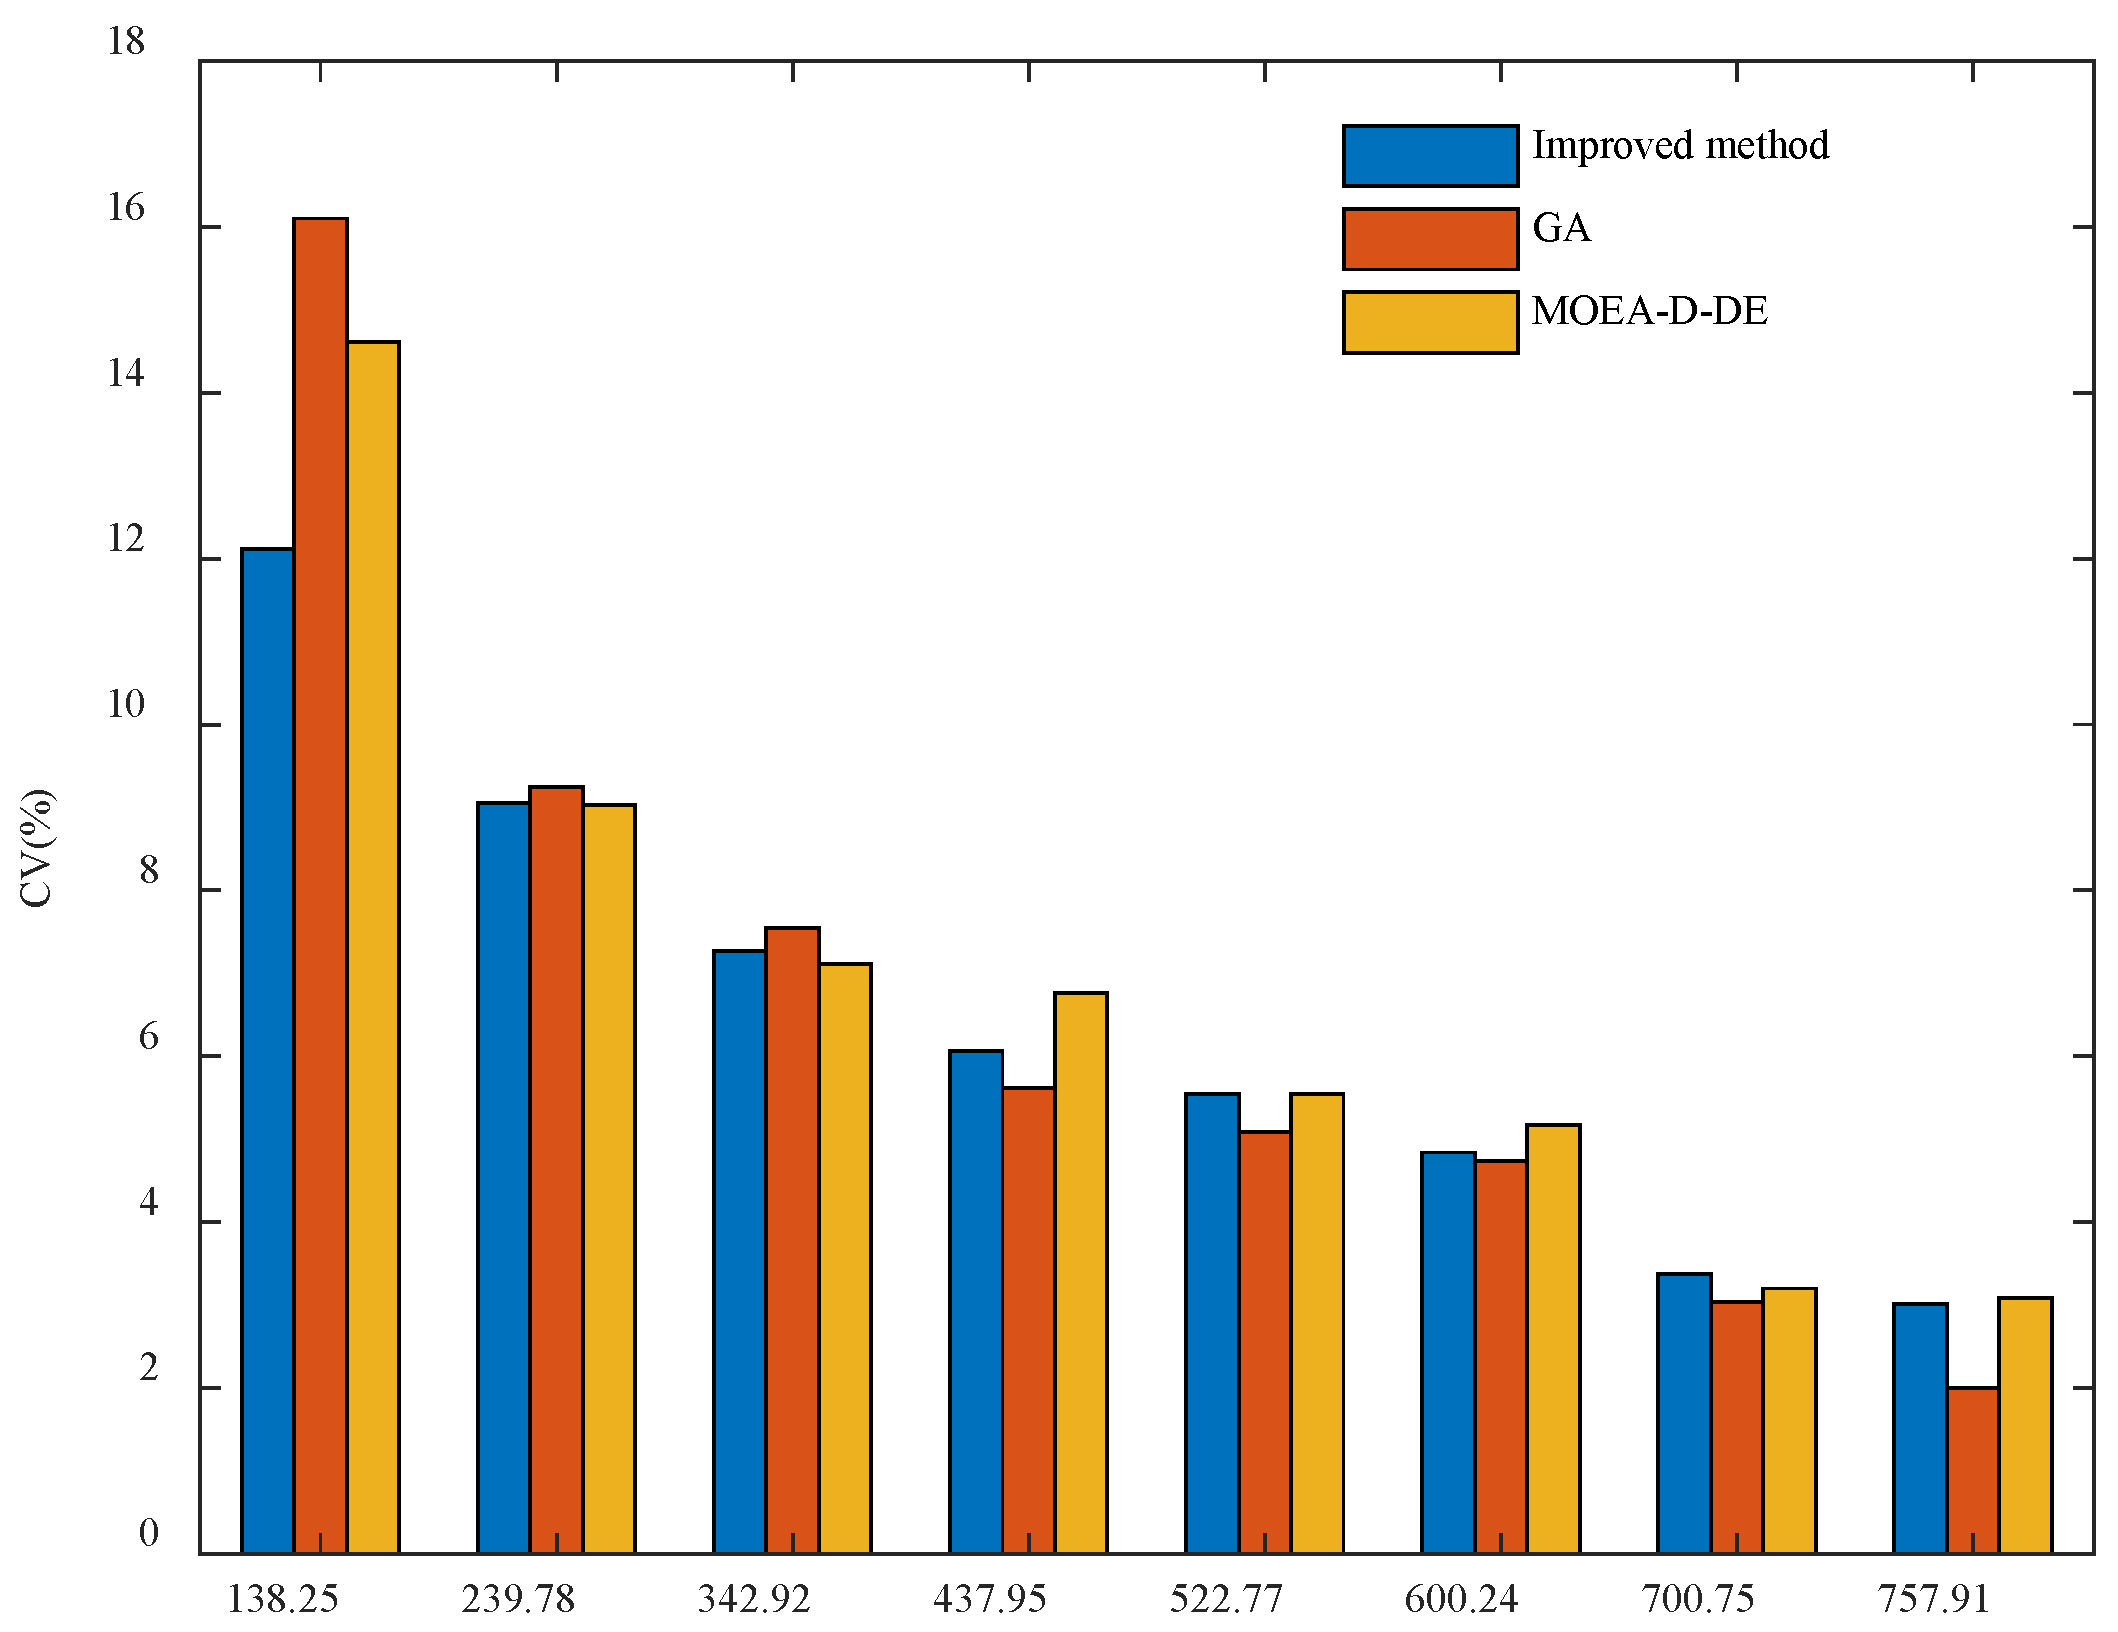
Figure 9.
Comparison of the adjustment times.
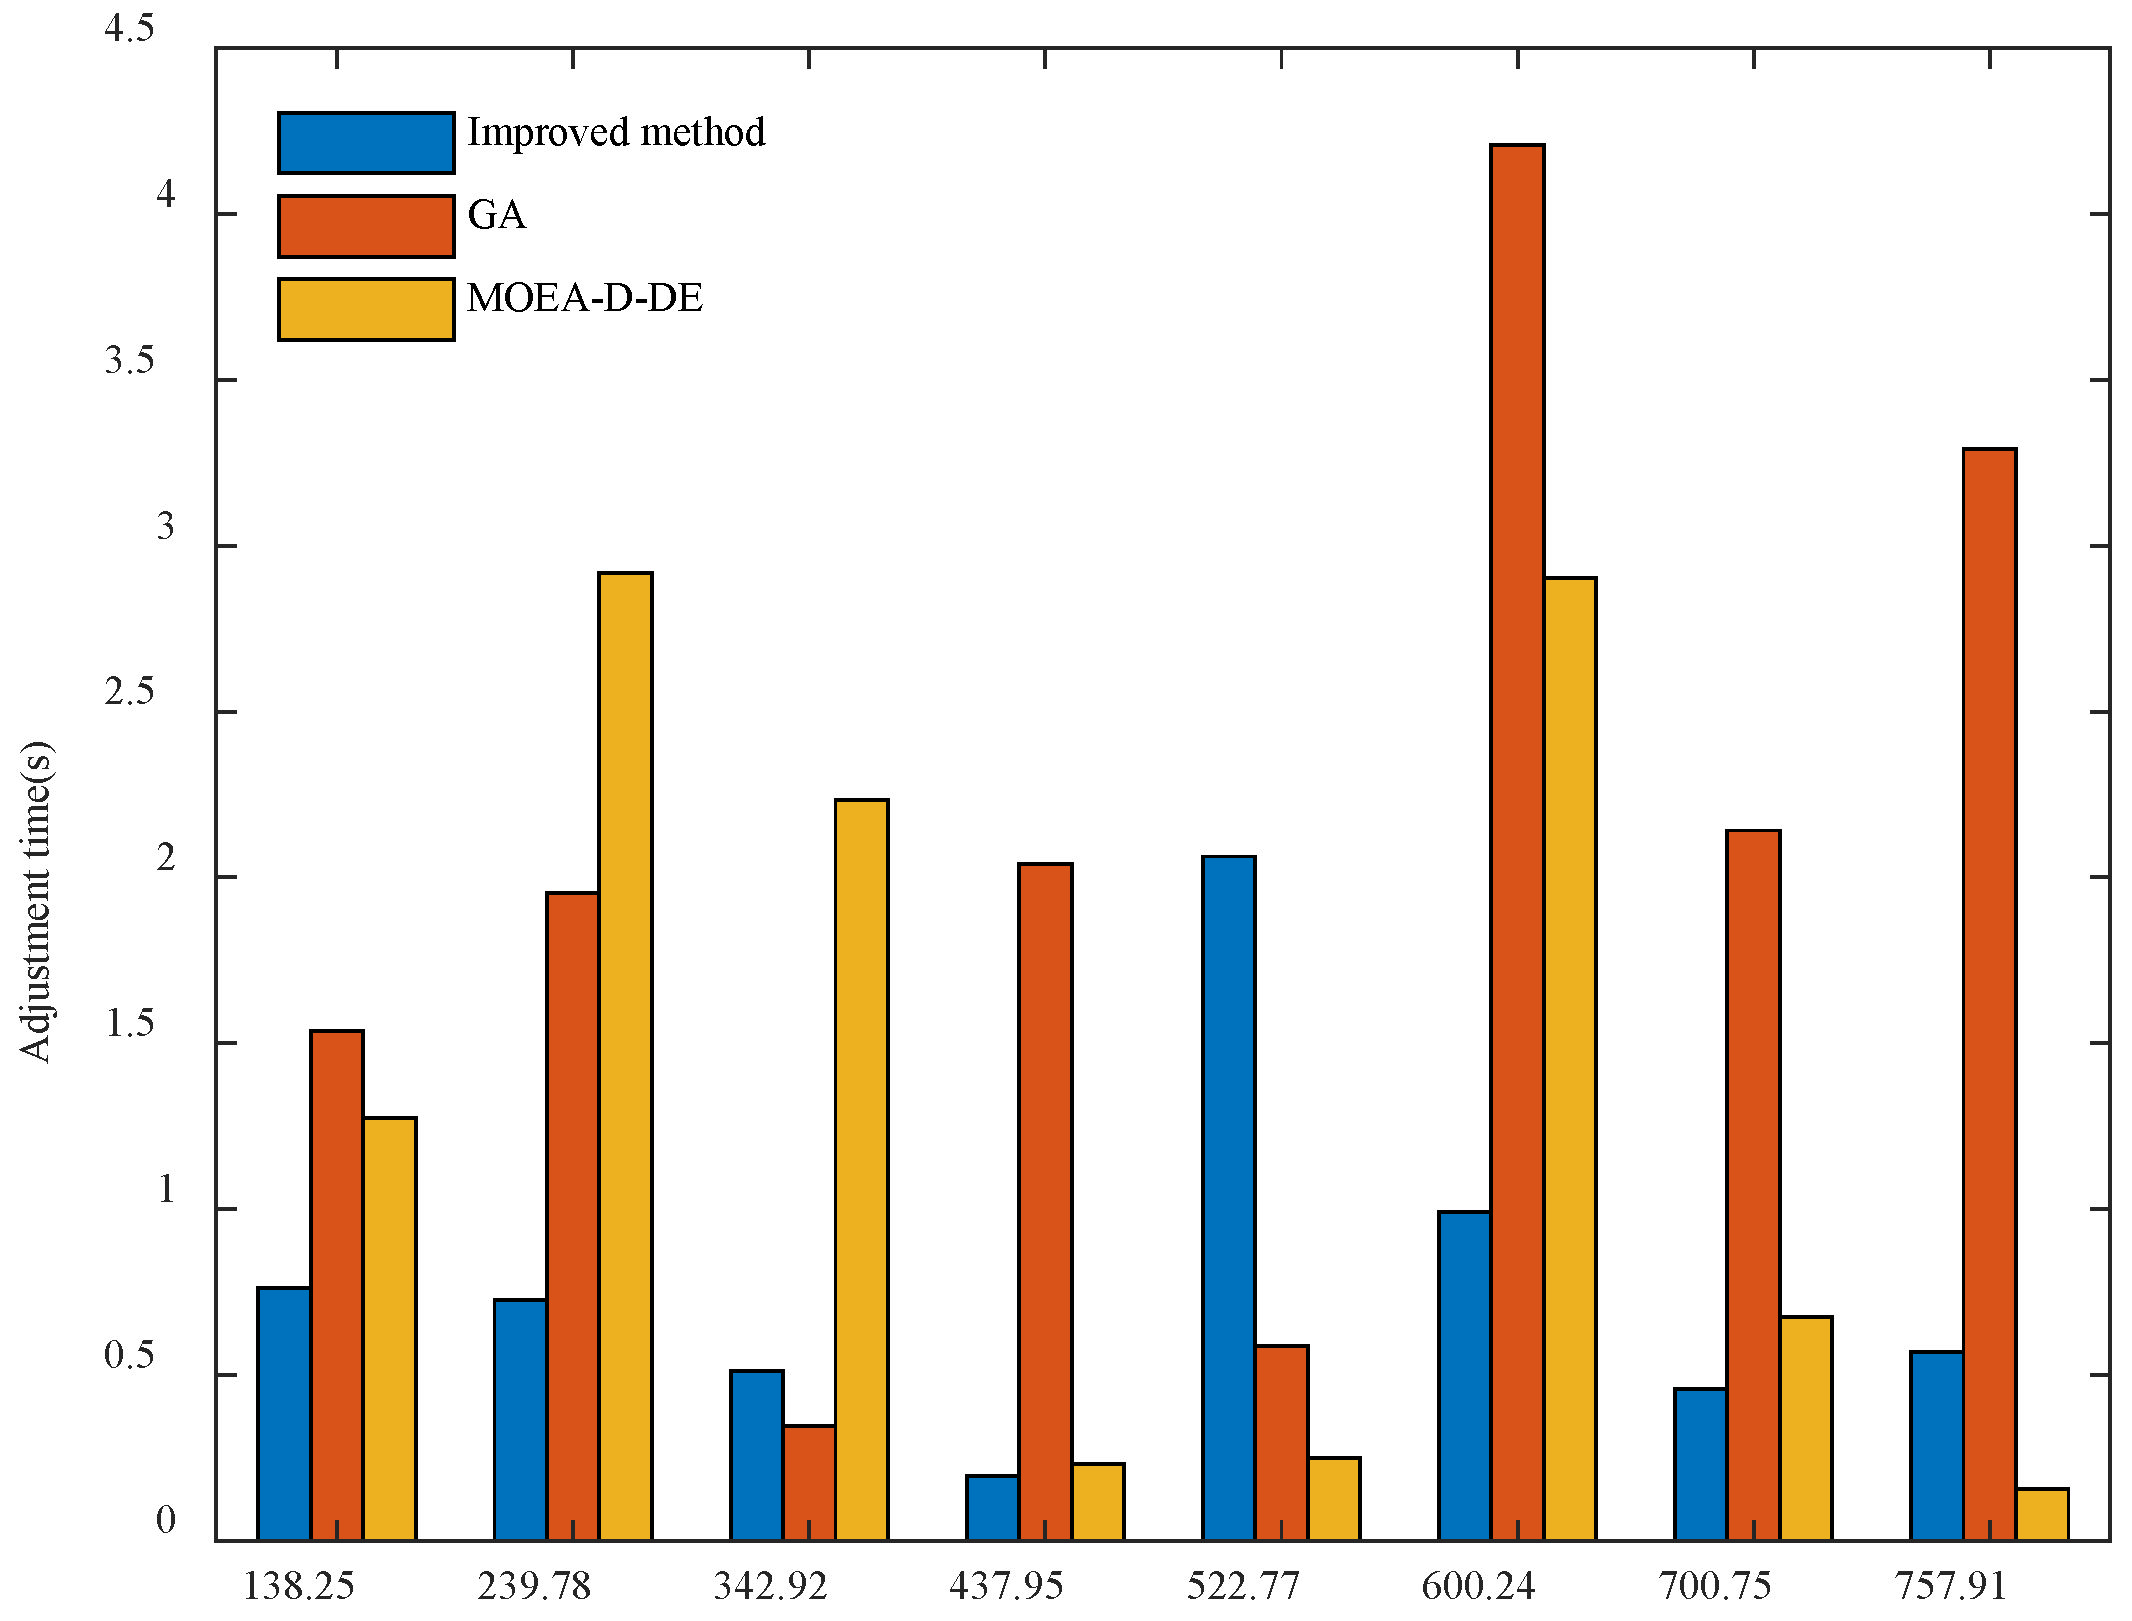
Figure 10.
Comparison of the breakage rates.

Table 1.
Parameters of the bench experiment.
| Parameter | Group | Range | Step Size |
|---|---|---|---|
| Opening length | 23 | 6–12 mm | 0.5 |
| 12–16 mm | 1 | ||
| 16–28 mm | 2 | ||
| Rotational speed | 15 | 10–150 r min−1 | 10 |
Table 2.
Elimination and replacement of outliers.
| No. | Rotational Speed (r min−1) | Opening Length (mm) | Abnormal Data (g 30 s−1) | Replace Data (g 30 s−1) |
|---|---|---|---|---|
| 1 | 30 | 6.5 | 44 | 19 |
| 2 | 40 | 6 | 33 | 11 |
| 3 | 40 | 7 | 121 | 39 |
| 4 | 50 | 7 | 82 | 129 |
| 5 | 70 | 15 | 325 | 336 |
| 6 | 90 | 9 | 394 | 401 |
| 7 | 120 | 6 | 7 | 21 |
| 8 | 120 | 8 | 494 | 511 |
| 9 | 130 | 9 | 523 | 534 |
| 10 | 130 | 11.5 | 569 | 558 |
| 11 | 140 | 8.5 | 549 | 567 |
| 12 | 150 | 8.5 | 566 | 582 |
| 13 | 150 | 16 | 645 | 655 |
Table 3.
Normality test results of the two data segments by the SW approach.
| Groups | Statistics | df | Sig. |
|---|---|---|---|
| A | 0.975 | 4 | 0.873 |
| B | 0.943 | 18 | 0.325 |
Table 4.
The t-test results of the two data segments.
| Levene’s Test for Equality of Variances | t-Test for Equality of Means | 95% Confidence Interval | |||||||
|---|---|---|---|---|---|---|---|---|---|
| F | Sig. | t | df | Sig. (2-Tailed) | Mean Difference | Std. Error Difference | Lower | Upper | |
| Equal variances assumed | 95.199 | 0 | 7.49 | 20 | 0 | 1.19174 | 0.15911 | 0.85985 | 1.52364 |
| Equal variances not assumed | 3.207 | 3 | 0.049 | 1.19174 | 0.37156 | 0.00930 | 2.37419 | ||
Table 5.
Test samples of segment A.
| No. | Rotational Speed (r min−1) | Opening Length (mm) | Fertilization Rate Q (g 30 s−1) |
|---|---|---|---|
| 1 | 10 | 6 | 11.65 |
| 2 | 40 | 7 | 42.00 |
| 3 | 50 | 6.5 | 21.95 |
| 4 | 60 | 7 | 66.85 |
| 5 | 100 | 8 | 436.20 |
| 6 | 110 | 6 | 18.15 |
| 7 | 140 | 8 | 550.30 |
Table 6.
Test samples of segment B.
| No. | Rotational Speed (r min−1) | Opening Length (mm) | Fertilization Rate (g 30 s−1) | No. | Rotational Speed (r min−1) | Opening Length (mm) | Fertilization Rate (g 30 s−1) |
|---|---|---|---|---|---|---|---|
| 1 | 10 | 10 | 47.30 | 15 | 100 | 22 | 501.85 |
| 2 | 10 | 12 | 47.10 | 16 | 110 | 10 | 482.05 |
| 3 | 20 | 10.5 | 100.45 | 17 | 110 | 12 | 491.75 |
| 4 | 20 | 11.5 | 100.65 | 18 | 110 | 18 | 507.35 |
| 5 | 20 | 26 | 104.25 | 19 | 110 | 20 | 510.70 |
| 6 | 40 | 8.5 | 194.45 | 20 | 110 | 28 | 515.90 |
| 7 | 50 | 9.5 | 245.00 | 21 | 120 | 14 | 556.40 |
| 8 | 60 | 8.5 | 274.95 | 22 | 120 | 28 | 588.25 |
| 9 | 60 | 9 | 280.25 | 23 | 140 | 8 | 550.30 |
| 10 | 60 | 15 | 294.35 | 24 | 140 | 9 | 575.00 |
| 11 | 70 | 8 | 315.65 | 25 | 140 | 10.5 | 600.05 |
| 12 | 80 | 10 | 367.55 | 26 | 140 | 11 | 605.15 |
| 13 | 80 | 16 | 384.10 | 27 | 140 | 14 | 618.50 |
| 14 | 80 | 20 | 392.90 | 28 | 150 | 26 | 685.85 |
Table 7.
Comparison of the prediction accuracies at the opening length of 8 mm.
| Rotational Speed (r min−1) | Experimental Value (g 30 s−1) | Predict Value (g 30 s−1) | Relative Error (%) | ||
|---|---|---|---|---|---|
| Segment A | Segment B | Segment A | Segment B | ||
| 10 | 45.15 | 46.79 | 44.65 | 0.036323 | 0.011074 |
| 20 | 95.45 | 95.47 | 96.16 | 0.000210 | 0.007438 |
| 30 | 146.10 | 142.75 | 144.71 | 0.022930 | 0.009514 |
| 40 | 193.80 | 187.92 | 188.31 | 0.030341 | 0.028328 |
| 50 | 230.55 | 230.85 | 232.56 | 0.001301 | 0.008718 |
| 60 | 271.80 | 271.91 | 271.18 | 0.000405 | 0.002281 |
| 70 | 315.65 | 311.76 | 314.46 | 0.012324 | 0.00377 |
| 80 | 350.75 | 351.17 | 351.14 | 0.001197 | 0.001112 |
| 90 | 390.75 | 390.77 | 390.69 | 0.000051 | 0.000154 |
| 100 | 436.20 | 430.82 | 441.70 | 0.012334 | 0.012609 |
| 110 | 468.60 | 471.07 | 467.81 | 0.005271 | 0.001686 |
| 120 | 509.80 | 510.65 | 509.80 | 0.001667 | 0 |
| 130 | 520.40 | 548.19 | 519.84 | 0.053401 | 0.001076 |
| 140 | 550.30 | 581.87 | 559.38 | 0.057369 | 0.016500 |
| 150 | 573.95 | 609.67 | 575.37 | 0.062235 | 0.002474 |
| Average relative error | 0.019824 | 0.007116 | |||
Table 8.
Prediction performance before and after the data segmentation.
| Algorithm | Before Segmentation | After Segmentation | ||||||
|---|---|---|---|---|---|---|---|---|
| 6–8 mm | 8–28 mm | 6–8 mm | 8–28 mm | |||||
| MAPE | MAPE | MAPE | MAPE | |||||
| SVM | 0.9789 | 23.4581% | 0.9833 | 16.7325% | 0.9991 | 4.6649% | 0.9984 | 1.2185% |
| BPNN | 0.9721 | 24.1568% | 0.9892 | 15.4239% | 0.9982 | 7.7509% | 0.9998 | 0.6449% |
| ELM | 0.9735 | 24.3684% | 0.9749 | 19.3415% | 0.9916 | 24.8113% | 0.9980 | 1.5922% |
| RVM | 0.9689 | 25.6428% | 0.9821 | 18.5963% | 0.9974 | 16.3159% | 0.9983 | 1.9348% |
| Mean value | 0.9734 | 24.4065% | 0.9824 | 17.5236% | 0.9966 | 13.3858% | 0.9986 | 1.3476% |
Table 9.
Results of the breakage rate at various rotational speeds.
| Before Measurement (g) | After Measurement (g) | Error Amount (g) | Breakage Rate (%) | Average Breakage Rate (%) | |
|---|---|---|---|---|---|
| 100 | 626 | 621 | 5 | 0.80 | 0.69 |
| 362 | 360 | 2 | 0.55 | ||
| 410 | 407 | 3 | 0.73 | ||
| 125 | 660 | 648 | 12 | 1.82 | 1.87 |
| 469 | 460 | 9 | 1.92 | ||
| 638 | 626 | 12 | 1.88 | ||
| 150 | 529 | 510 | 19 | 3.59 | 3.5 |
| 510 | 489 | 21 | 4.12 | ||
| 679 | 660 | 19 | 2.80 |
Table 10.
Fertilization decisions acquired by the three methods for different target fertilization rates.
Table 10.
Fertilization decisions acquired by the three methods for different target fertilization rates.
| No. | Target Fertilizer Rate (kg ha−1) | Improved Method | GA | MOEA-D-DE | |||
|---|---|---|---|---|---|---|---|
| Rotational Speed (r min−1) | Opening Length (mm) | Rotational Speed (r min−1) | Opening Length (mm) | Rotational Speed (r min−1) | Opening Length (mm) | ||
| 1 | 138.25 | 33.9 | 7.65 | 23.07 | 9.33 | 25 | 8.79 |
| 2 | 239.78 | 40.92 | 9.22 | 40.64 | 13.56 | 45 | 15.09 |
| 3 | 342.92 | 59.75 | 10.33 | 59.57 | 12.9 | 63.73 | 10.25 |
| 4 | 437.95 | 78.82 | 9.91 | 92.57 | 17.32 | 79.18 | 9.75 |
| 5 | 522.77 | 92.61 | 14.38 | 108.29 | 18.59 | 95.01 | 9.21 |
| 6 | 600.24 | 104.54 | 17.79 | 114.53 | 9.47 | 106.36 | 15.5 |
| 7 | 700.75 | 123.18 | 18.78 | 133.34 | 11.79 | 125.01 | 16.96 |
| 8 | 757.91 | 138.5 | 17.55 | 148.42 | 18.29 | 135.01 | 16.90 |
Table 11.
Comparison of the HV indicators of the evolutionary multi-objective optimization solution set.
Table 11.
Comparison of the HV indicators of the evolutionary multi-objective optimization solution set.
| Algorithms | HV1 | HV2 | HV3 | HV4 | HV5 | Mean HV |
|---|---|---|---|---|---|---|
| NSGA-III | 0.2024 | 0.2381 | 0.1905 | 0.1986 | 0.1667 | 0.1993 |
| MOEA-D | 0.1824 | 0.2156 | 0.1852 | 0.1914 | 0.1629 | 0.1937 |
Publisher’s Note: MDPI stays neutral with regard to jurisdictional claims in published maps and institutional affiliations. |
© 2022 by the authors. Licensee MDPI, Basel, Switzerland. This article is an open access article distributed under the terms and conditions of the Creative Commons Attribution (CC BY) license (https://creativecommons.org/licenses/by/4.0/).
Share and Cite
MDPI and ACS Style
Dang, Y.; Ma, H.; Wang, J.; Zhou, Z.; Xu, Z. An Improved Multi-Objective Optimization Decision Method Using NSGA-III for a Bivariate Precision Fertilizer Applicator. Agriculture 2022, 12, 1492. https://doi.org/10.3390/agriculture12091492
AMA Style
Dang Y, Ma H, Wang J, Zhou Z, Xu Z. An Improved Multi-Objective Optimization Decision Method Using NSGA-III for a Bivariate Precision Fertilizer Applicator. Agriculture. 2022; 12(9):1492. https://doi.org/10.3390/agriculture12091492
Chicago/Turabian StyleDang, Yugong, Hongen Ma, Jun Wang, Zhigang Zhou, and Zhidong Xu. 2022. "An Improved Multi-Objective Optimization Decision Method Using NSGA-III for a Bivariate Precision Fertilizer Applicator" Agriculture 12, no. 9: 1492. https://doi.org/10.3390/agriculture12091492
Note that from the first issue of 2016, this journal uses article numbers instead of page numbers. See further details here.