Article

Soil Attributes and Their Interrelationships with Resistance to Root Penetration and Water Infiltration in Areas with Different Land Uses in the Apodi Plateau, Semiarid Region of Brazil

by
Pollyana Mona Soares Dias
1,
Jeane Cruz Portela
1,*,
Joaquim Emanuel Fernandes Gondim
1,
Rafael Oliveira Batista
1,
Leticia Sequinatto Rossi
2,
Jonatan Levi Ferreira Medeiros
1,
Phâmella Kalliny Pereira Farias
1,
Paulo Jardel Mota
1,
Diego José da Costa Bandeira
1,
Luís Cesar de Aquino Lemos Filho
1,
Geisiane Xavier de Matos
1,
Francisco de Oliveira Mesquita
3,
Felipe Ozias de Oliveira
1,
Antonio Genilson Rodrigues Araújo
1 and
Claudeone Manoel do Nascimento
1
1
Department of Agronomic and Forest Science, Federal Rural University of the Semi-Arid-UFERSA, Mossoró 59625-900, RN, Brazil
2
Department of Soils and Nature Resources, State University of Santa Catarina-UDESC, Lages 88520-000, SC, Brazil
3
PPGEC Graduate Program in Ecology and Conservation, State University of Paraíba, Campina Grande 58429-500, PB, Brazil
*
Author to whom correspondence should be addressed.
Agriculture 2023, 13(10), 1921; https://doi.org/10.3390/agriculture13101921
Submission received: 6 July 2023 / Revised: 21 September 2023 / Accepted: 27 September 2023 / Published: 30 September 2023
(This article belongs to the Special Issue Soil Management for Sustainable Agriculture)

Abstract

:
Studies on soils and their interrelationships with land use in the context of the semi-arid region of Brazil are still scarce, even though they have the potential to assist in understanding the use and management of soil and agricultural crops. From this perspective, this study investigated four land uses in different locations of the Apodi Plateau, an elevated area in semi-arid region of northeastern Brazil. The different soils were analyzed for their resistance to root penetration, water infiltration, inorganic fractions, soil density, total porosity, potential of hydrogen, electrical conductivity, total organic carbon, potential acidity, and sum of bases. The soil resistance to root penetration and water infiltration were determined in the field. The results obtained were interpreted using multivariate and geostatistical analysis. The resistance data were subjected to the Shapiro–Wilk test at 5% of probability and expressed in maps, whereas infiltration data curves were constructed to estimate the amount of infiltrated water at the different time intervals. The textural classification was an important factor for the analysis of soil resistance to root penetration (Q) and the infiltration rate, being evidenced in the cluster analysis and allowing the formation of two groups, one for the surface layers of the areas and another for the subsurface layers, with the inorganic sand and clay fractions standing out with the greatest dissimilarity. The establishment of conservation practices for soil management is suggested to correct the pore space problems and the degradation of agroecosystems in areas with soils whose conditions are similar to the ones of this study.

1. Introduction

Soil health is a parameter that cannot be measured directly, requiring information on structural attributes such as water infiltration and soil resistance to root penetration, which can be used to interpret the effects of soil and water degradation processes that ultimately compromise biodiversity [1,2,3,4,5], attributes that are significantly impacted by land use. Therefore, evaluating the influence of the inter-relation of different factors on physical, chemical, and structural characteristics can assist in identifying the physical forces that govern soil structure in the field [6,7,8].
Several studies have aimed to assess soil resistance to penetration [9,10,11,12,13,14] and infiltration [15,16,17,18] given the impact of these variables on plant growth, crop performance, and the sustainable development of agroecosystems. These attributes are mutually associated and can serve as parameters related to water–structural functions of the soil. For example, soils with less resistance to root penetration are associated with higher water infiltration and structural and environmental functionalities [19,20]. The relationship of these attributes with soil production capacity is even more important in family farming areas, which are more dependent on natural resources [21]. However, in arid and semi-arid lands, water shortage restricts agricultural development [18]. Therefore, it is essential to compare soil attributes with different land uses, as these attributes can be changed due to environmental and anthropic actions [22], which justifies the need to understand how different soil management practices can modify the soil attributes in order to decrease degradation and ensure sustainable land use [23].
In this scenario, kriging is an advanced geostatistical procedure used by several researchers [24,25,26] that considers spatial dependence, data treatment, and inferential procedures. Furthermore, although it is common to use geostatistics and multivariate analysis separately, they can clarify the dynamics of water in soils and be decisive for the proper planning of agricultural practices when used in association.
In the semi-arid region of northeastern Brazil, the Apodi Plateau is an outstanding region in the context of agricultural production, with expressive irrigated, rainfed, and livestock areas and the predominance of ultisols, cambisols, and oxisols [27]. However, inadequate human action has reduced the production capacity of the region’s soils.
From this perspective, the innovative character of this research refers to the use of geostatistics associated with a multivariate tool to discriminate environments and soil classes in agroecosystems in an interrelated manner, which can be used on a global scale. The novelty of this study consists in exploring data on the soil’s resistance to root penetration and water infiltration, parameters used to recognize physical and water restrictions. As a result, this information can contribute to other research aimed at the conservation of environmental and ecosystem services, as well as to new actions on the subject.
The importance of these physical properties for the growth and development of agricultural crops that consequently influence soil quality and, when necessary, reorient and replace inadequate techniques of soil and crop management is highlighted in this study. In addition, clarifying these issues could benefit regional agriculture by providing useful information for more adequate soil and crop management, not only under semi-arid conditions, but also in a global context.
Our main hypotheses are (i) restrictions with regard to resistance to root penetration and water infiltration in the soil are clear in soils with clayey textures, with a history of intensive soil preparation and consolidation of the soil surface, and in lower locations of the landscape. (ii) Kriging is a regression method used in geostatistics to approximate or interpolate data. It is believed that kriging can improve the performance of the quantitative estimates of soil attributes, especially with regard to root penetration, in association with multivariate statistics.
We also evaluate the importance of geostatistical analysis, through kriging, to complement the multivariate statistical analysis to provide accuracy in our findings, especially concerning root penetration.
From this perspective, this study aimed to evaluate the interrelationships between the physical attributes of the soil related to water infiltration and resistance to root penetration in soils of the Moacir Lucena Settlement Project in the Apodi Plateau, a semi-arid region of Brazil, using multivariate statistics and geostatistical analyses through the kriging method.

2. Materials and Methods

2.1. Study Area

This study was conducted in the Moacir Lucena Settlement Project (Figure 1), Apodi (Brazil). Apodi is in the semi-arid region of the State of Rio Grande do Norte (RN), in the micro-region of the Apodi Plateau, in the Oeste Potiguar mesoregion of RN. The climate of the region is classified as BSh (hot semi-arid) according to Köppen [28], with a mean annual rainfall between 500 and 600 mm. The natural vegetation belongs to the Caatinga Phytogeographic Domain.
The soils of the agricultural areas studied were classified according to World Reference Base-WRB [29] published by the Food and Agriculture Organization of the United Nations—FAO and the Brazilian Soil Classification System [30]. The research was developed in four agroecosystems (Table 1) used as study sites: Recovery Area (A1); Lake Area (A2); Collective Area (A3); and Agroecological Area (A4).
The chosen areas lack information about their limitations and the potential necessary for the sustainable and efficient management of natural resources. As a result, extensive lowland areas, with the potential for grazing, for example, tend to be underutilized, which affects the quality of life of farmers.
The study areas also show significant space–time variations in soil attributes, in addition to having a distinctive history of uses and management. The places selected for the study include areas of higher agricultural aptitude, intended for the cultivation of short-cycle crops and fruit trees (Agroecological and Community Areas), as well as areas that, due to their intensive use and location in the landscape, have been transformed into permanent preservation areas (Recovery and Lake Areas).
Leaving soil fallow is a strategy commonly used in the Brazilian semi-arid region. However, few studies that reflect soil response to fallow periods in the long term have been developed, especially in arid or semi-arid environments.

2.2. Sample Collection

Disturbed and undisturbed samples were collected from the soil layers for physical and chemical analysis. The disturbed samples were collected from the 0.00–0.10 and 0.10–0.20 m layers to evaluate soil resistance to root penetration and soil moisture. Water infiltration was measured in the 0.00–0.10 m layer.
Disturbed and undisturbed samples were collected from the following soil horizons: Area: 1—Recovery Area (LATOSOL): A: (0.00–0.04 m); AB: (0.04–0.17 m);
Area 2—Lake Area (CAMBISOL): A: (0.00–0.03 m); BA: (0.03–0.15 m);
Area 3—Collective Area (CAMBISOL): Ap: (0.00–0.06 m) BA: (0.06–0.18 m);
Area 4—Agroecological Area (ARGISOL): A: (0.00–0.03 m) BA: (0.03–0.16 m).
The disturbed samples were collected using a tray and shovel, after which they were identified and packed in plastic bags. Subsequently, the samples were air-dried, ground, and passed through 2 mm sieves to obtain air-dried fine earth. Ten unformed samples were collected per layer in each class (80 samples in the four environments) using volumetric rings 0.05 high and 0.05 m wide and an Uhland-type apparatus. After sampling, the rings were coated with aluminum foil to maintain the structure and moisture of the original soil and taken to the laboratory.

2.3. Soil Analyses

2.3.1. Soil Resistance to Root Penetration

The evaluation of soil resistance to root penetration (Q) was performed using Pen-etroLOG equipment (Falker—USA) with a support capacity of 90 kgf (198 lb). The data were read at every centimeter by an automatic measurement system, according to ASABE S.313.3 [31], until the 40 cm layer, with a reference area of 0.5 hectares in each environment (25 readings per area). At the time of the test, deformed samples were collected to evaluate the gravimetric moisture content in the 0.00–0.10 and 0.10–0.20 m layers, with ten different sampling points per layer and area, totaling 80 points, thus obtaining the mean water content values in the soil.

2.3.2. Water Infiltration into the Soil

The infiltration rate was determined by the concentric ring method developed by Bernardo and collaborators [32], using two metallic cylinders coupled to the inner cylinder, with diameters of 30 cm in the inner ring and 50 cm in the outer ring (Figure 2a). The cylinders, measuring 40 cm in height, were positioned at a depth of 10 cm into the soil. The water height was measured inside the inner cylinder at 0, 1, 2, 3, 4, 5, 10, 15, 20, 30, 45, 60, 90, and 120 min (Figure 2b). Infiltration was considered constant when the reading value was repeated at least three times, according to the recommendations of the authors mentioned before.
In order to determine the water infiltration rate into the soil, three replications were performed in each soil class by collecting disturbed soil samples to quantify the gravimetric moisture [33]. The cumulative infiltration curves were obtained by Equation (1), and the Basic Infiltration Speed (BIS) was calculated by Equation (2), which allowed the categorization of soil classes according to Bernardo and collaborators [32].
I = a T n
B I S = 60 a n T n 1
where:
  • I—cumulative infiltration (cm); BIS—Basic Infiltration Speed (cm/h);
  • a—constant;
  • T—infiltration time (min);
  • n—constant that ranges from 0 to 1.

2.3.3. Supplementary Physicochemical Analyses

The physical and chemical attributes were determined to complement the soil analysis. This was performed to quantify the properties of soil resistance to root penetration and water infiltration. The physical analysis consisted of determining textural parameters, soil bulk density, total porosity, and the gravimetric moisture content. The granulometry was obtained by the pipette method, using the chemical dispersant sodium hexameta-phosphate. The sand fraction (2 to 0.05 mm) was obtained by sieving; the clay fraction (<0.002 mm) by sedimentation; and the silt fraction (0.05 to 0.002 mm) was obtained by the difference between the two previous fractions [34]. Soil density was obtained by calculating the ratio of dry soil mass to the total volume of the ring [35]. Total porosity (TP) was obtained by saturating undisturbed samples for 48 h [36]. The gravimetric moisture content was obtained by the difference between the mass of air-dried samples and the mass of the samples after 3 days at 105 °C on the oven.
The chemical analyses were carried out according to Teixeira et al. [33] and consisted of determining the following attributes: potential of hydrogen (pH); electrical conductivity (EC) in water; total organic carbon (TOC) by organic matter digestion [37]; calcium (Ca2+) and exchangeable magnesium (Mg2+), determined with a potassium chloride extractor; sodium (Na+) and potassium (K+), determined with the Mehlich-1 extractor; and potential acidity (H + Al3+), determined with calcium acetate (after which the sum of bases—SB was calculated).

2.4. Statistical Analysis—Geostatistical Analysis

The geostatistical analysis was performed to subsidize the semivariogram modeling based on the measurement data. The ordinary kriging interpolation method was used to verify the spatial dependence of the studied variables using the software Vesper 1.6 [38]. Thematic maps were generated with the interpolated values using the software Quantum GIS 2.18 [39]. The estimate was made using Equation (3) [40]:
γ h = 1 2 . ( h ) Z . S i J = 1 N i . ( h ) S i h 2
where γ (h) are the semivariances, and (h) is the number of pairs of points z (Si) and z (Si + h) separated by a distance h, informing how different the values become as a function of h.
Using the semivariogram generated by geostatistics as a reference, maps were made for the variation of the maximum depth reached by the equipment in centimeters (cm) and the mechanical resistance to soil penetration in kPa. This variation was demonstrated by means of a color gradient that varied from red to green. For layer variation, red was used for the smallest values and green for the largest values. For the variation in Q, the opposite occurs. The following semivariogram models were tested: spherical (Equations (2) and (3)), exponential (Equation (4)), and Gaussian (Equation (5)). The adjustment of the models was made using the Root Mean Square Error (RMSE) and the Akaike Information Criterion (AIC) [41].
γ h = C 0 + C 1 1.5 h a 0.5 h a 3 ,   0 < h < a
γ h = C 0 + C 1 ,   h a
γ h = C 0 + C 1 1 e 3 . h a ,   0 < h < d
γ h = C 0 + C 1 1 e 3 . h 2 a 2 ,   0 < h < d
where γ* (h)—semivariances; d—the maximum distance at which the semivariogram is defined; h—distance; a—soil-dependent constant.
The scale proposed by Ribeiro [42] (Table 2) was used to interpret data related to resistance to root penetration. The degree of spatial dependence (DSD) of the semivariograms was obtained by Equation (6) and evaluated according to intervals proposed by Cambardella [43]: DSD < 25%—strong spatial dependence; 25% < DSD < 75%—moderate spatial dependence; and DSD > 75%—weak spatial dependence.
D S D = C 0 C 0 + C 1 100
where GD—degree of dependence; C0—nugget effect; C1—structural variance.

2.5. Multivariate Analysis

The results for the resistance to root penetration and the physical and chemical attributes (Section 2.3.3) were interpreted by multivariate statistics (principal component analysis and factor analysis) using the software Statistica 7.0 [44]. The correlation matrix was used to standardize the data, considering correlations equal to or higher than 0.70 [45], and verify the similarities and distinctions between the studied areas depending on the potential or restrictions of the environments.

3. Results

Soil Physical and Chemical Attributes

There was variation in the textural classification in the different soil samples (surface and subsurface) (Table 3). This variation ranged from light sandy-clay (A1, A2, and A3) to sandy loam (A4) on the surface, and from sandy loam to loamy in the subsurface, with emphasis on the clayey texture of A2 (Lake Area—CAMBISOL) and A4 (Agroecological Area—ARGISOL). The mean bulk density ranged from 1.32 to 1.71 g.cm−3 in the studied soil classes and was lower in the cambisol of the Lake Area.
Water infiltration changed according to the texture, with the A3 area showing the highest infiltration rate on the surface, as well as a predominant sand fraction. The areas showed constant infiltration after 60 min of evaluation (Figure 3a), except for A3, which showed greater oscillation in the infiltration rate (Figure 3b). High water infiltration values are expected in plateau soils due to their location at higher elevations and the flat relief. However, the same did not occur in the A4 area (ARGISOL), which showed a strong physical impediment and a gradual reduction in the infiltration rate due to clay accumulation in depth.
Areas 4 (Agroecological Area—ARGISOL) and 2 (Lake Area—CAMBISOL) showed the highest Q (Table 4) on the surface, whereas Areas 1 (Recovery Area—LATOSOL) and 3 (Collective Area—CAMBISOL) had the lowest Q in the subsurface. The greater the accumulation of the clay fraction, the more pronounced the gravimetric moisture and Q. Thus, clay accumulation in all soil classes in the subsurface caused an increase in Q in-depth, with texture being a decisive factor in the Q of the studied soils.
The soils showed pH values close to neutrality, with aluminum levels below the criteria required by the Brazilian Soil Classification System to identify them as aluminic or alithic. Potential acidity levels ranged from 1.02 to 2.66 cmolc.kg−1. These values can be justified by the absence of aluminum (Table 5).
In all areas, the TOC values were lower than 1%, with the most expressive ones corresponding to the surface soil layers (where there is a greater quantity of organic matter), especially in Areas 2 and 4. The values of calcium and magnesium were the most representative of the sum of bases, especially in the less weathered soils (cambisol and argisol) (Table 5). A2 showed the highest electrical conductivity value (0.98 dS.m−1). However, the values were generally low.
The variability in soil attributes can be classified according to the coefficient of variation (CV) [46], a statistical measure that relatively quantifies how far the values are moving away from the mean; thus, higher values indicate distancing from the mean [47]. In this study, the CV (Table 4) ranged from high (A1 and A3) to very high (A2 and A4) for the layers, and from low (A1) to medium (A2–A4) for Q. The Shapiro–Wilk test at 5% of probability showed that most parameters have a normal distribution, except for the depths of A2 and A3, which showed a greater distance from zero for the coefficients of kurtosis (Ck) and asymmetry (Ca).
The range (A) (Table 6) is the main spatial correlation parameter provided by geostatistics; thus, from this distance, the variable starts to show random spatial variability [48]. The range of variable Q was 29.30 (A1) to 80.01 (A2), whereas the range of the layer was 10.54 (A1) to 37.72 (A3). Furthermore, the degree of spatial dispersion of the semivariogram demonstrates a predominance of strong spatial dependence between the parameters evaluated (DSD < 25%), except for the Q of A1, which showed a weak spatial dependence (DSD > 75%).
We can correlate the resistance values with the adopted soil management, soil class, and the maximum depth reached. In the Collective Area (CAMBISOL), in which there was an increase in the clay fraction, the depth ranged from 5 to 11 cm (Figure 4). In the Lake Area, in which there was sediment accumulation, the variation was from 8 to 15 cm. In the Agroecological Area (ARGISOL), there was a variation from 5 to 27 cm since this soil is deeper and more weathered. Finally, the Recovery Area (LATOSOL) showed little variation in depth.
In general, the resistance to root penetration showed high values in the subsurface for all studied soils, with uniform variations between the layers of all classes, corresponding to approximately 100 kPa for A1 and 200–300 kPa for the other classes (Figure 5).
A high negative correlation was found for the clay and Q variables with the sand inorganic fraction, as well as a high positive correlation between sand and TOC. The silt fraction was positively correlated with SB. The clay fraction showed an inversely proportional correlation with the sand fraction. The pH, TOC, and EC showed a negative correlation only with potential acidity, which had a positive correlation with Q. The SB was positive for all variables. BD and TP showed an inverse correlation. Furthermore, there was a negative correlation between TP and BD, Q and pH, and Q and TOC, and a positive correlation of EC with two other variables, pH and TOC (Table 7).
In the Cluster Analysis, two groups were formed at 20% dissimilarity (Figure 6). The first was represented by the surface horizons and showed dissimilarity with the clay, silt, and sand inorganic fractions and with variables TP, U, pH, TOC, SB, EC, and (H + Al3+). The second group was defined according to the subsurface horizon of all areas, with dissimilarity for variable Q.
Factors 1–3 explained 90.12% of data variation (Table 8). Factor 1 made it possible to estimate the variables of sand, clay, Q, pH, and TOC. Factor 2 highlighted silt, SB, and potential acidity (H + Al). Factor 3 only highlighted the TP. The cumulative variance obtained for factors 1 and 2 was 73.78%, showing great representativeness for the studied environments.
The correlation circles (Figure 7a,c) and clouds of variables (Figure 7b,d) highlighted the influence of physical attributes to differentiate the studied environments. The inorganic fractions were not clustered close to each other. Thus, we infer that the areas show variability in texture, reflecting the predominance of the variables discriminated for environments and portraying the existing interrelationships for each local particularity. The discriminating variables were TP, BD, SB, pH, Q, and silt for the cambisol; SB, TOC, silt, and EC for the argisol; and Q, U, sand, and clay for the latosol.

4. Discussion

Soil Physical and Chemical Attributes

Smaller BD values were observed in the subsurface of A2 (Lake Area) and on the surface of A4 (Agroecological Area). In A2, the greater BD on the surface can be explained by the accumulation of sediments coming from higher elevations (slope), as found in the study by Quan et al. [49]. In A4, the BD reduction on the surface can be justified by the supply of organic matter [50,51].
The surface structure of the soil was compromised by the BD increase and TP reduction, constituting an impediment to its recovery and the restructuring of the porous system in all layers [52]. The highest bulk density (Table 3) found on the surface of A2 was due to clays with high colloidal activity, a characteristic of cambisols, with cohesion forces contributing to the consolidation of the surface. Fertile soils with clays of high colloidal activity (2:1 clay) compromise the gas exchange parameters, thus influencing the soil’s structural parameters.
Cambisols are considered young (little weathered) and show expressive silt fraction values, contributing to their compactness [53]. Freddi et al. [54], in their study with a latosol (oxisol), found that soil density had a positive influence on the soil water content due to reduced macroporosity and the redistribution of pore sizes, corroborating the results achieved for the same soil class in this study (Figure 3a). The hydraulic functionality differs for soils with different textures, with microporosity playing an important role in this parameter due to the presence of materials with fine textures, e.g., clay and SOM, showing higher retention capacity when the soil is moistened [55,56].
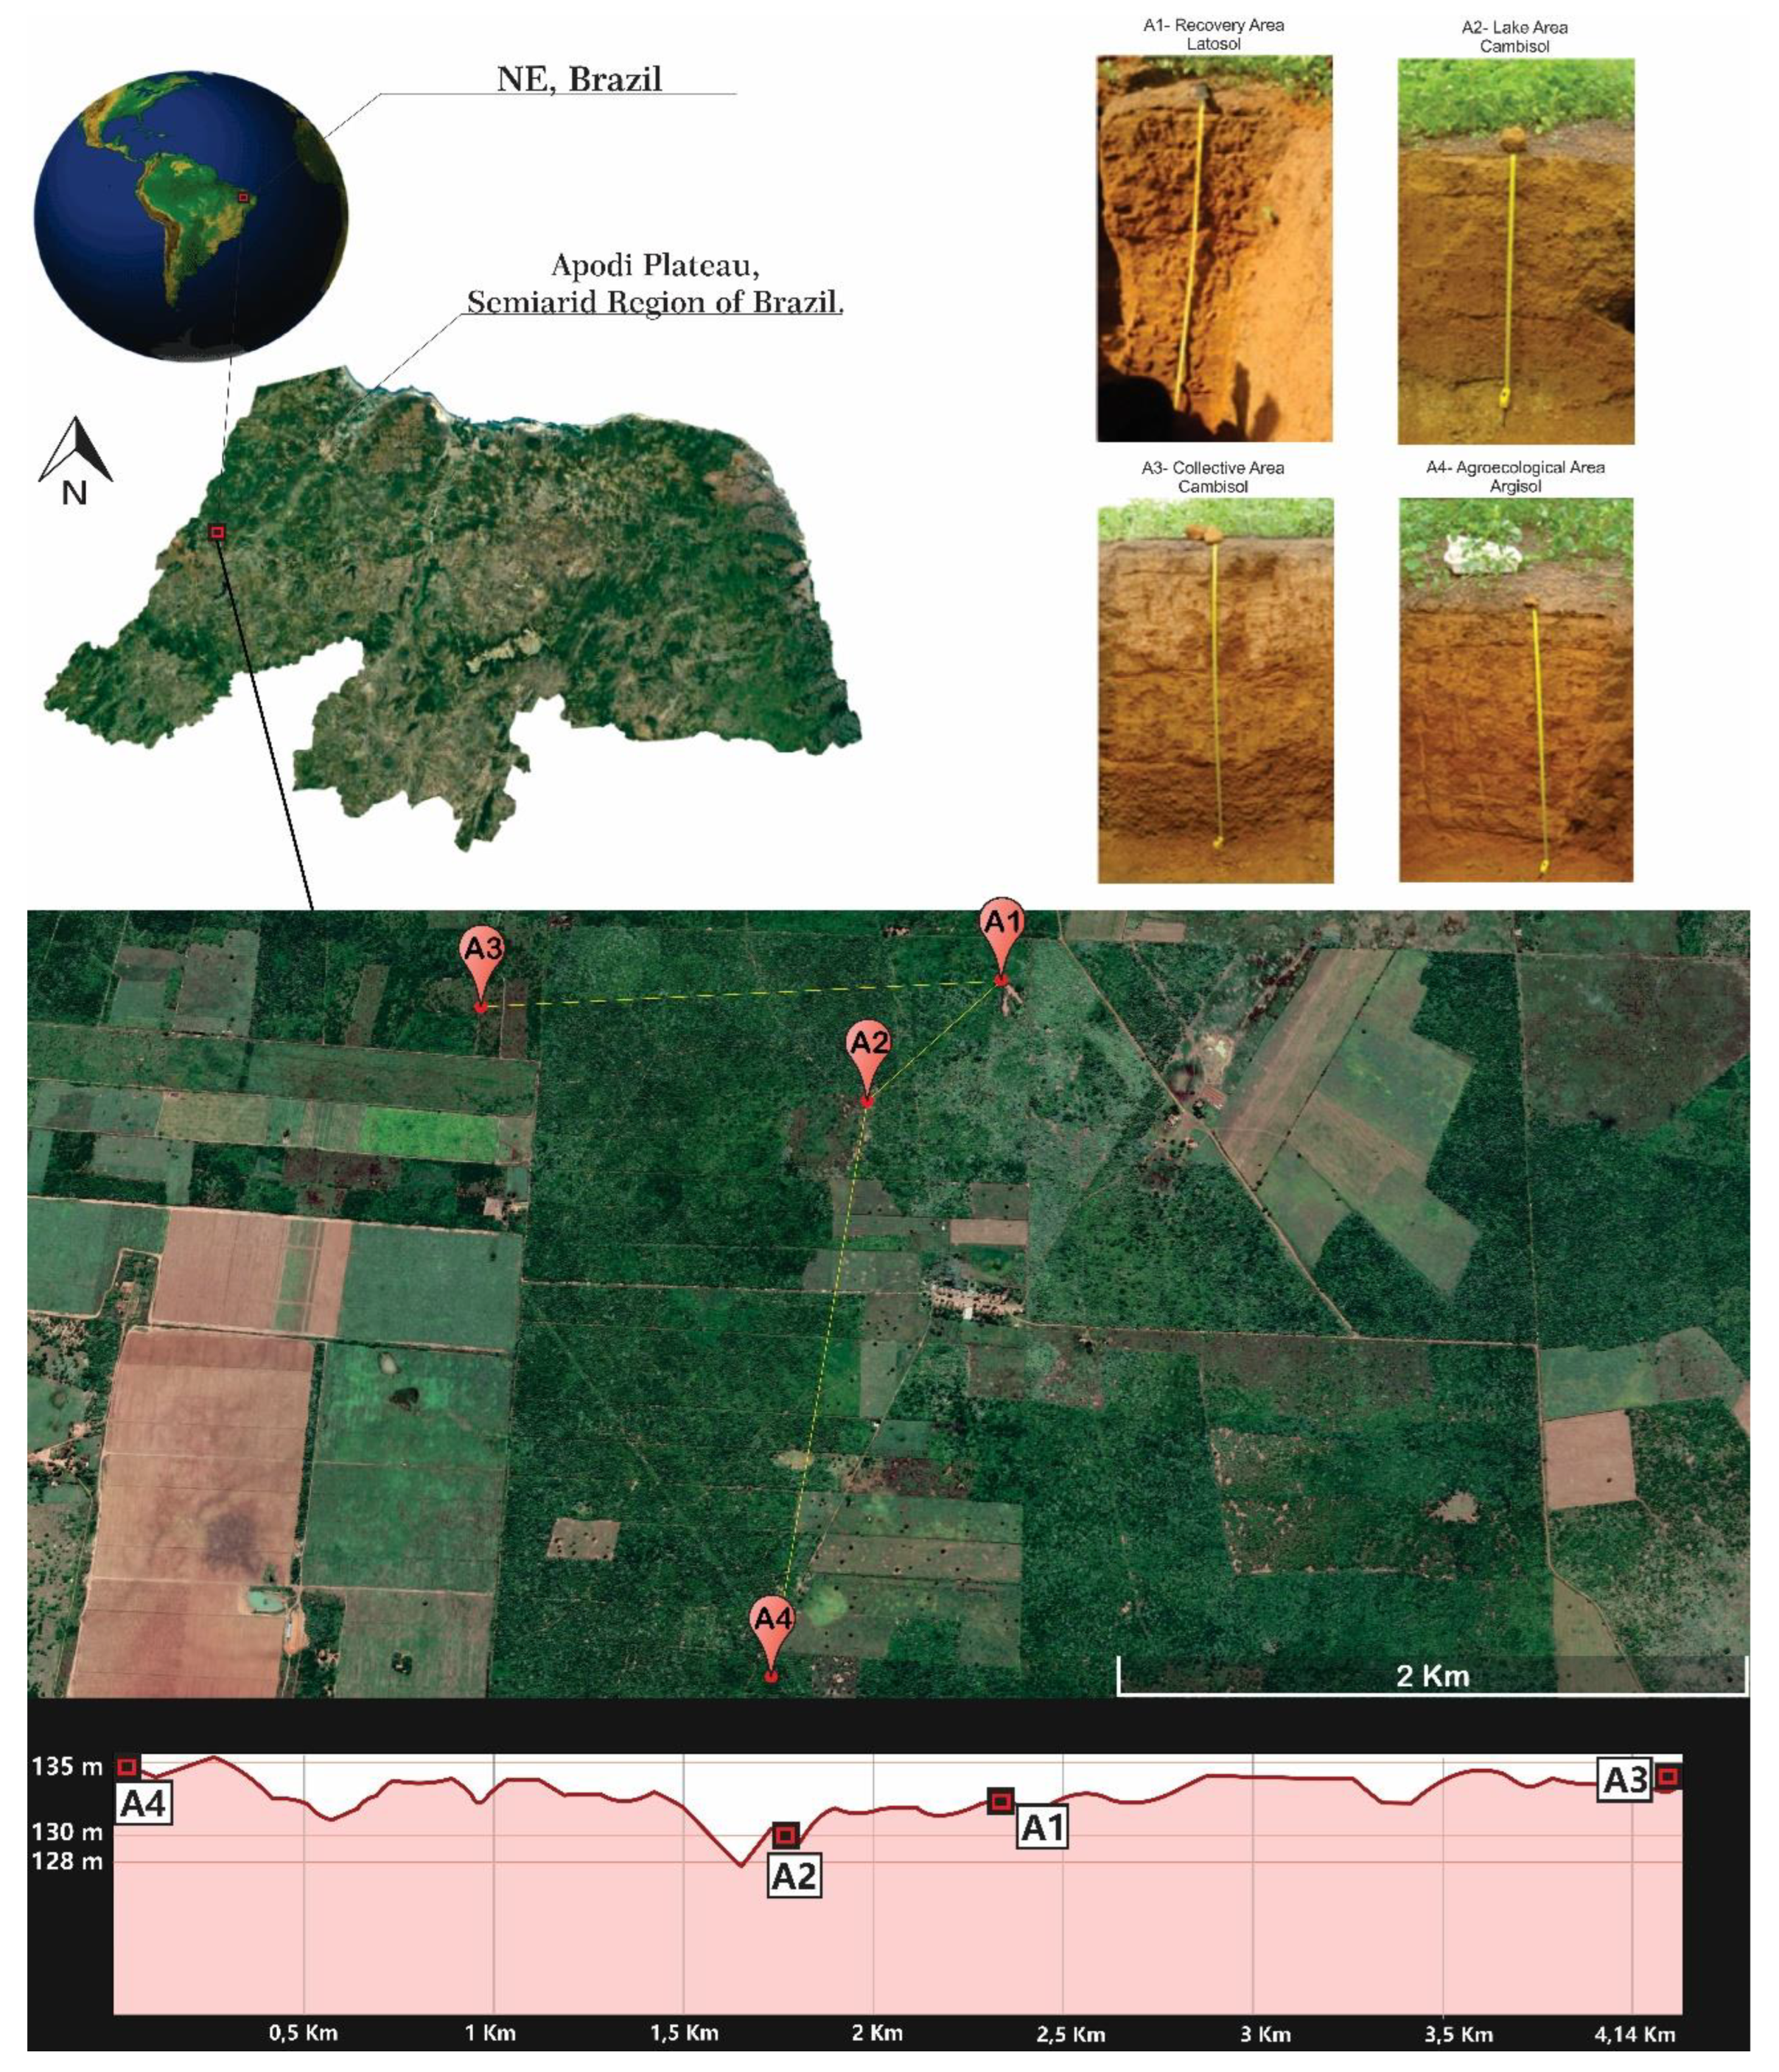
With regard to the local climate, there are two well-defined periods in the region: dry and rainy [57]. In the investigation of Q, the water content was at low levels (U < 10% in all soil layers) due to the study being carried out in the dry period. Thus, the soil water content is reduced by the climatic characteristics of the semi-arid region, which has high temperatures and evaporation rates, and by the inherent characteristics of the soils. This directly influences the gas exchange dynamics and favors the cohesion forces provided by the clay fraction (Table 3), reducing the infiltration rate (Figure 3b), and increasing the Q, according to the study by Souza et al. [58]. Otherwise, the increase in the soil water content reduces cohesion, compactness, and the soil shear resistance [59].
The greater infiltration shown by Area 3 occurred due to the predominance of the sand fraction and greater macroporosity resulting from intensive soil preparation, as verified in the study carried out by Hlaváčiková et al. [60]. The similarity in the proportion of inorganic fractions in the studied layers for areas A1 (Recovery Area) and A2 (Lake Area) explains the proximity of the water infiltration curves (Figure 2a). In turn, the gradual reduction in the infiltration speed seen in Area 4 (Agroecological Area) occurred due to the densification promoted by the clayey soil texture.
The maximum speed observed at the beginning of the test in A2 (Figure 3a) stood out from the other areas due to sediment deposition (Table 1), which facilitated water entry into the soil. Despite this, A3 (Collective Area) showed the highest infiltration rate. The irregularity in the infiltration speed of this area can be attributed to the compactness at the surface due to the transit of animals. In the subsurface, this is explained by the soil management history and the characteristics of the area, due to the conventional intensive preparation and planting of annual crops (Table 1). Practices such as the use of cover plants and the maintenance of plant residues in orchards avoid compaction and favor water infiltration, consequently controlling erosion processes [61,62].
The pH ranged from 6.68 to 7.64 between soil layers, ranging from slightly acidic to neutral (Table 5). These values tending to alkalinity found in the cambisol soil class were due to the limestone material present in the Apodi Plateau region, which is rich in bases such as calcium and magnesium, justifying the observed high values of sum of bases [63]. The pH values in argisol and latosol soils were due to the characteristic climatic pattern of the region (low rainfall), which reduces chemical weathering (Section 2.1).
EC showed values below 4 dS.m−1 in all areas, implying low salt concentrations in the soil solution, with low potential risks posed by salinity. According to Richards [64], soils are considered saline only when the electrical conductivity (EC) of the saturation extract is higher than or equal to 4 dS.m−1 and when the percentage of exchangeable sodium is lower than 15%. A similar study was conducted by Sparks [65] and Zaman et al. [66], also using the pH (lower than 8.5) and sodium adsorption rate (lower than 13), finding that the studied soil posed no restrictions with regard to salinization and sodification. The most expressive value was observed on the surface layer (0–3 cm) of the A2 area (Lake Area) due to area’s position in the landscape (sediment deposition).
The Caatinga Domain, which is representative of the Brazilian semi-arid region, shows low carbon accumulation due to edaphoclimatic conditions, resulting in a reduction in the input of senescent plant material on the soil surface and intense radiation, which favors rapid mineralization as a result of microbial respiration [67,68]. Oliveira et al. [69] observed that the interaction between the semi-arid climate of northeastern Brazil, extensive pasture, and poorly conducted occupation rates have caused soil degradation, reducing the soil contents of nitrogen and carbon. As a result, conservation practices associated with polycultures are important for adding residues to the soil surface and improving structural and chemical attributes in agroecosystems [70], as verified in A4. This was also observed in A2 due to the soil water content, which remains saturated temporarily in the rainy season, favoring the maintenance of TOC.
Ferrari et al. [71] analyzed the spatial variability of soil resistance to penetration in different layers and observed spatial dependence in the first 20 cm of the soil class, with high variability in the reach for different depths, corroborating our study. The authors claim that this was mainly due to variation in TOC. However, variables with strong spatial dependence can also be influenced by intrinsic soil attributes, e.g., texture, in addition to being altered by different soil uses and management and agricultural crops, which contribute to a weak spatial dependence [43]. The degree of spatial dependence was considered moderate or strong for the layers in the three soil classes studied (oxisol, argisol, and cambisol), as observed by Cortez et al. [72] in a latosol (oxisol), by Souza et al. [58] in an argisol, and by Campos et al. [73] in a cambisol.
Alonso et al. [74] highlighted the importance of micrometric and decimetric sampling, which are representative of the structural functionality of the soil, related to the resistance to root penetration. Arshad et al. [75] stressed that the definition of an adequate planning for land use and the adoption of appropriate practices regarding local particularities require the understanding of spatial variability, which is potentiated by the landscape that influences the water dynamics. The higher the length and degree of the slope, the more susceptible the environment to soil and water loss, compromising the production capacity of the soil [76].
Soil attributes with high variability are less accurate and more difficult to manage in specific locations [77]. However, in open systems, it is common and acceptable to find these values, as in the studies carried out by Sağlam and Dengiz and Souza et al. [25,78]. The range parameter showed greater spatial variability in the Collective Area in relation to the Q attribute, corroborating Aquino et al. [79]. The range values obtained for Q in this study are greater than those observed by Campos et al. [73] in a Haplic cambisol in the State of Amazonas. In another study, Lima et al. [80] added that the study of the spatial variability of soil attributes, especially the resistance to root penetration, is important as it directly influences the root development of agricultural crops.
The variograms with medium to strong GD generate maps with a more accurate dependency structure than those with a weak GD [
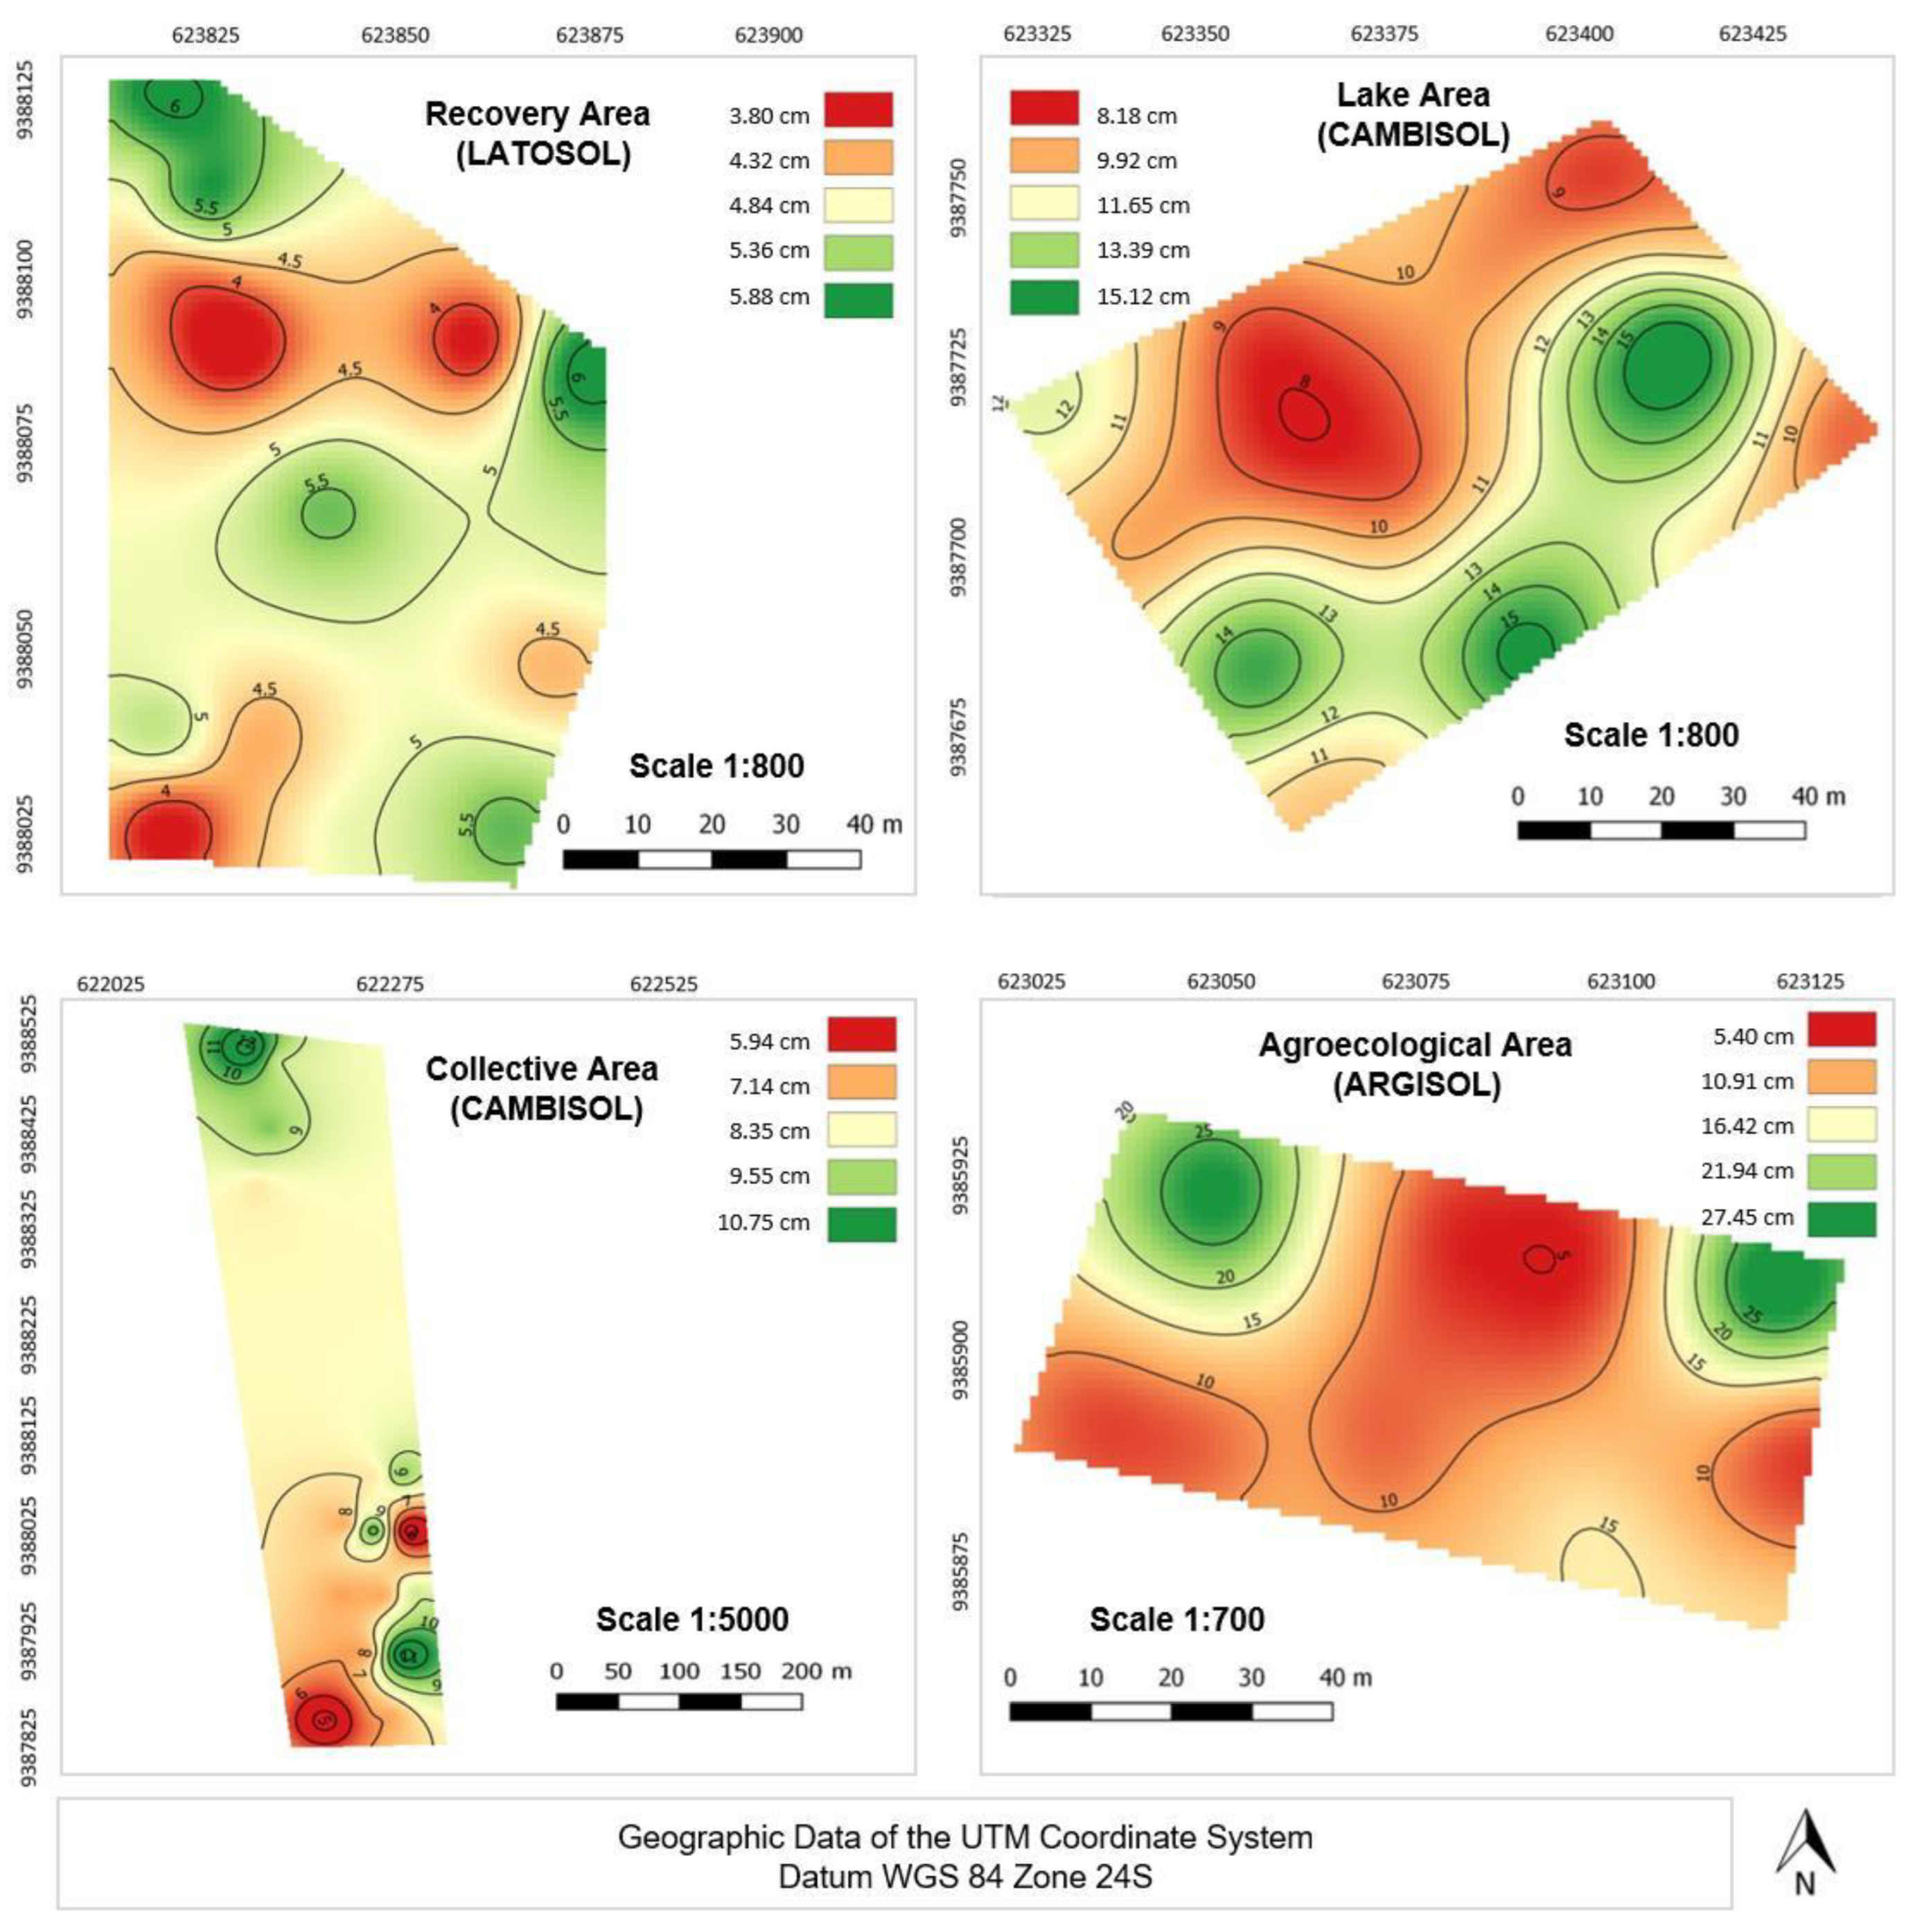
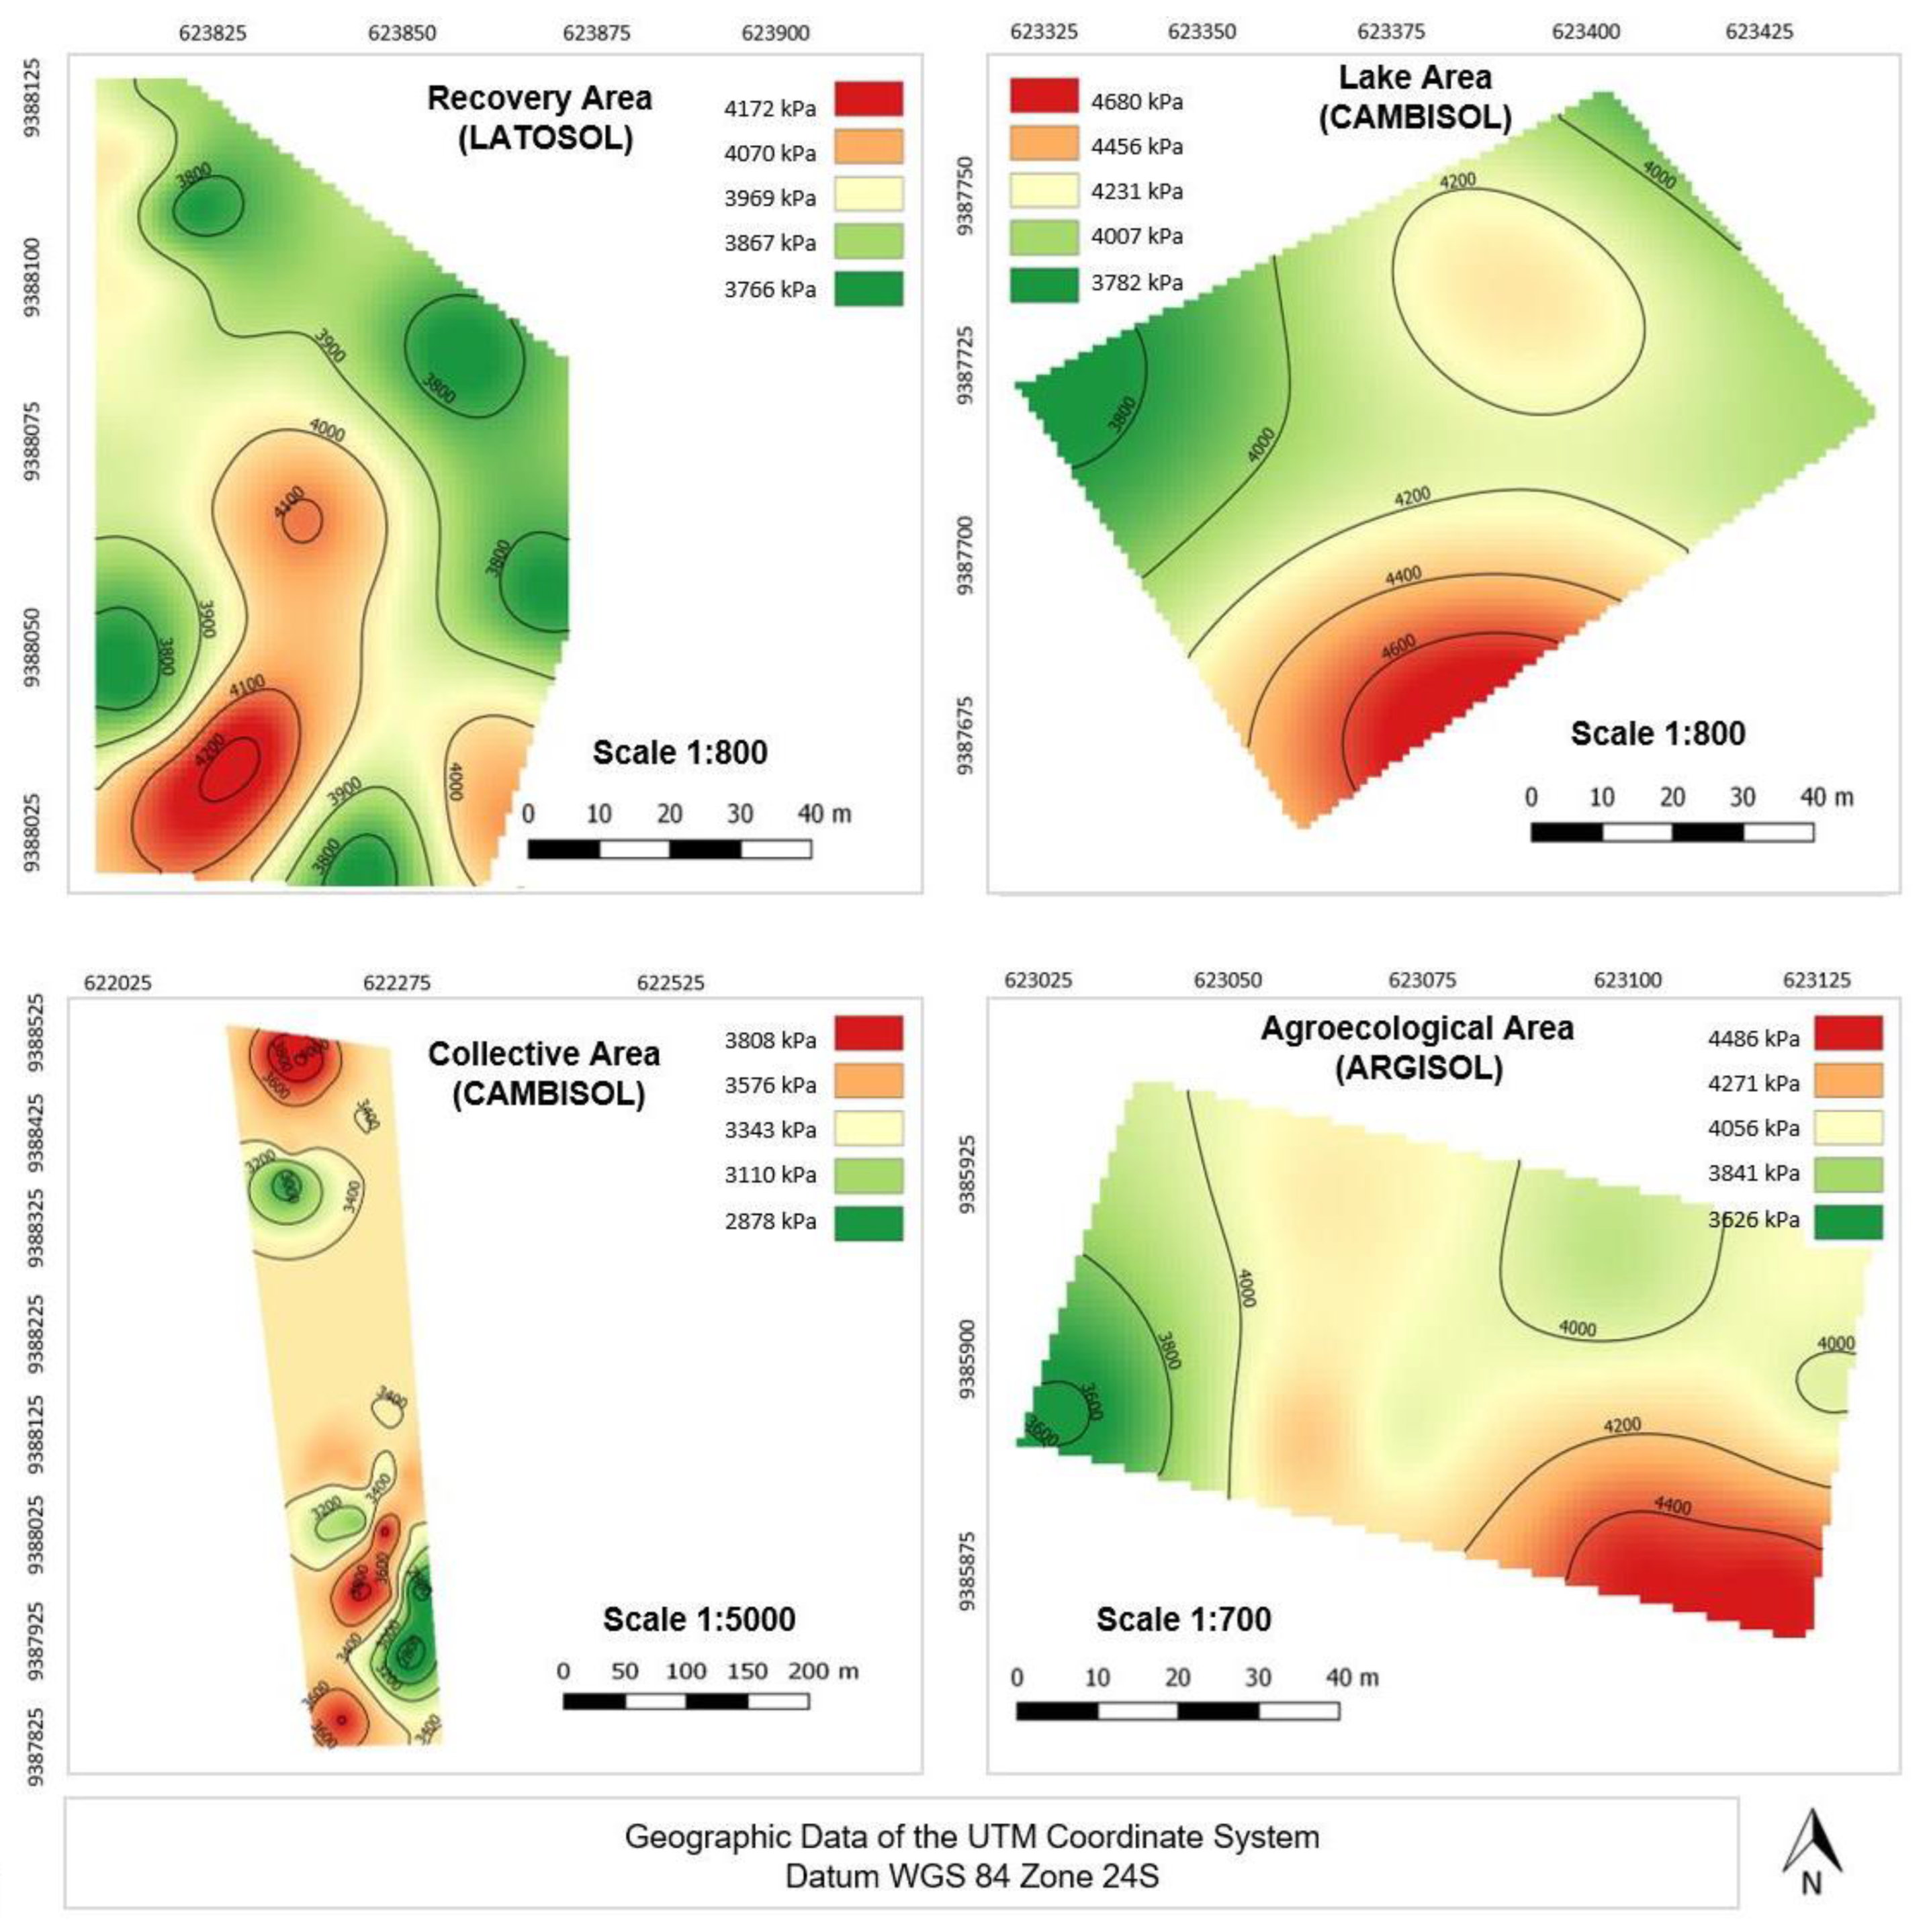
78]. This allows us to infer that the maps prepared show the local reality of the areas. The spatial variability maps of soil resistance to root penetration show that all environments had higher surface Q values (Figure 4 and Figure 5), as observed by Schjønning et al. [10]. In the subsurface, although the Q values were lower than on the surface, these were still high and considered restrictive [12,14,81]. These results are mainly due to the fact that the analysis was carried out in a dry period, in which soils with higher clay content had cohesive particles and provided higher Q values [82]. BD showed slight differences in the layers, except for the sediment deposition area (A2). The larger BD on the A2 surface contributed to the increase in Q, as observed in the study by Wang et al. [13] and Xing et al. [1], in which the Q values ranged from 0.08 to 1.57 MPa when the density increased from 1.01 to 1.43 Mg.m−3. The subsurface Q values can be explained by the increase in the inorganic particles of silt and clay, which reduced the macropores.
The Q values were high in all layers and land uses, being above the limits established (2 MPa) by Guimarães et al. [83]. The degree of impediment varied between soil layers ‘impaired for root penetration’ and layers with reduced crop development (Table 2 and Table 6, Figure 4 and Figure 5), whereas the level of compaction ranged from moderate to high. Thus, the studied soils are restrictive to root growth [13], requiring adequate management for the development of root systems.
The Lake Area (A2) was the agroecosystem with the highest surface Q value, followed by the Agroecological (A4), Recovery (A1), and Collective (A3) areas. Souza et al. [58] also reported an increase in surface Q values in the dry period in cambisols in the semi-arid region of Brazil. In their study, the authors stressed that two conditions limit the growth of the root system: low soil water contents and rapid Q increases. These prevent roots from exploring deep layers. Thus, the cambisol areas in the study only have the potential for short-cycle crops, as seen in the study of Mota et al. [84].
Therefore, the spatial variability of Q occurred as a function of the textural and structural variation of the soil and the management adopted in the areas. Some agroecosystems (A1 and A3) had a history of intensive machinery use in the past (Table 1), and despite the care taken with the conservation of the areas, they have not yet had time to recover their structural condition based on the high values observed for Q. Mohieddinne et al. [85] highlighted the average duration of recovery for clayey soils (54 years), acidic sandy soils—Podzol (70 years), and neutral sandy soils (20 years), whereas Schäffer et al. [86] evaluated a time period of almost four decades for the recovery of silty soils.
From this perspective, the authors mentioned before show that soil recovery is also associated with biological activity in the soil (presence of organisms such as earthworms) and crops with an aggressive pivoting root system to disrupt dense layers [87,88]. Due to changes in soil attributes arising from inadequate management, which compromises the soil’s production capacity [89], the conservation of agricultural lands is the main solution to guarantee ecological stability [90]. Socio-ecological principles should guide the planning of integrated approaches between the agricultural suitability of lands and appropriate and sustainable supportive conservation practices in order to enhance land potential and mitigate climate change and biodiversity loss [91,92].
The negative correlation between clay and Q with the sand fraction (Table 7) is justified by the distinct nature of these fractions. The sand fraction has a higher proportion of macropores and a smaller proportion of micropores compared to clay, whereas the clay fraction has electrical charges that provide physicochemical phenomena such as flocculation and particle aggregation [93]. This distinction influences the porous arrangement of the soil and Q [94], and the negative correlation of Q with clay allows us to infer that soils with higher clay contents are more sensitive to compaction [95].
The negative correlation of clay with TOC (Table 7) indicates that the maintenance of organic matter in sandy soils is important because these soils have less natural fertility in relation to clayey ones. Thus, the land cover improves the physical and structural attributes, especially in semi-arid soils where organic matter is more easily decomposed due to weather patterns [17,96,97].
The negative correlation of TOC with Q was due to the fact that soils with higher TOC contents are less dense and structured (Table 7), facilitating the development and penetration of the root system into the soil. In this study, this effect was observed on the surface layer of the Agroecological Area, mainly due to the maintenance of the soil cover and less disturbance in relation to other agroecosystems. Marinho et al. [96] added that soil matter is essential in the maintenance and preservation of agroecosystems. Carus et al. [97] and Kosmallaa et al. [98] pointed out that a higher density of vegetation cover mitigates the shear resistance of the soil and controls active agents in erosion processes.
Gabriel et al. [99] stated that TOC can be maintained in the soil through the use of cover provided by the polyculture practice, which helps maintain the soil water content and contributes to reducing the Q. Koudahe et al. and Mondal et al. [62,100] stressed that conservation practices such as the use of cover crops and lighter agricultural machinery tend to improve the physical condition of the soil, reducing compactness and improving root growth, thus corroborating the data obtained in A4. Furthermore, studies that investigated the benefits caused by biomass incorporation into the soil have disclosed positive results between agricultural practices and water retention and carbon sequestration by the soil, in addition to promoting improvements in the chemical, physical, and structural attributes [101,102].
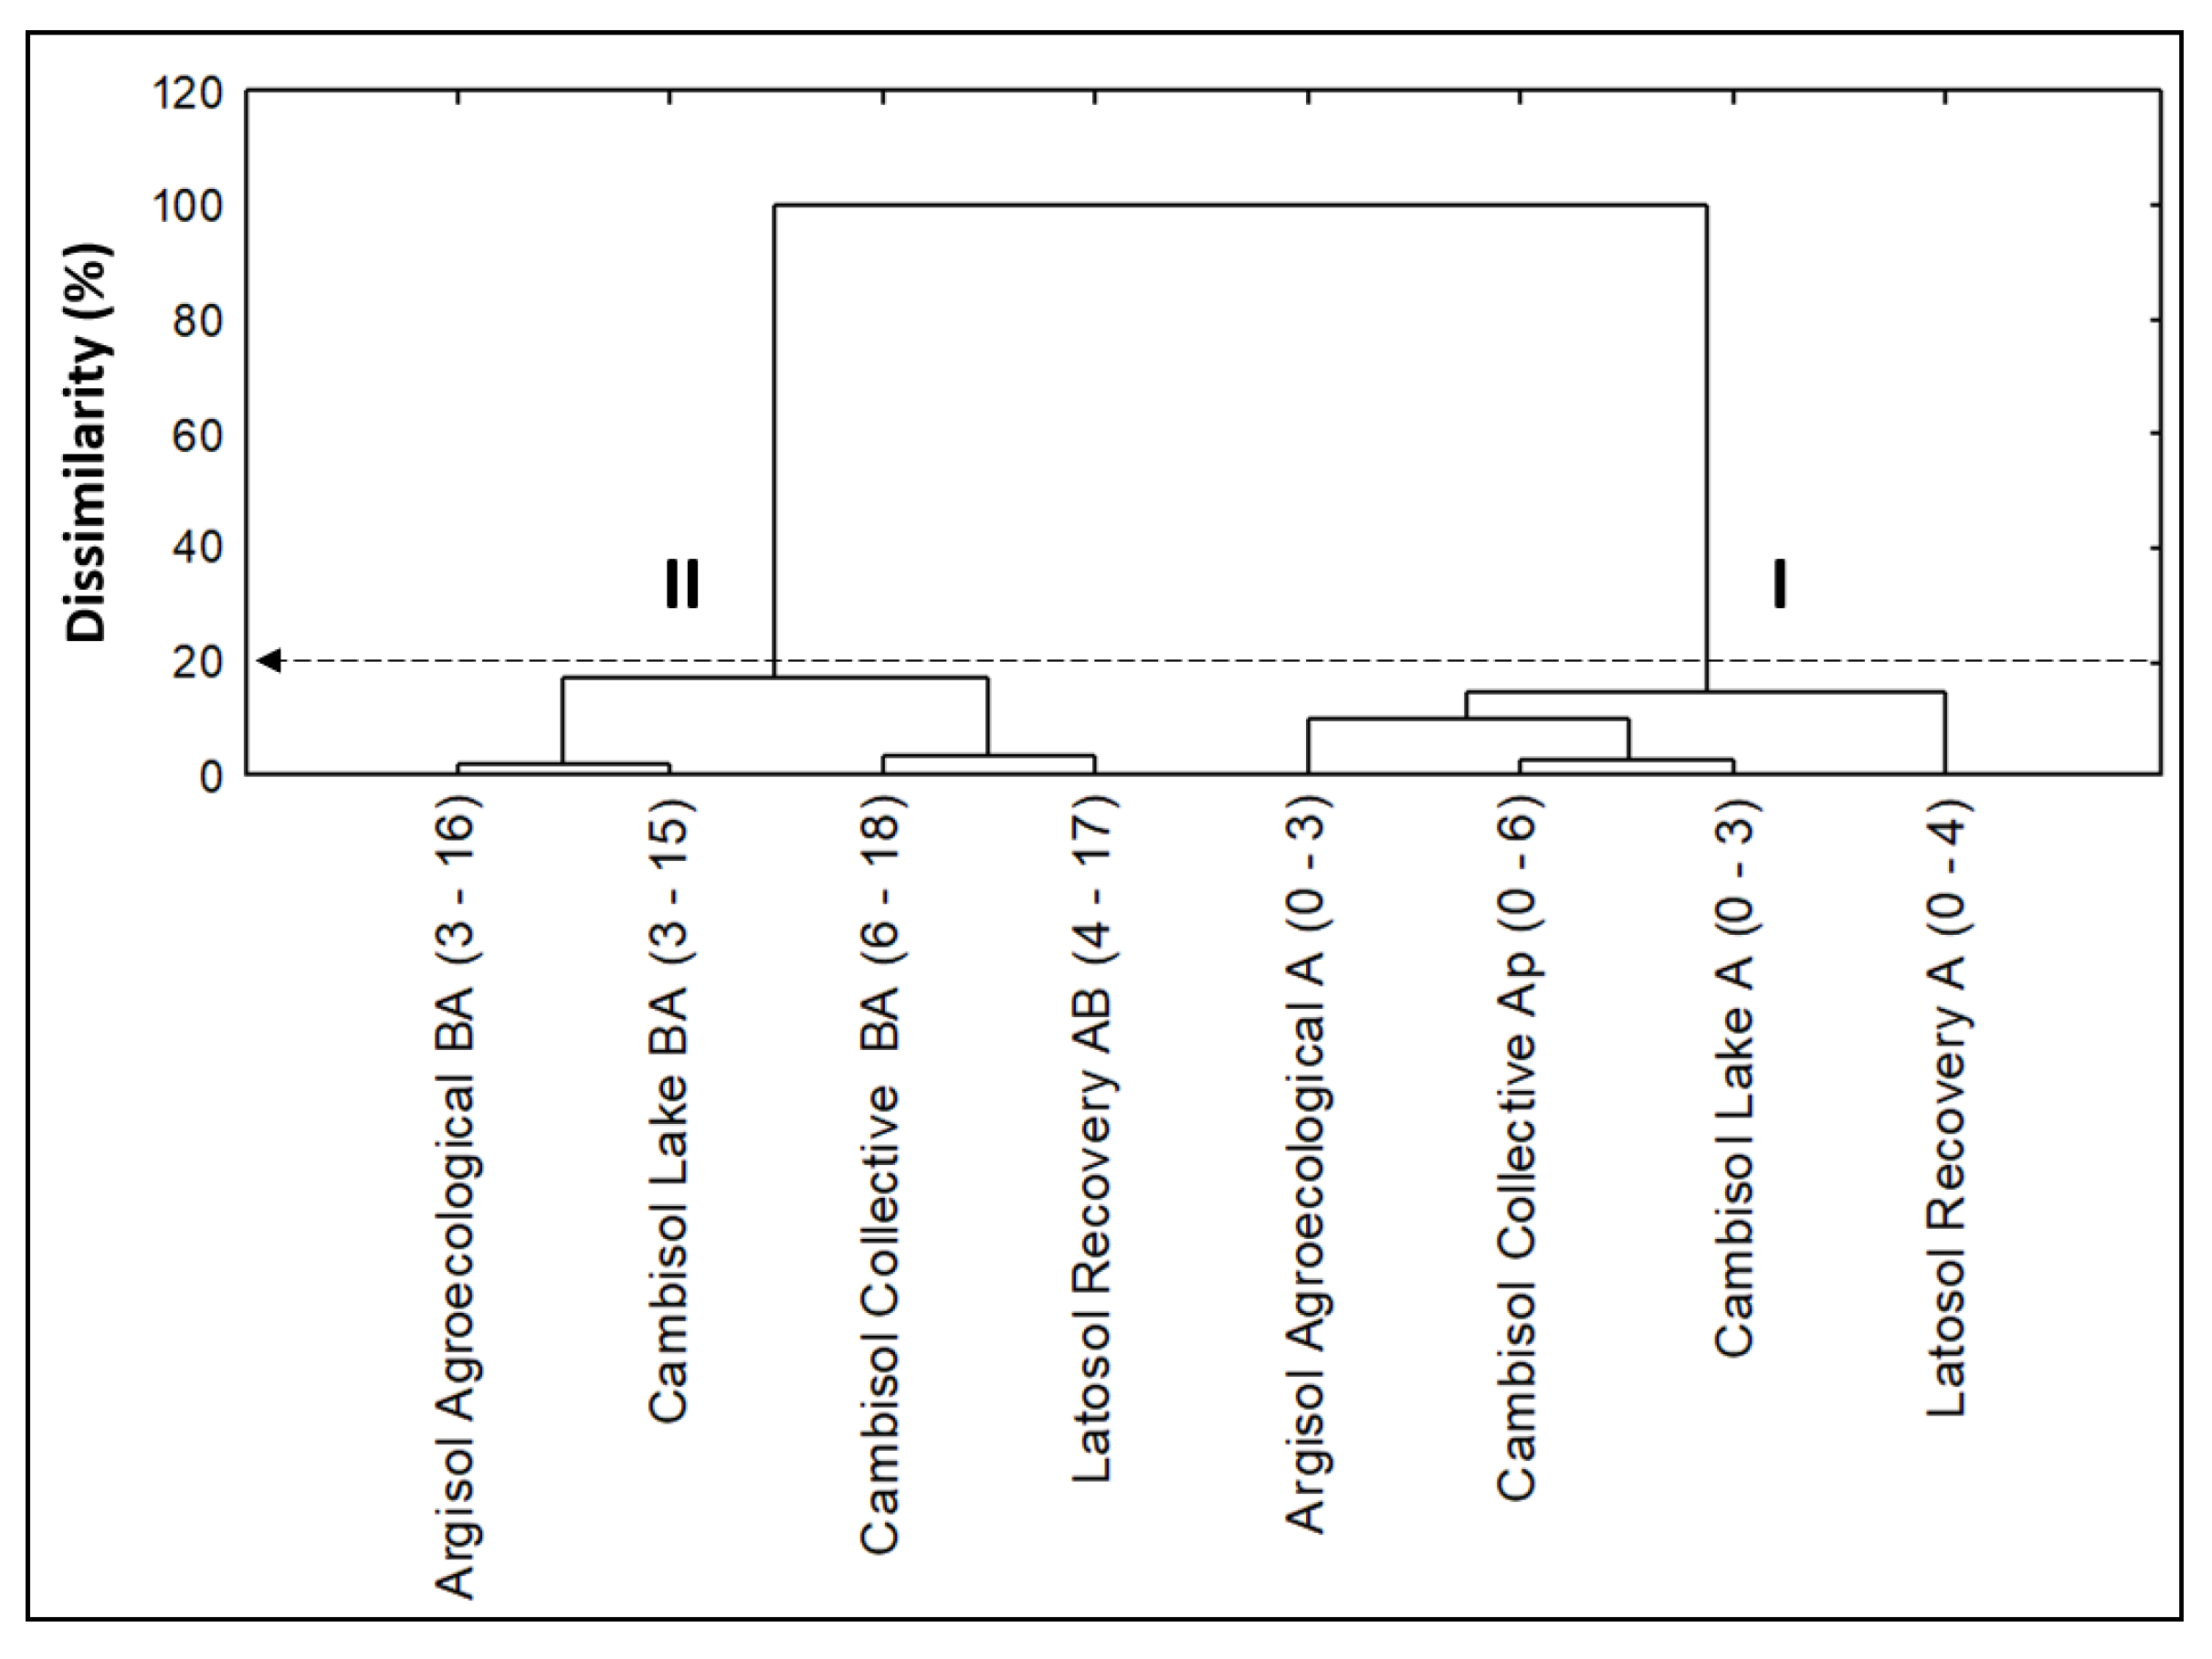
In the cluster analysis, Group I was formed by physical and structural variables that expose surface phenomena, e.g., the accentuated presence of TOC, especially in A2 (CAMBISOL) and A4 (ARGISOL), which provide improvements in other physical attributes, e.g., TP and the maintenance of U (Figure 6). In the case of chemical attributes, the pH, SB, and EC variables are specifically associated with the cambisol class (representative of the Apodi Plateau region). These soils are derived from the limestone rock of the Jandaíra formation. They are rich in exchangeable bases, e.g., calcium and magnesium, which raise the pH and EC of the soil, making it alkaline [63,103]. Furthermore, the climate pattern of the semi-arid region contributes to the permanence of bases in the system [104].
Group II discriminates the Q variable, linking it with the subsurface of agroecosystems. Q showed values above the established limits (2 MPa or 2000 kPa) in all soil layers. Benevenute et al. [9] and Lima et al. [105] reported that the pressure from the passage of machinery associated with agricultural implements used for sowing, cultivation, and harvesting results in increased resistance to root penetration and soil degradation on the surface and subsurface layers. This action causes a rearrangement and then the packing of clay particles, which raises the Q.
Vaz and collaborators obtained a positive correlation of clay on Q increase in their study with Brazilian latosols [106]. The authors reported that clay values above 35% raised the Q parameter. On the other hand, Sobucki et al. [107] reported the interrelationships of soil attributes that interfere with critical Q values, e.g., clay, soil density, mineralogy, and total organic carbon. This is attributed to the arrangement of clay particles in the subsurface compared to the arrangement of other inorganic soil fractions (silt and sand). Thus, the damage caused to the functionality of the porous network by inadequate management alters the physical attributes of the soil [94], compromising its drainage [60,108,109].
The argisol had TOC, SB, silt, and EC as discriminant variables (Figure 7). The high levels of TOC on the surface came from the addition of plant residues. This occurred even under a semi-arid climate, which has little primary biomass, and weather conditions accelerate the process of plant decomposition. Similar results were achieved by Sousa et al. [110], Singh et al. [111], and Sulieman et al. [112]. The weather pattern was also responsible for the EC values on the surface, but with no restrictions on salinity and sodium concentrations, according to Santos [30]. The silt fraction showed higher surface values and an intermediate degree of pedogenetic development. The study carried out by Rêgo et al. [113] corroborates the results pointed out in this study.
The main limitations refer to the resistance to root penetration into the soil, a parameter used to estimate the mechanical impediment that the soil provides to roots and is a physical attribute highly related to plant growth (compaction), negatively interfering with root growth and consequently affecting the natural development of plants.
The scientific merit of this study allows for an integrative and multidisciplinary understanding of the factors involved and their interrelationships with field and laboratory information, being perfectly reproducible in strategic areas on both regional and global scales. Furthermore, this study encourages new conservation practices and actions that complement other areas of soil science.
This study also encourages the establishment of a soil science database containing information regarding physical, structural, and chemical properties, as well as integrating geostatistical tools in the strategic areas of food production and the conservation of natural resources. The main practical implications of this study refer to decision-making regarding the best manner of using and managing natural resources in different environments while assessing their potentials and limitations.

5. Conclusions

The study evaluated the interrelationships between the water–structural and chemical attributes of soils and the properties of soil resistance to root penetration and water infiltration in areas with four land uses: Recovery (LATOSOL); Lake (CAMBISOL); Collective use (CAMBISOL); and Agroecological use (ARGISOL) in the semi-arid region of northeastern Brazil. Our results suggest that geostatistics through kriging complemented the multivariate analysis, reinforcing the accuracy of our findings, especially with regard to soil resistance to root penetration.
There was variability in our findings, with restrictions regarding resistance to root penetration and water infiltration into the soil, mainly in the Lake Area (CAMBISOL) at a lower elevation, with the analysis successfully discriminating the clay texture of the soil, the density, and the total porosity, factors associated with the water deficit in the region and contributing to restrictions regarding water–structural attributes.
The Agroecological Area (ARGISOL) was the only land use in which soil resistance to root penetration was not a discriminating variable through the multivariate analysis due to the high value of total organic carbon resulting from the conservation practices carried out in the area. However, the geostatistical analysis using kriging identified values of resistance to root penetration above the standard limit for crop development (2 MPa) in all land uses studied, demonstrating the importance of the complementary tool and corroborating one of the hypotheses of the study.
In the Collective Area (CAMBISOL) and Recovery Area (LATOSOL), the history of land uses with intensive soil preparation, involving compaction caused by animals and agricultural machinery traffic, contributed to water–structural restrictions (resistance to root penetration and water infiltration into the soil), compromising the porous arrangement.
In general, the results indicate variations in soil resistance as a function of physicochemical attributes (texture, total organic carbon, and sum of bases), with higher critical values of Q in the Lake Area (4.7 MPa) compared to the Collective Area (3.8 MPa) on the surface. Thus, a soil management plan with mitigating actions is suggested to conserve and recover the areas.
Among the existing conservation practices, minimum preparation, maintenance of vegetation cover, and the maintenance of biological diversity are alternatives that can be highlighted for the studied agroecosystems. These measures are necessary in order not to compromise the porous arrangement of the soil and allow the adequate growth and development of the plant root system.

Author Contributions

P.M.S.D.: conceptualization, data curation, formal analysis, investigation, methodology, visualization, validation, project administration, writing—original draft. J.C.P.: conceptualization, investigation, data curation, methodology, visualization, validation, project administration, resources, supervision, writing—original draft. J.E.F.G.: data curation, formal analysis, investigation, software, writing—original draft, visualization, validation, writing—review and editing. R.O.B.: conceptualization, investigation, data curation, methodology, visualization, validation, project administration, resources, supervision, writing—original draft. L.S.R.: methodology, visualization, validation, resources, supervision, writing—original draft. J.L.F.M.: data curation, methodology, visualization, validation, writing—review and editing. P.K.P.F.: data curation, methodology, visualization, validation, resources, writing—review and editing. P.J.M.: data curation, formal analysis, investigation, software, visualization, validation, writing—original draft, writing—review and editing. D.J.d.C.B.: data curation, formal analysis, investigation, writing—review and editing. L.C.d.A.L.F.: data curation, methodology, visualization, validation, writing—review and editing. G.X.d.M.: visualization, validation, data curation, formal analysis. F.d.O.M.: methodology, visualization, validation, writing—review and editing. F.O.d.O.: methodology, visualization, validation, resources, writing—review and editing. A.G.R.A.: data curation, formal analysis, investigation. C.M.d.N.: visualization, validation, data curation. All authors have read and agreed to the published version of the manuscript.

Funding

This research was financed by the CAPES institutional support program—coordination for the improvement of higher education personnel.

Institutional Review Board Statement

Not applicable.

Data Availability Statement

The datasets generated during and/or analyzed during the current study are available from the corresponding author on reasonable request.

Acknowledgments

We thank Pro Rectory Research and Graduate Studies (PROPPG), the Graduate Program in Soil and Water Management (PPGMSA) of the Federal Rural University of the Semi-Arid (UFERSA) and the ‘Coordenação de Aperfeiçoamento de Pessoal de Nível Superior’ (CAPES), for the financial support in order to carry out the research.

Conflicts of Interest

The authors declare no conflict of interest.

References

  1. Xing, S.; Zhang, G.; Zhu, P.; Wang, L.; Wang, Z.; Wang, C. Variation in shear strength of soil-root system under five typical land use types on the Loess Plateau of China. CATENA 2023, 222, 106883. [Google Scholar] [CrossRef]
  2. Gürsoy, S.; Türk, Z. Effects of land rolling on soil properties and plant growth in chickpea production. Soil Tillage Res. 2019, 195, 104425. [Google Scholar] [CrossRef]
  3. Chen, S.; Zhang, G.; Zhu, P.; Wang, C.; Wan, Y. Impact of land use type on soil erodibility in a small watershed of rolling hill northeast China. Soil Tillage Res. 2023, 227, 105597. [Google Scholar] [CrossRef]
  4. Cui, Z.; Huang, Z.; Luo, J.; Qiu, K.; Vicente, M.L.; Wu, G.L. Litter cover breaks soil water repellency of biocrusts, enhancing initial soil water infiltration and content in a semi-arid sandy land. Agric. Water Manag. 2021, 255, 107009. [Google Scholar] [CrossRef]
  5. Liu, Z.; Ma, D.; Hu, W.; Li, X. Land use dependent variation of soil water infiltration characteristics and their scale-specific controls. Soil Tillage Res. 2018, 178, 139–149. [Google Scholar] [CrossRef]
  6. Basset, C.; Najm, M.A.; Ghezzehei, T.; Hao, X.; Daccache, A. How does soil structure affect water infiltration? A meta-data systematic review. Soil Tillage Res. 2023, 226, 105577. [Google Scholar] [CrossRef]
  7. Zhang, Y.; Hartermink, A.E.; Huang, J.; Minasny, B. Digital Soil Morphometrics. In Encyclopedia of Soils in the Environment; Academic Press: Cambridge, MA, USA, 2023. [Google Scholar]
  8. Dexter, A.R. Advances in Characterization of Soil Structure. Soil Tillage Res. 1988, 11, 199–238. [Google Scholar] [CrossRef]
  9. Benevenute, P.A.N.; de Morais, E.G.; Souza, A.A.; Vasques, I.C.F.; Cardoso, D.P.; Sales, F.R.; Severiano, E.C.; Homem, B.G.C.; Casagrande, D.R.; Silva, B.M. Penetration Resistance: An Effective Indicator for Monitoring Soil Compaction in Pastures. Ecol. Indic. 2020, 117, 106647. [Google Scholar] [CrossRef]
  10. Schjønning, P.; Lamandé, M.; Munkholm, L.J.; Lyngvig, H.S.; Nielsen, J.A. Soil Precompression Stress, Penetration Resistance and Crop Yields in Relation to Differently-Trafficked, Temperate-Region Sandy Loam Soils. Soil Tillage Res. 2016, 163, 298–308. [Google Scholar] [CrossRef]
  11. da Silva, W.M.; Bianchini, A.; da Cunha, C.A. Modeling and Correction of Soil Penetration Resistance for Variations in Soil Moisture and Soil Bulk Density. Eng. Agrícola 2016, 36, 449–459. [Google Scholar] [CrossRef]
  12. Vaz, C.M.P.; Manieri, J.M.; de Maria, I.C.; Van Genuchten, M. Scaling the Dependency of Soil Penetration Resistance on Water Content and Bulk Density of Different Soils. Soil Sci. Soc. Am. J. 2013, 77, 1488–1495. [Google Scholar] [CrossRef]
  13. Wang, H.; Wang, L.; Huang, X.; Gao, W.; Ren, T. An empirical model for estimating soil penetrometer resistance from relative bulk density, matric potential, and depth. Soil Tillage Res. 2021, 208, 104904. [Google Scholar] [CrossRef]
  14. Catania, P.; Badalucco, L.; Laudicina, V.A.; Vallone, M. Effects of tilling methods on soil penetration resistance, organic carbon and water stable aggregates in a vineyard of semiarid Mediterranean environment. Environ. Earth Sci. 2018, 77. [Google Scholar] [CrossRef]
  15. Al-Qinna, M.; Abu-Awwad, A. Infiltration Rate Measurements in Arid Soils 706 with surface crust. Irrig. Sci. 1998, 18, 83–89. [Google Scholar] [CrossRef]
  16. Cui, Z.; Wu, G.L.; Huang, Z.; Liu, Y. Fine roots determine soil infiltration potential than soil water content in semi-arid grassland soils. J. Hydrol. 2019, 578, 124023. [Google Scholar] [CrossRef]
  17. Li, J.; Wang, W.; Guo, M.; Kang, H.; Wang, Z.; Huang, J.; Sun, B.; Wang, K.; Zhang, G.; Bai, Y. Effects of soil texture and gravel content on the infiltration and soil loss of spoil heaps under simulated rainfall. J. Soils Sediments 2020, 20, 3896–3908. [Google Scholar] [CrossRef]
  18. Liu, Y.; Guo, L.; Huang, Z.; López-Vicente, M.; Wu, G.L. Root morphological characteristics and soil water infiltration capacity in semi-arid artificial grassland soils. Agric. Water Manag. 2020, 235, 106153. [Google Scholar] [CrossRef]
  19. Oda, M.; Rasyid, B.; Omae, H. Root Mass May Affect Soil Water Infiltration More Strongly than the Incorporated Residue. F1000Res 2020, 7, 1523. [Google Scholar] [CrossRef]
  20. Stone, L.R.; Schlegel, A.J. Tillage and Crop Rotation Phase Effects on Soil Physical Properties in the West-Central Great Plains. Agron. J. 2010, 102, 483–491. [Google Scholar] [CrossRef]
  21. Mendes, K.R.; Portela, J.C.; Gondim, J.E.F.; Ribeiro, M.A.; Medeiros, J.F.; Queiroz, G.C.M. Physical, chemical and structural attributes of soil in agroecosystems in the Brazilian Semi-arid region. Rev. Ciência Agronômica 2022, 53, 1–10. [Google Scholar] [CrossRef]
  22. Gan, F.; Shi, H.; Gou, J.; Zhang, L.; Liu, C. Effects of bedrock strata dip on soil infiltration capacity under different land use types in a karst trough valley of Southwest China. CATENA 2023, 230, 107253. [Google Scholar] [CrossRef]
  23. Nuralykyzy, B.; Nurzhan, A.; Li, N.; Huang, Q.; Zhu, Z.; An, S. Influence of land use types on soil carbon fractions in the Qaidam Basin of the Qinghai-Tibet Plateau. CATENA 2023, 231, 107273. [Google Scholar] [CrossRef]
  24. Júnior, V.V.; Carvalho, M.P.; Dafonte, J.; Freddi, O.S.; Vidal Vázquez, E.; Ingaramo, O.E. Spatial Variability of Soil Water Content and Mechanical Resistance of Brazilian Ferralsol. Soil Tillage Res. 2006, 85, 166–177. [Google Scholar] [CrossRef]
  25. Sağlam, M.; Dengiz, O. Spatial variability of soil penetration resistance in na alluvial delta plain under different land uses in middle Black Sea Region of Turkey. Arch. Agron. Soil Sci. 2017, 63, 60–73. [Google Scholar] [CrossRef]
  26. Souza, M.D.C.; de Oliveira, F.P.; Silva, J.R.; Martins, A.F.; da Silva, P.L.F. Spatial variability of resistance to penetration in soil under sugarcane crops with different harvest Methods. Rev. Caatinga 2020, 33, 480–489. [Google Scholar] [CrossRef]
  27. Mota, J.C.A.; Assis, J.; Amaro, F.J.; Libardi, P.L. Some physical and water properties of three soils in Chapada do Apodi, RN, cultivated with melon. Rev. Bras. Ciência Solo 2008, 32, 49–58. [Google Scholar] [CrossRef]
  28. Dubreuil, V.; Fante, K.P.; Planchon, O.; Neto, J.L.S. Os Tipos de Climas Anuais No Brasil: Uma Aplicação Da Classificação de Köppen de 1961 a 2015. Rev. Fr.-Bras. Geogr. 2018, 37. [Google Scholar] [CrossRef]
  29. IUSS Working Group. World Reference Base for Soil Resources 2014 International Soil Classification System for Naming Soils and Creating Legends for Soil Maps; FAO—Food and Agriculture Organization of the United Nations: Rome, Italy, 2014; p. 192. [Google Scholar]
  30. Dos Santos, H.G.; Jacomine, P.K.T.; Dos Anjos, L.H.C.; Oliveira, V.A.; Lumbreras, J.F.; Coelho, M.R.; Almeida, J.A.; Filho, J.C.A.; Oliveira, J.B.; Cunha, T.J.F. Sistema Brasileiro de Classificação de Solos (SiBCS), 5th ed.; EMBRAPA: Brasília, Brazil, 2018; p. 356. [Google Scholar]
  31. ASAE Standard: ASAE EP542; AMERICAN SOCIETY OF AGRICULTURAL ENGINEERS. Procedures for using and reporting data obtained with the soil cone penetrometer. St Joseph. ASAE: Washington, DC, USA; p. 9646.
  32. Bernardo, S.; Soares., A.A.; Mantovani, E.C. Manual de Irrigação, 8th ed.; Editora UFV: Viçosa, Brazil, 2008; p. 622. [Google Scholar]
  33. Teixeira, P.C.; Donagemma, G.K.; Fontana, A.; Teixeira, W.G. Manual de Métodos de Análise de Solo, 3rd ed.; Embrapa Solos: Brasília, Brazil, 2017. [Google Scholar]
  34. Gee, G.W.; Or, D. Particle Size Analysis. In Methods of Soil Analysis: Part 4 Physical Methods, 1st ed.; Dane, J.H., Topp, G., Eds.; Soil Science Society of America, Inc.: Madison, WI, USA, 2002; pp. 255–293. [Google Scholar] [CrossRef]
  35. Blake, G.R.; Hartge, K.H. Bulk Density. In Methods of Soil Analysis: Part 1 Physical and Mineralogical Methods, 2nd ed.; Klute, A., Ed.; American Society of Agronomy, Inc.: Madison, WI, USA; Soil Science Society of America, Inc.: Madison, WI, USA, 1986; pp. 363–375. [Google Scholar] [CrossRef]
  36. Kiehl, J. Manual de Edafologia-Relações Solo-Planta; Agronômica Ceres: São Paulo, Brazil, 1979; p. 272. [Google Scholar]
  37. Yeomans, J.C.; Bremner, J.M. A rapid and precise method for routine determination of organic carbon in soil. Commun. Soil Sci. Plant Anal. 2008, 19, 1467–1476. [Google Scholar] [CrossRef]
  38. Minasny, B.; Mcbratney, A.B.; Whelan, B.M. Vesper Version 1.62; Centre for Precision Agriculture: Sydney, Australia, 2005. [Google Scholar]
  39. Sherman, L.W.; Strang, H.; Barnes, G.; Woods, D.J.; Bennett, S.; Inkpen, N.; Newbury-Birch, D.; Rossner, M.; Angel, C.; Mearns, M.; et al. Twelve experiments in restorative justice: The Jerry Lee program of randomized trials of restorative justice conferences. J. Exp. Criminol. 2015, 11, 501–540. [Google Scholar] [CrossRef]
  40. Couto, E.G.; Klamt, E.; Stein, A. Estimativa do teor de argila e do potássio trocável em solos esparsamente amostrados no sul do estado de Mato Grosso. Rev. Bras. Ciência Solo 2000, 24, 129–140. [Google Scholar] [CrossRef]
  41. Akaike, H. Information Theory and an Extension of the Maximum Likelihood Principle. In Selected Papers of Hirotugu Akaike, 1st ed.; Parzen, E., Tanabe, K., Kitagawa, G., Eds.; Springer—International Publisher: New York, NY, USA, 1997; pp. 199–213. [Google Scholar]
  42. Ribeiro, C.A. Variabilidade Espacial da Resistência Mecânica do solo à Penetração em áreas Mecanizadas de cana-de-açúcar (Saccharum Officinarum). xiv, 69 f. Master’s Thesis, São Paulo State University, Faculty of agricultural and veterinary sciences, Jaboticabal, Brazil, 2010. [Google Scholar]
  43. Cambardella, C.A.; Moorman, T.B.; Novak, J.M.; Parkin, T.B.; Karlen, D.L.; Turco, R.F.; Konopka, A.E. Field-Scale Variability of Soil Properties in Central Iowa Soils. Soil. Sci. Soc. Am. J. 1994, 58, 1501–1511. [Google Scholar] [CrossRef]
  44. Statsoft, I.N.C. STATISTICA (sistema de software de análise de dados). Versão 2004, 7, 1984–2004. [Google Scholar]
  45. Hair, J.F.; Hult, G.T.M.; Ringle, C.M.; Sarstedt, M.A. Primer on Partial Least Squares Structural Equation Modeling (PLS-SEM), 2nd ed.; SAGE Publications, Inc.: Thousand Oaks, CA, USA, 2017; p. 328. [Google Scholar]
  46. Dalchiavon, F.C.; de Carvalho, M.P.E.; Andreotti, M.; Montanari, R. Variabilidade espacial de atributos da fertilidade de um Latossolo Vermelho Distroférrico sob Sistema Plantio Direto. Rev. Ciência Agronômica 2012, 43, 453–461. [Google Scholar] [CrossRef]
  47. Oliveira Junior, J.C.; de Souza, L.C.P.; de Melo, V.F.; Rocha, H.O. Variabilidade espacial de atributos mineralógicos de solos da formação Guabirotuba, 907 Curitiba (PR). Rev. Bras. Ciência Solo 2011, 35, 1481–1490. [Google Scholar] [CrossRef]
  48. Lemos Filho, L.C.A.; de Oliveira, E.L.; de Faria, M.A.; de Andrade, L.A.B. Spatial variability of soil density and organic matter content in area cultivated with sugar cane (Saccharum officinarum L.) Variação espacial da densidade do solo e matéria orgânica em área cultivada com cana-de-açúcar (Saccharum officinarum L.). Rev. Cienc. Agrônomica 2008, 39, 193–202. [Google Scholar]
  49. Quan, X.; He, J.; Cai, Q.; Sun, L.; Li, X.; Wang, S. Soil erosion and deposition characteristics of slope surfaces for two loess soils using indoor simulated rainfall experiment. Soil Tillage Res. 2020, 204, 104714. [Google Scholar] [CrossRef]
  50. Kebebew, S.; Bedadi, B.; Erkossa, T.; Yimer, F.; Wogi, L. Effect of Different Land-Use Types on Soil Properties in Cheha District, South-Central Ethiopia. Sustainability 2022, 14, 1323. [Google Scholar] [CrossRef]
  51. Topa, D.; Cara, I.G.; Jităreanu, G. Long term impact of different tillage systems on carbon pools and stocks, soil bulk density, aggregation and nutrients: A field meta-analysis. Catena 2021, 199, 105102. [Google Scholar] [CrossRef]
  52. Fernández, R.; Frasier, I.; Quiroga, A.; Noellemeye, E. Pore morphology reveals interaction of biological and physical processes for structure formation in soils of 782 the semi-arid Argentinean Pampa. Soil Tillage Res. 2019, 191, 256–265. [Google Scholar] [CrossRef]
  53. Da Costa, J.D.; Portela, J.C.; Farias, P.K.P.; Sobrinho, F.E.; Souza, C.M.M.; de Lopes, T.C.S.; Silva, F.W.A. Characterization and Classification of Soils of the Terra da Esperança Settlement Project in Chapada do Apodi, Brazil. J. Agric. Sci. 2019, 11, 235. [Google Scholar] [CrossRef]
  54. da Freddi, O.S.; Centurion, J.F.; Duarte, A.P.; Leonel, C.L. Compactação do solo e produção de cultivares de milho em latossolo vermelho: I—Características de planta, solo e índice S. Rev. Bras. Ciência Solo 2009, 33, 793–803. [Google Scholar] [CrossRef]
  55. Oro, L.A.; Colazo, J.C.; Avecilla, F.; Buschiazzo, D.E.; Asensio, C. Relative soil water content as a factor for wind erodibility in soils with different texture and aggregation. Aeolian Res. 2019, 37, 25–31. [Google Scholar] [CrossRef]
  56. Yang, C.; Wu, J.; Li, P.; Wang, Y.; Yang, N. Evaluation of soil-water characteristic curves for different textural soils using fractal analysis. Water 2023, 15, 772. [Google Scholar] [CrossRef]
  57. da Corado Neto, F.C.; de Sampaio, F.M.T.; da Veloso, M.E.C.; Matias, S.S.R.; Andrade, F.R.; Lobato, M.G.R. Variabilidade Espacial da Resistência à Penetração em Neossolo Litólico Degradado. Rev. Bras. Ciência Solo 2015, 39, 1353–1361. [Google Scholar] [CrossRef]
  58. Souza, R.; Hartzell, S.; Freire Ferraz, A.P.; de Almeida, A.Q.; de Sousa Lima, J.R.; Dantas Antonino, A.C.; de Souza, E.S. Dynamics of soil penetration resistance in water-controlled environments. Soil Tillage Res. 2021, 205, 104768. [Google Scholar] [CrossRef]
  59. Sion, B.D.; Shoop, S.A.; McDonald, E.V. Evaluation of in-situ relationships between variable soil moisture and soil strength using a plot-scale experimental design. J. Terramech. 2022, 103, 33–51. [Google Scholar] [CrossRef]
  60. Hlaváčiková, H.; Holko, L.; Danko, M.; Novák, V. Estimation of macropore flow characteristics in stony soils of a small mountain catchment. J. Hydrol. 2019, 574, 1176–1187. [Google Scholar] [CrossRef]
  61. Ramos, M.F.; da Silva Almeida, W.R.; do Amaral, R.D.L.; Suzuki, L.E.A.S. Degree of compactness and soil quality of peach orchards with different production ages. Soil Tillage Res. 2022, 219, 105324. [Google Scholar] [CrossRef]
  62. Koudahe, K.; Allen, S.C.; Djaman, K. Critical review of the impact of cover crops on soil properties. Int. Soil Water Conserv. Res. 2022, 10, 343–354. [Google Scholar] [CrossRef]
  63. Paiva, C.A.; de Medeiros, J.F.; de Almeida, J.G.L.; Aroucha, E.M.M. Desempenho do melão Gália cultivado sob diferentes relações catiônicas do solo. Semin. Ciências Agrárias 2021, 42, 3089–3106. [Google Scholar] [CrossRef]
  64. Allison, L.E.; Bernstein, L.; Bower, C.A.; Brown, J.W.; Fireman, M.; Hatcher, J.T.; Hayward, H.E.; Pearson, G.A.; Reeve, R.C.; Richards, L.A.; et al. Diagnosis and Improvement of Saline and Alkaline Soils; US Department of Agriculture: Washington, DC, USA, 1954; pp. 1–147. [Google Scholar]
  65. Sparks, D.L. Environmental Soil Chemistry, 2nd ed.; Academic Press: San Diego, CA, USA, 2003; p. 352. [Google Scholar]
  66. Zaman, M.; Shahid, S.A.; Heng, L. Guideline for Salinity Assessment, Mitigation and Adaptation Using Nuclear and Related Techniques, 1st ed.; Springer International Publishing: Cham, Switzerland, 2018; p. 183. [Google Scholar] [CrossRef]
  67. Zhao, C.; Miao, Y.; Yu, C.; Zhu, L.; Wang, F.; Jiang, L.; Hui, D.; Wan, S. Soil microbial community composition and respiration along an experimental precipitation gradient in a semi-arid steppe. Sci. Rep. 2016, 6, 24317. [Google Scholar] [CrossRef] [PubMed]
  68. Guerra, M.D.F.; de Souza, J.J.L.L.; Schaefer, C.E.G.R.; de Souza, M.J.N. Remnant wetlands under palm swamps in the Araripe Plateau, Brazilian semi-arid. Catena 2023, 226, 107074. [Google Scholar] [CrossRef]
  69. de Souza Oliveira Filho, J.; da Silva Barrozo, M.V.; de Holanda Bastos, F.; Pereira, M.G. Effects of climate and land-use on physicochemical properties of gneiss-derived soils in tropical drylands: Evidence from northeastern Brazil. Geoderma Reg. 2023, 33, e00639. [Google Scholar] [CrossRef]
  70. Zhang, Z.; Qiang, H.; McHugh, A.D.; He, J.; Li, H.; Wang, Q.; Lu, Z. Effect of conservation farming practices on soil organic matter and stratification in a mono- cropping system of Northern China. Soil Tillage Res. 2016, 156, 173–181. [Google Scholar] [CrossRef]
  71. Ferrari, J.M.S.; Gabriel, C.P.C.; Silva, T.B.G.; Mota, F.D.; Gabriel Filho, L.R.A.; Tanaka, E.M. Análise da variabilidade espacial da resistência à penetração do solo em diferentes profundidades/analysis of the spatial variability of resistance to soil penetration at diferente depths. Rev. Bras. Eng. Biossistemas 2018, 12, 164. [Google Scholar] [CrossRef]
  72. Cortez, J.W.; Cavassini, V.H.; de Motomiya, A.V.A.; Orlando, R.C.; Valente, I.Q.M. Spatialization of soil resistance to penetration for localized management by precision agriculture Tools. Eng. Agrícola 2018, 38, 690–696. [Google Scholar] [CrossRef]
  73. Campos, M.C.C.; de Oliveira, I.A.; dos Santos, L.A.C.; Aquino, R.E.; Soares, M.R.D. Variabilidade espacial da resistência do solo à penetração e umidade em áreas 738 cultivadas com mandioca na região de Humaitá, AM. Rev. Agro@Mbiente Line 2012, 6, 9. [Google Scholar] [CrossRef]
  74. Alonso, A.; Froidevaux, M.; Javaux, M.; Laloy, E.; Mattern, S.; Roisin, C.; Vanclooster, M.; Bielders, C. A hybrid method for characterizing tillage-induced soil physical quality at the profile scale with fine spatial details. Soi Tillage Res. 2022, 216, 00124. [Google Scholar] [CrossRef]
  75. Arshad, M.; Ranamukhaarachchi, S.L.; Ahmad, S.; Nawaz, R.; Qayyum, M.M.N.; Razaq, A.; Faiz, F. Variability and correlation of selected soil attributes and maize yield influenced by tillage systems in mountainous agroecosystem. J. Soil Water Conserv. 2022, 77, 466–481. [Google Scholar] [CrossRef]
  76. Bettoni, M.; Maerker, M.; Bosino, A.; Conedera, M.; Simoncelli, L.; Vogel, S. Land use effects on surface runoff and soil erosion in a southern Alpine valley. Geoderma 2023, 435, 116505. [Google Scholar] [CrossRef]
  77. Schmidt, J.P.; Taylor, R.K.; Milliken, G.A. Evaluating the Potential for Site-Specific Phosphorus Applications Without High-Density Soil Sampling. Soil Sci. Soc. Am. J. 2002, 66, 276–283. [Google Scholar] [CrossRef]
  78. de Souza, Z.M.; de Souza, G.S.; Marques Júnior, J.; Pereira, G.T. Número de amostras na análise geoestatística e na krigagem de mapas de atributos do solo. Ciência Rural 2014, 44, 261–268. [Google Scholar] [CrossRef]
  79. Aquino, R.E.; Campos, M.C.C.; Oliveira, I.A.; Siqueira, D.S.; Soares, M.D.R.; Freitas, L. Técnicas geoestatísticas na avaliação de atributos químicos em Cambissolo com agrofloresta e cana-de-açúcar em Humaitá, Amazonas. Brazilian J. Agric. Sci. 2015, 10, 544–552. [Google Scholar] [CrossRef]
  80. de Lima, C.L.R.; da Silva, A.P.; Imhoff, S.; Leão, T.P. Estimativa da capacidade de suporte de carga do solo a partir da avaliação da resistência à penetração. Rev. Bras. Ciência Solo 2006, 30, 217–223. [Google Scholar] [CrossRef]
  81. Gao, W.; Watts, C.W.; Ren, T.; Whalley, W.R. The effects of compaction and soil drying on penetrometer resistance. Soil Tillage Res. 2012, 125, 14–22. [Google Scholar] [CrossRef]
  82. Tang, C.S.; Gong, X.P.; Shen, Z.; Cheng, Q.; Inyang, H.; Lv, C.; Shi, B. Soil micro-penetration resistance as an index of its infiltration processes during rainfall. J. Rock Mech. Geotech. Eng. 2022, 14, 1580–1587. [Google Scholar] [CrossRef]
  83. Guimarães, R.M.L.; Ball, B.C.; Tormena, C.A.; Giarola, N.F.B.; da Silva, Á.P. Relating visual evaluation of soil structure to other physical properties in soils of contrasting texture and management. Soil Tillage Res. 2013, 127, 92–99. [Google Scholar] [CrossRef]
  84. Mota, J.C.A.; Assis, J.R.N.; Amaro F., J.; Libardi, P.L. Algumas propriedades físicas e hídricas de três solos na Chapada do Apodi, RN, cultivados com melão. Rev. Bras. Ciência Solo 2008, 32, 49–58. [Google Scholar] [CrossRef]
  85. Mohieddinne, H.; Brasseur, B.; Spicher, F.; Gallet-Moron, E.; Buridant, J.; Kobaissi, A.; Horen, H. Physical recovery of forest soil after compaction by heavy machines, revealed by penetration resistance over multiple decades. For. Ecol. Manag. 2019, 449, 117472. [Google Scholar] [CrossRef]
  86. Schäffer, J. Recovery of soil structure and fine root distribution in compacted forest soils. Soil Syst. 2022, 6, 49. [Google Scholar] [CrossRef]
  87. Ambus, J.V.; Reichert, J.M.; Gubiani, P.I.; de Faccio Carvalho, P.C. Changes incomposition and functional soil properties in long-term no-till integrated crop-livestock system. Geoderma 2018, 330, 232–243. [Google Scholar] [CrossRef]
  88. Beylich, A.; Oberholzer, H.R.; Schrader, S.; Höper, H.; Wilke, B.M. Evaluation of soil compaction effects on soil biota and soil biological processes in soils. Soil Tillage Res. 2010, 109, 133–143. [Google Scholar] [CrossRef]
  89. Chellappa, J.; Sagar, K.L.; Sekaran, U.; Kumar, S.; Sharma, P. Soil organic carbon, aggregate stability and biochemical activity under tilled and no-tilled agroecosystems. J. Agric. Res. 2021, 4, 100139. [Google Scholar] [CrossRef]
  90. Jiang, L.; Wang, Z.; Zuo, Q.; Du, H. Simulating the impact of land use change on ecosystem services in agricultural production areas with multiple scenarios considering ecosystem service richness. J. Clean. Prod. 2023, 397, 136485. [Google Scholar] [CrossRef]
  91. Anusha, B.N.; Babu, K.R.; Kumar, B.P.; Sree, P.P.; Veeraswamy, G.; Swarnapriya, C.; Rajasekhar, M. Integrated studies for land suitability analysis towards sustainable agricultural development in semi-arid regions of AP, India. Geosyst. Geoenviron. 2023, 2, 100131. [Google Scholar] [CrossRef]
  92. Roy, P.S.; Ramachandran, R.M.; Paul, O.; Thakur, P.K.; Ravan, S.; Behera, M.D.; Sarangi, C.; Kanawade, V.P. Anthropogenic land use and land cover changes—A review on its environmental consequences and climate change. J. Indian Soc. Remote Sens. 2022, 50, 1615–1640. [Google Scholar] [CrossRef]
  93. dos Santos, P.G.; de Almeida, J.A.; Sequinatto, L. Mineralogy of the Clay Fraction and Chemical Properties of Soils Developed from Sedimentary Lithologies of Pirambóia, Sanga the Cabral and Guará Geological Forma tions in Southern Brazil. Rev. Bras. Ciência Solo 2017, 41, 1–19. [Google Scholar] [CrossRef]
  94. Reichert, J.M.; da Rosa, V.T.; Vogelmann, E.S.; da Rosa, D.P.; Horn, R.; Reinert, D.J.; Sattler, A.; Denardin, J.E. Conceptual framework for capacity and intensity physical soil properties affected by short and long-term (14 years) continuous no-tillage and controlled traffic. Soil Tillage Res. 2016, 158, 123–136. [Google Scholar] [CrossRef]
  95. Mileusnić, Z.I.; Saljnikov, E.; Radojević, R.L.; Petrović, D.V. Soil compaction due to agricultural machinery impact. J. Terramech. 2022, 100, 51–60. [Google Scholar] [CrossRef]
  96. Marinho, A.C.S.; Portela, J.C.; Silva, E.; Silva Dias, N.; Sousa, F.; Silva, A.; Silva, J. Organic matter and physicochemical attributes of a cambisol under different agricultural uses in a semi-arid region of Brazil. Aust. J. Crop. Sci. 2016, 10, 32–41. [Google Scholar]
  97. Carus, J.; Paul, M.; Schröder, B. Vegetation as self-adaptive coastal protection: Reduction of current velocity and morphologic plasticity of a brackish marsh pioneer. Ecol. Evol. 2016, 6, 1579–1589. [Google Scholar] [CrossRef] [PubMed]
  98. Kosmalla, V.; Keimer, K.; Schürenkamp, D.; Lojek, O.; Goseberg, N. Erosion resistance of vegetation-covered soils: Impact of different grazing conditions in salt marshes and analysis of soil-vegetation interactions by the novel DiCoastar method. Ecol. Eng. 2022, 181, 106657. [Google Scholar] [CrossRef]
  99. Gabriel, J.L.; García-González, I.; Quemada, M.; Martin-Lammerding, D.; Alonso-Ayuso, M.; Hontoria, C. Cover crops reduce soil resistance to penetration by preserving soil surface water content. Geoderma 2021, 386, 114911. [Google Scholar] [CrossRef]
  100. Mondal, S.; Chakraborty, D.; Das, T.K.; Shrivastava, M.; Mishra, A.K.; Bandyopadhyay, K.K.; Aggarwal, P.; Chaudhari, S.K. Conservation agriculture had a strong impact on the sub-surface soil strength and root growth in wheat after a 7-year transition period. Soil Tillage Res. 2019, 195, 104385. [Google Scholar] [CrossRef]
  101. Vendig, I.; Guzman, A.; De La Cerda, G.; Esquivel, K.; Mayer, A.C.; Ponisio, L.; Bowles, T.M. Quantifying direct yield benefits of soil carbon increases from cover cropping. Nat. Sustain. 2023, 1–10. [Google Scholar] [CrossRef]
  102. Qian, R.; Guo, R.; Naseer, M.A.; Zhang, P.; Chen, X.; Ren, X. Long-term straw incorporation regulates greenhouse gas emissions from biodegradable film farmland, improves ecosystem carbon budget and sustainable maize productivity. Field Crops Res. 2023, 295, 108890. [Google Scholar] [CrossRef]
  103. Lopes, T.C.d.S.; Portela, J.C.; Batista, R.O.; Bandeira, D.J.d.C.; Leite, I.d.O.; Ramalho, L.B.; Gondim, J.E.F.; Costa, J.D.d.; Gurgel, M.T.; Souza, C.M.M.; et al. Clay Fraction Mineralogy and Structural Soil Attributes of Two Soil Classes under the Semi-Arid Climate of Brazil. Land 2022, 11, 2192. [Google Scholar] [CrossRef]
  104. Matos, L.V.; Donato, S.L.R.; Kondo, M.K.; Lani, J.L.; Aspiazú, I. Soil attributes and the quality and yield of ‘Gigante’ cactus pear in agroecosystems of the semi-arid region of Bahia. J. Arid Environ. 2021, 185, 104325. [Google Scholar] [CrossRef]
  105. Lima, C.C.; De Maria, I.C.; Silva, G.J.W.; Figueiredo, G.C.; Dechen, S.C.F.; Bolonhezi, D. ROOT parameters of sugarcane and soil compaction indicators under deep strip tillage and conventional tillage. Sci. Rep. 2022, 12, 18537. [Google Scholar] [CrossRef]
  106. Vaz, C.M.P.; Manieri, J.M.; de Maria, I.C.; Tuller, M. Modeling and correction of soil penetration resistance for varying soil water content. Geoderma 2011, 166, 92–101. [Google Scholar] [CrossRef]
  107. Sobucki, V.; Holthusen, D.; Batistão, A.C.; Mota, J.C.A.; Reichert, J.M. Potential of rheometry in detecting cohesive soils in Brazil as an additional tool to morphological field description and tensile resistance quantification. Geoderma Reg. 2022, 30, e00553. [Google Scholar] [CrossRef]
  108. Cortez, J.W.; Armando, E.J.; de Motomiya, A.V.A.; Rodrigues, S.A.; Gonçalves, E.A. Soil physical Attributes before and after management under sowing forward speed. Eng. Agrícola 2019, 39, 607–615. [Google Scholar] [CrossRef]
  109. Hirmas, D.R.; Giménez, D.; Nemes, A.; Kerry, R.; Brunsell, N.A.; Wilson, C.J. Climate-induced changes in continental-scale soil macroporosity may intensify water cycle. Nature 2018, 561, 100–103. [Google Scholar] [CrossRef] [PubMed]
  110. Sousa, J.E.S.; dos Santos, J.C.B.; Corrêa, M.M.; do Nascimento, A.F.; Schulze, S.M.B.B.; Ferreira, T.O.; de Araújo Filho, J.C.; de Souza Júnior, V.S. Mineralogy and genesis of Planosols under a semi-arid climate, Borborema Plateau, NE Brazil. CATENA 2020, 184, 104260. [Google Scholar] [CrossRef]
  111. Singh, J.; Ale, S.; DeLaune, P.B.; Barnes, E.M. Simulated effects of cover crops with no-tillage on soil and crop productivity in rainfed semi-arid cotton production systems. Soil Tillage Res. 2023, 230, 105709. [Google Scholar] [CrossRef]
  112. Sulieman, M.M.; Sallam, A.; Brevik, E.C.; Al-farraj, A.S. Early indicators of pedogenesis at Harrat Khaybar volcano, Saudi Arabia. Geoderma 2021, 383, 114743. [Google Scholar] [CrossRef]
  113. da Rêgo, L.G.S.; Silva, J.J.A.; Souza, C.M.M.; Portela, J.C.; Moura, I.N.B.M.; Silva, A.C.R.; Miranda, N.O. Pedogenesis in the Barreiras Formation Under Climates of Rio Grande do Norte, Brazil. J. Agric. Sci. 2019, 11, 19. [Google Scholar] [CrossRef]
Figure 1. Location map of the Moacir Lucena Settlement Project in the Apodi Plateau, a semi-arid region of Brazil.
Agriculture 13 01921 g001
Figure 2. Water infiltration test: (a) by using the concentric ring method; (b) by performing readings of the infiltrated water height.
Agriculture 13 01921 g002
Figure 3. Infiltration curve of soil samples illustrating: (a) infiltration; (b) the infiltration rate.
Agriculture 13 01921 g003
Figure 4. Maps of layers of the Moacir Lucena Settlement Project, Apodi Plateau, a semi-arid region of Brazil.
Agriculture 13 01921 g004
Figure 5. Maps of mechanical resistance to root penetration in the soils of the Moacir Lucena Settlement Project, Apodi Plateau, a semi-arid region of Brazil.
Agriculture 13 01921 g005
Figure 6. Vertical dendrogram of the distance matrix by the single bond grouping method.
Agriculture 13 01921 g006
Figure 7. Cloud distribution of: (a) variables in the correlation circle (factors 1–2); (b) points representing the relationships between factors 1–2; (c) variables in the correlation circle (factors 1–3); (d) points representing the relationships between factors 1–3 of the studied environments. Note: BD—Bulk Density; TP—Total Porosity; U—Gravimetric moisture, Q—Soil resistance to root penetration; pH—Potential of hydrogen; TOC—Total Organic Carbon; SB—Sum of Bases, EC—Electric Conductivity; (H + Al)—Potential acidity.
Agriculture 13 01921 g007
Table 1. Characteristics of the areas studied in the Apodi Plateau, a semi-arid region of Brazil.
Land UseSoil ClassificationEnvironmental History
SBCS 3WRB/FAOCharacteristicsArea (ha)
Recovery Area (LATOSOL) 1LATOSOLFERRALSOLThe area has rested for 16 years to recover its native forest and soil, where cotton was previously cultivated.2.5
Lake Area (CAMBISOL) 1CAMBISOLCAMBISOLThe area is flooded in the rainy season (temporary lake) due to its position in the landscape (moderate depression). Presence of sediment deposition.4–5
Collective Area (CAMBISOL)CAMBISOLCAMBISOLArea used for crop sowing (dry season) and sorghum cultivation (rainy season), with the presence of grazing animals for 2 months/year. Intensive soil preparation.35 2
Agroecological Area (ARGISOL) 1ARGISOLACRISOLArea cultivated with short-cycle crops.3
Note: 1 Land use: Inserted within the limits of the Permanent Preservation Area (APP); Within the area, 8 hectares (ha) of native forest are maintained, separating the area used to grow short-cycle crops and the area with cashew trees; 2 Environmental History; and 3 Brazilian Society of Soil Science.
Table 2. Evaluation criteria for the maps of resistance to root penetration in the Moacir Lucena Settlement areas, Apodi Plateau, a semi-arid region according to Ribeiro (2010).
Soil Root Penetration Resistance (kPa)Compaction LevelImpediment Level to Root Growth
0–2000LowNo impediment
2000–4000ModerateSlight impediment
4000–6000HighReduced development
6000–8000Very highMinimum development
Table 3. Physical analysis of the soil classes of the Moacir Lucena Settlement Project, Apodi Plateau, a semi-arid region of Brazil.
Layer (cm)Particle Size DistributionBulk DensityTotal PorosityGravimetric Soil MoistureTextural Classification
SandSiltClay
g.kg¹g.cm³%
Area 1—Recovery Area (LATOSOL)
A (0–4)660872531.6039.812.4light sandy-clay
AB (4–17)492924161.6136.015.7sandy loam
Area 2—Lake Area (CAMBISOL)
A (0–3)653962511.7131.813.7light sandy-clay
BA (3–15)4151354501.3247.693.0loamy/clay
Area 3—Collective Area (CAMBISOL)
Ap (0–6)720692111.5541.110.9light sandy-clay
BA (6–18)525474281.5238.833.7sandy loam
Area 4—Agroecological Area (ARGISOL)
A (0–3)6602001401.4343.793.2sandy
BA (3–16)4351454201.4942.853.2loamy/clay
Table 4. Descriptive statistics parameters for maximum depth and soil resistance to root penetration in the soils of the Moacir Lucena Settlement Project, in Apodi Plateau, a semi-arid region of Brazil.
AttributeMeanMedianMaximumMinimumSDCV%ClassificationCkCaW
A1(Layer)5.005.007.003.001.3326.57high−0.87−0.86NS
A1 (Q)3923.543918.924298.203621.13191.544.88low0.000.22NS
A2 (Layer)11.007.0030.004.008.5777.92very high0.341.28*
A2 (Q)4147.593994.315051.923658.44420.1510.13medium−0.310.79NS
A3 (Layer)8.298.0013.004.002.4129.10high0.220.15NS
A3 (Q)3405.203409.704240.502400.64543.4415.96medium−0.83−0.35NS
A4 (Layer)12.077.0034.005.009.3477.39very high2.021.72*
A4 (Q)4016.374041.334832.833382.00486.0112.10medium−0.740.53NS
Notes: Layer—Maximum depth; Q—Soil resistance to root penetration; SD—Standard Deviation; CV—Coefficient of Variation; Ck—Kurtosis Coefficient; Ca—Asymmetry Coefficient; W—Shapiro–Wilk Test; *—Non-normal distribution by the Shapiro–Wilk test (p-value < 0.05); NS—Normal distribution by Shapiro–Wilk test (p-value > 0.05). There was intensive conventional soil preparation over time.
Table 5. Chemical attributes of the soils of the Moacir Lucena Settlement, Apodi Plateau, a semi-arid region of Brazil.
Layer (cm)pH in WaterEC (dS.m−1)TOC (g.kg−1)(H + Al)SB
cmolc.kg−1
Area 1—Recovery Area (LATOSOL)
A (0–4)7.240.374.801.968.61
AB (4–17)6.680.173.732.666.54
Area 2—Lake Area (CAMBISOL)
A (0–3)7.640.986.231.2610.90
BA (3–15)6.750.273.202.178.55
Area 3—Collective Area (CAMBISOL)
Ap (0–6)7.100.414.831.326.33
BA (6–18)6.890.203.801.024.52
Area 4—Agroecological Area (ARGISOL)
A (0–3)7.020.756.732.4911.49
BA (3–16)6.930.573.802.189.80
Note: pH—Potential of hydrogen; EC—Electrical Conductivity; TOC—Total Organic Carbon; (H + Al)—Potential acidity; SB—Sum of Bases.
Table 6. Models and estimated parameters of the semivariogram.
AttributeN. LagsTolerance (%)CoCo + C1AModelQAICDSDClassification
A1(Layer)20300.2791.74310.54Exponential0.5947.7816.007FDE
A1 (Q)1520038,24729.30Spherical13,973355.80FDE
A2 (Layer)102047.175.5330.34Spherical16.0784.5662.359MSD
A2 (Q)152567,827282,91834.47Gaussian70,618329.623.974SSD
A3 (Layer)20300.6607.82837.72Exponential2.83883.798.431SSD
A3 (Q)203063,568345,59580.01Spherical68,558406.718.394SSD
A4 (Layer)2030081.6831.5Spherical28.7396.190SSD
A4 (Q)2035119,141290,66627.30Exponential69,557329.240.989MSD
Notes: N—number of lags; C0—nugget effect; Co + C1—sill; A—range (m); Q—soil resistance to root penetration; AIC—Akaike Information Criterion; DSD—degree of dependence; SSD—Strong Spatial Dependence; MSD—Moderate Spatial Dependence.
Table 7. Correlation matrix of physical soil attributes in the Moacir Lucena Settlement Project, Apodi Plateau, a semi-arid region of Brazil.
SandSiltClayBDTPUQpHTOCSBEC(H + Al)
Sand1.00
Silt−0.141.00
Clay−0.92−0.271.00
BD0.49−0.53−0.261.00
TP−0.350.510.13−0.951.00
U−0.510.060.470.19−0.401.00
Q−0.83−0.350.95−0.190.070.551.00
pH0.68−0.12−0.610.65−0.56−0.33−0.721.00
TOC0.780.37−0.900.35−0.32−0.18−0.900.711.00
SB0.150.79−0.47−0.040.07−0.03−0.630.470.641.00
EC0.430.22−0.510.46−0.500.04−0.650.840.760.701.00
(H + Al)−0.360.690.07−0.360.370.430.15−0.52−0.090.38−0.221.00
Note: BD—Bulk density; TP—Total Porosity; U—Gravimetric moisture, Q—Soil resistance to root penetration; pH—Potential of hydrogen; TOC—Total Organic Carbon; SB—Sum of Bases, EC—Electric Conductivity; (H + Al)—Potential acidity.
Table 8. Factor loads corresponding to the 12 physical attributes of the soils analyzed and their respective eigenvalues, total variances observed, and cumulative variances.
AttributesFactor 1Factor 2Factor 3
Sand0.88−0.260.18
Silt0.200.91−0.33
Clay−0.93−0.12−0.04
BD0.22−0.300.87
TP−0.090.24−0.96
U−0.660.410.56
Q−0.98−0.18−0.02
pH0.76−0.100.54
TOC0.850.310.31
SB0.500.800.11
EC0.600.330.61
(H + Al)−0.310.78−0.21
Eigenvalues (%)5.703.151.96
Total Variance (%)47.5426.2516.34
Cumulative Variance (%)47.5473.7890.12
Disclaimer/Publisher’s Note: The statements, opinions and data contained in all publications are solely those of the individual author(s) and contributor(s) and not of MDPI and/or the editor(s). MDPI and/or the editor(s) disclaim responsibility for any injury to people or property resulting from any ideas, methods, instructions or products referred to in the content.

