
Influence of Temperature and Wetness on Taphrina deformans Ascospore and Blastospore Germination: Disease Forecasting and Validation

Department of Nutritional Sciences and Dietetics, International Hellenic University, 57400 Sindos, Greece
*
Author to whom correspondence should be addressed.
Agriculture 2023, 13(10), 1974; https://doi.org/10.3390/agriculture13101974
Submission received: 24 August 2023
/
Revised: 30 September 2023
/
Accepted: 9 October 2023
/
Published: 11 October 2023
(This article belongs to the Special Issue Feature Papers in Crop Protection, Diseases, Pests and Weeds)
Abstract
:Peach leaf curl is a fungal disease caused by Taphrina deformans, and it can severely affect the health and productivity of peach and nectarine trees (Prunus persica) if left unmanaged. This study was carried out to investigate the temperature and wetness conditions that affect the germination of blastospores and ascospores of local isolates of the fungus T. deformans. The results showed that the rate of both ascospore and blastospore germination was reduced as the temperature increased from 0 to 20 °C. A decrease in temperature from the range of 25 °C to 30 °C caused a reduction in the germination of conidia for both ascospores and blastospores. Ascospore and blastospore germination were totally inhibited at −3 and 35 °C. Under constant temperatures of 20 °C, the percentage of both ascospore and blastospore germination of T. deformans gradually increased as the wetness period increased from 9 to 15 h. However, there was no further increase in germination observed beyond the 15 h wetness period. Additionally, this study aimed to validate the predictive models of T. deformans, developed based on the favorable temperatures and leaf wetness durations, under the specific field conditions of Naoussa, Greece. The results indicate that while both the ascosporic and blastosporic models were capable of correctly predicting infection periods, there were differences in their predictions of infection risk. The ascosporic model predicted lower risk infection, which aligned well with the observed symptoms of the disease. In contrast, the blastosporic model predicted higher risk infection, but this did not match the actual intensity of the symptoms. Finally, this study also provided insights into the potential benefits of using predictive models to guide fungicide applications, potentially leading to more targeted and efficient disease management strategies for commercial peach orchards.
1. Introduction
Peach is an important fruit tree crop in Greece [1], and the counties of Imathia and Pella in Northern Greece are the largest producers for domestic and foreign markets. However, the area’s low elevation and proximity to the Aegean Sea create a humid environment that is favorable for the growth and spread of T. deformans, a fungus that causes leaf curl in peach and nectarine trees. This pathogen can have a significant economic impact on peach and nectarine production areas [2]. The severity of the impact can vary depending on the region, as well as factors such as weather conditions and cultural practices. The disease can cause severe early defoliation and crop losses on nearly all peach and nectarine cultivars, leading to significant economic losses for growers [3,4]. Effective management strategies, such as the use of resistant cultivars or appropriate fungicides, can help reduce the economic impact of the disease [5]. However, the cost and effectiveness of these strategies may also vary depending on the production area and other factors.
The infection of T. deformans in peach–nectarine trees is influenced by temperature and moisture. Previous studies showed that the fungus requires a minimum temperature of 5 °C for ascospore and blastospore germination, while the optimum temperature is around 20 °C [6,7]. Wetness duration also plays a crucial role in infection, with longer durations leading to higher infection rates. Rossi and Languasco [7] showed that infection can occur between 5 and 25 °C, and disease severity is the greatest at around 20 °C for wetness durations of 12 to 24 h.
There are various modeling approaches used for plant diseases [8], and each approach has its own strengths and weaknesses. The selection of an appropriate model depends on several factors, including the type of disease, the geographic region, the available data, and the desired level of accuracy [9]. Some of the commonly used modeling approaches for plant disease forecasting include statistical models, machine learning models, and simulation models [10,11,12]. Statistical models are a popular approach for plant disease forecasting because they can use historical data to identify patterns and relationships between environmental factors and disease incidence [13]. By analyzing these patterns, statistical models can forecast disease risk based on current or predicted environmental conditions [14]. There are several types of statistical models that can be used for plant disease forecasting, including logistic regression. Logistic regression models are commonly used for binary disease outcomes (presence/absence of disease) [15,16], while time series models are used for forecasting disease incidence over time. The successful development of a plant disease forecasting system also requires the proper validation of a developed model to reduce the risk of two false predictions: (a) false positive predictions, in which a forecast was made for a disease when in fact no disease was found in a location, and (b) false negative predictions, in which a forecast was made for a disease not to occur when in fact the disease was found [17].
Validation is a critical step in developing predictive models for plant diseases to ensure that the model is accurate and reliable in real world field conditions [17]. Validation involves testing the model’s predictions against independent data sets to assess its performance in accurately predicting the occurrence or non-occurrence of disease. Validation helps to reduce the risk of false alarms or missed detections of plant diseases. False alarms can lead to unnecessary treatments, which can be costly and harmful to the environment. On the other hand, missed detections can lead to a loss of crops and reduced yields, which can have significant economic impacts.
One of the aims of this study was to investigate the minimum, maximum, and optimum temperatures and wetness durations for blastospore and ascospore germination of local isolates of T. deformans. Additionally, this study aimed to evaluate the accuracy of the disease forecasting models developed in this study under field conditions. Finally, the advantages of model-guided fungicide scheduling were investigated.
2. Materials and Methods
2.1. Spore Collection
The methodology described by Rossi and Languasco [7] was followed. Infected leaves with visible symptoms of T. deformans infections were collected from peach trees (cv Sun Claus, 10 years old) in April. The leaves were first examined under stereoscope for the presence of reproductive organs (asci) in the infected areas. The existence of the reproductive organs was then confirmed by microscopic examination. Affected leaves in which a large number of reproductive organs had formed were selected. To collect ascospores and blastospores, infected leaves were cleaned superficially, and then cut into small discs and immersed in distilled water to release ascospores and blastospores (which had formed inside the asci by ascospore germination). Afterwards, the suspension was filtered through a double layer of cheesecloth to remove leaf residues, etc. The identification of the spores as either ascospores or blastospores was completed by taking into account the morphology and size of the spores, as described in the international literature [18,19].
2.2. Effect of Temperature and Leaf Wetness on Conidial Germination
The ascospore germination (budding) was recorded in a random sample of 100 ascospores as the number (percentage) of the blastospores before starting the experiment. Then, 10 μL of the above suspension was placed on each slide. Then, they were placed in 9 cm Petri dishes, at the base of which sterilized filter paper was placed and moistened. Care was taken to ensure that the slides did not come into contact with the filter paper. The Petri dishes were sealed with parafilm and placed in chambers with controlled conditions for 12 h. Temperatures of −3, 0, 5, 10, 15, 20, 25, 30, 35 °C were tested to calculate the minimum, maximum, and optimal temperature for spore germination. The results were collected by recording the percentage of germination in 100 randomly selected ascospores and blastospores, respectively [6,7], using the formula described by Kardam et al. [6]. The percentage recorded before the start of the experiment was subtracted from this percentage. There were 5 slides for each treatment.
In addition to the above, Petri dishes containing slides with spore suspension (as described above) were placed in an incubation chamber at 20 °C with 97–100% relative humidity for 3, 6, 9, 12, 15, 18, 24, and 48 h in order to calculate the minimum and maximum hours of continuous moisture required for spore germination. The methodology used to record the percentage of germinated spores is described above.
Both experiments were repeated once.
2.3. The Models
AscosporeModel:
where Risk Infection is the possibility of leaf infections by the pathogen T. deformans under specific LW and T conditions, LW is the wetness period (h), and T is the mean air temperature (°C). Wetness periods were estimated as follows: (i) hours were classified as wet “1” or dry “0”; (ii) hours of continuous wetness were accumulated: an interruption up to 4 h was considered not influential, and accumulation continued with the first wet hour after interruption; if the interruption was >4 h, a new accumulation began [20].
| If T < 0 or T > 30 then print “no Risk” If LW < 9 h then print “no Risk” Else If LW ≥ 9 h and T ≥ 0 or T ≤ 30 then: Risk Infection = ((5.45 + 4.39 × T) − (0.13 × T2)) + ((24.53 + 7.5 × LW) − (0.11 × LW2)) Blastospore-Model If T < 0 or T > 30 then print “no Risk” If LW < 9 h then print “no Risk” Else If LW ≥ 9 h and T ≥ 0 or T ≤ 30 then: Risk Infection = ((5.28 + 4.52 × T) − (0.14 × T2)) + ((−23.36 + 7.6 × LW) − (0.12 × LW2)) |
The effects of cultivar susceptibility and inoculum level on the occurrence of infection were not considered in the experiment described due to insufficient information about their effects.
2.4. Evaluation of Model Accuracy
The model’s accuracy in predicting the day of infection was evaluated by comparing the actual and predicted times of symptom appearance. The study was conducted in Episkopie Naoussa Prefecture of Imathia in Greece, which is a major peach production area. Orchard experiments were conducted from February to March in and 2023 on 10-year-old ‘Sun Claus’ and 12-year-old ‘Rich May’ peach blocks. There were no scientific data about their level of susceptibility to T. deformans. The trees were trained in the traditional vase-shaped system. Additionally, the trees were grown according to common cultural practices used in commercial orchards to ensure that the results would be representative of those obtained in typical commercial settings. To collect weather data, a telemetric meteorological station (NEUROPUBLIC S.A, Pireas, Greece, https://www.neuropublic.gr/en/ (accessed on 8 October 2023)) was established. The model used LW and T as driving variables for calculating Risk (LW, T). The model was run hourly, starting from 1 February at 00.01 h. When trees became susceptible to infection, the period of possible appearance of the disease was calculated on each day when Risk (LW, T) > 0, considering an incubation period of 14 to 28 days. The model predictions ranged from 0 (when Risk = 0) to 20 (when Risk = the highest possible value) for the ascosporic model (AModel) and 0 (when Risk = 0) to 14 (when Risk = the highest possible value) for the blastosporic model (BModel). Previous studies showed that peach trees are susceptible to the fungus T. deformans from the growth of stage “breaking dormancy” until 40 days later [4].
After bud break, the trees were inspected twice per week to determine the time of symptom onset. The trees were carefully inspected for the appearance of the first symptoms, which are reddish, thickened, or puckered areas on young leaves. When the symptoms were unclear, the leaves were marked and observed during the following surveys. Inspections stopped after the appearance of the first seasonal disease symptoms. The predicted period of disease onset was then compared with the actual one. The model was judged to have provided an accurate prediction when the observed symptom onset coincided with the time interval predicted by the model [21].
2.5. Evaluation of Model Usefulness
The experiment assessed whether the predictive model could provide an effective means of scheduling fungicide applications to manage leaf curl disease in commercial peach orchards. The presence of overwintering inoculum was ensured as both orchards had shown leaf symptoms in the previous season and had not been treated with fungicide at leaf fall or at the end of winter.
The effectiveness of different fungicide application strategies to control leaf curl disease in commercial peach orchards was evaluated. The experiment included three treatment groups: (a) Unsprayed Control Trees—these trees were not treated with any fungicides, (b) Growers’ Spray Program Trees—these trees were treated according to the standard fungicide spray schedule that is typically used in commercial orchards, and (c) Model-Guided Spray Trees—for this treatment group, fungicide applications were determined based on the risk of infection as predicted by the model. Fungicides were applied only when the model predicted a high risk of infection.
The experiment was designed and followed a completely randomized experimental approach to evaluate the effectiveness of fungicide applications using the fungicide Ziram to control leaf curl disease in peach orchards. Ziram is commonly used by growers to manage leaf curl disease in peach trees [4]. This fungicide was selected due to its known efficacy against the specific pathogen causing leaf curl. The experiment included four replicate plots for each treatment group. Within each plot, there were three trees. To assess the effectiveness of fungicide applications, 100 random leaves per tree were observed for the typical symptoms of the disease. The disease incidence was calculated as the percentage of leaves showing symptoms of leaf curl.
This experiment was conducted in the period February–March 2023.
2.6. Statistical Analysis
The Generalized Linear Models (GLM) procedure in IBM SPSS Statistical Package 23 was used to analyze the data and test for significant differences between the different fungicide treatments strategies. The Wald Test was used at a significance level of p = 0.05 to determine if there were statistically significant differences between the treatments in terms of their effectiveness in controlling leaf curl disease. To determine the relationship between wetness, temperatures, and spore germination, a general linear regression analysis was performed.
3. Results and Discussion
3.1. Effect of Temperature and Leaf Wetness on Conidial Germination
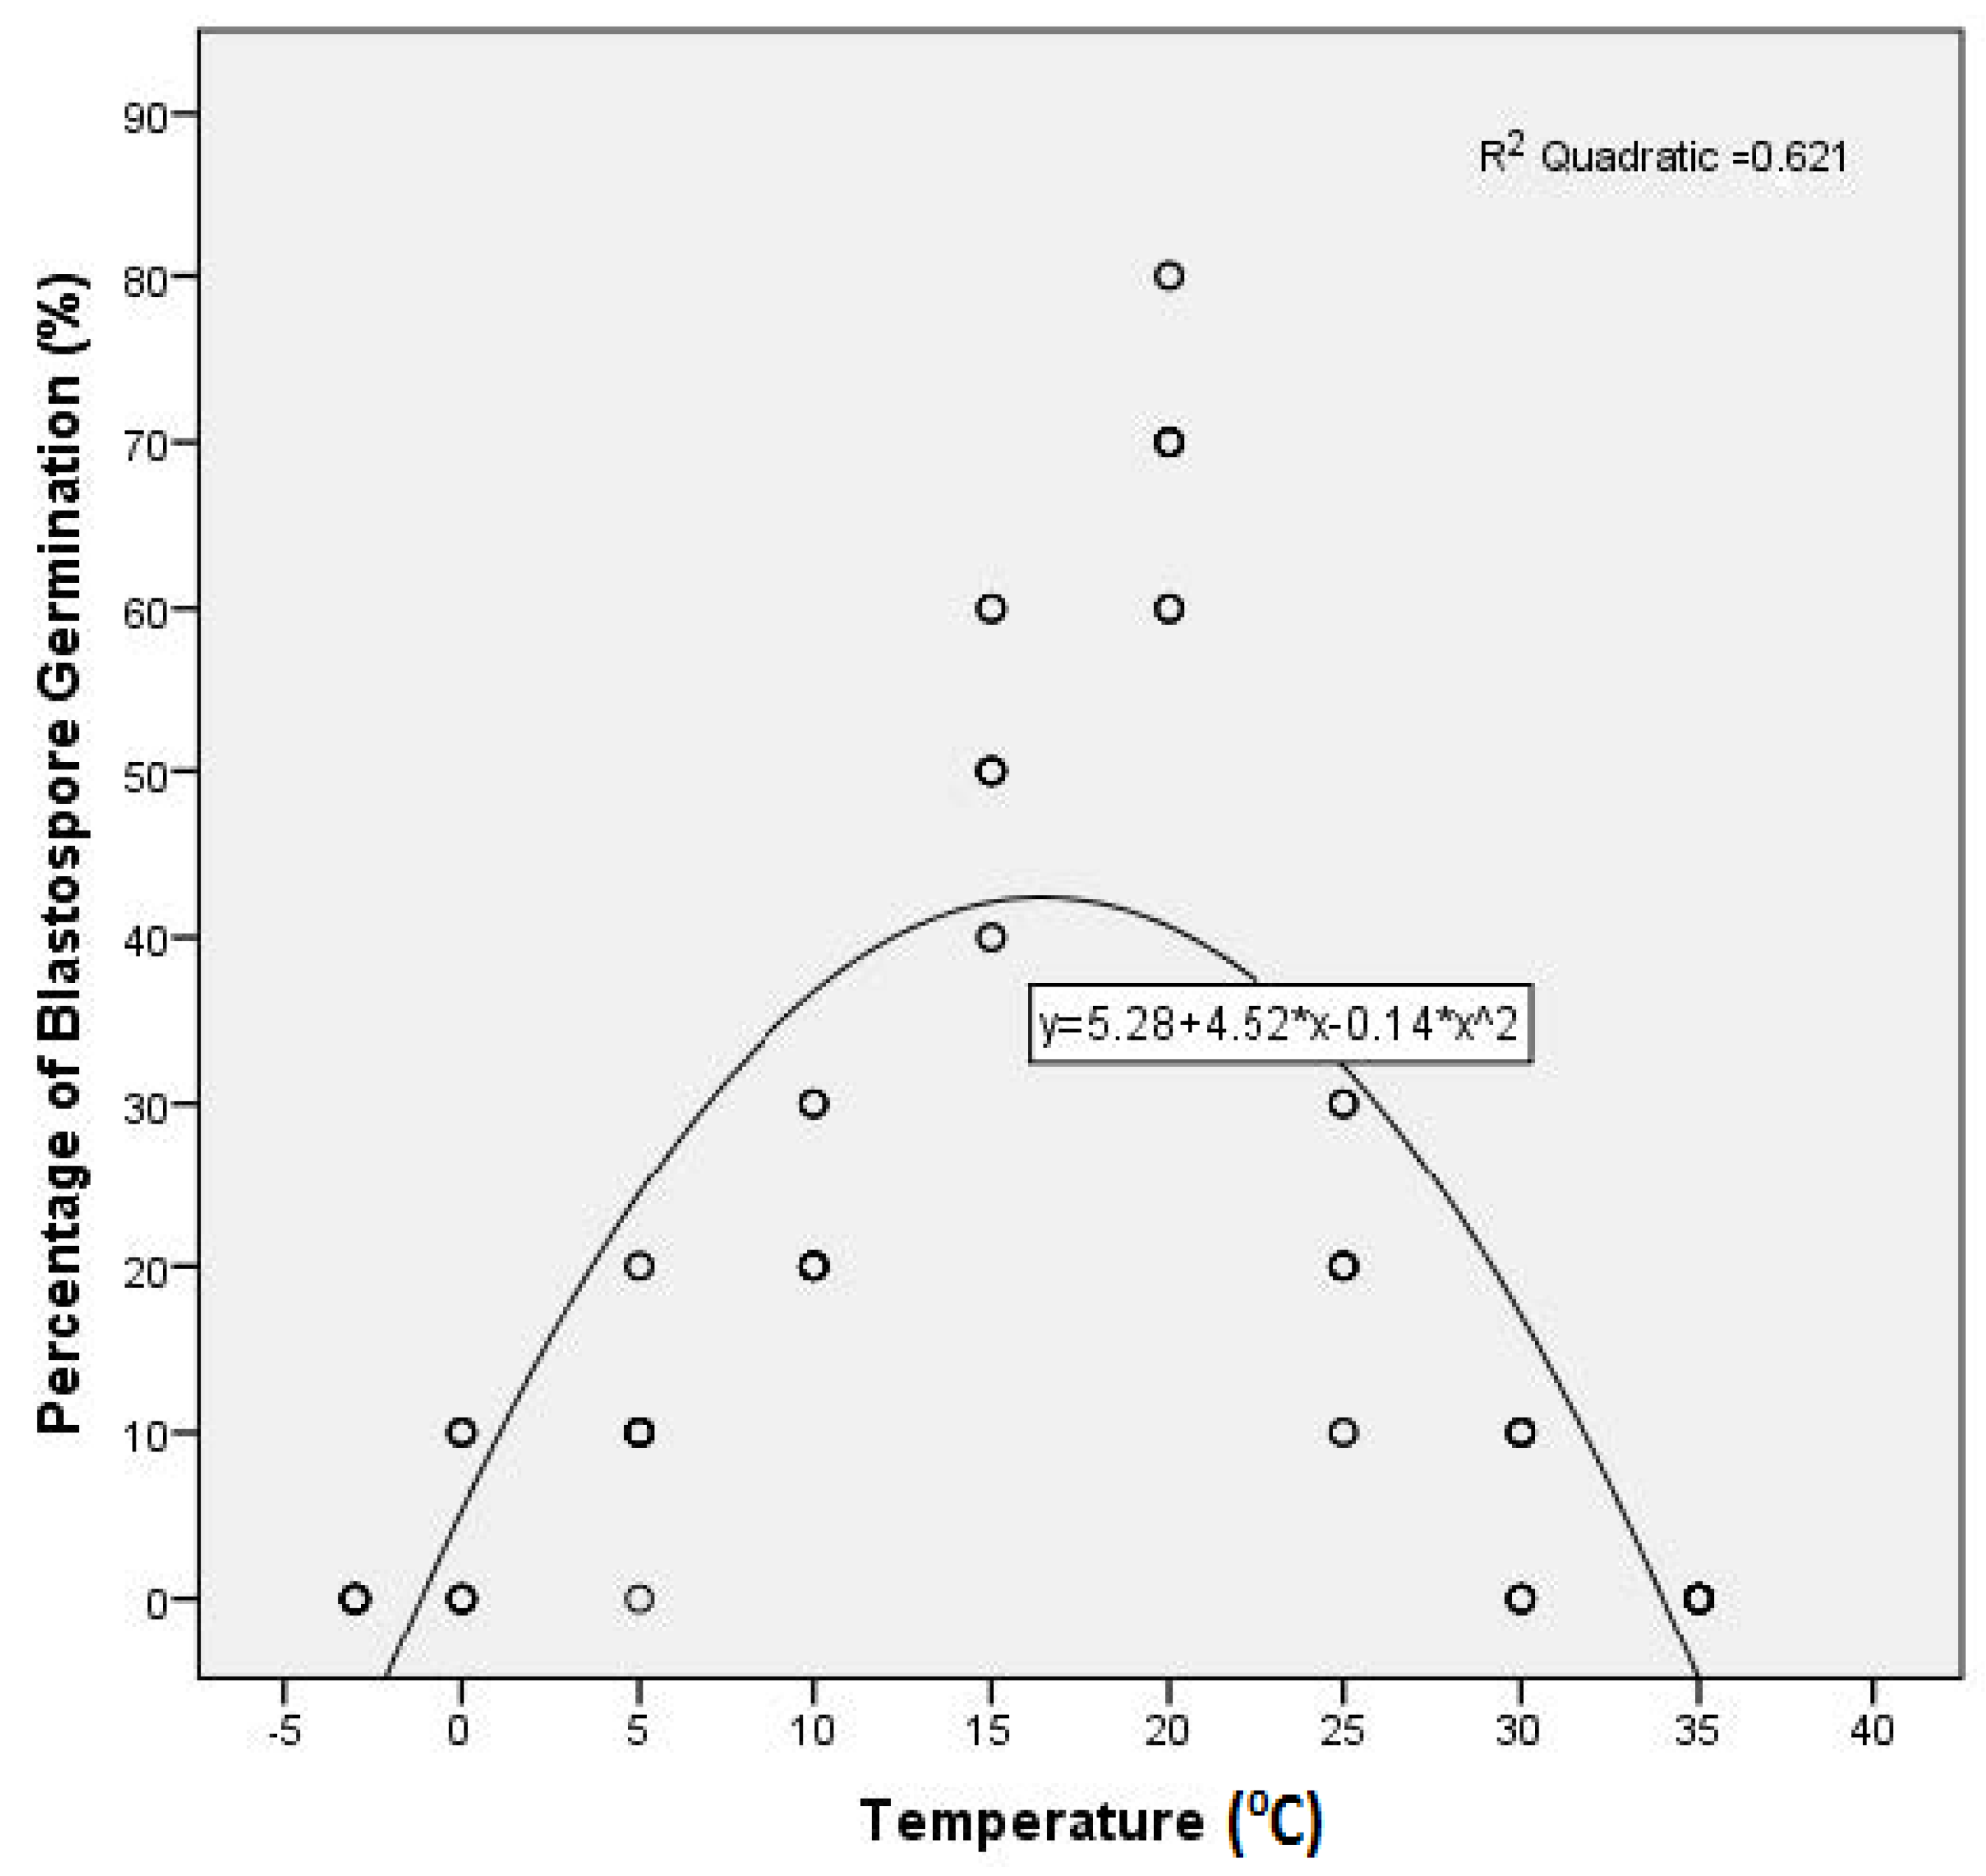
There was no significant difference between repeated trials, so the data from the two trials were pooled. Temperature significantly influenced both ascospore and blastospore germination. The results showed that the rate of both ascospore and blastospore germination increased as temperatures increased from 0 to 20 °C, and decreased as temperatures increased from 25 to 30 °C (Table 1). The ascospore and blastospore germinations were totally inhibited at −3 and 35 °C. The estimates of the parameters from the quadratic function are presented in Figure 1 and Figure 2.
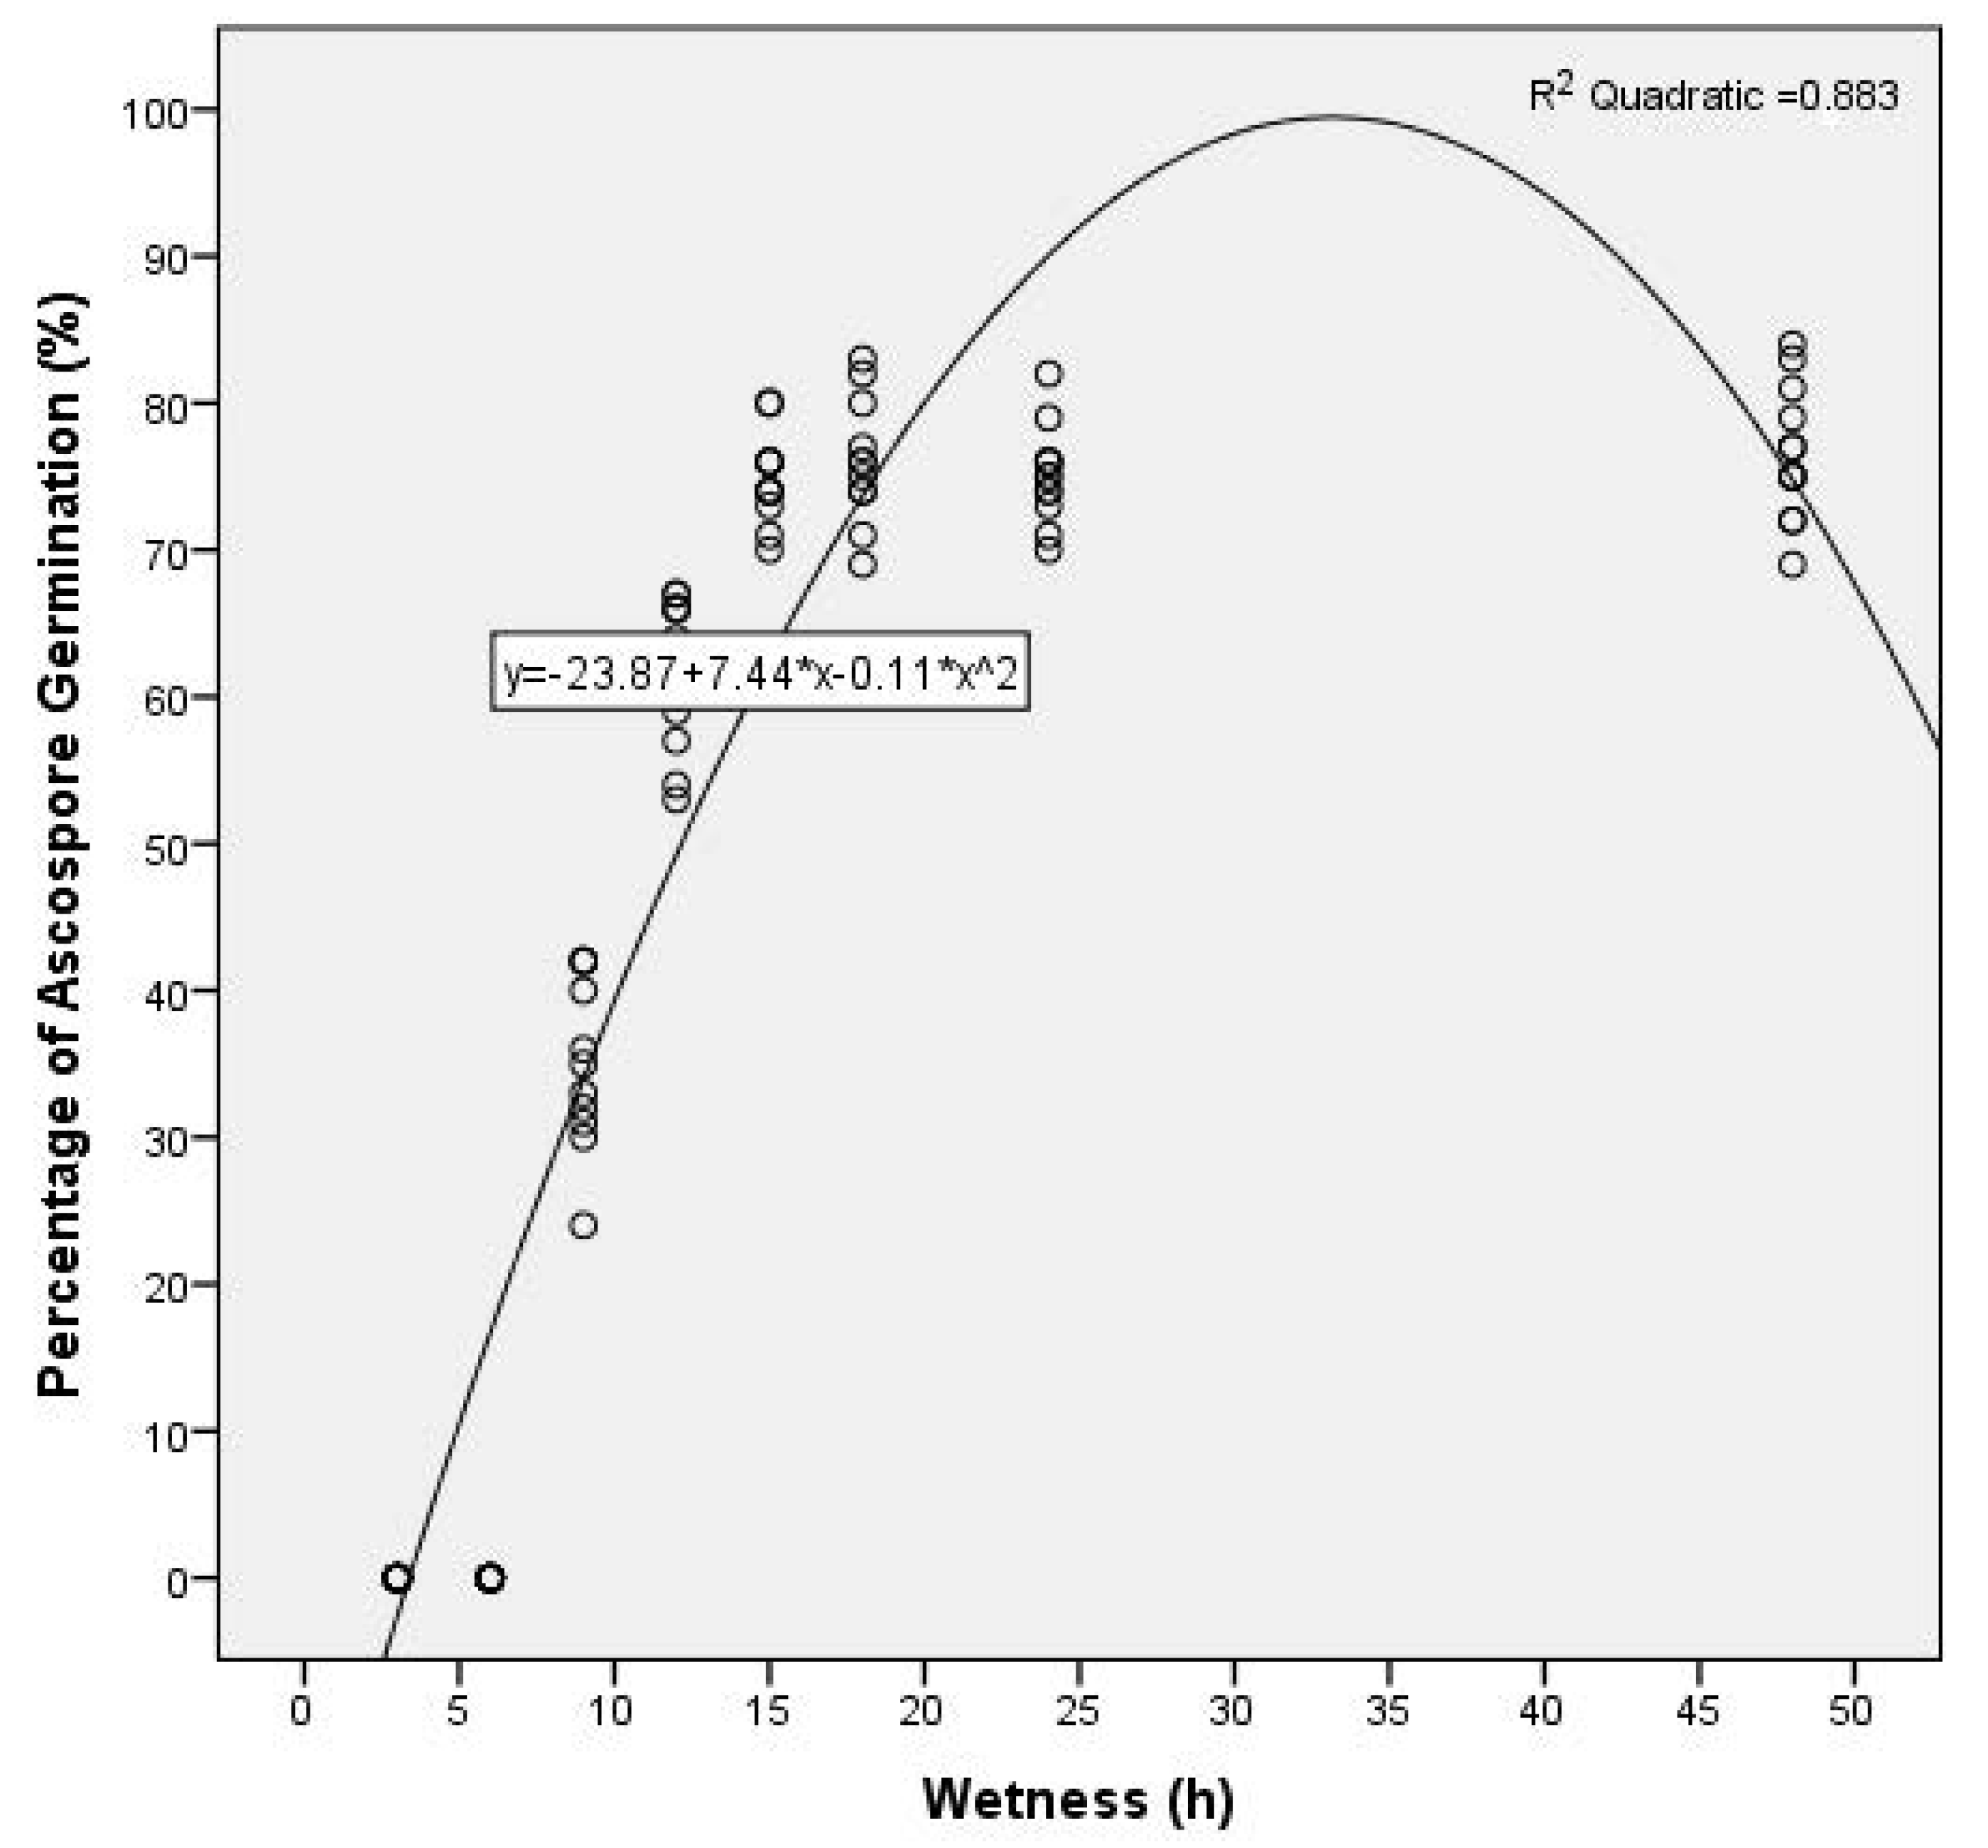
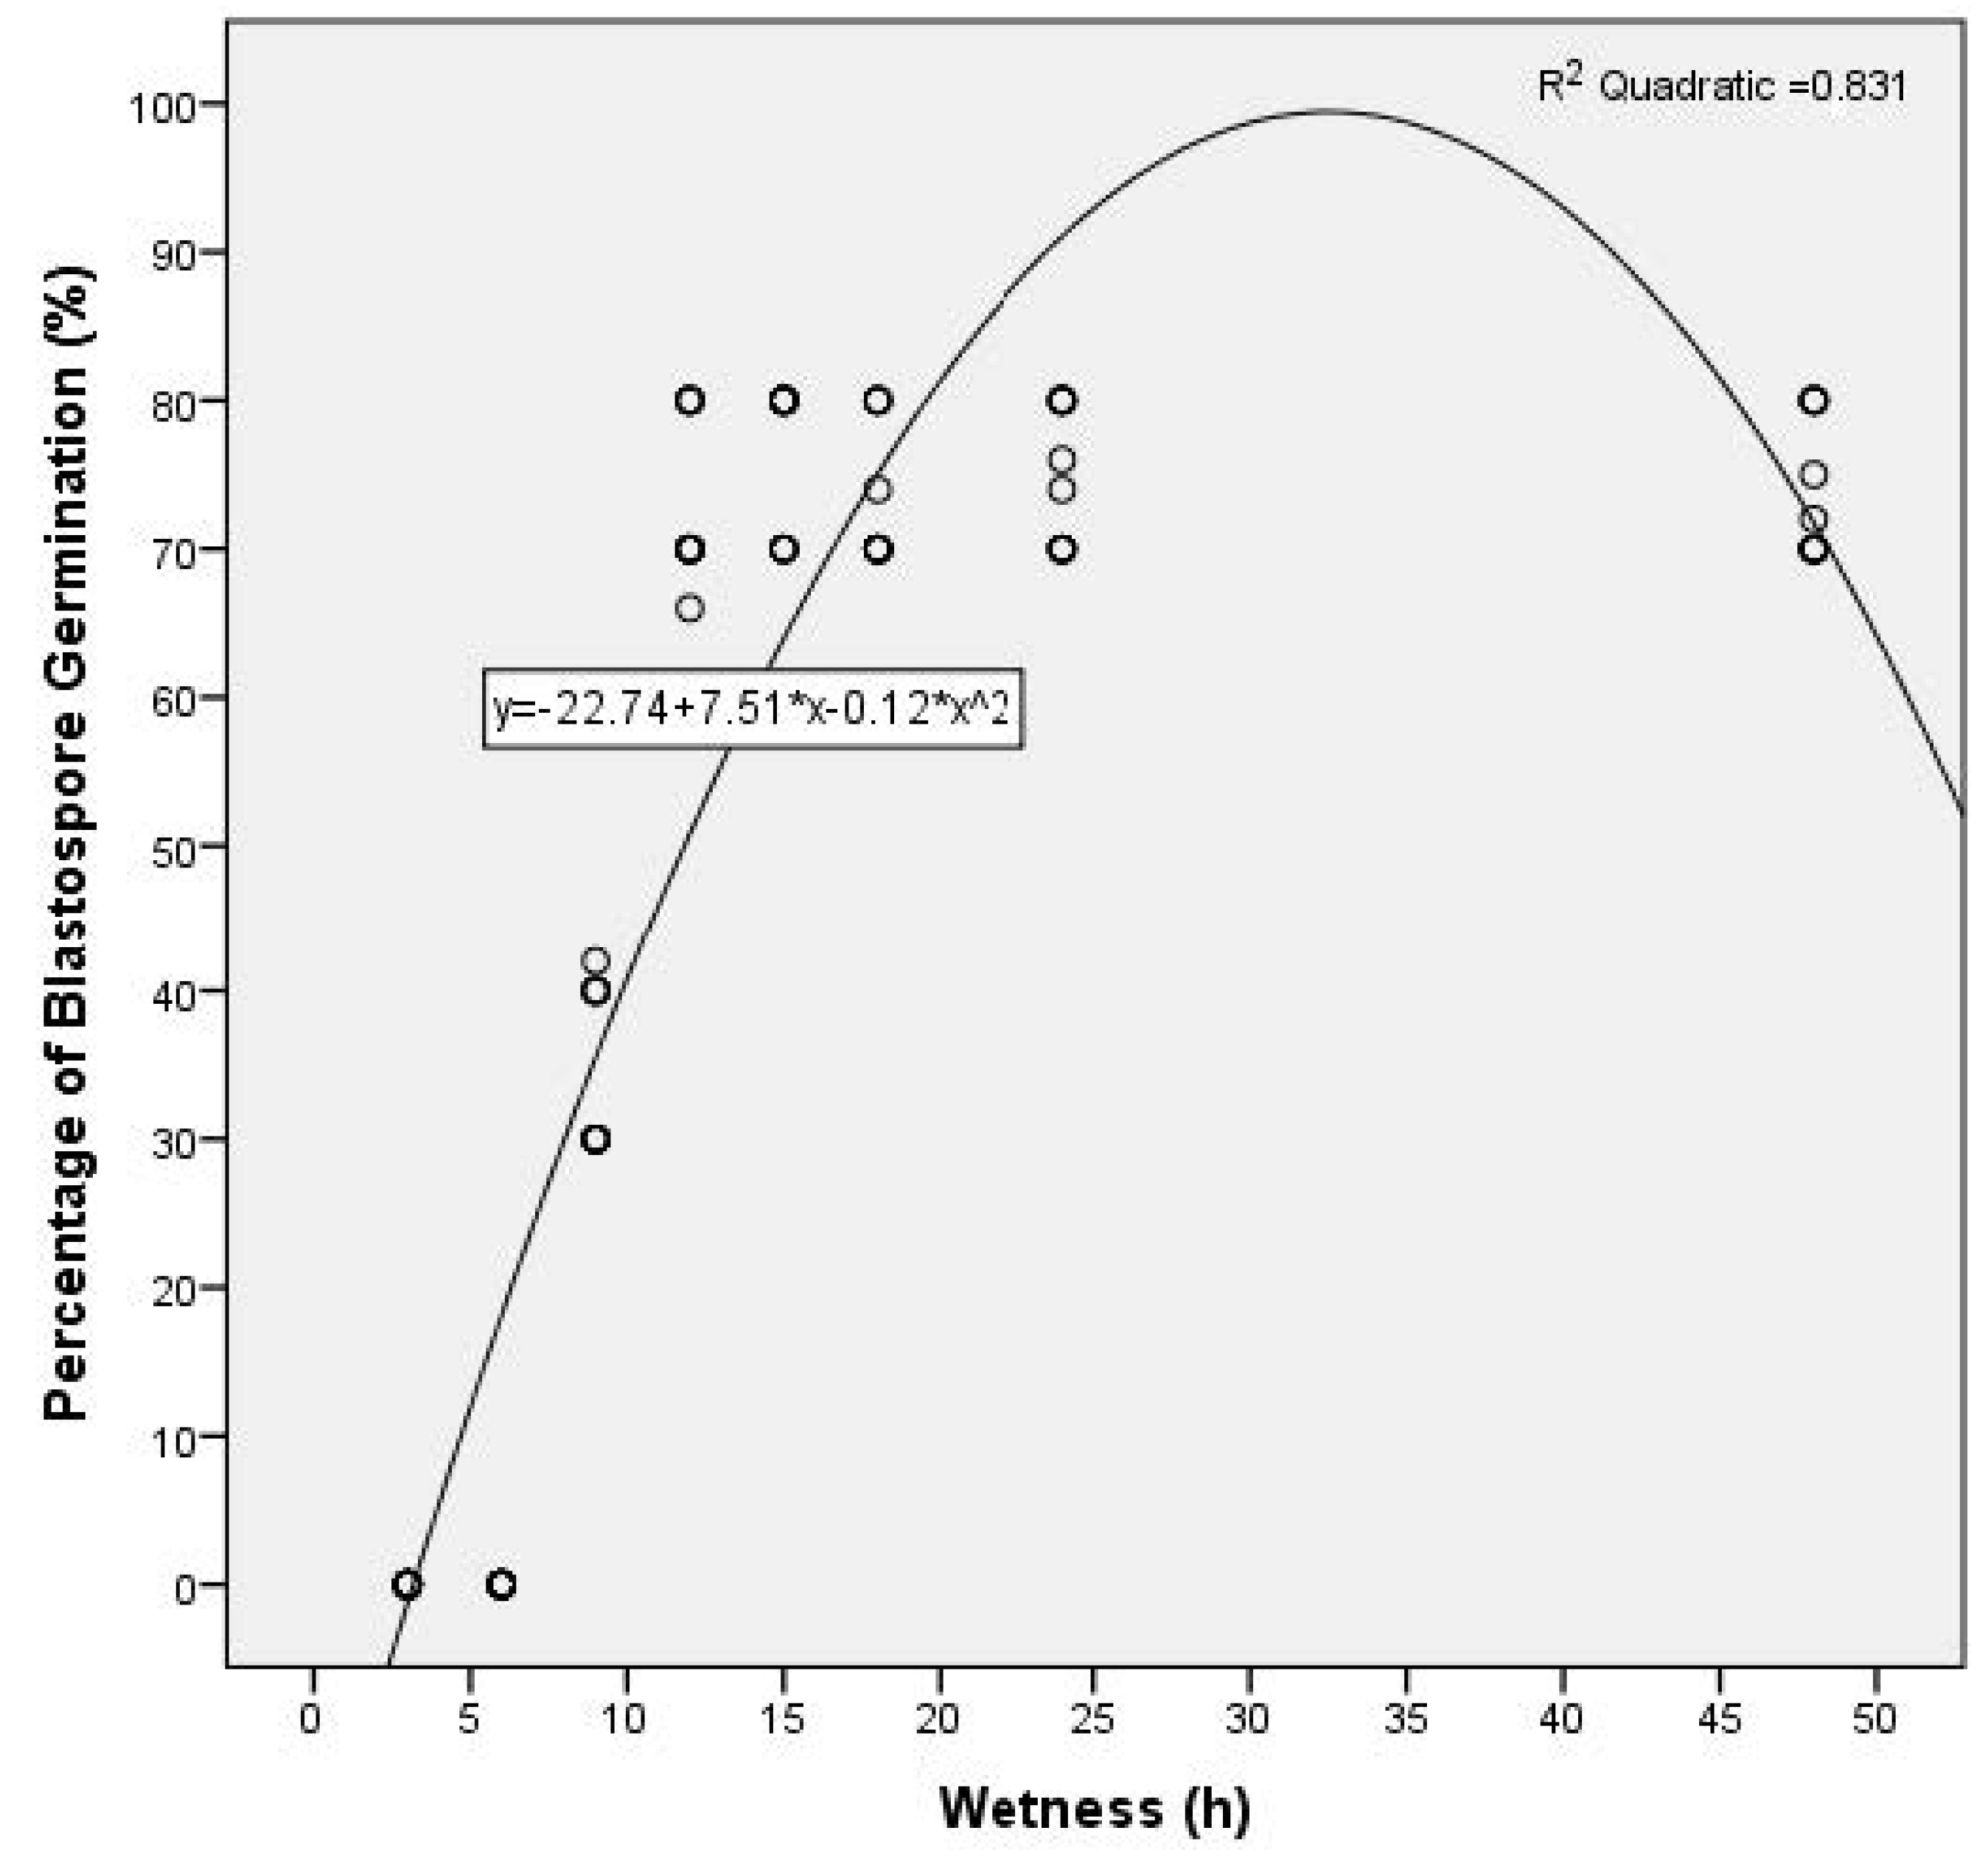
There was no significant difference between repeated trials, so the data from the two trials were pooled. Wetness also significantly influenced ascospore and blastospore germination. Under constant temperatures of 20 °C, the percentage of both ascospore and blastospore germination of T. deformans gradually increased as the wetness period increased from 9 to 15 h, but no further increase was observed up to 15 h (Table 2). No ascospore and blastospore germination of T. deformans was observed at a wetness duration up to 6 h. The estimates of the parameters from the quadratic function are presented in Figure 3 and Figure 4.
3.2. Evaluation of Model Accuracy
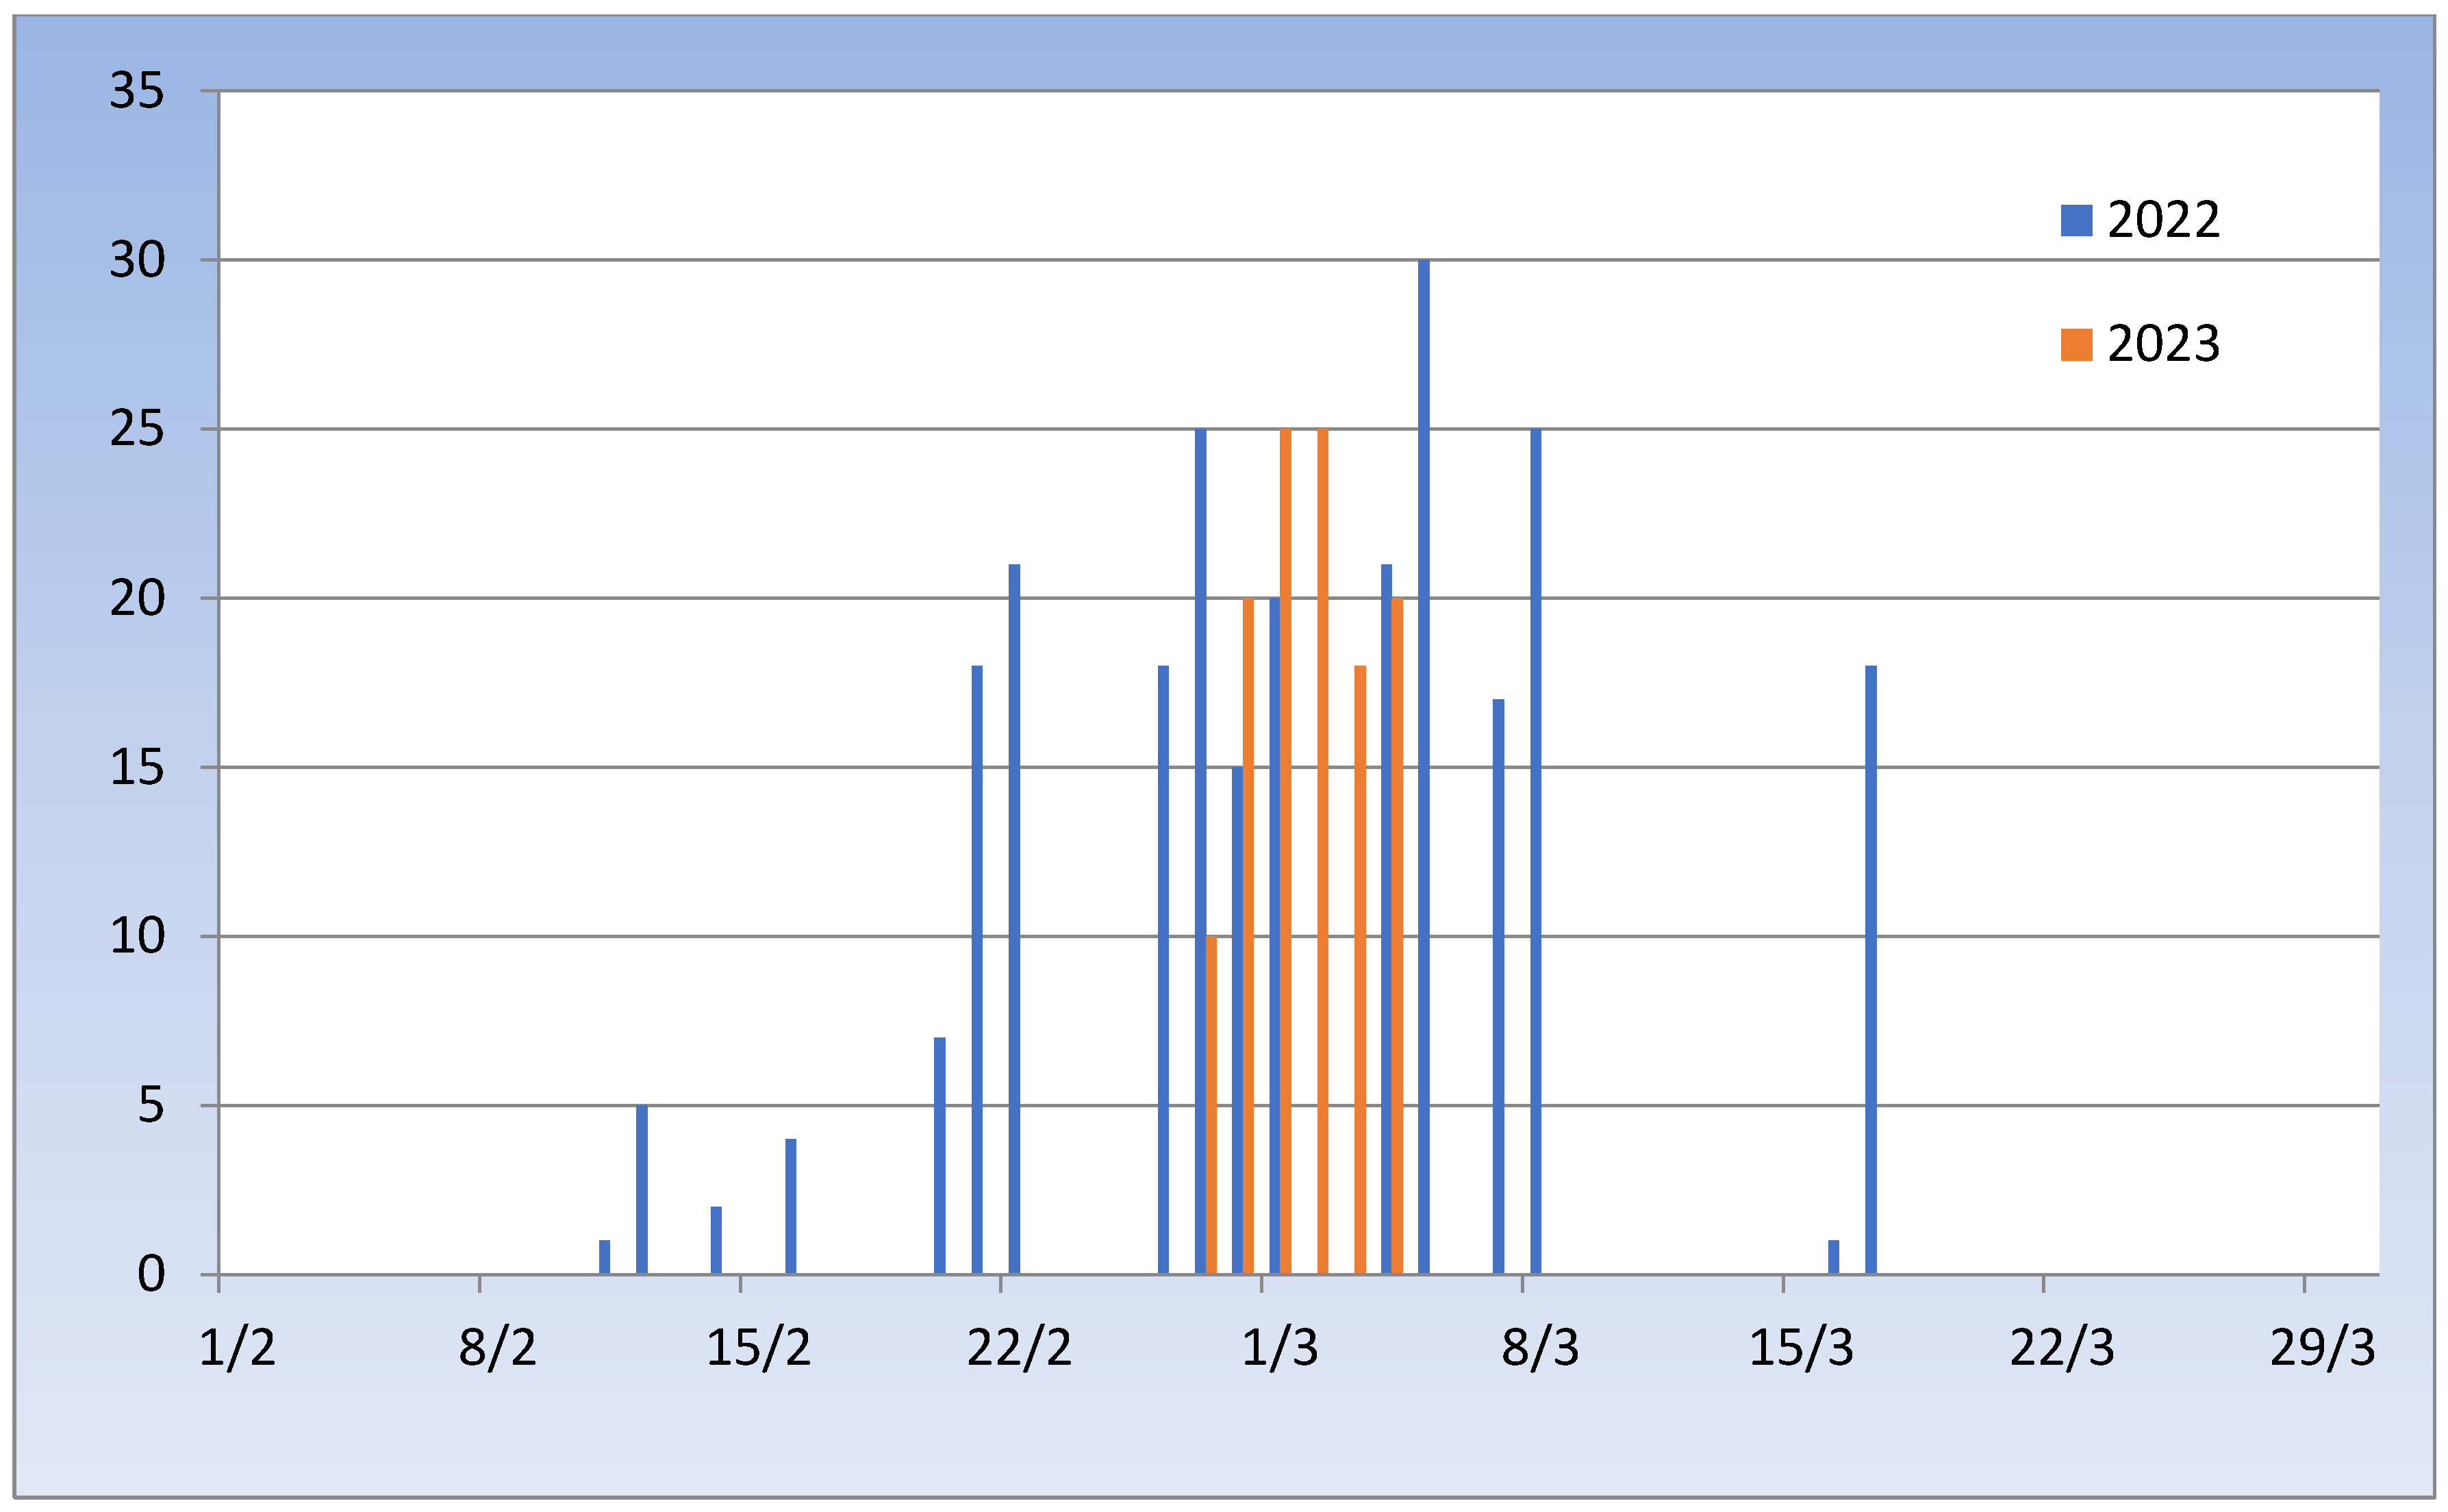
The average temperature and leaf wetness for the period from February to April 2022 and 2023 are presented in Figure 5 and Figure 6. Figure 7 presents the predictions of the polynomial models for the period of February to March for two consecutive years (2022 and 2023).
Models: In 2022, both ascosporic (AModel) and blastosporic (BModel) models predicted risk on the11th, 13th, 15th, 17th, 21–23rd, 27–28th of February, 1st–2nd, 5–7th, 9th, and 19th of March. However, the maximum value for the AModel was less than 6, while the maximum value for the BModel was 12. Low to medium intensity symptoms (percentage of diseased leaves < 9.5%) of the disease were observed in the unsprayed control trees during the same period. The temperatures fluctuated between −1 and 19.6 °C in February, and −2.9 and 22.3 °C in March. The above temperatures were not a limiting factor for infections of the peach trees by the fungus T. deformans. In addition, the total number of hourly leaf wetness was relatively low in the period of February to March, but not unfavorable for the development of the disease.
In 2023, again both ascosporic (AModel) and blastosporic (BModel) models predicted risk at the same dates, but with different level of risk value. Specifically, both models predicted risk on the 28th of February and 3–4th of March. Again, the maximum value for the AModel was less than 6, while the maximum value for the BModel was 12. Low symptoms (percentage of diseased leaves about 5%) of the disease were observed in the unsprayed control trees at the same period. The temperatures fluctuated between −7.2 and 21.4 °C in February, and −0.2 and 23.1 °C in March. The above temperatures were not a limiting factor for infections of the peach trees by the fungus T. deformans. The total number of hourly leaf wetness was very low in the period of February and medium to high in the first days of March, the mid of March, and the last days of March for the development of the disease.
3.3. Evaluation of Model Usefulness
The number of fungicide sprays applied based on the model’s predictions was two fewer than the number of sprays applied according to the standard growers’ program in both experimental fields (Table 3). No statistically significant differences in risk infection between the trees treated using the growers’ spray program and those treated using the Model-Guided Spray program in both experimental fields were found (Table 4). In contrast, both the growers’ spray program and the Model-Guided Spray program were significantly more effective at reducing risk infection compared to untreated trees (Table 4).
4. Discussion
This study provided the critical climate parameters for ascospore and blastospore germination of T. deformans, the pathogen responsible for peach leaf curl. According to the results, the appropriate temperature range for both ascospore and blastospore germination of T. deformans in vitro was 0 to 30 °C, while the optimum temperature for conidial germination was 20 °C. Previous studies showed that both ascospores and blastospores were capable of budding (reproducing asexually) across a wide range of temperatures; from 5 °C to 37 °C, both spore types had their highest budding activity at 14 °C and 21 °C [7,22,23]. Kardam et al. [6] found that blastospore germination increased up to 20 °C, after which a decline in germination percent was recorded. Agarwala et al. [24] found that the maximum peach leaf curl occurrence happened when the temperature was fluctuating between 15 °C and 20 °C. This suggests that the disease caused by T. deformans was most prevalent or severe when the temperature was within this specific temperature range. Rossi et al. [25,26] observed that infection by T. deformans only occurred under certain temperature conditions. Specifically, infection happened when the air temperature was below 16 °C during the wet period and below 19 °C during incubation. This indicates that the pathogen’s ability to infect its host was limited to lower temperatures within these thresholds. These findings highlight the importance of temperature in influencing the occurrence and severity of peach leaf curl caused by the fungal pathogen studied. The above studies suggest that certain temperature ranges, especially in the lower temperature spectrum, were conducive to disease development. This information can be valuable for understanding the environmental conditions that promote the spread and impact of the fungal disease in question. The upper range of temperatures at which T. deformans spores germinate usually prevail in the period of February and March, during which peach and nectarine trees in these regions of Northern Greece are in a susceptible stage.
The study also indicates that at least 9 h of wetness is required to initiate the ascospore and blastospore germination of T. deformans at the optimum temperatures (around 20 °C). The importance of wetness in the germination of blastospores and ascospores of the fungus T. deformans has also been reported in previous studies. Kardam et al. [6] found that blastospore germination decreased with decreasing relative humidity, at a maximum of 69.05%. Rossi and Languasco [7] showed that the ascospore and blastospore’s budding activity was approximately two and a half times higher in a film of water than on a dry substrate with 100% RH.
Undoubtedly, introducing predictive models to forecast the appearances of diseases like peach leaf curl can be a game changer for crop management [27]. This approach holds several advantages over traditional prognosis-based methods. Predictive models could enhance the management of peach leaf curl: (a) precision in spray applications, (b) reduced costs of spray applications, (c) environmental sustainability, (d) improved disease management, (e) data-driven decisionmaking, (f) enhanced crop health, (g) time savings, (h) adaptation to changing conditions, and (j) integration with technology. Overall, the introduction of predictive models for disease forecasting can revolutionize how peach leaf curl and similar diseases are managed [28]. By reducing the need for unnecessary sprays, improving the precision of treatments, and minimizing environmental impact, these models contribute to more sustainable, cost effective, and efficient agricultural practices [29]. In this study, two polynomial models were developed: a model developed based on the influence of temperatures and wetness on the germination of ascospores and a model developed based on the influence of temperatures and wetness on the germination of blastospores. The purpose of these models is to aid in creating a warning system for managing peach leaf curl disease. Both predicted models were validated in field conditions. Validation involved testing the models’ accuracy and reliability under real-world field conditions to ensure they provide meaningful and useful predictions. Both models were evaluated based on their ability to predict infection periods accurately. The results showed that both models were able to correctly predict infection periods. This indicates that they were effective in identifying timeframes when conditions were conducive to T. deformans infection. Despite accurately predicting infection periods, there was a difference in the risk infection predictions between the two models. The ascosporic model predicted lower risk infection, which aligned well with the observed symptoms of the disease. In contrast, the blastosporic model predicted higher risk infection, but this did not match the actual intensity of symptoms. The difference in the prediction of risk infection has implications for disease management strategies. The blastosporic model’s false positive predictions led to incorrect spray recommendations, potentially increasing fungicide applications and associated costs, as well as the risk of environmental pollution. It is recommended that the blastosporic model must be calibrated and re-validated under field conditions before being used for commercial purposes. On the other hand, the ascosporic model was deemed more appropriate for Computer-assisted Decision Support Systems (DSSs) due to its accurate prediction of the disease’s appearance. Consideration should be taken due to the fact that the study did not include different peach cultivars with varying susceptibility levels to evaluate whether each predictive model might perform better with specific cultivars. Different cultivars might respond differently to the same climate conditions, affecting the intensity of disease symptoms. In previous works, a modified version of the model developed by Giosue et al. [10] was evaluated in the commercial peach orchards of Imathia, Northern Greece [9]. However, this model did not use data on the effect of environmental conditions on the germination of spores of native isolates of the fungus, resulting in a reduced accuracy of the model’s indications compared to the models described in the present study.
Another objective of the study was to compare the effectiveness of three different fungicide application strategies in controlling leaf curl disease in peach orchards. By comparing disease incidence, severity, and overall tree health across these treatment groups, it could assess whether the model-guided approach is more effective in preventing or reducing the disease compared to the standard growers’ spray program or not using fungicides at all. The results showed that the model-guided approach may have led to a more targeted and potentially efficient use of fungicides compared to the conventional program, while both treatment approaches, whether based on the standard schedule or guided by the predictive model, were successful in mitigating the severity of leaf curl disease compared to no treatment.
5. Conclusions
This study emphasizes the importance of accurately predicting infection periods in disease management strategies and highlights the need for rigorous validation of predictive models under real-world conditions. The discrepancy in the prediction of risk infection between the two models underscores the significance of fine-tuning and testing such models to ensure their reliability and practicality in agricultural decision making. Certainly, the ascosporic model was considered more suitable for integration into Computer-assisted Decision Support Systems (DSSs) due to its ability to accurately predict the appearance of the disease.
The Model-Guided Spray program, which employed fewer fungicide applications while achieving similar disease control compared to the growers’ program, could potentially be a more efficient and cost-effective strategy for managing leaf curl disease in commercial peach orchards. The fact that both treated strategies were significantly more effective than leaving trees untreated underscores the importance of fungicide applications in disease management.
Author Contributions
Conceptualization, T.T.; methodology, T.T. and M.P.; formal analysis, T.T. and M.P.; writing—original draft preparation, T.T.; writing—review and editing, T.T.; supervision, T.T. All authors have read and agreed to the published version of the manuscript.
Funding
This research was funded by the Operational Programme Competitiveness, Entrepreneurship and Innovation 2014–2020 (EPAnEK) under the call “Research-Create-Innovate”, Τ2ΕΔΚ-02759.
Institutional Review Board Statement
Not applicable.
Informed Consent Statement
Not applicable.
Data Availability Statement
The data presented in this study are available on request from the corresponding author.
Conflicts of Interest
The authors declare no conflict of interest.
References
- FAO Statistics. Crops and Livestock Products. 2021. Available online: https://www.fao.org/faostat/en/#data/QCL (accessed on 22 November 2022).
- Çmen, I.; Ertugrul, B.B. Determination of mycoflora in almond plantations under drought conditions in South-eastern Anatolia Project Region, Turkey. Plant Pathol. J. 2007, 6, 82–86. [Google Scholar] [CrossRef]
- Fonseca, A.; Rodrigues, M.G. Taphrina Fries, Chapter 73. In The Yeasts, a Taxonomic Study; Kurtzman, C.P., Jack, W., Fell, J.W., Boekhout, T., Eds.; Elsevier: Amsterdam, The Netherlands, 2011; pp. 823–858. [Google Scholar] [CrossRef]
- Panagopoulos, C.G. Diseases of Fruit Trees and Grapevines, 4th ed.; Stamoulis Publisher: Athens, Greece, 2007; pp. 189–195. [Google Scholar]
- Giordani, E.; Nin, S.; Nencetti, V. Inheritance for resistance to leaf curl [Taphrina deformans (Berk.) Tul.] in peach cultivars estimated by exploring mixed models. Euphytica 2023, 219, 1. [Google Scholar] [CrossRef]
- Kardam, V.K.; Gupta, A.K.; Shukla, A.; Sharma, S.K. Effect of different temperature and relative humidity regimes on the germination of blastospores of Taphrina deformans (Berk.) Tul. Biologic. Forum An Inter. J. 2022, 14, 607–610. [Google Scholar]
- Rossi, V.; Languasco, L. Influence of environmental conditions on spore production and budding in Taphrina deformans, thecausal agent of peach leaf curl. Phytopathology 2007, 97, 359–365. [Google Scholar] [CrossRef] [PubMed]
- Newlands, N.K. Model-based forecasting of agricultural crop disease risk at the regionalscale, integrating airborne inoculum, environmental, and satellite-based monitoring data. Front. Environ. Sci. 2018, 6, 63. [Google Scholar] [CrossRef]
- Rezaeian, M.; Dunn, G.; St Leger, S.; Appleby, L. Geographical epidemiology, spatial analysis and geographical information systems: A multidisciplinary glossary. J. Epidemiol. Community Health 2007, 61, 98–102. [Google Scholar] [CrossRef]
- Gong, X.; Zhang, S. An analysis of plant diseases identification based on deep learning methods. Plant Pathol. J. 2023, 39, 319–334. [Google Scholar] [CrossRef]
- Shah, D.A.; Paul, P.A.; DeWolf, E.D.; Madden, L.V. Predicting plant disease epidemics from functionally represented weather series. Philos Trans. R. Soc. Lond. B. Biol. Sci. 2019, 374, 20180273. [Google Scholar] [CrossRef]
- Shoaib, M.; Shah, B.; EI-Sappagh, S.; Ali, A.; Ullah, A.; Alenezi, F.; Gechev, T.; Hussain, T.; Ali, F. An advanced deep learning models-based plant disease detection: A review of recent research. Front. Plant Sci. 2023, 14, 1158933. [Google Scholar] [CrossRef]
- Fenu, G.; Malloci, F.M. Forecasting plant and crop disease: An explorative study on current algorithms. Big Data Cogn. Comput. 2021, 5, 2. [Google Scholar] [CrossRef]
- Donatelli, M.; Magarey, R.D.; Bregaglio, S.; Willocquet, L.; Whish, J.P.; Savary, S. Modeling the impacts of pests and diseases on agricultural systems. Agric. Syst. 2017, 155, 213–224. [Google Scholar] [CrossRef] [PubMed]
- Shipe, M.E.; Deppen, S.A.; Farjah, F.; Grogan, E.L. Developing prediction models for clinical use using logistic regression: An overview. J. Thorac. Dis. 2019, 11, 574–584. [Google Scholar] [CrossRef]
- Srimaneekarn, N.; Hayter, A.; Liu, W.; Tantipoj, C. Binary response analysis using logistic regression in dentistry. Int. J. Dent. 2022, 8, 5358602. [Google Scholar] [CrossRef] [PubMed]
- Esker, P.D.; Sparks, A.H.; Campbell, L.; Guo, Z.; Rouse, M.; Silwal, S.D.; Tolos, S.; VanAllen, B.; Garrett, K.A. Ecology and epidemiology in R: Disease forecasting and validation. Plant Health Instruc. 2008. [Google Scholar] [CrossRef]
- Bagigalova, K. Species of Taphrina on Populus in Slovakia. Czech Mycol. 1994, 47, 277–283. [Google Scholar] [CrossRef]
- McLaughlin, D.J.; Spatafora, J.W. The Mycota: A Comprehensive Treatise on Fungi as Experimental Systems for Basic and Applied Research. Systematics and Evolution Part B, 2nd ed.; Springer: Heidelberg, Germany; New York, NY, USA; Dordrecht, The Netherlands; London, UK, 2015. [Google Scholar]
- Thomidis, T.; Rossi, V.; Exadaktylou, E. Evaluation of a disease forecast model for peach leaf curl in the Prefecture of Imathia, Greece. Crop Protect. 2010, 29, 1460–1465. [Google Scholar] [CrossRef]
- Giosue, S.; Spada, G.; Rossi, V.; Carli, G.; Ponti, I. Forecasting infections of the leaf curl disease on peaches caused by Taphrina deformans. Eur. J. Plant Pathol. 2000, 106, 563–571. [Google Scholar] [CrossRef]
- Ko, Y.; Sun, S.K.; Pan, C.M. Studies on physiological characteristics and survival of peach leaf curl pathogen, Taphrina deformans, in vitro. Plant Prot. Bull. Taipei 1998, 40, 351–360. [Google Scholar]
- Schneider, A.; René, J. Influence des conditions physiques et nutritives sur le développement de Taphrina deformans en culture in vitro. C.R. Acad. Sci. Paris 1969, 268, 44–47. [Google Scholar]
- Agarwala, R.K.; Arora, K.N.; Singh, A. Effect of temperature and humidity variation on the development of peach leaf curl on mid hills and its control. Indian Phytopathol. 1966, 19, 308–309. [Google Scholar]
- Rossi, V.; Bolognesi, M.; Languasco, L.; Giosue, S. Influence of environmental conditions on infection of peach shoots by Taphrina deformans. Phytopathology 2006, 96, 155–163. [Google Scholar] [CrossRef] [PubMed]
- Rossi, V.; Bolognesi, M.; Giosuè, S. Influence of weather conditions on infection of peach fruit by Taphrina deformans. Phytopathology 2007, 97, 1625–1633. [Google Scholar] [CrossRef]
- González-Domínguez, E.; Caffi, T.; Rossi, V.; Salotti, I.; Fedele, G. Plant disease models and forecasting: Changes in principles and applications over the Last 50 Years. Phytophathology 2023, 113, 678–693. [Google Scholar] [CrossRef] [PubMed]
- Gent, D.H.; Mahaffee, W.F.; McRoberts, N.; Pfender, W.F. The use and role of predictive systems in disease management. Annu. Rev. Phytopathol. 2013, 51, 267–289. [Google Scholar] [CrossRef] [PubMed]
- UlHaq, I.; Ijaz, S. Trends in Plant Disease Assessment; Springer Nature: Singapore, 2022; pp. 225–240. [Google Scholar]
Figure 1.
Effect of temperature on ascospore germination of Taphrina deformans. Estimates of the parameters from the quadratic function.
Figure 1.
Effect of temperature on ascospore germination of Taphrina deformans. Estimates of the parameters from the quadratic function.

Figure 2.
Effect of temperature on blastospore germination of Taphrina deformans. Estimates of the parameters from the quadratic function.
Figure 2.
Effect of temperature on blastospore germination of Taphrina deformans. Estimates of the parameters from the quadratic function.

Figure 3.
Effect of wetness on ascospore germination of Taphrina deformans at constant temperatures of 20 °C. Estimates of the parameters from the quadratic function.
Figure 3.
Effect of wetness on ascospore germination of Taphrina deformans at constant temperatures of 20 °C. Estimates of the parameters from the quadratic function.

Figure 4.
Effect of wetness on blastospore germination of Taphrina deformans at constant temperature of 20 °C. Estimates of the parameters from the quadratic function.
Figure 4.
Effect of wetness on blastospore germination of Taphrina deformans at constant temperature of 20 °C. Estimates of the parameters from the quadratic function.

Figure 5.
Mean air temperatures in the experimental peach orchards in the periods of February–March 2022 and 2023.
Figure 5.
Mean air temperatures in the experimental peach orchards in the periods of February–March 2022 and 2023.

Figure 6.
Wetness in the experimental peach orchards in the periods of February–March 2022 and 2023.
Figure 6.
Wetness in the experimental peach orchards in the periods of February–March 2022 and 2023.

Figure 7.
Predictions (as presented in the screen of computer) of the ascosporic (AModel) and blastosporic models (BModel) to forecast infections from the fungus Taphrina deformans on peach trees for the period February to March of two consecutive years (2022 and 2023).
Figure 7.
Predictions (as presented in the screen of computer) of the ascosporic (AModel) and blastosporic models (BModel) to forecast infections from the fungus Taphrina deformans on peach trees for the period February to March of two consecutive years (2022 and 2023).


Table 1.
Effect of temperatures on the ascospore and blastospore germination of Taphrina deformans.
| Temperatures (°C) | Percentage of Ascospore Germination (%) | Percentage of Blastospore Germination (%) | ||
|---|---|---|---|---|
| −3 | 0 y | A z | 0 | a |
| 0 | 5 | b | 4 | a |
| 5 | 13 | c | 11 | b |
| 10 | 21 | d | 23 | c |
| 15 | 44 | f | 51 | d |
| 20 | 70 | g | 69 | e |
| 25 | 27 | e | 21 | c |
| 30 | 6 | b | 5 | a |
| 35 | 0 | a | 0 | a |
y Means of 10 replicates; z Values in the same column followed by different letters are significantly different at p = 0.05 according to Wald Test.
Table 2.
Effect of wetness on the ascospore and blastospore germination of Taphrina deformans.
| Duration of Wetness (h) x | Percentage of Ascospore Germination (%) | Percentage of Blastospore Germination (%) | ||
|---|---|---|---|---|
| 3 | 0 y | a z | 0 | a |
| 6 | 0 | a | 0 | a |
| 9 | 35 | b | 34 | b |
| 12 | 61 | c | 73 | c |
| 15 | 74 | d | 74 | c |
| 18 | 76 | d | 74 | c |
| 24 | 75 | d | 75 | c |
| 48 | 77 | d | 76 | c |
x The experiment was carried out at 20 °C; y Means of 10 replicates; z Values in the same column followed by different letters are significantly different at p =0.05 according to Wald Test.
Table 3.
Dates of spray applications applied in the two experimental peach orchards.
| Treatment | Date of Spray Application | |||||
|---|---|---|---|---|---|---|
| Orchard cv. Sun Claus | Orchard cv. Rich May | |||||
| Untreated Trees | - | - | - | - | - | - |
| Growers’ Spray Programme | 10 February 23 | 18 February 23 | 28 February 23 | 8 February 23 | 20 February 23 | 1 March 23 |
| Model-Guided Spray | - | - | 28 February 23 | - | 28 February 23 | |
Table 4.
Incidence of leaves affected by peach leaf curl in the two experimental peach orchards.
| Treatment | Leaves Affected (%) | |||
|---|---|---|---|---|
| Orchard cv. Sun Claus | Orchard cv. Rich May | |||
| Untreated Trees | 5.6 y | a z | 4.8 | a |
| Growers’ Spray Programme | 0.8 | b | 0.0 | b |
| Model-Guided Spray | 1.1 | b | 0.4 | b |
y Means of four replicate plots, three trees per plot, 100 random leaves per tree; z Values in the same column followed by different letters are significantly different at p = 0.05 according to Wald Test.
Disclaimer/Publisher’s Note: The statements, opinions and data contained in all publications are solely those of the individual author(s) and contributor(s) and not of MDPI and/or the editor(s). MDPI and/or the editor(s) disclaim responsibility for any injury to people or property resulting from any ideas, methods, instructions or products referred to in the content. |
© 2023 by the authors. Licensee MDPI, Basel, Switzerland. This article is an open access article distributed under the terms and conditions of the Creative Commons Attribution (CC BY) license (https://creativecommons.org/licenses/by/4.0/).
Share and Cite
MDPI and ACS Style
Thomidis, T.; Paresidou, M. Influence of Temperature and Wetness on Taphrina deformans Ascospore and Blastospore Germination: Disease Forecasting and Validation. Agriculture 2023, 13, 1974. https://doi.org/10.3390/agriculture13101974
AMA Style
Thomidis T, Paresidou M. Influence of Temperature and Wetness on Taphrina deformans Ascospore and Blastospore Germination: Disease Forecasting and Validation. Agriculture. 2023; 13(10):1974. https://doi.org/10.3390/agriculture13101974
Chicago/Turabian StyleThomidis, Thomas, and Maria Paresidou. 2023. "Influence of Temperature and Wetness on Taphrina deformans Ascospore and Blastospore Germination: Disease Forecasting and Validation" Agriculture 13, no. 10: 1974. https://doi.org/10.3390/agriculture13101974
Note that from the first issue of 2016, this journal uses article numbers instead of page numbers. See further details here.