1. Introduction
Agriculture is a vital part of the global economy, providing food, fibe, and other essential products for human consumption [
1]. However, the agricultural sector faces significant challenges in meeting the growing demand for food as the global population increases, climatic conditions change, and the significant concern subjected to the critical role of soil and fertilizers in achieving optimal crop yields and maintaining soil health [
2]. It is well known that the right soil type and precise applicability of fertilizers are critical factors that can significantly enhance crop growth and overall agricultural sustainability. However, the conventional agricultural system has long been plagued by a shortfall in intelligent recommendations; as such, systems are often based on general guidelines, historical knowledge, and limited experimentation [
3]. The traditional systems do not consider the specific needs of individual crops and fields, which often leads to the inefficient allocation of resources, increased costs for farmers, and sub-optimal environmental outcomes [
4]. In light of these challenges, the agricultural sector stands at the threshold of transformation. There is an urgent need to revolutionize farming practices.
Precision agriculture (PA), a subset of smart agriculture, is a promising solution to these challenges, as it can help improve agricultural practices’ efficiency and sustainability [
5]. PA involves using advanced technology and data-driven techniques to optimize agricultural practices [
6,
7]. Key components of precision agriculture often include the use of sensors, GPS (global positioning system) technology, drones, and data analytics [
8,
9]. This transition towards a more effective, data-driven, and user-friendly approach is essential to improve farming operations’ efficiency, productivity, and sustainability by making more precise and informed decisions based on real-time data [
10]. In particular, this shift is made possible by the advent of Crop and Fertilizer Recommendation Systems (CFRS), which harness the power of technology such as the Internet of Things (IoT), data analytics, and Artificial Intelligence (AI) to provide specialized guidance to farmers [
11,
12]. Such system holds promising scope to optimize soil and fertilizer interactions, increase agricultural productivity, and promote sustainable practices. Moreover, CFRS can empower farmers with valuable insights, reduce uncertainties, and mitigate the risks associated with traditional farming methods.
In the modern era, the integration of IoT and AI in agriculture has witnessed significant growth in recent years [
13,
14]. IoT is reshaping how we collect, process, and utilize data in real time through a network of interconnected sensors and devices embedded in the agricultural landscape. IoT-based systems are deployed to collect real-time sensory data on various factors affecting crop growth, such as temperature, humidity, soil pH, and nutrient levels [
15]. This wealth of real-time data and AI analytics forms the foundation upon which the CFRS operates to make informed decisions on crop selection and fertilizer application. The study aimed to bridge the gap between the physical and digital realms by integrating IoT technology with AI into modern agriculture. The proposed CFRS reported in this paper not only facilitates the recommendation of suitable crops to specific agricultural land but also offers fertilizer recommendations based on the soil condition for the crops during both pre-sowing (before plantation) and post-sowing until the crop reaches maturity. With such a comprehensive perspective, the proposed CFRS (Crop and Fertilizer Recommendation Systems) holds significant potential for addressing the challenges faced by smallholder farmers and for countries subject to food insecurity such as Rwanda due to low productivity, declining soil organic matter, and adverse topography.
Rwanda has been heavily involved in promoting crop intensification programs to increase the agricultural productivity of high-value food crops and achieve food security and self-sufficiency [
16]. However, smallholder farmers, who play a vital role in the agricultural sector, face challenges that limit their crop productivity. These challenges include sub-humid conditions that cause frequent crop failures, the prevalence of acidic soils, declines in soil organic matter due to high population density, and the country’s topography that makes agricultural systems vulnerable [
17]. A study by NISR found that agriculture employs nearly 72% of Rwandans and contributes nearly 33% to the country’s GDP [
18]. This mismatch between labor force participation and GDP contribution shows how serious the problems in the agricultural sector are. Moreover, the socioeconomic impacts are severe, with persistent poverty and alarming malnutrition rates, especially among children. Therefore, by addressing both crop and fertilizer recommendations in an integrated way, the proposed CFRS has a transformative impact. It can potentially revolutionize the current agriculture system in Rwanda by optimizing the selection of suitable crops on particular farming land, in-creasing crop yields, reducing fertilizer waste, and promoting sustainable practices. Although several studies reported in the literature focus on developing sustainable agriculture systems in the Rwandan context, many of these approaches utilize data analysis machine learning (ML) techniques and deep learning models to build predictive models addressing various challenges to crop production [
19,
20,
21]. It has been identified that most of the existing works are subjected to predicting yields of different crops, assessing the soil quality, reviewing agricultural crop policies and single crop recommendations, and understanding the impact of climate anomalies on crops. However, the scope of the existing works reported in the literature is often narrowly defined, either addressing a single aspect of farming or not integrating crucial components of fertilizer suggestion and soil conditions. This isolation often results in a lack of comprehensive insights, limiting the existing approaches’ real-world applicability and accuracy. The subsequent section highlights this research manuscript’s prime aim and core contribution.
1.1. Contributions of the Study
The prime aim of this study is to help farmers choose the best crops to grow and the right amount of fertilizer to use. The study develops a comprehensive model that integrates CFRS holistically, considering various relevant factors to provide more precise and specialized recommendations to farmers. The key contributions of this study are highlighted as follows:
Data Processing and Profiling: Comprehensive data on Rwanda’s major crops have been collated and analyzed, focusing on structured content and data integrity.
Correlation Analysis: The study examines how inter-variable correlation can enhance predictive modeling, leading to better decision-making.
Crop Recommendation: The study implements a neural network model to recommend crops. This model has been thoroughly trained and tested and is more effective than other prominent ML models.
Fertilizer Recommendation: The modeling of fertilizer recommendation adopts a simple logical function that supports the foundational understanding that each soil and crop combination has specific nutrient requirements. The predetermined rules grounded in real agricultural practices were adopted, allowing farmers to understand the why behind a recommendation, fostering trust and encouraging adoption.
Practical Application with IoT: Real-world testing was conducted with IoT sensors, where proposed CFRS is applied to collect data to offer actionable insights.
The study also presents a conceptual architecture for deploying the proposed CFRS on a cloud server to provide real-time, effective, and data-driven agricultural recommendations, including monitoring soil conditions and nutrient dynamics over time.
By combining IoT and AI to framing practices, this paper offers a solution to the rising global food demand facing challenges, such as population growth and changing climate condition: an advanced system that not only suggests which crops to grow but also offers the right fertilizer to use based on various data inputs. The novelty of the proposed work stems from multiple factors. Firstly, the proposed system is more comprehensive than existing approaches, which often restrict recommendations to one or two crops. It caters to various crops predominantly cultivated in Rwanda and considers soil conditions at various crop growth stages to recommend the proper fertilizer application. Secondly, the proposed system also includes effective data processing and profiling to ensure the completeness and reliability of the data used for recommendation modeling. The proposed schemes are designed to be lightweight, ensuring rapid and cost-effective computations.
1.2. Outline of the Study
The remaining part of the proposed manuscript is organized as follows.
Section 2 briefly discusses the related work, demonstrating the current research status and differentiating the proposed work from the existing one. Further,
Section 3 elaborates on a system design following the implementation procedures adopted in each module of the proposed CFRS. Next,
Section 4 discusses the performance metrics adopted in the experimental process, result analysis, and performance discussion. This section also presents the use case scenario of the proposed system concerning real-world deployment scenarios. Finally,
Section 5 concludes the work and core findings reported in this paper.
2. Related Works
The application of precision agriculture has been the focus of extensive research and development efforts, with scholars across the globe developing various strategies and technologies to optimize farming practices. This section reviews the research works done in the context of soil quality prediction, crop recommendation, and fertilizer recommendation.
The researchers in Rivera and Bonilla [
22] trained neural network and generalized linear model (GLM) models on a dataset of soil samples from different regions with varying properties such as texture, organic matter content, and pH to predict soil quality. The experimental results showed that the neural network model outperformed the GLM model regarding prediction accuracy. The study provides two models that can be used to predict aggregate stability when direct measurements are unavailable, which can help improve the comprehensiveness of soil surveys. Suchithra and Pai [
23] utilized extreme learning machines (ELM) to optimize agriculture practices through soil testing and classification. By analyzing soil test report values, village-wise soil fertility indices for essential nutrients are categorized. The Gaussian radial basis function emerges as the top performer, with over 80% accuracy in most classifications. The presented approach can reduce fertilizer waste, enhance profitability, and improve soil health and environmental quality for sustainable agriculture in India. In [
24], Chambers showed that the type of ML model used can affect the accuracy of soil property predictions and that local farms tend to have more accurate predictions than farms in different locations. Principal component analysis (PCA) with 50 components was found to be beneficial. Wu et al. [
25] showed that the Generalized Regression Neural Network (GRNN) model can effectively estimate soil nutrients for Dacrydium pectinatum communities in China. The GRNN model, along with the k-nearest neighbor (KNN) and support vector machine (SVM) model, is utilized to assess soil nutrient content and quality grades. The work of Rose et al. [
26] emphasized the significance of ML classifiers and statistical approaches in predicting soil fertility and regulating ecosystems with reduced human intervention. In [
27], Rajamanickam used Decision trees, KNN, and SVM algorithms to predict soil fertility based on macro- and micronutrient data, achieving 99% accuracy with the decision tree algorithm.
In [
28], Rajamanickam and Mani addressed the impact of climate anomalies on crops and environmental challenges on agriculture practices. The authors have proposed a probabilistic neural network for the soil fertility prediction approach, providing higher accuracy and reduced processing time. Katarya et al. [
29] discuss various artificial intelligence (AI) techniques for improving crop yields in agriculture. These techniques are based on the paradigm of precision agriculture (PA), specifically crop recommender systems. The specific approaches discussed include K-nearest neighbor (KNN), similarity-based classifiers, ensemble learning, and neural networks. The authors introduce a model that considers external factors such as meteorological data, temperature, and soil profile to recommend optimal crops for cultivation. This can lead to improved yields and more efficient use of resources. Klerkx et al. [
30] provided a comprehensive overview of the emerging field of digital agriculture, covering a wide range of sub-fields, including the adoption of digital technologies on farms, the impact of digitalization on farmer identity and skills, ethics in digital agriculture, the effects of digitalization on agricultural knowledge and innovation systems, and the economics of digital agriculture. The study maps the contributions of 17 special issue articles to these clusters. It offers insights into the links between digital agriculture and farm diversity, new economic and institutional arrangements, and the governance of digital agriculture. Shadrin et al. [
31] developed a low-power embedded system with AI capabilities for continuous analysis of plant leaf growth. The system uses a GPU to run a recurrent neural network (LSTM) on board, enabling autonomous operation for 180 days on a standard Li-ion battery. This study opens up new possibilities for intelligent monitoring in agriculture, and the authors have shared the Tomato Growth dataset with the research community.
Kumar et al. [
32] investigate how wireless sensor networks (WSNs) can be used in precision agriculture to improve crop yields and quality. They highlight a variety of WSN applications, such as pest and disease control, animal tracking, and crop strength assessment, which have the potential to significantly boost crop production. Talaviya et al. [
33] discuss the importance of AI in addressing agricultural challenges posed by rising population and food demand. They review AI applications in agriculture, including irrigation, weeding, and spraying using sensors, robots, and drones, with a focus on soil moisture sensing, automated weeding techniques, and drone applications for spraying and crop monitoring. Kamilaris et al. [
34] introduce a smart farming framework that uses IoT platforms to process diverse sensor data streams in real time. The Agri-IoT framework supports reasoning across heterogeneous data streams, enabling seamless integration of sensors, services, processes, farmers, and online information sources. It provides a comprehensive and adaptable solution for the agri-food industry, bridging the gap between external factors and the food supply chain. Rekha et al. [
35] develop an IoT framework to help farmers improve their farming methods and increase crop yields. The framework uses wireless sensor networks to collect data and a decision support system to provide farmers with personalized advice on irrigation, fertilization, and other practices. The advice is delivered in the farmers’ regional language through an Android app, making it easy for them to follow and improve their farming practices, which can lead to increased income.
Rehman et al. [
36] propose a smart farming approach that uses real-time sensor data and machine learning to improve agricultural practices. By integrating these two technologies, their approach enhances precision agriculture and overcomes the limitations of traditional smart farming methods. Priya et al. [
37] suggested using deep learning algorithms to predict the best crops to grow based on factors such as soil moisture, humidity, temperature, pH, soil type, and land type. This crop recommendation system helps farmers make informed decisions to improve productivity, especially in the face of changing weather patterns. Biradar et al. [
38] highlight the potential of IoT and data mining to develop intelligent systems for more efficient water management in agriculture. Sensor networks can provide a cost-effective way to monitor and control water use, leading to improved crop yields and food security. Akhter et al. [
10] demonstrate how IoT, WSN, data analytics, and machine learning can be used to revolutionize apple disease prediction in apple orchards. They also explore the challenges of implementing these technologies in traditional farming practices. Ref. [
39] studied how IoT can revolutionize traditional irrigation scheduling on a flood-irrigated subtropical lemon farm. They also explore the challenges of implementing these technologies in traditional farming practices. Gupta et al. [
40] show that using the right algorithms on sensor data can recommend the best crops to grow, leading to higher yields and better-quality produce. Vi-vekanandhan et al. [
41] introduce an adaptive neuro-fuzzy inference system (ANFIS) technique for analyzing agricultural plant growth based on soil, water level, temperature, and moisture conditions.Their smart irrigation system is effective in monitoring and improving crop growth.
Hence, it can be seen that there is much research work presented on PA applications and ML-based predictive modeling to benefit agriculture systems. However, each method is associated with its own advantages, and they have limitations too. It has also been analyzed that very little work is done in the context of Rwanda’s agricultural system. The literature is rich with studies on various ML applications in smart agriculture. However, such approaches are subjected to theoretical discussion, not implementations. The theoretical discussions are valuable, and validation of these models in real-world agricultural settings is essential to assess their feasibility and effectiveness. The potential of integrating the IoT and AI in agriculture has been explored in previous research. However, in isolation, most of these studies either focus on crop or fertilizer recommendations. It has also been noticed that the existing studies lack details about the data source system implementations, even if they do not specify the features used and on what basis they selected a particular learning model. All these gaps are addressed by the proposed system discussed in the next section.
3. Materials and Methods
The development of the proposed recommendation models is carried out using python programming language in Anaconda distribution installed on windows 10 machine. Five-pin soil transmitter (Type485) sensors from (Shandong Renke Control Technology Co., Ltd., Jinan City, China), were used to collect data across agricultural fields.
This section presents the design of the proposed CFRS as a support system for precision agriculture and sustainable farming practices. Building a robust and efficient CFRS for Rwanda’s agricultural system requires a suitable dataset that includes crop information, soil properties, and nutrients. However, no standard dataset for building CFRS in the Rwandan context is available. The first steps in building the proposed CFRS system are to collect and prepare the dataset. This study has developed a sophisticated data modeling and feature extraction approach to effectively train the learning model for crop recommendation based on current soil attributes.
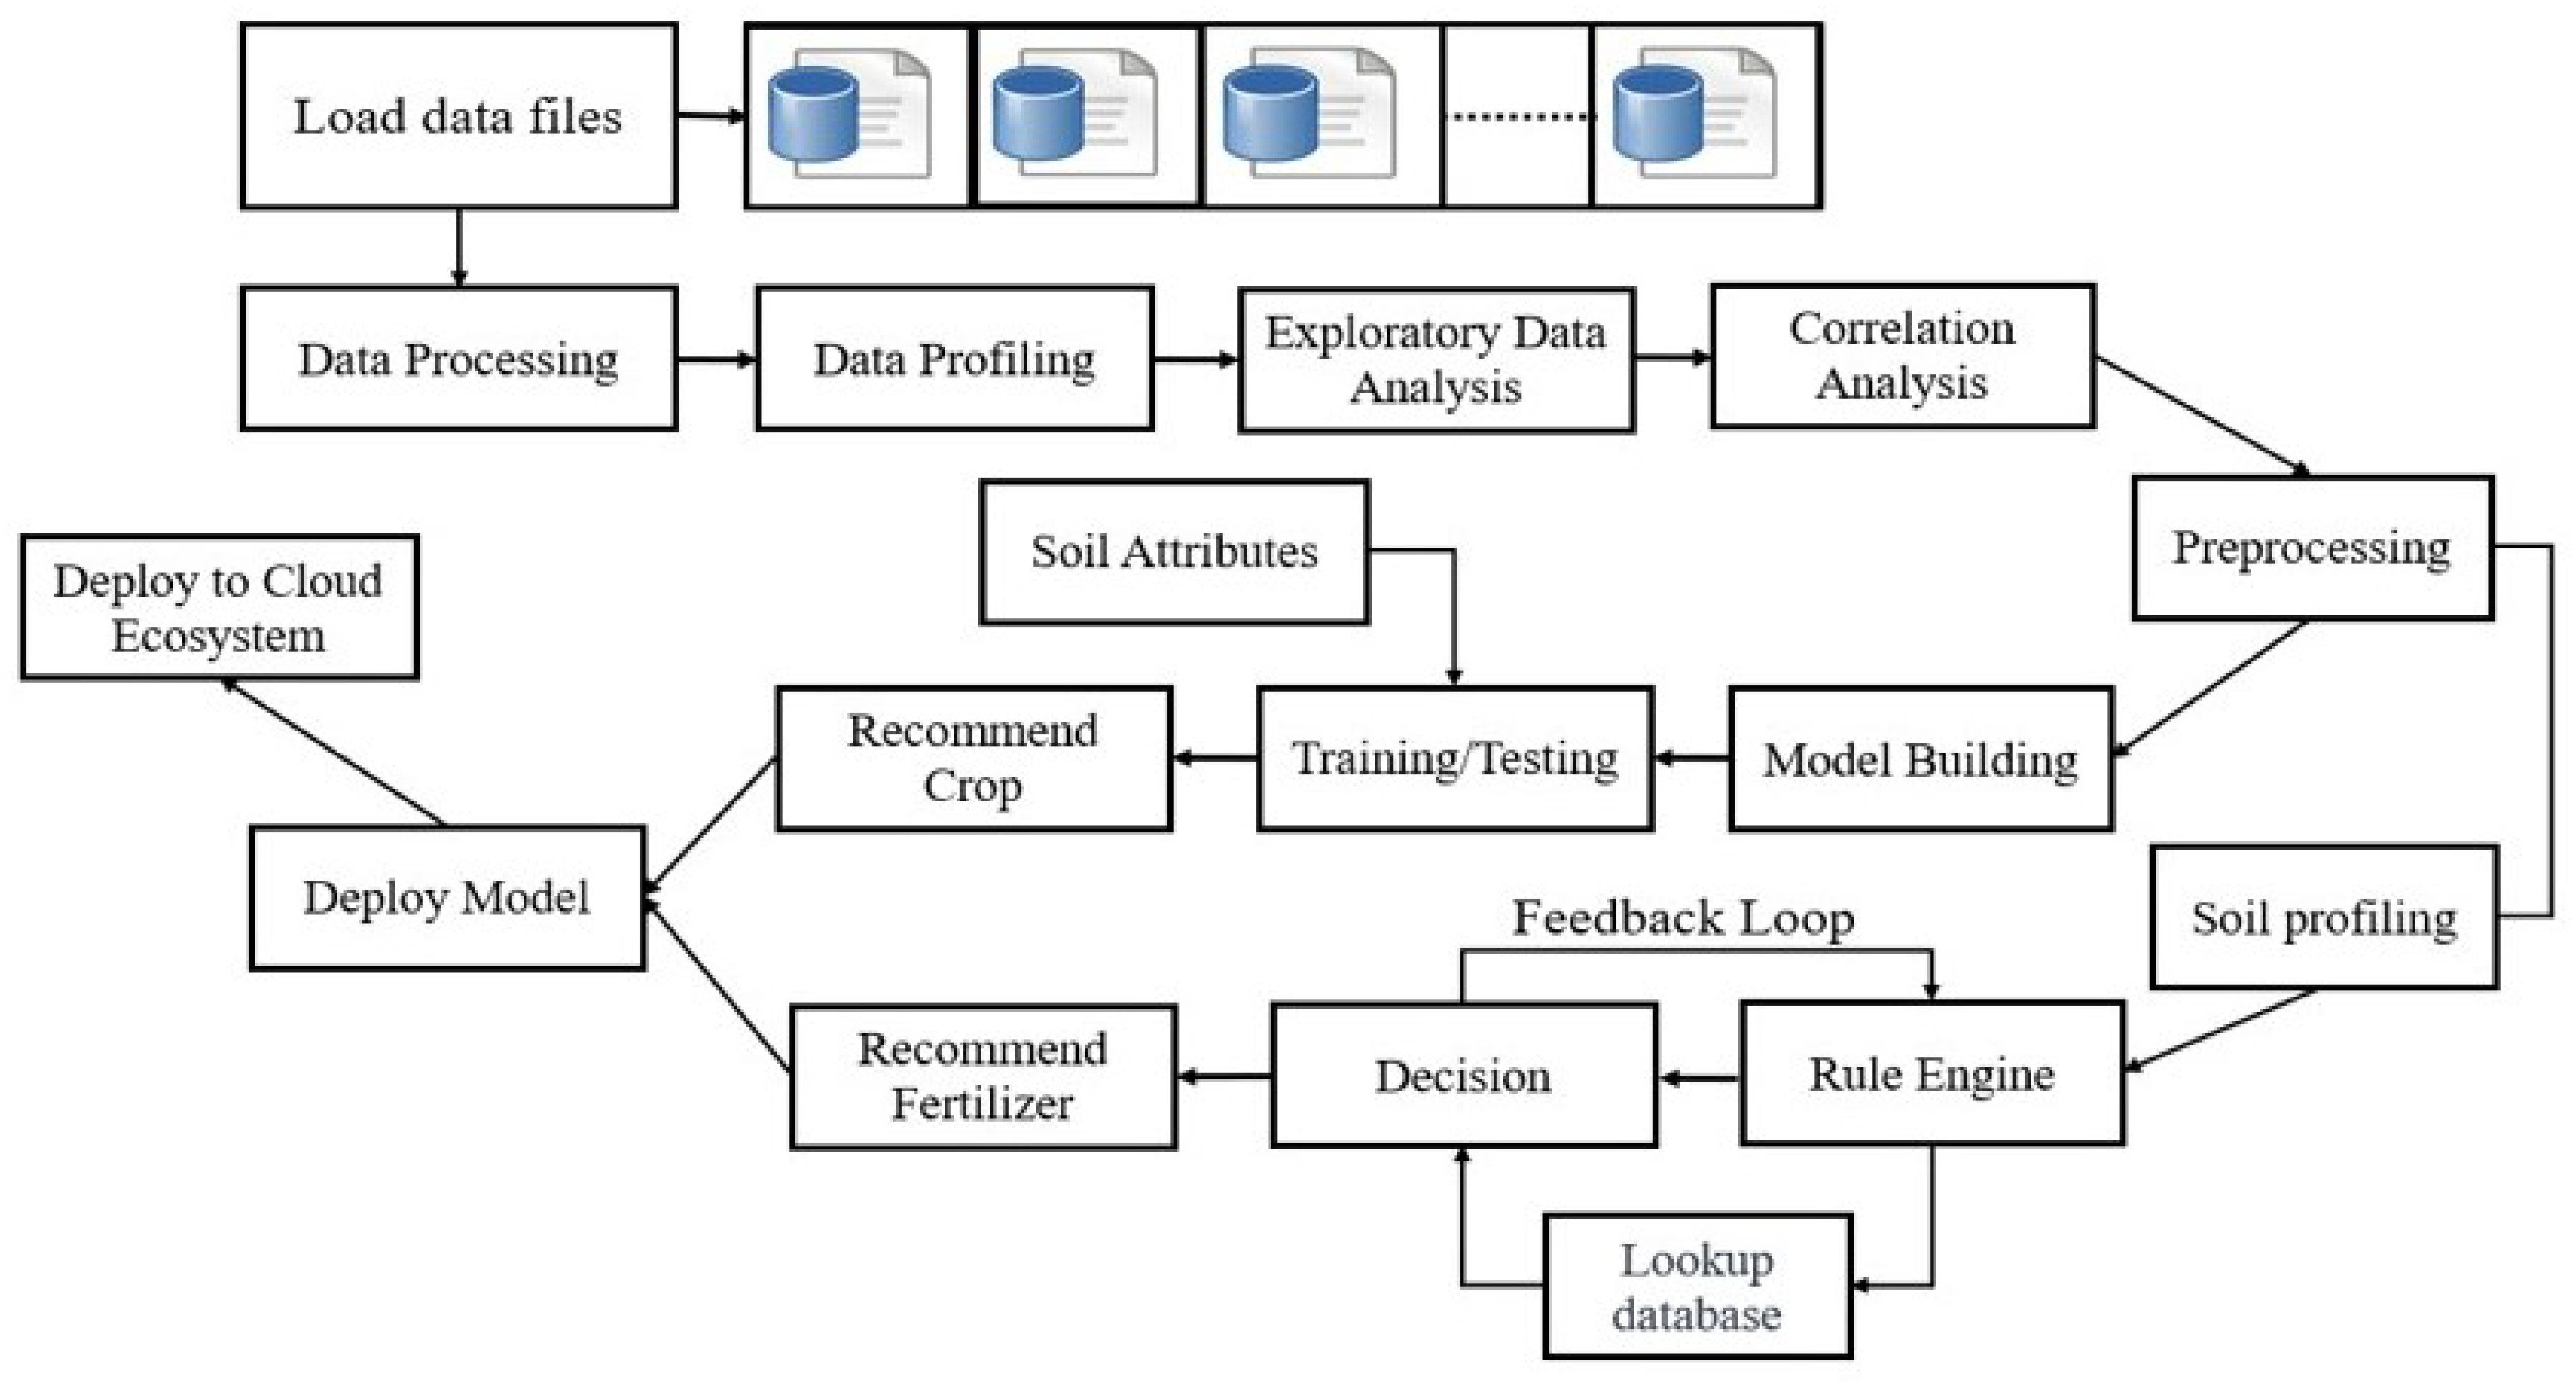
Figure 1 shows the schematic architecture of the proposed system, which includes various computing modules such as dataset collection and selection, data profiling, data preprocessing, neural network-driven crop recommendation, and decision logic implementation for fertilizer recommendation.
The proposed system architecture, shown in
Figure 1, involves a highly synchronized approach to data analytics and computational intelligence. The top layer of the system design is responsible for collecting data from different sources. These data are then analyzed and mapped to construct a final crop dataset in the next layer. Exploratory data analysis and correlation analysis are then performed to understand the nature of the data and obtain significant insights into which preprocessing techniques to apply to ensure the dataset’s completeness. This process is crucial for ensuring the dataset’s quality, making it suitable for training the learning model for crop recommendation. The study used the common practice of splitting the dataset into training and testing sets in an 80:20 ratio. The neural network model was configured and optimized for the specific problem and input data. The trained model was then validated on the testing dataset, which consisted of different soil attributes.
The next part of the proposed system integrates a rule-based fertilizer recommendation system. This phase first performs soil profiling using the preprocessed dataset from the crop recommendation system and builds a lookup table based on scientific evidence and expert knowledge. The proposed system is based on the ideology that while many tasks can benefit from the predictive capabilities of machine learning, there is undeniable value in domain-specific, expert-driven rules. The proposed rule-based fertilizer recommendation system is based on the principle that each soil and crop combination has specific nutrient requirements. It is transparent and easy to understand, as it is based on established knowledge in agriculture. This allows farmers to understand the reasoning behind the recommendations, which can build trust and lead to improved crop yields and more sustainable farming practices. The system also includes a feedback loop mechanism to help update and improve the rules and recommendations over time. The proposed study discusses the conceptual architecture of the system and underscores its real-world applicability and feasibility for deployment in a cloud environment.
3.1. Data Processing and Profiling
In order to ensure the effectiveness of the crop recommendation system, diverse data are collected, including information on soil properties, nutrient levels, and crop performance from various agricultural regions. The data collection phase of the proposed system involved compiling crop datasets from various sources, primarily the crop recommendation dataset and soil fertility data obtained from Kaggle [
42,
43], and soil nutrient balance (NPK) dataset of Rwanda obtained from [
44]. Combining data from different sources is difficult because the data can be in different formats and sizes. This study uses a sophisticated data modeling process called data profiling to harmonize and integrate the data to address this challenge. First, the system selects the major crops cultivated in Rwanda, such as maize, potatoes, beans, tomatoes, coffee, cassava, sweet potatoes, sorghum, onion, kidney beans, and banana. The selection criteria are based on familiarity with Rwanda’s agricultural system, sustainability concerns, and empirical evidence from previous studies [
45,
46]. This process results in a comprehensive crop data collection relevant to the study objectives.
Data profiling is the process of examining a dataset to understand its structure, content, and quality. The first step in this process is to review the columns of the dataset. In this case, the dataset included columns for nitrogen (N), phosphorus (P), potassium (K), temperature, humidity, pH, rainfall, and a label column. These columns represent essential factors that affect crop growth. Next, the study selected the columns that are relevant to the study, which are N, P, K, pH, and major crop. Focusing on these variables simplified the dataset while retaining the most critical information. Finally, the study filtered the dataset to include only rows corresponding to the significant crops of interest. To prevent bias, the data frame was randomly shuffled. The data frame index was reset to maintain data integrity. Finally, a new data frame was created with only the selected variables. Algorithm 1 shows how data profiling was used to clean and streamline the dataset after preprocessing. This helped to identify the key features in the data and ensure that the analysis focused on the variables that were most relevant to the study objectives.
| Algorithm 1 Dataset Profiling for data integration and harmonization |
Input: (Sets of datasets sourced from different origins)
Output: df (harmonized dataset for CFRS)
Procedure:
1. Initialization:
(Set of major crops of interest)
2. Data Selection:
// Union of all datasets retaining only records related to crops in
← (Substraction of irrelevant columns from )
3. : Convert units of ‘N’, ‘P’, ‘K’ to standard units, if not already
4. Data Randomization:
Shuffle the order of records in
Reset indices of
5. Data Integration:
(Union of all dataset )
6. Review & Validation:
Conduct exploratory data analysis on
7. Data pre-processing: (Post data profiling, detailed in next sub-section)
8. ←
9. Identify correlations and rectify outliers in
10. Remove duplicates in (ensures completeness of the dataset)
End |
3.2. Preprocessing
Preprocessing is a critical step in data-driven predictive modeling because the quality of the data and the useful information that can be extracted from them directly affects the model’s ability to learn the underlying patterns in the training data. This phase of the proposed system involves exploratory data analysis (EDA) and correlational analysis. EDA is a process of analyzing datasets to identify their main characteristics, often using visual methods. Under EDA, the study calculates descriptive statistics such as mean, median, mode, minimum, maximum, range, quartiles, variance, and standard deviation to understand the relationships between the variables.
Table 1 shows different crops’ average NPK (kg/ha) and pH requirements. The average NPK requirements for bananas are 100.19 kg of nitrogen, 80.89 kg of phosphorus, and 50.04 kg of potassium per hectare. The average pH of soil where bananas are grown is 6.07, considered moderately acidic. Similarly, beans require an average of 75.09 kg of nitrogen, 25.32 kg of phosphorus, and 34.73 kg of potassium per hectare. The average pH for growing beans is 5.89, considered highly acidic. Cassava requires an average of 74.77 kg of nitrogen, 34.92 kg of phosphorus, and 59.79 kg of potassium per hectare. The average pH of cassava fields is 5.92, which is also highly acidic. Similar interpretations can be made for other crops to understand their fertilizer requirements and soil suitability for more efficient crop production.
Figure 2 provides a comparative analysis of different crops based on their nitrogen requirements in Kg/ha. The analysis demonstrates that the crop Maize requires the most nitrogen, followed by onion and sorghum. Kidney beans require the least nitrogen. Bananas have a wide range of nitrogen needs, appearing in the highest and lowest categories. Similarly,
Figure 3 gives a comparative analysis of different crops based on their phosphorus requirements in Kg/ha.
The insight from
Figure 3 exhibits that bananas require the most phosphorus, followed by maize and kidney beans. Beans and coffee require relatively less phosphorus. Onions have diverse phosphorus requirements, ranking in the highest categories. A closer analysis of
Figure 4 reveals that onions, followed by cassava and potatoes, require the most potassium, while kidney beans, maize, and sorghum require little potassium. This analysis emphasizes the varied nutrient profiles of different crops across categories.
The analysis shown in
Figure 5 offers a holistic view of the data’s distribution and relationships between different data points color-coded based on different crops under major crops. In this visualization, the diagonal part shows frequent distribution of the data points. In contrast, the scatter representation of the data points showcases the distinction among the different crops concerning different nutrient requirements. It can be seen that nitrogen (N) and phosphorus (P) are correlated; it seems that crops that need high amounts of N may also require high amounts of P.
A closer analysis of the above-mentioned
Figure 5 also reveals that specific data points are densely packed, indicating that such crops have similar requirements for those paired nutrients. Moreover, a few data points are also found that lie far away from others, which can be potentially an outlier, which, if not addressed, may introduce ambiguity in predictive learning. To eliminate the outliers, the proposed study uses the standard score method, which measures how many standard deviations an element is from the mean. About 99.7% of the data in a normal distribution fall within three standard deviations from the mean. Therefore, a score greater than three is used as an indicator of an outlier. Mathematically, the outlier score (
S) for a data point
x is computed as follows:
where
x is the data point,
refers to the mean value of the dataset, and
denotes the standard deviation of the dataset. So, if the value of
S of a data point falls outside a predefined threshold, the data point is tagged as an outlier.
Figure 6 presents a correlation heatmap to gain insight into correlation among different data points.
Figure 6 shows a correlation plot of different crop nutrients and factors. The values in the plot range from −1 to 1, where −1 indicates a strong negative correlation, 1 indicates a strong positive correlation, and 0 indicates no correlation. Nitrogen (N) has a strong positive correlation with phosphorus (P), meaning crops that need much nitrogen also need much phosphorus. This correlation is 0.77, which is considered high. Nitrogen’s correlations with other elements and factors are weaker. For example, it has a weak positive correlation with potassium (K) at 0.15 and a similar trend with pH at 0.04. This analysis shows a slight but positive relationship between nitrogen and potassium and between nitrogen and pH. The major crop type has a moderate positive correlation with nitrogen (N) levels, with a coefficient of 0.52. This shows a medium-strength relationship between the crop type and the amount of N it needs. Phosphorus (P) has weaker positive correlations with potassium (K) and pH, with correlation coefficients of 0.13 and 0.01, respectively. This examination suggests a slight but positive relationship exists between P and K and between P and pH. The overall analysis shows that the amount of N a crop needs is most strongly correlated with the amount of P it needs. It is also correlated with the crop type but to a lesser extent. The correlations between N and other elements and factors are even weaker.
3.3. Crop Recommendation System
The machine learning model applied in the proposed study offers the potential to learn intricate patterns and relationships between multiple variables, making it an effective tool for crop recommendations. This model has the ability to map a high-dimensional input space to outputs and adaptively learn from the data. The proposed study built a neural network and trained it on the prepared crop dataset to recommend suitable crops.
3.3.1. Data Attributes
It is well recognized in agronomic studies that many environmental and geographical factors, such as humidity, temperature, rainfall, altitude, soil type, and more, can significantly impact crop growth, yield, and health. These factors, individually or in tandem, play a role in determining the suitability of a specific crop in a given geographical region.
In the proposed study, the study has considered the learning model around the essential soil nutrients N (nitrogen), P (phosphorus), K (potassium), and soil quality represented by pH. These are foundational factors that majorly influence crop recommendations and are consistent indicators across various datasets. The major crop type serves as the output of our model. While it would be ideal to incorporate all influential environmental and geographical parameters for a holistic recommendation, the proposed study is focused primarily on the soil’s health, nutrients, and quality. The reasons being:
Data Availability & Consistency: Our dataset is a compilation from various sources, with the majority being oriented towards N, P, K, pH, and crops. Some datasets did encompass parameters such as rainfall and temperature, but to maintain consistency and avoid introducing data biases, it was essential to have uniform features across all data points.
Complexity in Data Collection for Other Factors: Gathering a comprehensive dataset that includes all geographical and climatic factors is a herculean task. It requires expert interventions, prolonged data curation processes, and introduces the risk of human errors.
Interrelation with pH: The soil’s pH, which measures its acidity or alkalinity, can act as a proxy for some environmental factors. For instance, consistent rainfall can influence soil pH; likewise, soil pH can reflect certain climatic conditions such as humidity and temperature. By considering pH, the model indirectly captures some of the environmental conditions’ impacts on the soil.
3.3.2. Model Training
The machine learning model for crop recommendations was trained using a supervised learning approach. Initially, we preprocessed the data to handle any missing values, outliers, and to normalize the features. The dataset consists of approximately 10,440 samples, which were then split into a training and testing set considering a split ratio of 70:30, where 80 percent of data, i.e., 8352 samples, are kept for training and the remaining 20%, i.e., 2088 samples, are kept for testing the trained model. The study also considers a validation set, which is 10% of the training dataset, to ensure that the model is not overfitting or underperforming during its training. Therefore, training data consists of 7308 data samples and four predictors (N, P, K, pH) and a single response variable named major_crop.
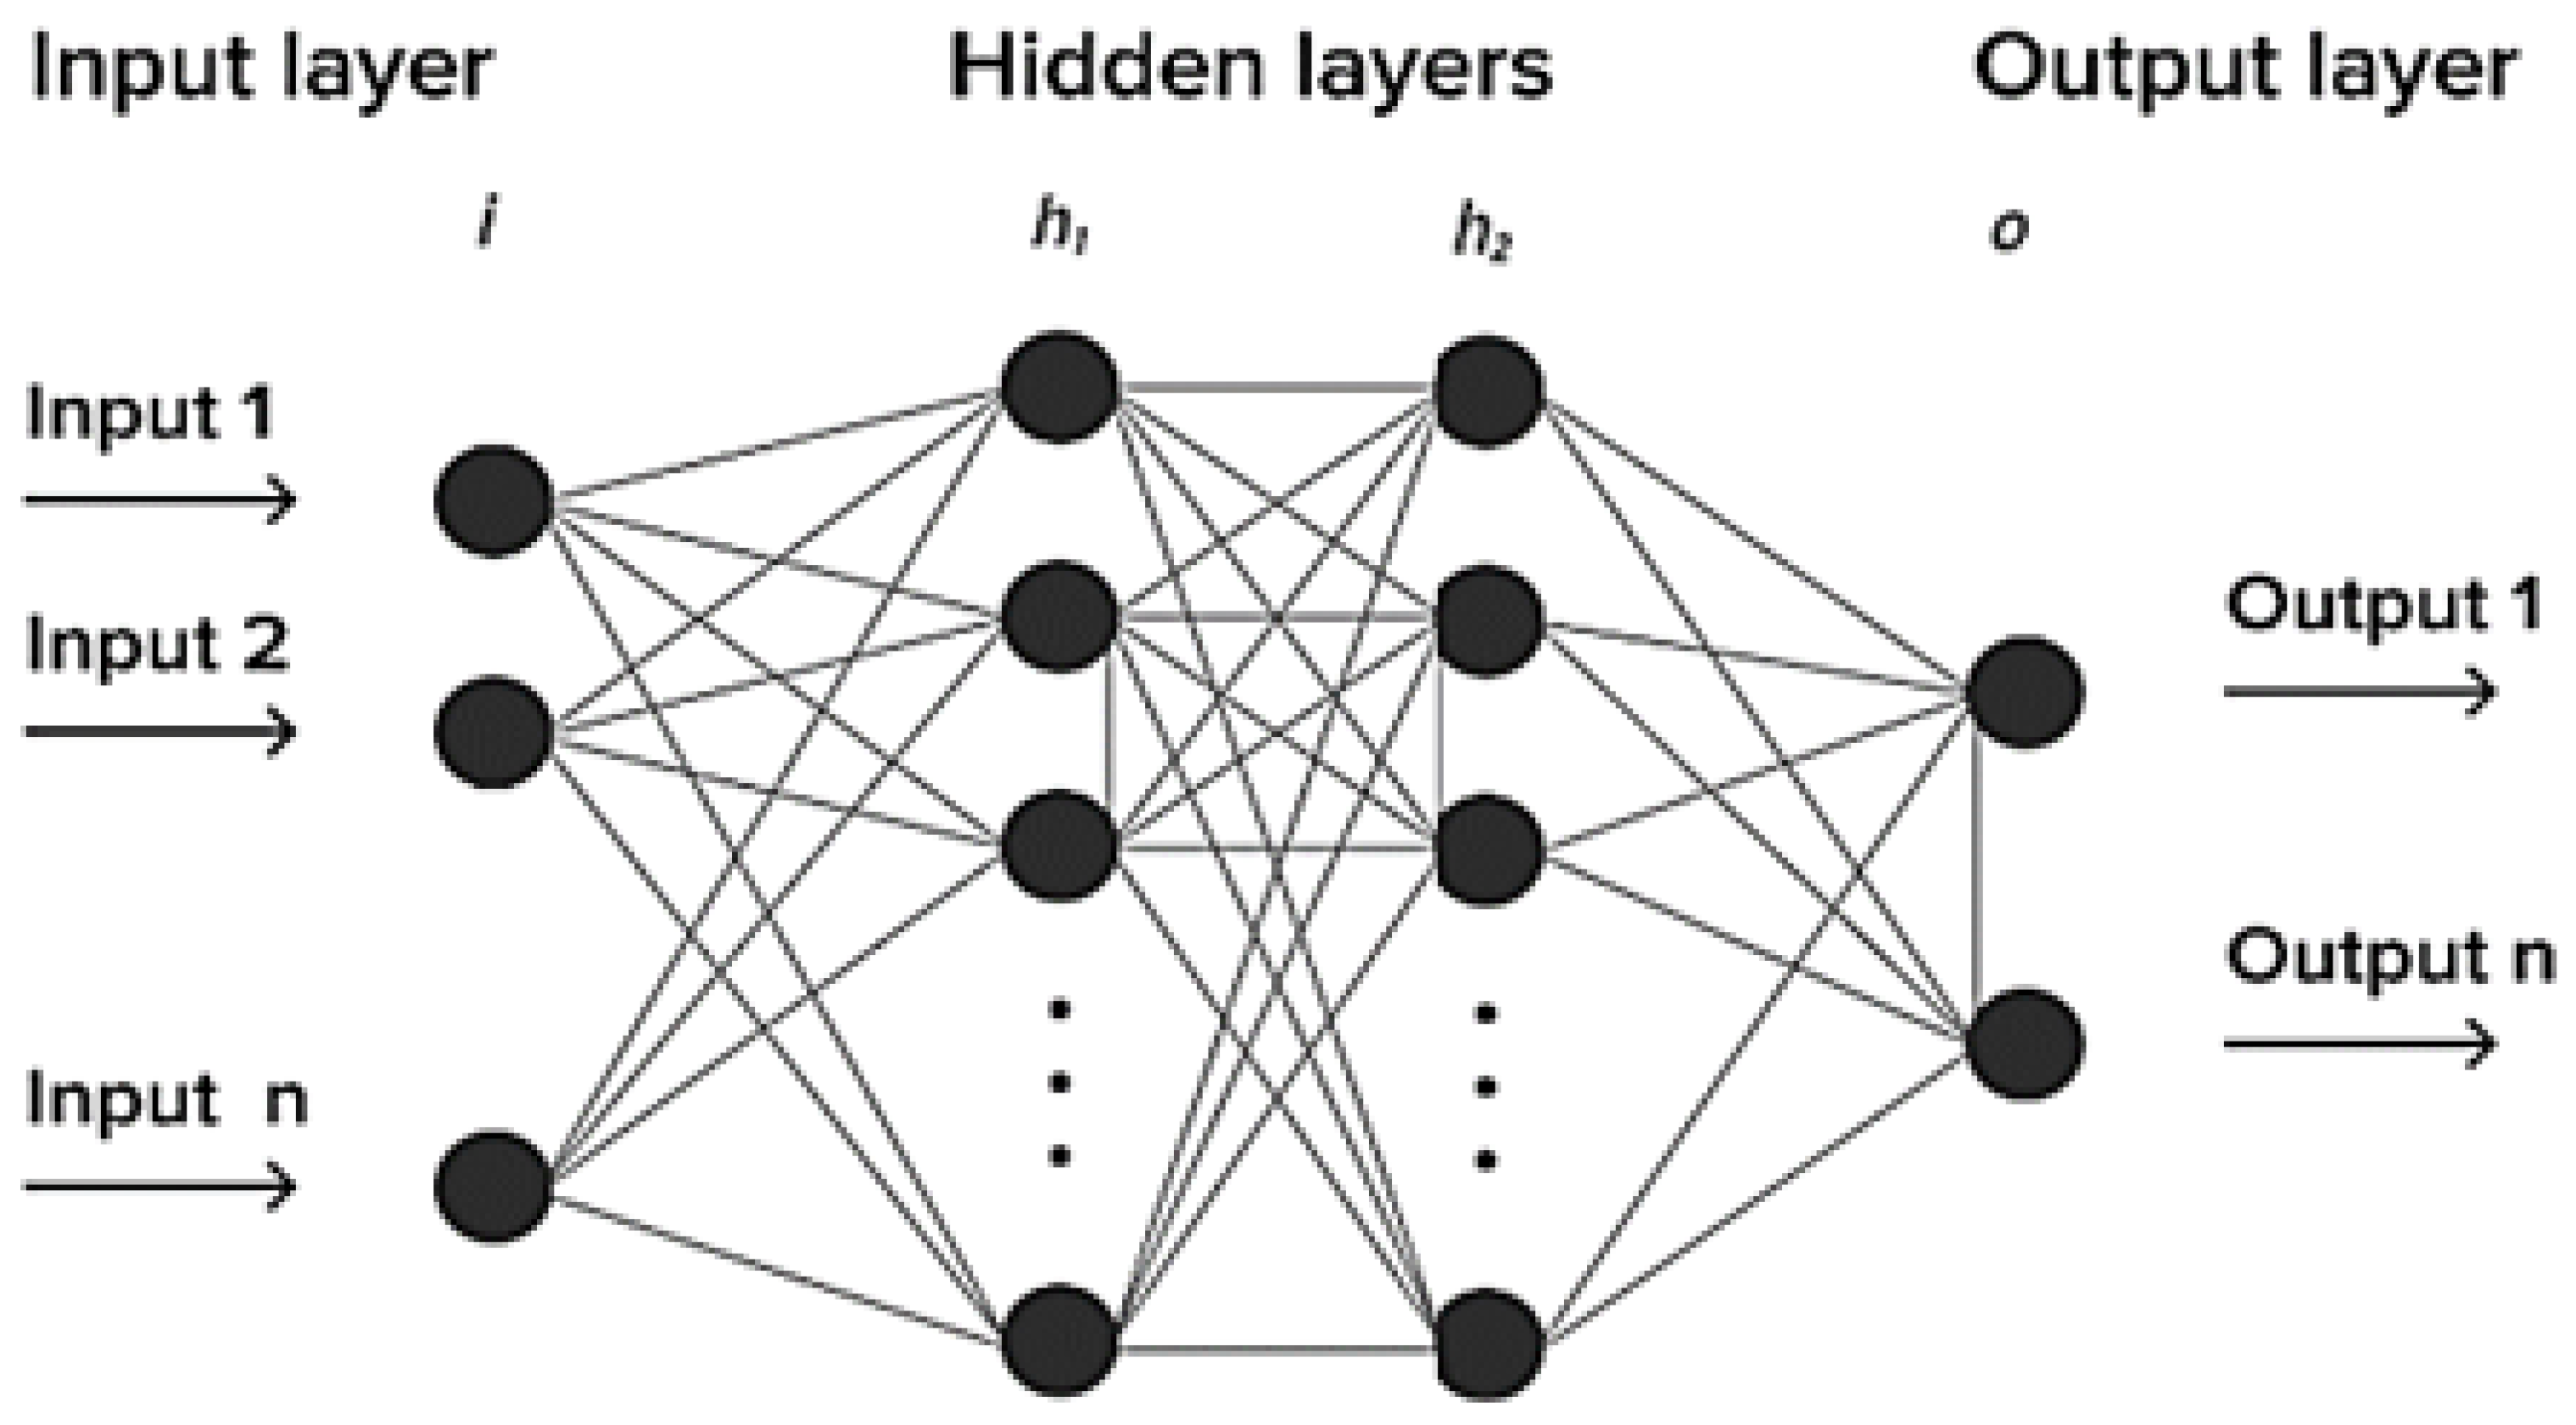
Given the complexity and nonlinear relationships between soil attributes and crop types, the study employed a neural network, a subset of machine learning models, that are adept at capturing intricate patterns and dependencies in the data. The employed neural network architecture consists of three layers: an input layer, two hidden layers, and an output layer, as shown in
Figure 7.
The input layer serves as a placeholder for input data to the model. The study experimented with multiple architectures, adjusting the number of hidden layers and nodes within each layer to optimize performance. Based on the empirical analysis, the study found the consideration of two hidden layers with 64 and 32 neurons, respectively. The output layer contains nodes corresponding to the number of unique crop types in the dataset. The activation function used here is typically the SoftMax function, which provides a probability distribution over the potential crop types. The model was trained using backpropagation, a standard method for training neural networks. This involves iteratively adjusting the model weights to minimize the difference between the predicted output and the actual target values. The training process of the neural network is discussed in Algorithm 2.
| Algorithm 2 Neural Network Model For Crop Recommendation |
Input: Training data (N,P,K,pH) labels (crop),
Number of predictors , Number of unique crop classes ,
Learning rate , Number of epochs e, Batch size s, Adam
hyperparameters , ,
Output: Trained Neural network model
Procedure:
1. Initialization:
Define input layer with
2. Initialize first hidden layer 64 with weights and biases ∈
3. Initialize first hidden layer 64 with weights and
4. Training: For epoch = 1 to e:
5. Shuffle the training data.
6. Divide and into batches of size s
For each batch:
Compute: and
Compute: and
Compute: and
Compute Loss L
Compute gradient of loss w.r.t. final output
compute: =
Using chain rule and considering ReLU derivatives:
// where g’ is the ReLU derivative
Update learnable parameters W and b using Adam optimizer with learning rate
7. Validate the model using testing dataset
End |
The input layer has ‘n’ neurons, corresponding to the number of predictors. Mathematically, this can be represented as being the input vector, where . The first hidden layer has 64 neurons, such that is the weight matrix connecting the input layer to the first hidden layer, and is the bias vector for the first hidden layer. The weighted sum of the first hidden layer is . The ReLU activation function is applied element-wise to the weighted sum, , where . The second hidden layer has 32 neurons, such that is the weight matrix connecting the first hidden layer to the second hidden layer, and is the bias vector for the second hidden layer. The weighted sum of the second hidden layer is . The ReLU activation function is applied element-wise to the weighted sum , where . The next output layer has k neurons, representing the number of unique crop classes, such that is the weight matrix connecting the second hidden layer to the output layer, and is the bias vector for the output layer. The weighted sum of the output layer can be calculated, . Here, the softmax activation function is applied to the weighted sum to obtain the final output probabilities for each class.
The model is compiled using the Adam optimizer with a learning rate of 0.0001. The loss function employed is the sparse categorical cross-entropy. The model is trained using the fit( ) method, which takes in the training data. The training data are split into a training subset and a validation subset. In this case, 20% of the training data are used for validation during training. The model is trained for 200 epochs. The training dataset is divided into batches, and in each iteration, the model updates its weights and biases based on the gradients calculated from a batch of size 64. The weight and bias updates are performed using the backpropagation algorithm and the Adam optimizer. The algorithm is responsible for training the neural network optimally for crop recommendation by learning latent attributes and complex patterns of the data points from the training dataset.
3.4. Fertilizer Recommendation System
A fertilizer recommendation system is a specialized tool aimed at aiding farmers in making informed decisions about the suitable amounts of fertilizers to use for their crops. This system aims to increase agricultural productivity while minimizing adverse environmental impacts. Many farmers might not have a comprehensive understanding of their soil’s current nutrient levels. Without soil testing, it is challenging to know which nutrients are deficient, which are abundant, and which are at optimum levels. The cost of professional soil testing is prohibitive for many small-scale farmers, especially in developing countries. Even where affordable tests are available, the infrastructure to understand and act on the results might be lacking.
This study proposes a rule-based fertilizer recommendation system to guide farmers on the most beneficial types and amounts of fertilizers for specific crops. The system’s foundation is rooted in the well-established scientific principles of soil chemistry and plant biology. Recognizing that different crops have varied nutrient requirements and that these needs are influenced by soil pH, the system seeks to bridge the knowledge gap by providing specific fertilizer recommendations based on these factors. The fertilizer recommendation system considers various parameters such as soil quality determined based on pH level, crop type, and specific nutrient requirements of each crop. By analyzing these factors, the system provides recommendations for the optimal amounts of N, P, and K, the primary nutrients needed by crops. It is to be noted that soil pH is a crucial parameter because it affects the solubility of nutrients, which has a high impact on plant growth. A pH of 7 is considered neutral, while anything below 7 is acidic and anything above is alkaline. The soil’s pH can influence the crop’s health, yield, and disease resistance. Different crops prefer different pH ranges. The study first builds a lookup table for determining soil qualities using their pH measure, as shown in
Table 2.
The proposed system considers the values of pH and associated quality indicator as the primary input source to the rule-based system, in which a set of logical conditions are established. The study further focuses on the building reference database consisting of recommended ranges of fertilizer (N, P, K) and suitable pH for different crops. A sample visualization of recommended fertilizers and pH for the crops under consideration is shown in
Table 3.
Table 3 provides the data needed to build fertilizer recommendations. The first step is to conduct a comprehensive soil analysis. Different crop types have different nutrient needs, so it is essential to understand each crop’s specific N-P-K requirements at different growth stages. Using expert knowledge and proven scientific data, the system establishes rules to ensure reliable recommendations. The system then cross-references the user’s input with fertilizer data to determine if the soil pH falls within the acceptable range for the chosen crop. If the soil pH is within the acceptable range, the system recommends the optimal amounts of N, P, and K based on the nutrient needs specified in the fertilizer table. If the soil pH is not within the acceptable range, the system advises the user to adjust the soil pH and suggests potential soil amendments. The system also offers alternative crops that could thrive in the existing soil pH range, along with the N, P, and K fertilizer recommendations for those crops. This approach allows the system to make precise and comprehensive fertilizer recommendations without requiring the explicit training of a predictive model on a dataset. The rationale behind this method is the universal nature of the recommended nutrient values for each crop type, thus providing a straightforward measure of the required fertilizer based on the difference between the current and recommended N, P, and K values. The utility of this rule-based approach lies in its ability to provide transparency and personalized fertilizer recommendations.
The proposed system can also reduce farmers’ costs by precluding the overuse or underuse of fertilizers. An additional environmental advantage of this system is its potential to minimize the detrimental impact of excessive fertilizer usage, such as water pollution caused by fertilizer runoff. Finally, the system equips farmers with the information needed to make informed decisions about crop rotation based on soil’s pH suitability for various crops.
The system starts by receiving user inputs on the crop type and the soil’s pH value. It then cross-references this with a precompiled fertilizer table containing the ideal pH ranges and nutrient (N, P, K) requirements for various crops. Depending on the pH level input, the system first classifies the soil into categories ranging from “Strongly acidic” to “Very strongly alkaline”. It then checks if the input pH falls within the appropriate range for the chosen crop. If the pH level is suitable, the system provides fertilizer recommendations specific to the crop, considering the nutrient needs from the fertilizer table. The recommendations regarding the required amounts of N, P, and K are given. If the soil pH is not right for the chosen crop, the system will tell you how to adjust it to the correct range. It will also suggest ways to improve the pH using soil amendments. In addition, the system will list alternative crops that could grow well in the current soil pH range. It will also provide N, P, and K fertilizer recommendations for each of these crops.
4. Result and Discussion
The development of the proposed recommendation models is carried out using python programming language in Anaconda distribution installed on windows 10 machine.This section presents the performance analysis of the proposed predictive model for crop recommendation. The accuracy of the predictions was assessed using various metrics, such as accuracy, precision, recall, F1-score, and the ROC curve. These metrics provide a comprehensive view of the model’s performance, ensuring that the recommendations it provides are both precise and reliable. The performance metric accuracy is the proportion of the total number of predictions that were correct. It is given as follows:
where
TP denotes True Positives,
TN is the True Negative,
FP is False Positives, and
FN refers to False Negatives.
Precision is the proportion of positive identifications that were actually correct. It is computed as follows:
Recall (or Sensitivity) is the ability of a model to find all the relevant cases within a dataset. The recall is given by:
F1 Score is the harmonic mean of precision and recall, aiming to find a balance between both. The formula for computing
F1 Score is given as follows:
4.1. Training Performance Analysis
The training phase of a machine learning model is crucial because it determines how well the model learns the patterns in the training data. The training accuracy is a measure of how well the model can predict the labels of the training data. If a model has poor training accuracy, it indicates that there may be problems with the dataset, the model architecture, or the hyperparameters. Training accuracy is also an important metric for ensuring that the model generalizes well, meaning that it can make accurate predictions on new data that it has not seen before. This is because a model with high training accuracy following high validation accuracy has learned the underlying patterns in the data, not just the specific examples in the training set.
Figure 8 shows the training performance of a neural network over 200 epochs.
From
Figure 8, the training accuracy reaches up to 99%, indicating that the model has learned the underlying patterns in the training data very well. However, it is worth noting that a training accuracy of 100% is not always desirable, as it can lead to overfitting, where the model becomes too specific to the training data and performs poorly on unseen data. Therefore, the study considers validation of the model during the training processes. It can be seen that the validation accuracy reaches up to 95%, which is slightly lower than the training accuracy. This can be due to the fact that the model may have overfit to the training data or that the validation set may have some variability that the model could not capture. However, a validation accuracy of 95% is still a good level of accuracy, indicating that the model can generalize well to new, unseen data. Overall, the high training and validation accuracy suggest that the model is a good fit for the data and has the potential to make accurate predictions.
4.2. Model Performance on Test Data
This section evaluates the performance of the model on the test dataset for crop recommendations. The metrics considered for this analysis are precision, recall, and F1-score across different crop classes and overall accuracy, as shown in
Table 4. The support column indicates the sample size for each class, offering context to the reported statistical outcomes.
As shown in
Table 4, for class 0, the model correctly predicted this class with 100% precision, meaning that every time the model predicted class 0, it was correct. The re-call of 80% indicates that the model was able to identify 80% of the actual instances of class 0 in the data. The F1-score, which is the harmonic mean of precision and recall, is 0.89. There were 25 instances of class 0 in the test set. Additionally, the model performed very well on Class 1, with a precision and recall of 1.00 and 0.98, respectively. This means that the model correctly identified 98% of the Class 1 instances, and none of the predictions were false positives. The F1-score of 0.99 for Class 1 indicates a strong balance between precision and recall. The model’s performance on Class 2 was slightly lower, with a precision of 0.90 and recall of 0.95. This means that the model correctly identified 95% of the Class 2 instances, but there were some false positives. The F1-score of 0.93 for Class 2 still indicates a good balance between precision and recall.
The model performed perfectly on Classes 3, 4, and 6, achieving a precision, recall, and F1-score of 1.00 for all three classes. However, it is important to note that these classes were very underrepresented in the dataset, with only 20 instances for Class 3, 4 instances for Class 4, and 1 instance for Class 6. This means that the model’s perfect performance on these classes may be due to their simpler nature or distinctive features, which made them easier to distinguish. Class 5 was also well-represented in the dataset, with 557 instances. The model performed very well on this class, with a precision and recall of 0.99. This means that the model correctly identified 99% of Class 5 instances and made very few false positives. Class 7 was the only class where the model’s performance was not as good. The model had a precision of 0.84 and recall of 0.74, meaning that it correctly identified 74% of Class 7 instances and made 16% false positives. The F1-score of 0.78 indicates that there was a moderate balance between precision and recall for this class. Class 8 was the largest class in the dataset, with 543 instances. The model performed very well on this class, with a precision, recall, and F1-score of 0.99. This means that the model correctly identified 99% of Class 8 instances and made very few false positives.
The Receiver Operating Characteristic (ROC) score is a widely used metric to evaluate the performance of classification models.Based on the outcome statistics shown in
Figure 9, the Receiver Operating Characteristic (ROC) score, which measures a trade-off be-tween the True Positive Rate (sensitivity) and False Positive Rate (specificity). The ROC score ranges from 0 to 1, where a score of 1 denotes a perfect classifier, and a score of 0.5 indicates a model that is no better than random chance.
The study also considers a comparison of the performance of the proposed neural network model with other different supervised classifiers as crucial in determining its suitability for specific tasks. A comparative analysis was conducted in
Figure 10 to assess the proficiency of the proposed neural network and three other different models, namely, SVM (Support Vector Machines), Decision Tree, and XGBoost. The evaluation considered three vital metrics—weight precision, recall, and F1-Score—to gauge the performance nuances of each model. Based on the outcome analysis, the proposed neural network model outperformed all other models, including SVM, Decision Tree, and XGBoost, in a comparative evaluation. The neural network achieved a precision of 99.18%, while XGBoost came in second with a precision of 97.36%. The Decision Tree performed similarly to XGBoost, with a precision of 97.36%. SVM performed the worst, with a precision of 93.93%. This analysis shows that the neural network model is exceptionally capable of accurately identifying correct classifications. The proposed neural network model has a high recall of 98.66%, which means that it can accurately identify a large portion of the actual positive examples in the dataset. XGBoost is also effective, but its recall is slightly lower at 97.03%.
The F1-score, which measures the balance between precision and recall, is even higher for the neural network model at 98.98%. XGBoost is a close second with 97.17%, followed by the Decision Tree with 96.87%. Based on the comprehensive evaluation, the proposed neural network model distinctly outperforms the other models. Its consistently high scores across all metrics not only underline its accuracy in predictions but also its capacity to maintain a balance between precision and recall.
4.3. Real-World Testing
This section discusses how we deployed and tested our crop recommendation system in real time and the results we obtained when using it with live data. The most important part of evaluating our system is the data it uses. For this study, we collected data from a set of IoT sensors (Five-pin soil transmitter (Type485) sensors, Shandong Renke Control Technology Co. Ltd., Jinan City, Shandong Province, China), that we strategically deployed across agricultural fields, as shown in
Figure 11. The solar panels capture sunlight, convert it to electricity, and then tranfer that electricity to a battery. The battery powers a printed circuit board (PCB), which provides electrical connection and mechanical support to the electrical components of a circuit (sensor, GSM, microcontroller). The transmitter steel needle (sensor) was inserted horizontally into the soil in a pit that was dug with a diameter of >20 cm vertically to detect soil properties, which are transmitted to the cloud using GSM sim 900,and a microcontroller was integrated into a system to manage the device function.
Figure 11a shows a visual representation of the IoT soil sensor, battery, and solar as a power source.
Figure 11b shows sensors were meticulously positioned within croplands, silently working to gather valuable agronomic data.
Figure 11c showcases an IoT sensor, equipped with solar panels, ready for data collection. The IoT sensors measure N, P, and K in parts per million (ppm), which is a common unit used in soil testing. In this case, ppm represents absolute concentrations, not percentages. Therefore, the study converted the raw data from the IoT sensors from ppm to kg/ha before feeding it to the trained model for the proposed crop recommendation system. The conversion between the two depends on the depth of soil sampled and its bulk density. To convert from ppm to kg/ha, the study followed the standard convention that 1 ppm is equivalent to 1 mg/kg. So, if we had a reading of 50 ppm N, that means there are 50 mg of nitrogen per kg of soil. Hence, in a hectare, we have 50 mg/kg × 2,600,000 kg = 130,000,000 mg of nitrogen, which is 130 kg of nitrogen. The study converted all of the data collected by the IoT sensor node in real time from ppm to kg/ha in this manner. The transformed data were then fed to the trained model for the proposed crop recommendation system. The results of the study were promising, justifying the scope of the proposed work. This suggests that the proposed crop recommendation system can be used to accurately recommend crops for farmers based on the real-time data collected from IoT sensors.
4.4. Scope and Limitations
The proposed crop recommendation and rule-based fertilizer system holds immense promise, with a wide scope and diverse applicability. By soil data attributes and machine learning algorithms, it considers N, P, K, and soil quality pH, which are crucial for crop growth based on soil conditions. A balanced pH ensures optimal nutrient uptake, promoting healthy crop growth. By ensuring that these core parameters are in their ideal ranges, a significant portion of crop health following fertilizer recommendation yield optimization is addressed. By factoring in these vital soil attributes, the system ensures a tailored approach to crop cultivation, rooted in the specific conditions and needs of the soil. By focusing on these four key parameters, the study reduces the complexities often associated with integrating multiple environmental factors. While environmental factors such as rainfall and temperature can vary significantly across regions and seasons, the importance of N, P, K, and pH remains consistent for crop growth globally. This gives the proposed system a universal applicability, making it relevant across diverse geographical areas. However, despite the advantages of proposed system, it has limitations too when considering the implementation at a large scale in the agriculture sector. The potential challenges and limitations are highlighted as follows.
Data Generalization: The system is based on specific soil properties, such as N, P, K, and pH. However, when scaled up, these properties can vary widely across different regions, which could limit the accuracy of the recommendations. Additionally, it is difficult to create a comprehensive dataset that includes all possible soil, crop, environmental, and geographic conditions. Inaccuracies can also arise from inconsistent or incomplete data.
Exclusion of Environmental Factors: The model does not consider factors such as rainfall, humidity, and temperature. While N, P, K, and pH are important, the absence of these environmental variables may not provide a complete view of what is needed for all regions.
Infrastructure Challenges: Large-scale implementation may require extensive infrastructure, including IoT sensors, data transmission systems, and more.
Maintenance and Updation: The model will need to be updated regularly as soil conditions, crop varieties, and farming practices change. This will be challenging on a large scale.
Economic Implications: While the system might reduce some costs, the initial setup, training, and maintenance can be economically taxing for small-scale farmers or in regions with limited funding.
Rule-Based Fertilization Challenges: For rule-based fertilization recommendation models, the fixed set of rules might not adapt quickly to changing conditions. It can also become complex to update the rules for too many crops. If there are too many rules, it can potentially lead to contradictions.
4.5. Use Case Scenario and Conceptual Architecture of IoT Farm
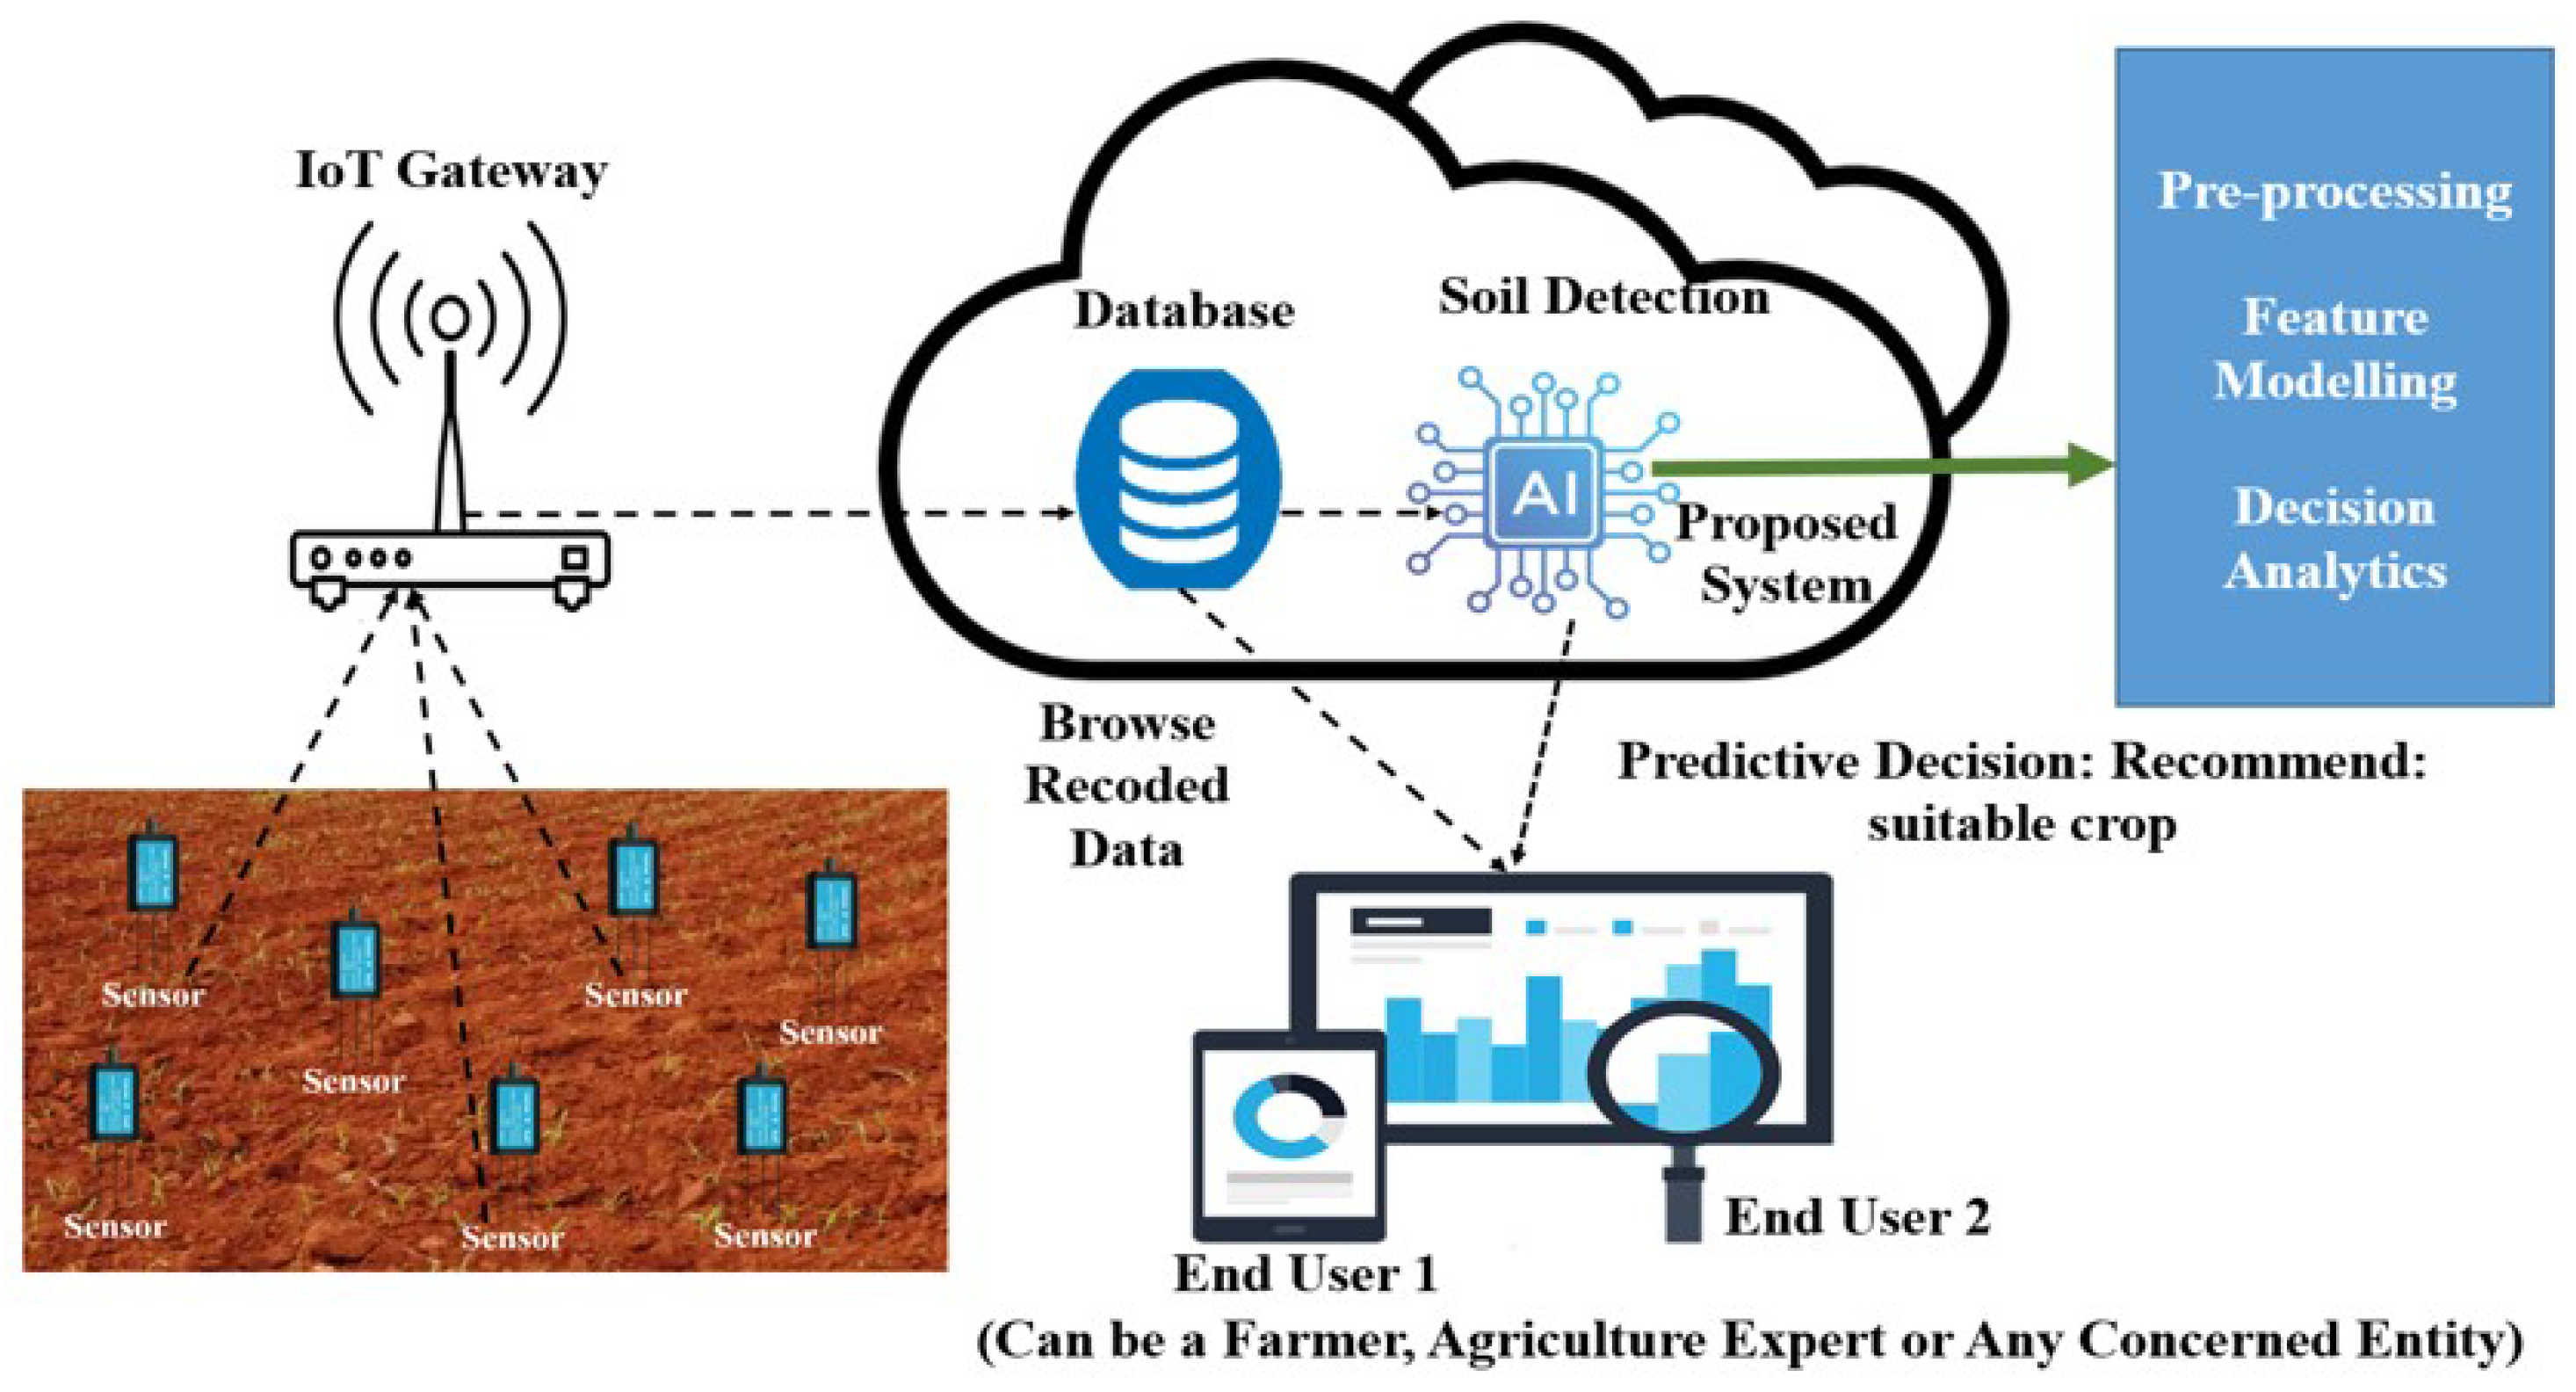
Figure 12 shows sensors that are deployed in cropland to monitor and collect detailed data on soil nutrient levels (nitrogen, phosphorus, and potassium), as well as other important parameters. The IoT gateway connects the sensors to the cloud and securely and quickly transfers the data to a cloud database. This robust and scalable storage solution archives the collected data. Being cloud-based, it ensures that the data are accessible, redundant, and secure. The proposed system is deployed over the cloud and leverages the power of machine learning to analyze the real-time data using predictive algorithms to generate two key outputs: crop recommendations and fertilizer recommendations. The user can access both the real-time monitoring data and the generated recommendations through a tailored interface, enabling informed decision-making. Therefore, the proposed system’s conceptual architecture showcases an end-to-end solution, from data collection in croplands to actionable insights delivered to the user. This synergy ensures that farmers are equipped with the best tools and information to drive productivity and sustainability in their work.

 ,
, 


