

The Impact of Agricultural Global Value Chain Participation on Agricultural Total Factor Productivity

1
Institute of Agricultural Economics and Development, Chinese Academy of Agricultural Sciences, Beijing 100081, China
2
School of Economics, Sichuan University, Chengdu 610065, China
*
Author to whom correspondence should be addressed.
Agriculture 2023, 13(11), 2151; https://doi.org/10.3390/agriculture13112151
Submission received: 17 October 2023
/
Revised: 8 November 2023
/
Accepted: 13 November 2023
/
Published: 15 November 2023
(This article belongs to the Special Issue Agricultural Markets and Agrifood Supply Chains)
Abstract
:Under the condition of opening up, participation in international specialization and global value chains (GVCs) has become the main source for more and more countries to obtain foreign resources and advanced technologies, thereby promoting productivity improvement and technological progress. What are the pathways of agricultural GVC participation that affect agricultural total factor productivity (TFP)? Is the impact of agricultural GVC participation on agricultural TFP consistent across different statuses and modes of agricultural GVC participation? This paper elaborates on the theoretical mechanism of agricultural GVC participation affecting agricultural TFP, and then empirically estimates the impact of different statuses and modes of agricultural GVC participation on agricultural TFP by taking 58 countries as examples. The results show that agricultural GVCs affect agricultural TFP by several direct and indirect pathways. There was a U-shaped relationship between agricultural GVC participation and agricultural TFP, which means that after crossing a certain threshold, the former has a positive impact on the latter. By participating in agricultural GVCs, agricultural TFP in high-income and upper-middle-income countries was significantly improved, while in lower-middle-income countries it was not. Both forward and backward agricultural GVC participation were conducive to improving agricultural TFP in high-income and upper-middle-income countries, but only backward agricultural GVC participation was conducive to improving agricultural TFP in lower-middle-income countries. Therefore, every country needs to actively explore its optimal pathway to participate in agricultural GVCs in order to maximize the participation benefits and promote the improvement in agricultural TFP, simultaneously.
1. Introduction
With the continuous advancement of the process of global economic integration, almost all countries have joined the global system of production specialization, resource allocation, and benefit distribution. In order to make full use of global resources, the production process from raw materials to final products has been divided and located in different countries and regions, and in different links of industrial chains; the value of the product is added and intermediary products are traded in turn, ultimately forming global value chains (GVCs) [1,2]. Driven by market competition and technological progress, traditional agriculture is gradually transforming into modern agriculture, and agricultural GVCs are becoming an important part of the global trade system, affecting trade policies and trade gains [1,2,3,4]. When the agricultural sector has relatively low importance and share in GVCs, agricultural trading countries are faced with the difficult choice of maintaining their present status in global agricultural trade or continuing to strengthen their participation in agricultural GVCs [5].
The international trade pattern under GVCs has shifted from trade in goods to trade in intermediate products, and the products exported by one country or region contain the added value from many other countries or regions [6], which makes the traditional statistical methods based on the gross value of traded goods unable to truly reflect the pattern of global trade, and also misleads and distorts the analysis and judgment of the evolution of trade [7]. In order to overcome these shortcomings of traditional statistical methods, the Organization for Economic Co-operation and Development (OECD) and World Trade Organization (WTO) have put forward the concept of “value added in trade” and adopted a new accounting system of value-added trade, which is conducive to revealing the true scale of trade and trade gains [8,9], and based on which, the Trade in Value Added (OECD–TiVA) database was jointly launched by the OECD and WTO on 16 January 2013.
With the continuous extension and expansion of international specialization in agriculture in horizontal and vertical dimensions, a global agricultural production network dominated by multinational corporations (MNCs) has basically formed. Relying on technological advantages, developed countries occupied the core links of agricultural GVCs, dominated the formation and operation of agricultural GVCs, and improved their level of agricultural specialization and productivity [10]. As an important emerging force participating in agricultural GVCs, developing countries have also joined agricultural GVCs, relying on the advantages of sufficient labor and low cost [11]. Compared with developed economies, developing countries have a relatively low status in agricultural GVCs, mainly reflected in the high participation in low value-added links and low participation in high value-added links, and the “low-end lock-in” phenomenon of agricultural export is very common in most developing countries [12,13]. In the long run, agriculture in developing countries is falling into a “low-end dilemma”, resulting in the agricultural technological innovation and progress capacity of developing countries being significantly weaker than that of developed countries [14].
In recent years, the impact of GVC participation on total factor productivity (TFP) has attracted academic attention. First, the impact direction of GVC participation in TFP is uncertain. Some of the existing literature has found that GVC participation has a promoting effect on TFP. Taking China as an example, the higher the international specialization status in GVCs of China’s manufacturing industry, the higher the TFP at the firm level [15], and the productivity effects of Chinese enterprises in outsourcing and participating in vertical specialization are positive [16,17]. Some of the other existing literature has found that GVC participation hindered the improvement in TFP. Due to the existence of gaps in the technological frontier and innovation system between different countries, MNCs in developed countries at the core of GVCs have often used tactics such as low-end lock-in to impede industrial upgrading, technological advancement, and improvement in TFP in developing countries [18]. As the promotion and inhibition effects of GVC participation in TFP are trade-offs and interactions, there may also be a nonlinear relationship between GVC participation and TFP [19], and in most examples, the inverted U-shaped relationship was verified [20,21,22]. But the impact of GVC participation in China’s equipment manufacturing on TFP has shown a U-shaped relationship [23]. Second, GVC participation affects TFP through multiple pathways. GVC participation can fully realize economies of scale in each production link by minimizing production costs, while different industries form industrial agglomerations to realize external economies of scale effects [24,25]. GVC participation is conducive to reducing the costs related to operation and management by importing cheaper and more diverse intermediate goods [26], and strengthening information exchange and technology exchange between upstream and downstream enterprises, thereby promoting technology transfer and spillover and technological progress in GVC participants [27]. In addition, GVC participation makes enterprises face more intense international market competition, and in order to compete for living space, enterprises are forced to improve productivity to cope with international competition [22,28]. Third, the impact of GVC participation on TFP is heterogeneous. The impact of GVC participation on TFP mainly depends on the technology-absorptive capacity of GVC participants and their status in GVCs [29]. In terms of enterprise type, the promotion effect of GVC participation on TFP is significant in capital-intensive, technology-intensive, and general trading enterprises [30], but not in processing trade and labor-intensive enterprises [31]. In terms of economic development level, by increasing participation status in GVCs, TFP has been significantly improved in developed countries, but not in less developed and developing countries [25,32]. In terms of GVC participation mode, forward GVC participation has a significant positive effect on TFP, but the impact of backward GVC participation on TFP is uncertain [33,34].
Despite their contributions, the existing studies on the impact of GVC participation on TFP are still insufficient. First, the existing studies that empirically estimated the impact of GVC participation on TFP were mainly carried out from the macro-level of industries and the micro-level of enterprises, but the conclusions of these studies were inconsistent, due to different variables, research samples, and estimation methods, as well as the heterogeneity of GVC participation modes, GVC participation status, and the economic development level of GVC participants. Second, in the existing studies, there is little systematic discussion on the theoretical mechanisms by which GVC participation affects TFP. Third, the existing studies have mainly focused on the manufacturing sector and service sector, but rarely on the agricultural sector.
Therefore, this study aims to qualitatively elaborate the theoretical framework of agricultural GVC participation affecting agricultural TFP and quantitatively estimate the impact of agricultural GVC participation on agricultural TFP. This study explores the following questions: (1) What are the pathways of agricultural GVC participation that affect agricultural TFP? (2) Is the impact of agricultural GVC participation on agricultural TFP consistent across different statuses and modes of agricultural GVC participation?
This study contributes to the existing research in two ways. First, from the perspective of the agricultural sector, the impact pathways of agricultural GVC participation affecting agricultural TFP were explored from multiple dimensions and four corresponding research hypotheses were proposed, which enrich and expand the research vision and application scenarios of the GVC theory. Second, by taking 58 countries as research samples, this study clarified the impact of agricultural GVC participation on agricultural TFP and its heterogeneity. Our research findings identify the types of countries that can benefit from different modes of agricultural GVC participation, contribute to a better understanding and harnessing of the role of trade in enabling the development of sustainable agriculture and the transformation of agri-food systems, and provide feasible implications for countries with different income levels, especially lower-middle-income countries, to further improve agricultural TFP by improving their status in agricultural GVCs and avoid the “low-end dilemma”.
2. Theoretical Framework and Research Hypotheses
2.1. The Direct Impact Pathways of Agricultural GVC Participation on Agricultural TFP
As a new type of international specialization, GVCs enable the specialization object to be refined from the level of products to the level of production links [35] and achieve the continuous optimization of the production process by dividing the production links and placing them in different countries or regions. The specialization of countries in production chains of agricultural products in which they have comparative advantages can promote the formation of more mature production processes, more efficient organizational forms, and more skilled labor productivity, reduce production and trade costs, and improve production efficiency and export performance [36,37], which in turn promotes higher agricultural TFP [38]. By participating in GVCs, a country can expand the scope of trade in agricultural services and agricultural product demand and market size, reduce transaction costs, and prompt producers to further expand production scale and realize economies of scale [39,40]; moreover, it is also easier to obtain information resources and improve risk resistance, which in turn improve agricultural TFP. Agricultural GVC participation is also conducive to the formation of agricultural industrial agglomeration, which not only generates external economies of scale, such as knowledge spillover and information sharing and promotes enterprise innovation [41], but also improves the efficiency of the use of inputs including agricultural infrastructure and machinery [42], which in turn realizes more effective economies of scale and improves agricultural TFP. By participating in agricultural GVCs, an enterprise is exposed to bigger competitive pressures from the international market. Consumer demand for high-quality and fierce competition in the international market force exporting enterprises to do their best to increase productivity in order to gain broader room for survival, forcing enterprises to increase investment in R&D, upgrade machinery and equipment, and improve management and product quality [28]. At the same time, the massive influx of similar agricultural products and intermediate goods from abroad to expand market share through high-quality products, high-profile brands, and advanced technologies has intensified market competition and forced domestic enterprises to improve production efficiency and lower product prices so that agricultural producers could obtain high-quality and diversified intermediate inputs, save production costs, have more sufficient funds for R&D investment and personnel training, and improve agricultural TFP [43,44].
Therefore, as shown in Figure 1, this study proposes the first research hypothesis (H1):
H1.
Agricultural GVC participation is conducive to improving agricultural TFP in participating countries through production specialization effects, production scale effects, and market competition effects.
2.2. The Indirect Impact Pathways of Agricultural GVC Participation on Agricultural TFP
The new trade theory has proposed that foreign trade and foreign direct investment (FDI) are the two major channels for achieving technology spillovers [45,46]. In agricultural GVCs, foreign trade exists in two pathways: exporting agricultural products and intermediate goods, also called forward agricultural GVC participation, and importing agricultural products and intermediate inputs for domestic production of exported products, also called backward agricultural GVC participation. By using the former pathway, exporting countries are usually required to carry out standardized production, so they have to actively learn advanced technologies and management systems, and then achieve technology spillovers through the “learning effects” of agricultural GVCs and improve agricultural TFP [47]. Importing countries also export technologies and knowledge to exporting countries through agricultural GVCs to satisfy their requirements for production refinement and standardization, thus indirectly achieving technology spillovers. Active technology learning and passive knowledge introduction could promote the diffusion of technology and knowledge to the agricultural and associated sectors in exporting countries [48]. By using the latter pathway, during the importing process, advanced marketing concepts and means and production technology are attached to intermediate products to form technological spillovers, and importing countries use advanced marketing concepts and means and production technology attached to imported intermediate goods to imitate, digest, innovate, and promote domestic technological innovation [49,50] and improvement in agricultural TFP.
In agricultural GVCs, as a major channel for achieving technology spillovers, FDI has an important impact on TFP in home and host countries [51,52]. When making investments and setting up factories in host countries, to ensure the effective implementation of standardized management and operation, MNCs accelerate the dissemination of intangible knowledge and technology through formal or informal interpersonal interactions and training demonstrations and then trigger technological spillover to local enterprises in host countries [53,54]. By learning spilled technologies and knowledge, local enterprises could improve domestic human capital and technical level, which in turn improve agricultural TFP in host countries. While technology spillovers are achieved through investment in host countries, MNCs also obtain reverse technology spillovers from host countries through R&D interaction, transfer of results, and internal absorption [55], which also improve agricultural TFP in home countries [56,57]. Technologically lagging countries or enterprises might also enter foreign markets in the form of FDI and obtain technological spillovers through geographic proximity to technologically leading countries or enterprises [58], thus improving agricultural TFP [59,60].
Therefore, as shown in Figure 1, this study proposes the second research hypothesis (H2):
H2.
Agricultural GVC participation is conducive to improving agricultural TFP in participating countries through technology spillover effects.
In GVCs, various resources flow across borders and participate in international production specialization through outward FDI and international outsourcing, and then achieve the optimal resource allocation globally [61], which in turn improves TFP. The process of participating in agricultural GVCs is also the process of participating in the optimal allocation of domestic agricultural resource endowment globally. By participating in agricultural GVCs and actively undertaking agricultural outsourcing business, participating countries make full use of their large amount of agricultural surplus labor and backward agricultural facilities so that their agricultural factors are optimally reallocated, and then agricultural TFP is improved [62]. With the continuous extension of agricultural GVCs, the mobility of agricultural factors is enhanced, and domestic agricultural factors of each country have more opportunities for synergistic allocation with foreign advantageous agricultural factors [63]. Resource reallocation at the global level enables agricultural production activities that could not be carried out in some countries due to the lack of certain agricultural factors and also attracts domestic agricultural factors to flow to more efficient agricultural production links, which achieves the matching and integration of domestic and foreign agricultural factors and improves the allocation efficiency of domestic agricultural factors by externalization, and finally, agricultural TFP is improved.
Therefore, as shown in Figure 1, this study proposes the third research hypothesis (H3):
H3.
Agricultural GVC participation is conducive to improving agricultural TFP in participating countries through resource allocation effects.
There might be some difference in the impact of forward and backward agricultural GVC participation on agricultural TFP. In terms of forward agricultural GVC participation, production and export of intermediate goods give full play to the market competition and economies of scale effects [34]. Undertaking agricultural outsourcing gives full play to the learning effects [64,65], demonstration effects [66], and resource reallocation effects [67]. FDI in agriculture gives full play to technological innovation and technological spillover effects. In terms of backward agricultural GVC participation, importing large quantities of intermediate agricultural goods provides access to abundant and cheap intermediate agricultural goods. The introduction of more advanced agricultural technology is conducive to improving agricultural production workflow and management methods, capturing changes in upstream and downstream demand, quickly adjusting the scale of agricultural production, and giving full play to the intermediate goods and imitation innovation [22], and then agricultural TFP is improved.
Therefore, as shown in Figure 1, this study proposes the fourth research hypothesis (H4):
H4.
There is heterogeneity in the impact of different modes of participating in agricultural GVCs on agricultural TFP in participating countries.
3. Materials and Methods
3.1. Measure of GVC Participation
This study adopts the widely employed measure of GVC participation to calculate the statuses and modes of agricultural GVC participation, including the GVC participation index, the forward GVC participation index, and the backward GVC participation index.
The GVC participation index is defined as:
The forward GVC participation index is defined as:
The backward GVC participation index is defined as:
where denotes the agriculture; denotes the country; represents the indirect agricultural value-added exports of the country ; represents the foreign value added included in country ’s agricultural value-added exports; and represents the total agricultural exports of the country . The larger the value of , the more agricultural intermediate goods of the country are supplied to agricultural GVCs. The larger the value of , the more the value of is included in country ’s agricultural exports. The higher the value of , the more advantageous country is in higher value-added links of agricultural GVCs such as agricultural R&D. The higher the value of , the more advantageous country is in lower value-added links of agricultural GVCs such as agricultural production. The higher the value of , the higher the participation status of the country in agricultural GVCs.
3.2. Total Factor Productivity Index
The data envelopment analysis (DEA) and the stochastic frontier analysis (SFA) are the most employed parametric and non-parametric methods used to estimate productivity, respectively. DEA avoids misspecification errors as it does not rely on assumptions on the shape of the efficient frontier nor on probability distributions, but the selected functional form in SFA introduces inductive bias in the stochastic process and may lead to severe degradation of the results when the shape is not consistent with the data [68]. Therefore, this study adopts the DEA–Malmquist Index to measure and decompose agricultural TFP. The Malmquist Index was first proposed by Malmquist in 1953, and based on this, productivity change can be measured by combining the Shepherd Distance Function with the Malmquist Productivity Index [69]. The distance function for output in period is defined as:
where and denote the input variables and output variable, respectively; denotes the possible productive collection; and denotes the country . The Malmquist Productivity Index of country from period to period under the technology condition in period is defined as:
The Malmquist Productivity Index of country from period to period under the technology condition in period is defined as:
The change in the Malmquist Productivity Index of country from period to period is defined as:
where and represent the technical efficiency (TEC) index and technical progress (TC) index, respectively.
The TEC index can be further decomposed into the pure technical efficiency (PTEC) index and scale efficiency (SEC) index:
where and represent the pure technical efficiency (PTEC) index and scale efficiency (SEC) index, respectively; denotes the variable returns to scale. Therefore, the Malmquist Productivity Index is equal to the product of the TEC index and TC index, and the TEC index is equal to the product of the PTEC index and the SEC index. The Malmquist Productivity Index is used to denote the change in the TFP. When the value of the Malmquist Productivity Index is greater than 1, the TFP tends to increase; when the value is less than 1 and greater than 0, the TFP tends to decrease, as do the four decomposed indexes of the Malmquist Productivity Index.
In this study, the agricultural value added was used as an agricultural output variable. According to the characteristics of agricultural production, four agricultural input variables were selected as shown in Table 1: (1) Area of agricultural land. The area of agricultural land is denoted by agricultural land area, including arable land, paddy fields, permanent crops, and pasture land. The data were collected from the World Bank World Development Indicator (WDI) Database (available online: https://data.worldbank.org/indicator?tab=all (accessed on 18 August 2022)) [70]. (2) Number of agricultural machinery. The number of agricultural machinery is denoted by the total power of agricultural machinery, including tractors, combined threshers, milking machines, and water pumps. The data were collected from the United States Department of Agriculture (USDA) Database (available online: https://www.ers.usda.gov/ (accessed on 18 August 2022)) [71]. (3) Number of agricultural laborers. The number of agricultural laborers is denoted by the sum of the number of adult population engaged in agricultural activities. The data were collected from the International Labour Organization (ILO) ILOSTAT Database (available online: https://www.ilo.org/global/ (accessed on 18 August 2022)) [72]. (4) Usage of agricultural fertilizers. The usage of agricultural fertilizers is denoted by the total amount of nitrogen, phosphorus, and potassium fertilizers applied for agricultural production. The data on fertilizers were collected from the Food and Agriculture Organization of the United Nations (FAO) FAOSTAT Database (available online: https://www.fao.org/faostat/en/#data/IG (accessed on 18 August 2022)) [73]. It was found that there were very significant differences in the minimum and maximum of the agricultural output and input variables in the sample countries during the sample period. Taking the agricultural value-added variable as an example, the maximum was more than 10,000 times larger than the minimum.
3.3. Baseline Model
This study builds the following panel data fixed effects model as the baseline model to empirically explore the impact of agricultural GVC participation on agricultural TFP.
where , , and denote the country , industry , and year , respectively; denotes the agricultural TFP; denotes the agricultural GVC participation; denotes the control variables; denotes the constant term; and denote the estimated values of the coefficients of and , respectively; and denote the individual and time effects, respectively; and denotes the random error term. In order to avoid the endogeneity problem, with reference to existing studies [74,75,76,77], six control variables as shown in Table 2 that may affect agricultural TFP are selected in this study. The data of , , and were collected from the World Bank WDI Database (available online: https://data.worldbank.org/indicator?tab=all (accessed on 18 August 2022)); the data of were collected from the International Disaster Database (EM–DAT) (available online: https://emdat.be/ (accessed on 18 August 2022)) [78]; and the data of were collected from the FAO FAOSTAT Database (available online: https://www.fao.org/faostat/en/#data/IG (accessed on 18 August 2022)) [73].
3.4. Sample Countries
The data used to calculate GVC participation in this study were collected from the OECD–TiVA Database (available online: https://stats.oecd.org/Index.aspx?DataSetCode=TIVA_2021_C1 (accessed on 8 July 2022)). In the OECD–TiVA database, the Inter-Country Input–Output (ICIO) tables were used to calculate trade value-added indicators covering 66 economies (including all OECD, EU, and G20 countries and most East and Southeast Asian economies), and the data are available for 45 industries within a hierarchy based on the International Standard Industrial Classification of All Economic Activities (ISIC) Rev. 4 for the years 1995–2018. Some data for most economies during 1995–1999 are not available. Considering the representativeness of countries and the completeness of data on trade value-added indicators, this study selected 58 countries as sample countries covering the years 2000–2018. By referring to the World Bank’s criteria for classifying countries by gross national income (GNI) per capita calculated using the World Bank Atlas method released in 2019 (available online: https://datahelpdesk.worldbank.org/knowledgebase/articles/906519-world-bank-country-and-lending-groups (accessed on 22 July 2022)), the 58 sample countries were further classified into three income groups as shown in Table 3.
4. Results and Discussion
4.1. Analysis of Agricultural TFP Index and Its Decomposition Indices
Table 4 shows the descriptive statistical results of the agricultural TFP index and its decomposition indices, which were measured by using the Data Envelopment Analysis Program (DEAP) Version 2.1 developed by the Centre for Efficiency and Productivity Analysis (CEPA) of University of Queensland. It is found that the mean of the TFP index for the 58 sample countries from 2000–2018 was 1.016, which indicates that agricultural TFP has risen annually by 1.6%. Among the 58 sample countries, the agricultural TFP index showed an upward trend in 44 sample countries, such as Slovenia, Argentina, Norway, and Myanmar, a downward trend in 13 sample countries, such as Japan, Thailand, and Malaysia, and no change in Indonesia. In terms of the countries with different income levels, the mean of the agricultural TFP index in lower-middle-income countries was greater than that in high-income and upper-middle-income countries, and the mean of the agricultural TFP index in high-income countries was greater than that in upper-middle-income countries.
In terms of the decomposition indices of the agricultural TFP index, for the 58 sample countries from 2000–2018, the TEC index, the TC index, and the PTEC index increased annually by 0.1%, 1.5%, and 0.1%, respectively, while the SEC index did not change significantly. Specifically, the TEC index showed an upward trend in 23 sample countries, such as Myanmar and Slovakia. The TC index showed an upward trend in 51 sample countries, such as Argentina, Germany, France, and Belgium. The PTEC index showed an upward trend in 18 sample countries, such as Myanmar, Chile, and Morocco. The SE index showed an upward trend in 18 sample countries, such as Myanmar and Brazil. Comparatively, the mean of the TC index was greater than the mean of the TEC index. Therefore, the improvement in agricultural TFP in most of the 58 sample countries was mainly dependent on agricultural technological progress.
4.2. Baseline Model Estimates
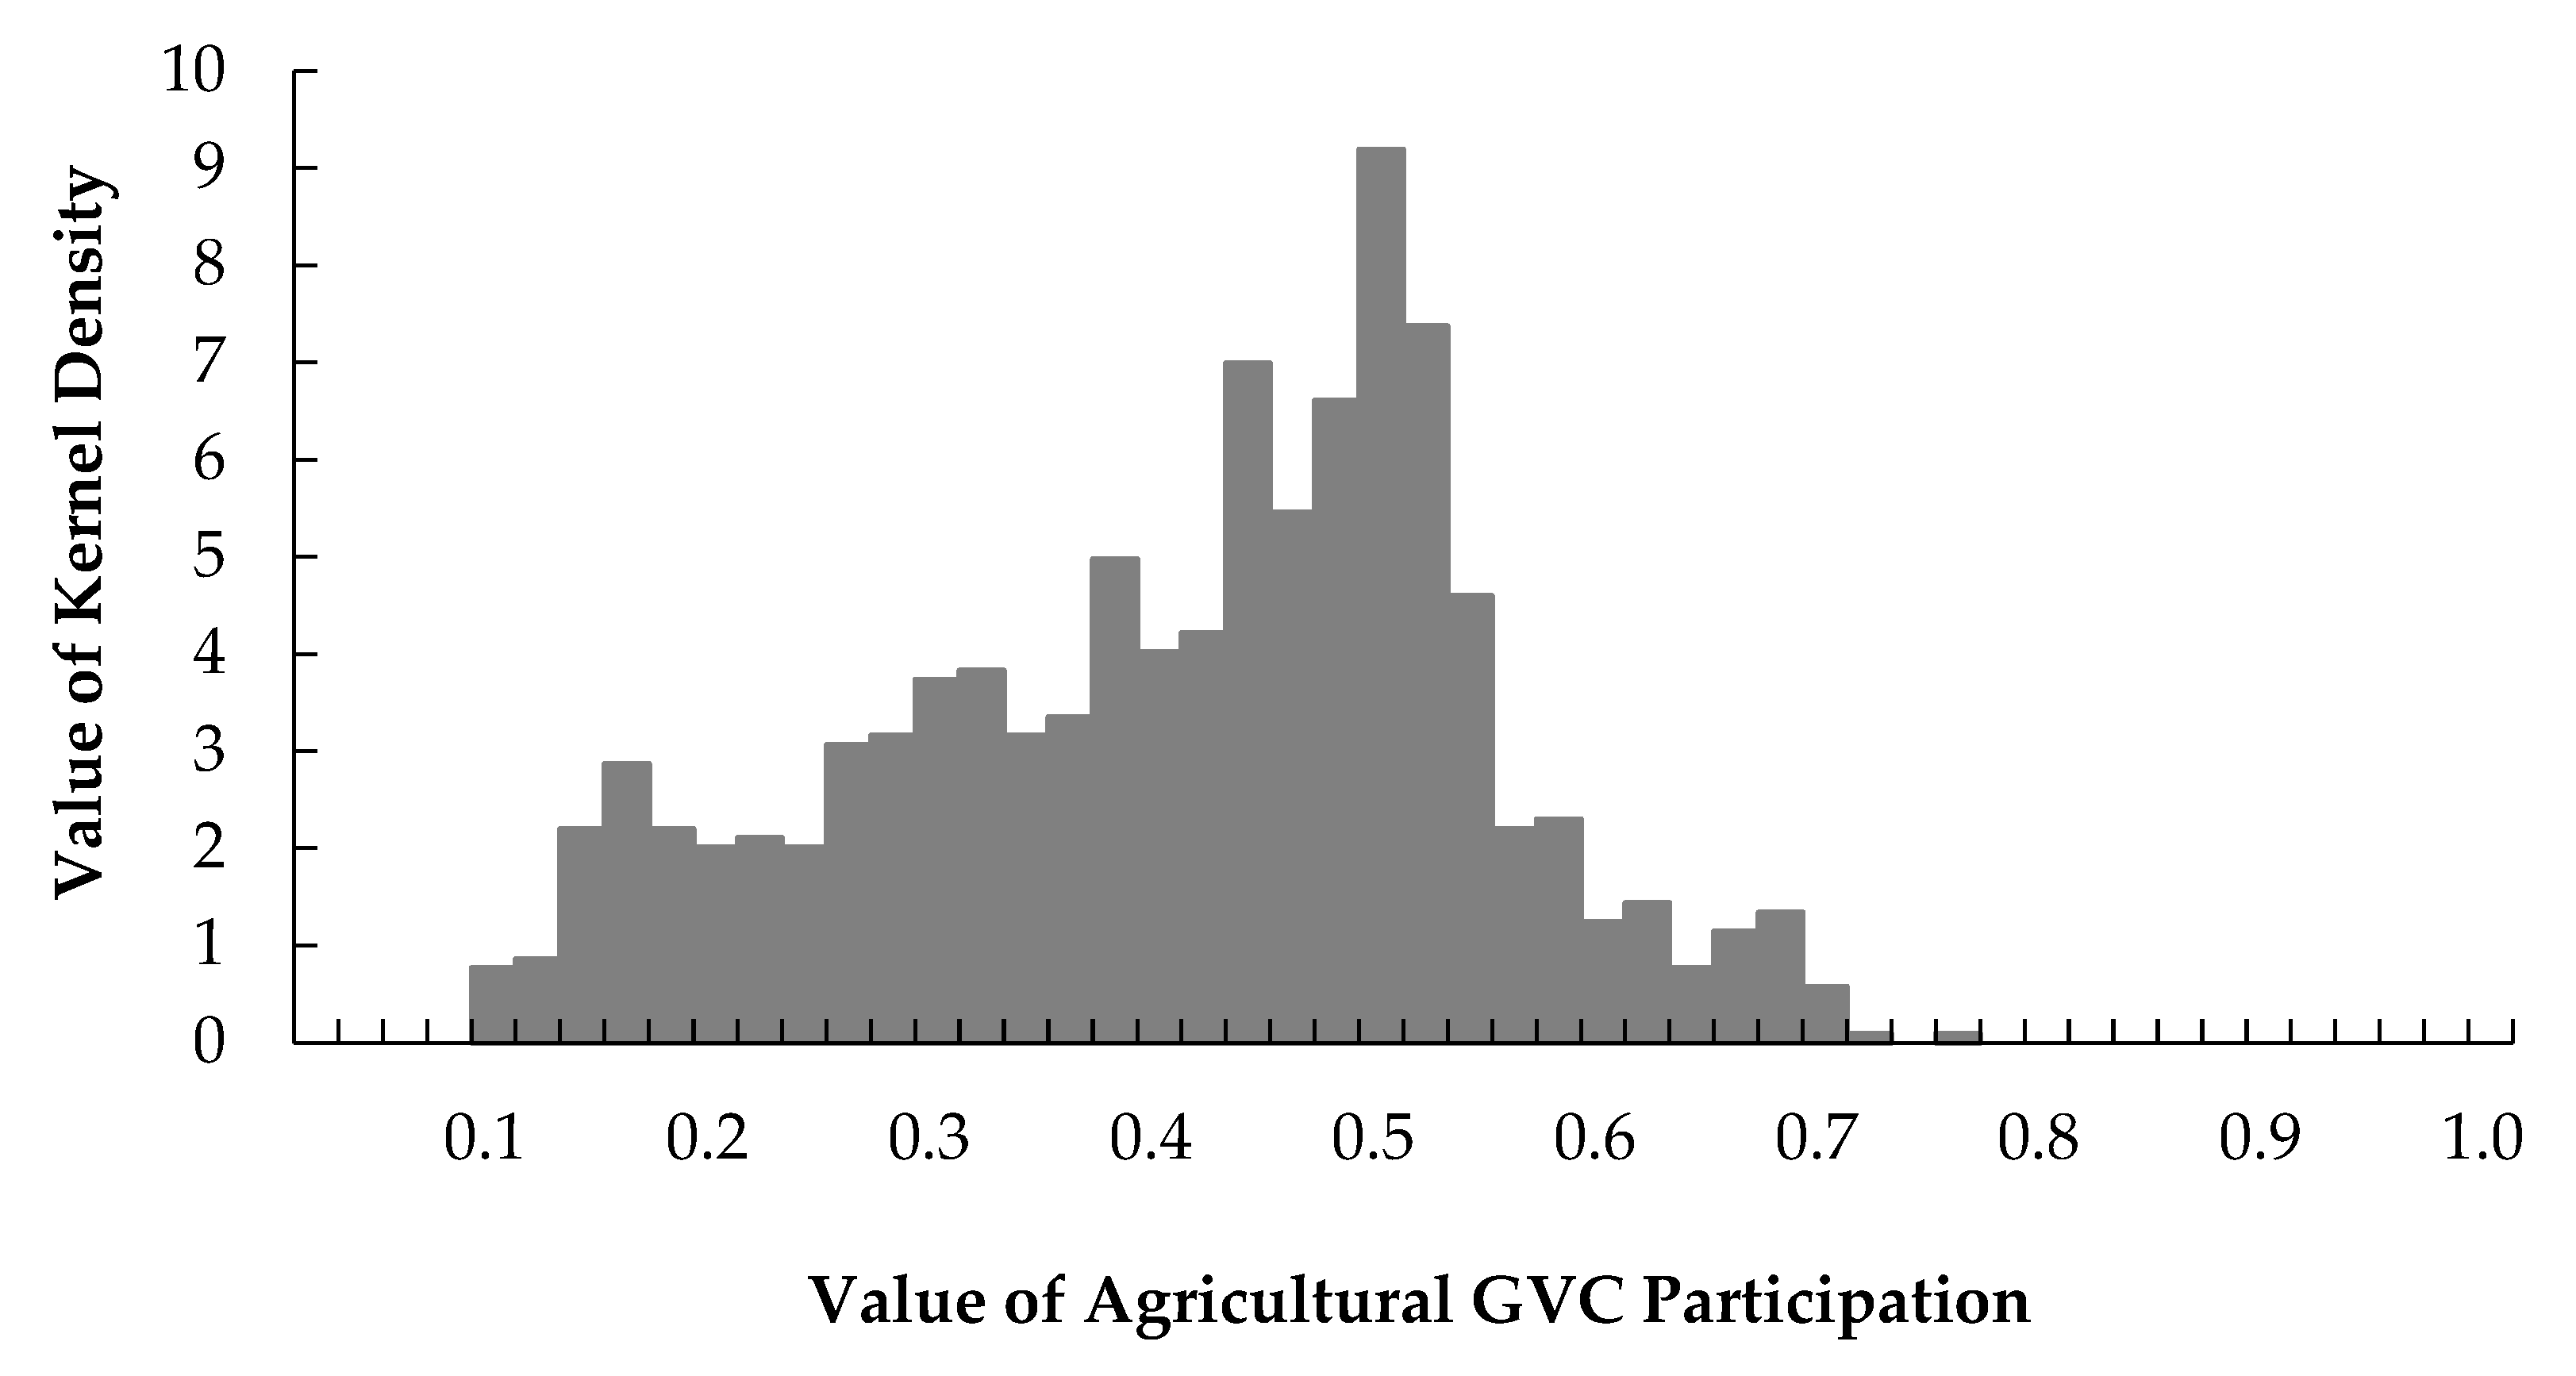
The specification for the panel data model includes fixed and random effects, and the Hausman test should be used to determine the optimal specification for the panel data model. According to the results of the Hausman test presented in Table 5, it is found that the value of χ2 was statistically significant at a 1% significance level, and its probability was less than 1%, showing that the fixed effects specification was better than the random effects specification, and this study adopted the fixed effects specification to estimate Equation (9). According to the estimation results of fixed effects specification presented in Column (1), it is found that the coefficient estimate of was statistically significant and positive, and when the value of agricultural GVC participation increases by 1%, the agricultural TFP index increases by 0.333%. Therefore, by participating in agricultural GVCs, the agricultural TFP of participants can be significantly improved, and thus the research hypothesis H1 is validated. In order to further explore whether there is a nonlinear relationship between agricultural GVC participation and agricultural TFP, the quadratic term of agricultural GVC participation, represented by , was added to Equation (9). According to the estimation results presented in Column (2), it is found that the coefficient estimate of was statistically significant and positive, showing that there was a U-shaped relationship between agricultural GVC participation and agricultural TFP. At the initial stage of participating in agricultural GVCs, its marginal effects on the agricultural TFP of participants were negative, and when the value of agricultural GVC participation exceeded a certain critical value, which was 0.21, its marginal effects on the agricultural TFP of participants were positive. At the same time, according to the mean value (0.39) and kernel density distribution as shown in Figure 2 of the agricultural GVC participation for 58 sample countries, it is found that most sample countries are located in the improvement interval of agricultural TFP, and only about one-tenth of the sample countries are located in the deterioration interval of agricultural TFP, which also verifies the U-shaped relationship between agricultural GVC participation and agricultural TFP.
In the early stages of participating in agricultural GVCs, countries mainly engage in labor-intensive and low-value-added links. With the development of the economy and the accumulation of human capital and material capital, countries gradually shift to higher-value-added links, which are often accompanied by positive spillovers in technology and productivity and induce endogenous technological innovation in countries’ agricultural sectors. But at the same time, with limitations in terms of agricultural resource endowments, market institutions, and size, ability to absorb new knowledge and innovations, and availability of agricultural credit, some countries are hindered from participating in agricultural GVCs more deeply and are vulnerable to resistance from other countries in the process of participating in agricultural GVCs [79]. As a result, the benefits obtained by agricultural GVC participation are easily offset by the unfavorable specialization status in agricultural GVCs [80], and thus prevent countries from improving agricultural TFP by participating in agricultural GVCs. After a long period of knowledge, technology, and capital accumulation, countries with a higher status of agricultural GVC participation are equipped with more favorable resource conditions to participate in higher-value-added links, which ultimately leads to the upgrading of their status of international specialization in agriculture [81], and then agricultural TFP is significantly improved accompanied with deeper integration into agricultural GVCs.
4.3. Robustness Test Estimates
When estimating the baseline model, six control variables were employed to control the endogeneity problem, but the empirical results were still possibly affected by some unobservable factors, which may lead to non-robust and biased issues. Therefore, by replacing the core explanatory variable, replacing the explainable variable, and narrowing the data sample period, this study further tests the robustness of the baseline model estimates. The results are shown in Table 6.
4.3.1. Replacing the Core Explanatory Variable
This study employed the agricultural GVC participation with a one-year lag and a two-year lag represented by and , respectively, to replace the agricultural GVC participation in the current year represented by . According to the corresponding estimation results under the fixed effects specification shown in Column (5) in Table 6, it is found that both coefficient estimates of and were statistically significant and positive, which is consistent with the baseline model estimates.
4.3.2. Replacing the Explainable Variable
This study employed the Solow residual method to recalculate the value of agricultural TFP to replace the agricultural TFP measured using the DEA–Malmquist Index. According to the corresponding estimation results under the fixed effects specification presented in Column (6) in Table 6, it is found that the coefficient estimate of was statistically significant and positive, which is consistent with the baseline model estimates.
4.3.3. Narrowing the Data Sample Period
Considering the possible impact of non-random factors and abnormal values of variables on the estimation results, this paper deleted the first 3% and last 3% data sample periods. According to the corresponding estimation results in Column (7) in Table 6, it is found that the coefficient estimate of was statistically significant and positive, which is consistent with the baseline model estimates.
Therefore, the estimates of the above three robustness tests support the consistency and validity of the baseline model estimates.
4.4. Heterogeneity Test Estimates
4.4.1. Heterogeneity Test of Income Levels
Considering the possible differences in the impact of agricultural GVC participation on agricultural TFP in different countries with different income levels, this study divided the sample countries into three income groups, including high-income, upper-middle-income, and lower-middle-income countries. According to the estimation results shown in Columns (8), (11), and (14) in Table 7, it is found that both coefficient estimates of the of high-income and upper-middle-income countries were statistically significant and positive, while that of lower-middle-income countries was not statistically significant. Therefore, by participating in agricultural GVCs, agricultural TFP in high-income and upper-middle-income countries was significantly improved, but agricultural TFP in lower-middle-income countries was not.
Comparatively, agricultural TFP in lower-middle-income countries, characterized by low development capacity and low technology uptake capacity [10,14], did not achieve significant improvement by participating in agricultural GVCs. Lower-middle-income countries are mainly involved in resource-intensive and labor-intensive links with relatively low value added in agricultural GVCs [1,2], have difficulty in accessing advanced technologies [82,83], and are more susceptible to GVC governance modes as well as control ability and power asymmetry in GVCs [84]. At the same time, the coefficient estimate of the of upper-middle-income countries was larger than that of high-income countries, which indicates that the role of participating in agricultural GVCs in improving agricultural TFP in upper-middle-income countries was stronger than that in high-income countries. The possible reason is that upper-middle-income countries have access to both technological spillovers from high-income countries and sufficient and low-cost labor from lower-middle-income countries [85]. These findings also support that there is a U-shaped relationship between agricultural GVC participation and agricultural TFP.
4.4.2. Heterogeneity Test of Pathways to Participating in Agricultural GVCs
In order to explore the heterogeneity of the impact of different pathways to participate in agricultural GVCs on agricultural TFP, both forward and backward agricultural GVC participation were used to replace agricultural GVC participation in Equation (9). According to estimation results shown in Columns (17) and (18) in Table 8, it is found that coefficient estimates of and were 0.046 and 0.071, respectively, both of which were statistically significant and positive. Therefore, both forward and backward agricultural GVC participation were conducive to improving agricultural TFP, and the impact of the latter was stronger than that of the former. Forward agricultural GVC participation promotes the improvement in agricultural TFP mainly by absorbing technology and knowledge spillovers in home countries, while backward agricultural GVC participation promotes the improvement in agricultural TFP mainly by accessing high-quality intermediate inputs to promote specialized production and export of high-quality agricultural products [86]. Therefore, the research hypothesis H4 is verified.
This study further explored the impact of countries with different income levels participating in agricultural GVCs in different pathways on their agricultural TFP. According to the estimation results shown in Columns (9), (10), (12), and (13) in Table 7, it is found that coefficient estimates of the and the of high-income and upper-middle-income countries were statistically significant and positive, indicating that both forward and backward agricultural GVC participation contribute to the improvement in agricultural TFP in high-income and upper-middle-income countries. According to the estimation results shown in Columns (15) and (16) in Table 7, it was found that, for lower-middle-income countries, a coefficient estimate of was statistically significant and positive, but that of was not statistically significant, indicating that the role of agricultural GVC participation in promoting agricultural TFP in lower-middle-income countries relies on backward agricultural GVC participation.
With a mature domestic market and strong control over the upstream and downstream of industrial chains, high-income countries could maintain their position and high earnings in agricultural GVCs [87]. Upper-middle-income countries may have easier access to technology spillovers and market competition effects, leading to improvement in agricultural TFP. Relying on the advantages of low-cost labor and sufficient agricultural resources to participate in agricultural GVCs [88], lower-middle-income countries can access a rich variety of intermediate goods abroad, promote the transformation of production technology in the downstream sector, increase labor productivity and produce more diversified end products [89,90], and then promote the improvement in agricultural TFP. Therefore, the improvement in agricultural TFP in lower-middle-income countries is mainly through the backward agricultural GVC participation. Undertaking production outsourcing requires a certain technological foundation [91], and coupled with low self-absorption capacity, the impact of technology spillover on agricultural TFP in lower-middle-income countries is relatively limited [92]. Lower-middle-income countries also easily rely too much on introduced technology, which is not conducive to the cultivation and development of local enterprises’ self-innovation capabilities [93,94].
4.5. Mediation Effects Test
4.5.1. Technology Spillover Effects Test
In order to test the impact of agricultural GVC participation on agricultural TFP through technological spillover effects, by referring to Wen et al. [95] and selecting FDI as the intermediary variable, the following mediation effects test models were built:
According to Wen and Ye [89], when the estimates of in Equation (10) and and in Equation (11) are statistically significant, and the absolute value of the estimate of in Equation (11) is less than that of in Equation (9), it can be considered that a portion of the impact of agricultural GVC participation on agricultural TFP is realized through technology spillover effects.
According to the estimation results shown in Column (19) in Table 9, it is found that the coefficient estimate of was statistically significant and positive, which indicates that increased agricultural GVC participation can significantly promote the increase in FDI. According to estimation results presented in Column (20) in Table 9, it is found that coefficient estimates of and were statistically significant and positive, and the absolute value of the former was less than that of the coefficient estimate of in Column (1) in Table 5. Therefore, technology spillover effects have significant mediating effects on the impact of agricultural GVC participation in agricultural TFP, which means that agricultural GVC participation can significantly promote the improvement in agricultural TFP through technology spillover effects, and thus the research hypothesis H2 is verified.
4.5.2. Resource Allocation Effects Test
In order to test the impact of agricultural GVC participation on agricultural TFP through resource allocation effects, by referring to Kemeny [96] and selecting agricultural capital stock per capita represented by the ratio of agricultural capital stock to number of adult population engaged in agricultural activities as the intermediary variable, the following mediation effects test models were built:
where denotes the agricultural capital stock; denotes the number of adult population engaged in agricultural activities. The data of were collected from the FAO’s FAOSTAT database (available online: https://www.fao.org/faostat/en/#data/CS (accessed on 18 August 2022)), and the data of were collected from the ILO’s ILOSTAT Database (available online: https://www.ilo.org/inform/online-information-resources/databases/stats/lang--en/index.htm (accessed on 18 August 2022)).
According to the estimation results shown in Column (21) in Table 9, it is found that the coefficient estimate of was statistically significant and positive, which indicates that increased agricultural GVC participation could significantly promote the increase in agricultural capital stock per capita. According to the estimation results shown in Column (22) in Table 9, it is found that coefficient estimates of and were statistically significant and positive, and the absolute value of the former is less than that of the coefficient estimate of in Column (1) in Table 5. Therefore, the resource allocation effects have a significant mediating effect on the impact of agricultural GVC participation on agricultural TFP, which shows that agricultural GVC participation can significantly promote the improvement in agricultural TFP through resource allocation effects, and thus the research hypothesis H3 is verified.
5. Conclusions and Policy Implications
5.1. Conclusions
This study is the first to systematically explore the theoretical mechanisms of agricultural GVC participation affecting agricultural TFP. By using the 2000–2018 panel data of 58 sample countries, we quantitatively estimated the impact of agricultural GVC participation on agricultural TFP and conducted a robustness test. This study shows that agricultural GVC participation not only may have a direct impact on agricultural TFP through production specialization effects, production scale effects, and market competition effects, but may also have an indirect impact on agricultural TFP through technology spillover effects and resource allocation effects. Estimates from the baseline model indicated a U-shaped relationship between agricultural GVC participation and agricultural TFP, which means that the initial stages of agricultural GVC participation negatively impact agricultural TFP; furthermore, beyond a certain threshold of agricultural GVC participation, agricultural TFP tends to improve. Estimates from the heterogeneity test indicated that through participating in agricultural GVCs, the agricultural TFP in high-income and upper-middle-income countries was significantly improved, but that in lower-middle-income countries was not. Both forward and backward agricultural GVC participation was conducive to improving agricultural TFP in high-income and upper-middle-income countries, while only backward agricultural GVC participation was conducive to improving agricultural TFP in lower-middle-income countries. Agricultural GVC participation could significantly promote the improvement in agricultural TFP through technology spillover effects and resource allocation effects. The empirical findings from the robustness test indicated that baseline model estimates were robust and valid. The empirical findings also verified the four research hypotheses.
5.2. Policy Implications
According to the above research conclusions, this study develops the following policy enlightenments: First, existing comparative advantages in participating in international specialization in agricultural GVCs should be fully exploited to promote the formation of more advanced production technologies and better human capital in agriculture. The utilization efficiency of domestic and international agricultural resources should be improved through continuous upgrading of international specialization status in agricultural GVCs. Second, the perfect agricultural industry chain system covering R&D, production, processing, logistics, and trade should be built to promote the formation of a larger agricultural market and enhance the agricultural market power participating in agricultural GVC. Third, the technology spillover effects of participating in agricultural GVCs should be maximized, so as to better actively learn advanced agricultural technology knowledge, management and marketing experience, and promote agricultural technology innovation and improvement in agricultural TFP through “learning by doing”. Fourth, the pathways to participating in agricultural GVCs for each country should be optimized to maximize the possible benefits. For lower-middle-income countries, when participating in international agricultural specialization through forward agricultural GVC participation, it is necessary to improve the system of agricultural education, R&D and extension, and increase investment in agricultural R&D. At the same time, lower-middle-income countries should promote opening up to fully absorb and utilize international agricultural resources. Furthermore, lower-middle-income countries should break the obstacles faced by international resource and technology exchange and promote the upgrading of domestic agricultural technology. And then, the transformation from “backward agricultural GVC participation” to “forward agricultural GVC participation” can be realized in lower-middle-income countries as soon as possible to avoid the “low-end dilemma”. Fifth, the global cooperation on innovation and application in agricultural technology, such as that within the framework of the Consultative Group on International Agricultural Research (CGIAR), needs to be further strengthened so as to facilitate the faster diffusion of advanced agricultural technology worldwide, simultaneously.
5.3. Limitations
This study has a few limitations. First, considering the availability and completeness of the data, 58 countries covering the years 2000–2018 were chosen as the research sample in this study. The lack of low-income countries in sample countries and the latest data in sample data may reduce the representativeness and timeliness of the empirical findings in this study. Second, when analyzing the impact mechanism of agricultural GVC participation on agricultural TFP, there are still some possible impact pathways that have not been considered, such as the industrial structure transformation of agricultural and non-agricultural sectors. Third, when empirically estimating the impact of agricultural GVC participation on agricultural TFP, this study selected six quantifiable control variables; however, we cannot control for all possible influencing factors, which may reduce the robustness of empirical findings. These limitations need to be addressed in future studies.
Author Contributions
Conceptualization, D.Z. and Z.S.; methodology, D.Z. and Z.S.; software, D.Z. and Z.S.; validation, D.Z. and Z.S.; formal analysis, D.Z. and Z.S.; investigation, D.Z. and Z.S.; resources, D.Z. and Z.S.; data curation, D.Z.; writing—original draft preparation, D.Z. and Z.S.; writing—review and editing, D.Z. and Z.S.; visualization, Z.S.; supervision, Z.S.; project administration, Z.S.; and funding acquisition, Z.S. All authors have read and agreed to the published version of the manuscript.
Funding
This research was funded by the National Natural Science Foundation of China (grant no. 71961147001; no. 71703157), the Agricultural Science and Technology Innovation Project of the Chinese Academy of Agricultural Sciences (grant no. 10–IAED–04–2023), and the Fundamental Research Funds for the Central Non-profit Scientific Institution of China (grant no. 1610052023008).
Data Availability Statement
The data presented in this study are available upon request to the authors.
Conflicts of Interest
The authors declare no conflict of interest. The funders had no role in the design of the study; in the collection, analyses, or interpretation of data; in the writing of the manuscript; or in the decision to publish the results.
References
- Greenville, J.; Kawasaki, K.; Jouanjean, M. Value Adding Pathways in Agriculture and Food Trade: The Role of GVCs and Services; Organisation for Economic Co-Operation and Development: Paris, France, 2019. [Google Scholar]
- Greenville, J.; Kawasaki, K.; Jouanjean, M. Dynamic Changes and Effects of Agro–Food GVCs; Organisation for Economic Co-Operation and Development: Paris, France, 2019. [Google Scholar]
- United Nations Industrial Development Organization. Global Value Chains in the Agrifood Sector; United Nations Industrial Development Organization: Vienna, Austria, 2006. [Google Scholar]
- Lim, S.; Kim, S.W. Global Agricultural Value Chains and Employment Growth. J. Agric. Appl. Econ. Assoc. 2022, 4, 402–418. [Google Scholar] [CrossRef]
- Zhang, H.; Wu, F.; Wu, P. Production and Trade of Agricultural Products in GVC: Features, Shackles and Countermeasures. Int. Bus. Res. 2016, 37, 44–52. [Google Scholar]
- Koopman, R.; Wang, Z.; Wei, S. Tracing Value–Added and Double Counting in Gross Exports; National Bureau of Economic Research: Cambridge, MA, USA, 2012. [Google Scholar]
- Yi, W. Decomposition of the Bilateral Agriculture Trade between China and America: Based on the Perspective of Global Value Chain. World Econ. Stud. 2018, 34, 3–11. [Google Scholar]
- Wang, Z.; Gehlhar, M.; Yao, S. A Globally Consistent Framework for Reliability: Based on Trade Statistics Reconciliation in the Presence of An Entrepôt. China Econ. Rev. 2010, 21, 161–189. [Google Scholar] [CrossRef]
- Ruan, Z. Research on International Competitiveness of Agriculture Based on GVC; Nanjing University of Science and Technology: Nanjing, China, 2021. [Google Scholar]
- Victor, K. Global Value Chains: Benefiting the Domestic Economy; Graduate Institute of International and Development Studies: Geneva, Switzerland, 2015. [Google Scholar]
- Yang, J. Research on the Relationship between Embedding Position of Agriculture in GVCs and Value–adding Capacity. Financ. Trade Res. 2017, 38, 39–47. [Google Scholar]
- Li, K.; Ma, T.; Huang, C. The Trend and Influence of Global Value Chain Reconstruction. Economist 2021, 11, 14–23. [Google Scholar]
- Zhou, B.; Li, T. An Examination of the Factors Influencing China’s Agricultural Global Value Chain Position. Stat. Decis. 2023, 39, 83–87. [Google Scholar]
- Fagerberg, J.; Lundvall, A.; Srholec, M. Global Value Chains, National Innovation Systems and Economic Development. Eur. J. Dev. Res. 2018, 30, 533–556. [Google Scholar] [CrossRef]
- Su, D.; Sheng, B.; Shao, C.; Chen, S. Global Value Chain, Industry Agglomeration and Firm Productivity’s Interactive Effect. Econ. Res. J. 2020, 55, 100–115. [Google Scholar]
- Tang, H. Vertical Specialization and Labor Productivity: A Globalization Perspective. J. World Econ. 2014, 37, 25–52. [Google Scholar]
- Zhao, J.; Boasson, V. Productivity Gains from Offshore Outsourcing: Evidence from the Chinese Manufacturing Industry. China World Econ. 2015, 23, 104–122. [Google Scholar] [CrossRef]
- Nagengast, A.J.; Stehrer, R. Accounting for the Differences between Gross and Value Added Trade Balances. World Econ. 2016, 39, 1276–1306. [Google Scholar] [CrossRef]
- Costinot, A.; Jonathan, V.; Su, W. An Elementary Theory of Global Supply Chains. Rev. Econ. Stud. 2013, 80, 109–144. [Google Scholar] [CrossRef]
- Wang, J. Dynamic Effects of Multinational Outsourcing on the Local Enterprises Productivity in China. Financ. Trade Econ. 2014, 35, 94–104. [Google Scholar]
- Wang, Y.; Lin, H.; Lu, C. The Effect of Global Value Chain Embeddedness on Technical Progress: An Empirical Study on Panel Data of China’s Industries. China Ind. Econ. 2014, 32, 65–77. [Google Scholar]
- Lv, Y.; Huang, Y.; Chen, Y. The Effect of Global Value Chain Embeddedness on Productivity: An Analysis of its Impact and Mechanism. World Econ. 2017, 40, 28–51. [Google Scholar]
- He, N.; Xia, Y. The Effect of Equipment Manufacturing Industry Integration into Global Value Chain Technological Progress. Sci. Technol. Prog. Policy 2019, 36, 65–74. [Google Scholar]
- Hu, Z. Effect of International Intra–product Specialization on Productivity of Chinese Industry. China Ind. Econ. 2007, 25, 30–37. [Google Scholar]
- Liu, H.; Xie, Q. The Productivity of Emerging Economies’ Participation in Global Value Chain. J. Financ. Econ. 2017, 43, 18–31. [Google Scholar]
- Xiao, W. Has Participation in the Division of Labor in Global Value Chains Increased Total Factor Productivity. Soc. Sci. Guangxi 2017, 33, 106–110. [Google Scholar]
- Zhang, Y.; Hu, S. Vertical Specialization, Innovation and Green Total Factor Productivity: An Evidence of Manufacturing Industry. Forum Sci. Technol. China 2022, 38, 104–113. [Google Scholar]
- Chiarvesio, E.D.M.; Micelli, S. Global Value Chains and Open Networks: The Case of Italian Industrial Districts. Eur. Plan. Stud. 2010, 18, 333–350. [Google Scholar] [CrossRef]
- Lee, J.; Gereffi, G. The Co–Evolution of Concentration in Mobile Phone Global Value Chains and Its Impact on Social Uupgrading in Developing Countries; University of Manchester: Manchester, UK, 2013. [Google Scholar]
- Ge, J.; Fu, Y.; Xie, R.; Liu, Y.; Mo, W. The Effect of GVC Embeddedness on Productivity Improvement: From the Perspective of R&D and Government Subsidy. Technol. Forecast. Soc. Chang. 2018, 135, 22–31. [Google Scholar]
- Lv, Y.; Lv, Y. Does GVC Embedment Affect Manufacturing Enterprises Productivity: Based on The Doubly Robust Propensity Score Reweighted Regressions. Financ. Trade Econ. 2016, 37, 109–122. [Google Scholar]
- Hu, Y.; Yu, D. Global Value Chain Embedding, Technology Path Selection and Manufacturing High–Quality Development. Sci. Technol. Prog. Policy 2021, 38, 44–52. [Google Scholar]
- Yanikkaya, H.; Altun, A. Beyond Conventional Trade: Trade Openness Implications of Trade in Value Added. Singap. Econ. Rev. 2020, 66, 973–995. [Google Scholar] [CrossRef]
- Zheng, Y.; Jiang, Q. Effect of Two–way Participation of Global Value Chains on Productivity: Empirical Research Based on the World—Output Database. Financ. Trade Res. 2019, 40, 26–42. [Google Scholar]
- Mattoo, A.; Wang, Z.; Wei, S. Trade in Value Added: Developing New Measures of Cross–Border Trade; Centre for Economic Policy Research and the World Bank: London, UK, 2013. [Google Scholar]
- Baldwin, R.E. Supply–Chain Trade: A Portrait of Global Patterns and Several Testable Hypotheses; National Bureau of Economic Research: Cambridge, MA, USA, 2013. [Google Scholar]
- Hummels, D.; Ishii, J.; Yi, K.M. The Nature and Growth of Vertical Specialization in World Trade. J. Int. Econ. 2001, 54, 75–96. [Google Scholar] [CrossRef]
- Jones, R.W.; Kierzkowski, H. A Framework for Fragmentation. In New Production Patterns in the World Economy; Arndt, S.W., Kierzkowski, H., Eds.; Oxford University Press: Oxford, UK, 2001; pp. 17–34. [Google Scholar]
- Baldwin, J.R.; Caves, R.E. International Competition and Industrial Performance: Allocative Efficiency, Productive Efficiency, and Turbulence. In Freedom and Trade. Vol. 2, The Economics and Politics of International Trade; Gary, C., Ed.; Routledge: London, UK, 1998. [Google Scholar]
- Montalbano, P.; Nenci, S.; Salvatici, L. Trade, Value Chains and Food Security; Food and Agriculture Organization of the United Nations: Rome, Italy, 2015. [Google Scholar]
- Morales, C.; Cory, C.; Bozell, D.A. Comparative Efficiency Study between A Live Lecture and A Web–Based Live–Switched Multi–Camera Streaming Video Distance Learning Instructional Unit. In Proceedings of the 2001 Information Resources Management Association International Conference, Toronto, ON, Canada, 20–23 May 2001; pp. 63–66. [Google Scholar]
- Li, Z. The Role Mechanism and Promotion Path of Agricultural Industry Cluster Upgrading in the Perspective of Global Value Chain. Agric. Econ. 2021, 41, 13–15. [Google Scholar]
- Lawrence, R.Z.; Weinstein, D.E. Trade and Growth: Import–Led or Export–Led? Evidence from Japan and Korea; National Bureau of Economic Research: Cambridge, MA, USA, 1999. [Google Scholar]
- Sharma, M.S.; Sharma, M.V. Employee Engagement to Enhance Productivity in Current Scenario. Int. J. Commer. Bus. Manag. 2014, 3, 595–604. [Google Scholar]
- Coe, D.T.; Helpman, E. International R&D Spillovers. Eur. Econ. Rev. 1995, 39, 859–887. [Google Scholar]
- Hirotaka, T.; Shigemi, K.; Hidemichi, F.; Shunsuke, M.; Shogo, E. Impacts of Productive Efficiency Improvement in the Global Metal Industry on CO2 Emissions. J. Environ. Manag. 2019, 248, 109261. [Google Scholar]
- Evenson, R.; Westphal, L. Technological Change and Technology Strategy. In Handbook of Development Economics; Behrman, J., Srinivasan, T.N., Eds.; North–Holland: Amsterdam, The Netherlands, 1995. [Google Scholar]
- Ma, Y. Agricultural Product Trade, Agricultural Technological Progress and Interregional Income Gap among Farmers in China. J. Int. Trade 2018, 44, 41–53. [Google Scholar]
- Tian, W.; Yu, M. Intermediate Goods Trade Liberalization and Firm R&D: An Empirical Analysis Based on Chinese Data. J. World Econ. 2014, 37, 90–112. [Google Scholar]
- Lampón, J.F.; De la Fuente, M.R.; Fraiz–Brea, J.A. The Dilemma of Domestic Suppliers on the Periphery of the Automotive Industry Global Value Chain. Kybernetes 2021, 51, 3637–3655. [Google Scholar] [CrossRef]
- Li, L.; Cheng, B.; Liu, B. The Impact of Global Value Chains Participation on Employment and Its Structure. J. Int. Trade 2017, 43, 27–37. [Google Scholar]
- Li, X.; Zhao, C.; Nie, J. OFDI and Corporations’ Heterogeneous Capacity Utilization. J. World Econ. 2017, 40, 73–97. [Google Scholar]
- Hatani, F. The Logic of Spillover Interception: The Impact of Global Supply Chains in China. J. World Bus. 2009, 44, 158–166. [Google Scholar] [CrossRef]
- Yan, Y. The GVC Evolution Path of Chinese and American Domestic–Owned and Foreign–Owned Enterprises. J. Xi’an Jiaotong Uni. Soc. Sci. 2021, 41, 29–38. [Google Scholar]
- Sha, W.; Li, Y. Reverse Technology Spillover Effects of OFDI, Knowledge Management and Regional Innovation Capabilities. World Econ. Stud. 2018, 34, 80–94. [Google Scholar]
- Gazaniol, A.; Peltrault, F. Outward FDI, Performance and Group Affiliation: Evidence from French Matched Firms. Econ. Bull. 2013, 33, 891–904. [Google Scholar]
- Yang, D.Y.R.; Chen, Y.C. The ODM Model and Co–evolution in the Global Notebook PC Industry: Evidence from Taiwan. Adv. Appl. Sociol. 2013, 3, 69–78. [Google Scholar] [CrossRef]
- Fosfuri, A.; Motta, M. Foreign Direct Investment and Spillovers through Workers’ Mobility. J. Int. Econ. 2001, 53, 205–222. [Google Scholar] [CrossRef]
- Bruno, P.; Frank, L. Does Foreign Direct Investment Transfer Technology Across Borders? Rev. Econ. Stat. 2001, 83, 490–497. [Google Scholar]
- Li, D.; Deng, M. Chinese Inter–Provincial OFDI, Spatial Spillover Effects, and Structural Upgrading of Domestic Industry: An Analysis Based on the Spatial Panel Durbin Model. J. Int. Trade 2016, 42, 121–133. [Google Scholar]
- Liu, J.; Liu, Y. Can Outward Foreign Direct Investment Improve the Resource Misallocation in China? China Ind. Econ. 2018, 36, 60–78. [Google Scholar]
- Jin, F.; Jin, R. Analysis on the Spatial Effects of Agricultural Industrial Structure on Agricultural Green Total Factor Productivity. J. Huazhong Agric. Uni. Soc. Sci. 2020, 40, 124–134. [Google Scholar]
- Pan, Q. An Study on the Influence of Global Value Chain Embeddedness on the Efficiency of Resource Allocation in China’s Manufacturing Industry; Shanghai Academy of Social Sciences: Shanghai, China, 2021. [Google Scholar]
- Wang, Y.; Zhao, Y. Processing Trade Import, Forward Linkage and Industrial Productivity: An Study Based on Non–competitive Input–output Table. World Econ. Stud. 2013, 29, 41–46. [Google Scholar]
- Ma, S.; Zheng, B. Review of the Relationship between the Export Behavior and Productivity in Chinese Enterprises: 2001–2007. J. Zhejiang Uni. Humanities Soc. Sci. 2010, 40, 144–153. [Google Scholar]
- Chen, Y.; Wang, H. Export, Back Linkages and Total Factor Productivity. Financ. Trade Res. 2011, 22, 46–51. [Google Scholar]
- Zhong, S.; Liang, J.; Mao, Y. The Impact Mechanisms of Global Value Chain Embedding on the Enhancement of Total Factor Productivity. J. Int. Trade 2021, 47, 110–125. [Google Scholar]
- Silva, T.C.; Tabak, B.M.; Cajueiro, D.O.; Dias, M.V.B. A Comparison of DEA and SFA Using Micro- and Macro-Level Perspectives: Efficiency of Chinese Local Banks. Phys. A 2017, 469, 216–223. [Google Scholar] [CrossRef]
- Caves, D.W.; Christensen, L.R.; Diewert, W.E. Multilateral Comparisons of Output, Input, and Productivity Using Superlative Index Numbers. Econ. J. 1982, 92, 73–86. [Google Scholar] [CrossRef]
- World Bank WDI Database. Available online: https://data.worldbank.org/indicator?tab=all (accessed on 18 August 2022).
- United States Department of Agriculture (USDA) Database. Available online: https://www.ers.usda.gov/ (accessed on 18 August 2022).
- International Labour Organization (ILO) ILOSTAT Database. Available online: https://www.ilo.org/global/ (accessed on 18 August 2022).
- Food and Agriculture Organization of the United Nations (FAO) FAOSTAT Database. Available online: https://www.fao.org/faostat/en/#data/IG (accessed on 18 August 2022).
- Yi, Z.; Li, G.; Fan, L.; Gao, X. Climate Change, Science and Technology Stocks and Agricultural Productivity Growth. Chin. Rural Econ. 2016, 30, 16–28. [Google Scholar]
- Liu, H.; Lang, D. Institutional Impacts on Agricultural Involvement in Global Value Chains Specialization—Based on the Multinational Panel Data from the World Input–Output Tables. Int. Bus. 2019, 34, 11–20. [Google Scholar]
- Zhang, D.; Jiao, X. Agricultural Insurance, Total Factor Productivity in Agriculture and the Economic Resilience of Farm Households. J. South China Agric. Univ. Soc. Sci. 2022, 21, 82–97. [Google Scholar]
- Chen, Y.; Wang, Y. The Impact of Agricultural Import and Export Trade on Green Total Factor Productivity in China’s Agriculture. J. Commer. Econ. 2022, 41, 141–144. [Google Scholar]
- International Disaster Database (EM–DAT). Available online: https://emdat.be/ (accessed on 18 August 2022).
- Lee, J.; Gereffi, G. Global Value Chains, Rising Power Firms and Economic and Social Upgrading. Crit. Perspect. Int. Bus. 2015, 11, 319–339. [Google Scholar] [CrossRef]
- Kaplinsky, R. Globalization and Unequalization: What Can Be Learned from Value Chain Analysis? J. Dev. Stud. 2020, 37, 117–146. [Google Scholar] [CrossRef]
- Wang, X.; Wu, S.; Zhao, M.; Ci, M.; Ding, L. Participation in Global Value Chain and Its Impact on International Competitiveness for China’s Agricultural Products: Evidence Based on Enterprise Data. Chin. J. Agric. Resour. Reg. Plan. 2022, 43, 93–102. [Google Scholar]
- Lu, F.; Hu, P. Game Analysis on Low–Locked to Chinese Enterprises at the Global Value Network. China Ind. Econ. 2008, 26, 23–32. [Google Scholar]
- Liu, W.; Li, L.; Liu, Y. The Impact of Global Value Chain Embeddedness on Technological Sophistication of China’s Export. China Ind. Econ. 2014, 32, 83–95. [Google Scholar]
- Greenville, J.; Kawasaki, K.; Beaujeu, R. How Policies Shape Global Food and Agriculture Value Chains; Organisation for Economic Co–operation and Development: Paris, France, 2017. [Google Scholar]
- Liu, H.; Zhang, D.; Zou, H. Emerging Markets and Global Value Chain: An Perspective Based on Trade in Value–added. J. Cent. Uni. Financ. Econ. 2015, 35, 85–99. [Google Scholar]
- Bhushan, J. Global Value Chain Embeddedness, Labour Productivity and Employment in the Asia–Pacific Countries. Stud. Econ. Financ. 2020, 38, 339–360. [Google Scholar]
- Brandt, L.; Eric, T. The Fight for the Middle: Upgrading, Competition, and Industrial Development in China. World Dev. 2010, 38, 1555–1574. [Google Scholar] [CrossRef]
- Shen, J.H.; Zhang, L.; Lee, C.C.; Zhang, J.; Shen, L. Towards A Dynamic Model of the Industrial Upgrading with Global Value Chains. World Econ. 2021, 44, 2683–2702. [Google Scholar] [CrossRef]
- Constantinescu, C.; Mattoo, A.; Ruta, M. Does Vertical Specialization Increase Productivity? World Econ. 2019, 42, 2385–2402. [Google Scholar] [CrossRef]
- World Bank. World Development Report: Trading for Development in the Age of Global Value Chains; World Bank: Washington, DC, USA, 2020. [Google Scholar]
- Brandt, L.; Van, J.B.; Zhang, Y. Challenges of Working with the Chinese NBS Firm–Level Data. China Econ. Rev. 2014, 30, 339–352. [Google Scholar] [CrossRef]
- Ma, S.; Chen, Y.; Liu, M. Reverse Technology Spillover of Outward Foreign Direct Investment and the Promotion of Position of the Agricultural Global Value Chain: Evidence from G20. Int. Bus. Res. 2017, 38, 5–17. [Google Scholar]
- Xiao, L.; Xie, D. Foreign Technology Import and Growth of Local Innovation: Complementary or Substitution: An Analysis Based on Heterogeneous Absorptive Capacity. China Ind. Econ. 2016, 34, 75–92. [Google Scholar]
- Humphrey, J.; Schmitz, H. How Does Insertion in Global Value Chains Affect Upgrading in Industrial Clusters? Reg. Stud. 2002, 36, 1017–1027. [Google Scholar] [CrossRef]
- Wen, Z.; Ye, B. Analyses of Mediating Effects: The Development of Methods and Models. Adv. Psychol. Sci. 2014, 22, 5–19. [Google Scholar] [CrossRef]
- Kemeny, T. Does Foreign Direct Investment Drive Technological Upgrading. World Dev. 2010, 38, 1543–1554. [Google Scholar] [CrossRef]
Figure 1.
Impact pathways of agricultural global value chain (GVC) participation on agricultural total factor productivity (TFP) and corresponding research hypotheses. Note: FDI denotes foreign direct investment.
Figure 1.
Impact pathways of agricultural global value chain (GVC) participation on agricultural total factor productivity (TFP) and corresponding research hypotheses. Note: FDI denotes foreign direct investment.

Figure 2.
The kernel density distribution of agricultural GVC participation of 58 sample countries.


Table 1.
Agricultural output and input variables and their descriptive statistical results.
| Variables | Unit | Data Sources | Mean | Minimum | Maximum |
|---|---|---|---|---|---|
| Output Variable | |||||
| Agricultural value added | USD 100 million | WDI Database | 358 | 1 | 10,300 |
| Input Variables | |||||
| Area of agricultural land | Square kilometers | WDI Database | 557,985 | 1090 | 5,290,000 |
| Number of agricultural machinery | 1000 metric horsepower | USDA Database | 39,162 | 183 | 15,19,077 |
| Number of agricultural laborers | People | ILOSTAT Database | 11,400,000 | 2514 | 364,000,000 |
| Usage of agricultural fertilizers | Tons | FAOSTAT Database | 2,525,197 | 9230 | 55,200,000 |
Table 2.
Control variables and their descriptive statistical results.
| Variables | Introduction | Data Sources | Mean | Minimum | Maximum |
|---|---|---|---|---|---|
| Gross domestic product (GDP) per capita/USD 1000 | WDI Database | 14.426 | 0.034 | 105.214 | |
| Share of goods trade in GDP/% | WDI Database | 59.859 | 18.449 | 174.164 | |
| Gross enrollment rate in tertiary education/% | WDI Database | 49.999 | 10.176 | 118.510 | |
| Share of the urban population in the total population/% | WDI Database | 67.356 | 20.656 | 97.514 | |
| Number of people affected by natural disasters/10,000 people | EM–DAT Database | 0.941 | 0.0001 | 850.997 | |
| Government expenditure in agriculture/USD 100 million | FAOSTAT Database | 24.853 | 2.413 | 950.507 |
Table 3.
Sample countries.
| Income Groups | GNI per Capita | Countries |
|---|---|---|
| High-income countries (36 countries) | USD 12,375 or more | Australia, Austria, Belgium, Canada, Chile, Cyprus, Czech Republic, Denmark, Estonia, Finland, France, Germany, Greece, Iceland, Ireland, Israel, Italy, Japan, Latvia, Netherlands, New Zealand, Norway, Poland, Portugal, Republic of Korea, Saudi Arabia, Slovak Republic, Slovenia, Spain, Switzerland, United Kingdom, and the United States. |
| Upper-middle-income countries (15 countries) | Between USD 3996 and USD 12,374 | Argentina, Brazil, Bulgaria, China, Colombia, Costa Rica, Croatia, Hungary, Kazakhstan, Lithuania, Luxembourg, Malaysia, Mexico, Peru, Romania, Russian Federation, South Africa, Thailand, and Turkey. |
| Lower-middle-income countries (7 countries) | Between USD 1026 and USD 3995 | Cambodia, India, Indonesia, Morocco, Myanmar, Philippines, and Tunisia. |
Table 4.
Descriptive statistical results of agricultural TFP index and its decomposition indices.
| Variables | TFP Index | TEC Index | TC Index | PTEC Index | SEC Index |
|---|---|---|---|---|---|
| Mean | 1.016 | 1.001 | 1.015 | 1.001 | 1.000 |
| Minimum | 0.950 | 0.957 | 0.964 | 0.960 | 0.957 |
| Maximum | 1.102 | 1.126 | 1.042 | 1.070 | 1.052 |
| Standard deviation | 0.028 | 0.027 | 0.016 | 0.019 | 0.013 |
| Number of countries with values greater than 1 | 44 | 23 | 51 | 18 | 24 |
| Mean in high-income countries | 1.020 | 0.999 | 1.021 | 1.010 | 0.998 |
| Mean in upper-middle-income countries | 1.014 | 0.999 | 1.015 | 0.998 | 1.001 |
| Mean in lower-middle-income countries | 1.024 | 1.024 | 1.000 | 1.010 | 1.014 |
Table 5.
Estimation results of the baseline model.
| Variables | Fixed Effects | Random Effects | ||
|---|---|---|---|---|
| (1) | (2) | (3) | (4) | |
| 0.333 *** (6.17) | 0.528 *** (5.75) | 0.334 *** (5.98) | 0.429 *** (5.83) | |
| 0.106 * (1.74) | 0.027 * (1.67) | |||
| Control variables | yes | yes | yes | yes |
| Fixed countries | yes | yes | yes | yes |
| Fixed years | yes | yes | yes | yes |
| Constant | −0.382 ** (−2.30) | −0.521 ** (−2.28) | −0.113 *** (−2.73) | −0.105 ** (−1.91) |
| Number of observations | 1044 | 1044 | 1044 | 1044 |
| Hausman test | χ2 = 160.20 *** [0.000] | |||
Note: Numbers in parentheses are values of t-statistics; numbers in square brackets are values of probability; ***, **, and * denote 1%, 5%, and 10% significance levels, respectively.
Table 6.
Estimation results of the robustness test.
| Variables | Replacing the Core Explanatory Variable | Replacing the Explainable Variable | Narrowing the Data Sample Period |
|---|---|---|---|
| (5) | (6) | (7) | |
| 0.014 *** (2.71) | 0.339 *** (6.36) | ||
| lnGVCt−1 | 0.531 *** (4.96) | ||
| lnGVCt−2 | 0.412 *** (3.65) | ||
| Control variables | yes | yes | yes |
| Fixed countries | yes | yes | yes |
| Fixed years | yes | yes | yes |
| Constant | −0.212 ** (−2.64) | −0.285 ** (−2.24) | −0.558 ** (−2.07) |
| F-statistic | 18.71 *** [0.000] | 17.38 *** [0.000] | 28.23 *** [0.000] |
Note: Numbers in parentheses are values of t-statistics; numbers in square brackets are values of probability; *** and ** denote 1% and 5% significance levels, respectively.
Table 7.
Estimation results of heterogeneity in countries with different income levels.
| Variables | High-Income Countries | Upper-Middle-Income Countries | Lower-Middle-Income Countries | ||||||
|---|---|---|---|---|---|---|---|---|---|
| (8) | (9) | (10) | (11) | (12) | (13) | (14) | (15) | (16) | |
| 0.322 *** (7.31) | 0.349 *** (2.83) | −0.036 (−1.36) | |||||||
| 0.057 ** (2.36) | 0.030 ** (2.43) | −0.110 (−0.07) | |||||||
| 0.037 ** (2.32) | 0.034 ** (2.22) | 0.003 * (1.75) | |||||||
| Control variables | yes | yes | yes | yes | yes | yes | yes | yes | yes |
| Constant | −0.320 ** (−2.26) | −0.377 ** (−2.02) | −1.862 ** (−2.11) | −0.411 ** (−2.43) | 0.083 ** (2.25) | −0.051 ** (−2.06) | −0.360 ** (−2.16) | −0.553 ** (−2.26) | −0.528 ** (−2.09) |
| Fixed countries | yes | yes | yes | yes | yes | yes | yes | yes | yes |
| Fixed years | yes | yes | yes | yes | yes | yes | yes | yes | yes |
| F-statistic | 17.63 *** [0.000] | 8.24 *** [0.000] | 7.61 *** [0.000] | 23.21 *** [0.000] | 28.23 *** [0.000] | 27.61 *** [0.000] | 28.05 *** [0.000] | 18.43 *** [0.000] | 17.56 *** [0.000] |
Note: Numbers in parentheses are values of t-statistics; numbers in square brackets are values of probability; ***, **, and * denote 1%, 5%, and 10% significance levels, respectively.
Table 8.
Estimation results of heterogeneity of pathways to participating in agricultural GVCs.
| Variables | Forward Agricultural GVC Participation | Backward Agricultural GVC Participation |
|---|---|---|
| (17) | (18) | |
| lnGVCf | 0.046 ** (2.25) | |
| lnGVCb | 0.071 ** (2.07) | |
| Control variables | yes | yes |
| Constant | −0.623 ** (−2.12) | −0.697 ** (−2.15) |
| Fixed countries | yes | yes |
| Fixed years | yes | yes |
| F-statistic | 12.60 *** [0.000] | 13.21 *** [0.000] |
Note: Numbers in parentheses are values of t-statistics; numbers in square brackets are values of probability; *** and ** denote 1% and 5% significance levels, respectively.
Table 9.
Estimation results of technology spillover and resource allocation effects.
| Variables | Technology Spillover Effects | Resource Allocation Effects | ||
|---|---|---|---|---|
| lnFDI | lnTFP | ln(K/L) | lnTFP | |
| (19) | (20) | (21) | (22) | |
| lnGVC | 0.028 ** (2.25) | 0.321 ** (2.38) | 0.097 ** (2.22) | 0.327 ** (2.44) |
| lnFDI | 0.045 ** (2.01) | |||
| ln(K/L) | 0.023 ** (2.09) | |||
| Control variables | yes | yes | yes | yes |
| Constant | 7.291 * (1.90) | 0.650 *** (2.86) | −6.531 *** (−6.28) | −0.516 ** (2.33) |
| Fixed countries | yes | yes | yes | yes |
| Fixed years | yes | yes | yes | yes |
| F-statistic | 217.60 *** [0.000] | 23.20 *** [0.000] | 328.05 *** [0.000] | 24.50 *** [0.000] |
Note: Numbers in parentheses are values of t-statistics; numbers in square brackets are values of probability; ***, **, and * denote 1%, 5%, and 10% significance levels, respectively.
Disclaimer/Publisher’s Note: The statements, opinions and data contained in all publications are solely those of the individual author(s) and contributor(s) and not of MDPI and/or the editor(s). MDPI and/or the editor(s) disclaim responsibility for any injury to people or property resulting from any ideas, methods, instructions or products referred to in the content. |
© 2023 by the authors. Licensee MDPI, Basel, Switzerland. This article is an open access article distributed under the terms and conditions of the Creative Commons Attribution (CC BY) license (https://creativecommons.org/licenses/by/4.0/).
Share and Cite
MDPI and ACS Style
Zhang, D.; Sun, Z. The Impact of Agricultural Global Value Chain Participation on Agricultural Total Factor Productivity. Agriculture 2023, 13, 2151. https://doi.org/10.3390/agriculture13112151
AMA Style
Zhang D, Sun Z. The Impact of Agricultural Global Value Chain Participation on Agricultural Total Factor Productivity. Agriculture. 2023; 13(11):2151. https://doi.org/10.3390/agriculture13112151
Chicago/Turabian StyleZhang, Defeng, and Zhilu Sun. 2023. "The Impact of Agricultural Global Value Chain Participation on Agricultural Total Factor Productivity" Agriculture 13, no. 11: 2151. https://doi.org/10.3390/agriculture13112151
Note that from the first issue of 2016, this journal uses article numbers instead of page numbers. See further details here.