

Improved Method for Apple Fruit Target Detection Based on YOLOv5s
Tianjin Key Laboratory of Refrigeration Technology, Tianjin University of Commerce, No. 409 Guangrong Road, Beichen District, Tianjin 300134, China
*
Author to whom correspondence should be addressed.
Agriculture 2023, 13(11), 2167; https://doi.org/10.3390/agriculture13112167
Submission received: 9 October 2023
/
Revised: 4 November 2023
/
Accepted: 13 November 2023
/
Published: 18 November 2023
(This article belongs to the Special Issue Model-Assisted and Computational Plant Phenotyping)
Abstract
:Images captured using unmanned aerial vehicles (UAVs) often exhibit dense target distribution and indistinct features, which leads to the issues of missed detection and false detection in target detection tasks. To address these problems, an improved method for small target detection called YOLOv5s is proposed to enhance the detection accuracy for small targets such as apple fruits. By applying improvements to the RFA module, DFP module, and Soft-NMS algorithm, as well as integrating these three modules together, accurate detection of small targets in images can be achieved. Experimental results demonstrate that the integrated, improved model achieved a significant improvement in detection accuracy, with precision, recall, and mAP increasing by 3.6%, 6.8%, and 6.1%, respectively. Furthermore, the improved method shows a faster convergence speed and lower loss value during the training process, resulting in higher recognition accuracy. The results of this study indicate that the proposed improved method exhibits a good performance in apple fruit detection tasks involving UAV imagery, which is of great significance for fruit yield estimation. The research findings demonstrate the effectiveness and feasibility of the improved method in addressing small target detection tasks, such as apple fruit detection.
1. Introduction
Crop yield estimation is vital in the agricultural sector. With the application of information technology and data analysis, crop yield estimation based on machine learning and deep learning models has become widely used [1,2,3]. Before yield estimation, the harvesting methods traditionally used were typically manual tasks, causing farmers to expend a significant amount of time and effort in harvesting crops [4,5]. The method for tallying crops within the orchard can be cumbersome, leading to operator fatigue and inefficiency [6].
Apolo-Apolo et al. utilized remote sensing image data and CNN deep learning models in their research, estimating citrus fruit yield and size. They segmented and identified the fruit, predicting the yield based on factors such as fruit size, height, and quantity [7]. Chen et al. investigated methods for detecting and predicting the number of individual fruits in apple orchards with diverse data sources on a hectare scale. They utilized machine learning algorithms and feature fusion strategies to enhance the prediction results [8]. Gao et al. proposed a method for identifying apple fruits based on a trunk tracker, using trunk geometric features to reduce the detection rate and decrease the number of false detections [9]. These studies indicate that using deep learning and image processing techniques for detecting the quantity of fruit in orchards has become an accurate and efficient method for crop yield estimation. Compared to visual estimation or sampling methods, using deep learning and image processing techniques for fruit quantity detection has higher accuracy and precision [10]. As a result, this enables a more objective and precise estimation of fruit yield in orchards, offering crucial assistance to farmers.
Deep learning facilitates practical, fast, and interesting data analysis in precision agriculture [11,12,13]. In recent years, with advances in computers, deep learning, and image processing technologies, various neural network models have been established for crop yield estimation [14]. Coulibaly et al. proposed an approach using transfer learning with feature extraction to build an identification system of mildew disease in pearl millet. The experimental results present an encouraging performance, with an accuracy of 95.00% [15]. Chew et al. used RGB images collected from unmanned aerial vehicles (UAVs) flown in Rwanda to develop a deep learning algorithm for identifying crop types, specifically bananas, maize, and legumes, which are key strategic food crops in Rwandan agriculture [16]. Sun et al. proposed a novel real-time apple disease detector based on the SSD deep learning model, optimized with data augmentation, multi-scale training, and batch normalization, achieving high accuracy and robustness in real-time detection [17]. Pang et al. used Gaussian smoothing technology and color space transformation for image preprocessing. Based on Fast-R-CNN, they optimized the model through data augmentation and multi-scale training, achieving a model recognition accuracy of over 90% when the drone flight altitude was 40 m [18]. Wang et al. proposed a method for real-time identification of apple stems/calices using the YOLO algorithm for an automatic fruit-loading system. This method uses high-speed cameras and sensors to detect and identify fruit in real-time before automatic loading. Experimental results validated the accuracy and robustness of this method [19].
In the field of object detection, there are many excellent deep learning models, including the YOLO series models, which have always played a significant role. The lightweight YOLOv5s model, in particular, has garnered attention for its impressive performance in terms of model size, accuracy, speed, and resource consumption [20]. Dias et al. (2018) [21] presents a method in which a pre-trained convolutional neural network is fine-tuned to become especially sensitive to flowers. Experimental results demonstrated that the method significantly outperformed three approaches that represent the state of the art in flower detection, with recall and precision rates higher than 90%. Su et al. (2022) [22] proposed a tree trunk and obstacle detection method in a semistructured apple orchard environment based on an improved YOLOv5s algorithm, with an aim of improving its real-time detection performance. Yan et al. (2021) [23] proposed a lightweight apple target detection method for picking robots using an improved YOLOv5s algorithm. Experimental results indicated that the graspable apples, which were unoccluded or only occluded by tree leaves, and the ungraspable apples, which were occluded by tree branches or occluded by other fruits, could be identified effectively using the proposed improved network model. Xu et al. (2022) [24] presented a Zanthoxylum-picking-robot target detection method based on an improved YOLOv5s algorithm, which can provide technical support for pepper-picking robots in detecting multiple pepper fruits in real time. These researchers have achieved a balance between detection efficiency and accuracy through methods such as model compression and slimming.
Accurate fruit quantity detection is crucial for farmers. It can help them develop reasonable harvest plans, improve the quality and quantity of fruit supply, and thereby increase revenue and market competitiveness. In this paper, the YOLOv5s algorithm is used to detect fruit images on apple tree crowns. By accurately analyzing and detecting the quantity of fruit, we can more precisely estimate the yield of individual apple trees. Deep learning technology may provide farmers with reliable evidence to better plan production and harvest schedules, enhancing the competitiveness of their orchards.
2. Materials and Methods
2.1. Experimental Subject
This study used apple trees from the Shuwai Taoyuan Orchard in Beichen District, Tianjin City, as the research subject. The apple tree is one of the primary economic tree species in the Shuwai Taoyuan Orchard. According to field surveys and sample analysis, the apple trees in the orchard are predominantly Red Fuji apple trees. Red Fuji apples turn red when ripe, usually presenting a spherical shape and smooth surface. The fruits grow in clusters or are stuck together, and their color contrasts sharply with the leaves. They have a large diameter and are close to a regular geometrical circular shape. As apple trees share similarities in height and profile with other Rosaceae economic fruit trees like cherry trees and peach trees and have broad representativeness in terms of fruit distribution and color, the research results for apple fruits are expected to be generalizable to other types of fruits.
2.2. Image Collection System and Dataset Creation
This study was conducted in 2022 with an inter-tree spacing of 5 m × 4.5 m. A random sample of 20 independent trees was drawn from a total of 328 trees, with 5 trees per group. Two weeks before the fruit was harvested, a drone was used to take two photographs of each tree, one on the left and one on the right, as shown in the schematic diagram of the drone’s on-site image collection in Figure 1. A total of 40 high-resolution RGB images were obtained under natural light conditions for testing. The images were taken using a UDIRC i25 drone equipped with a high-resolution, 2560 × 1920 RGB digital camera, with the image files in JPG format. The drone integrates a high-resolution sensor module and an intelligent autofocus program, enabling efficient photography of trees at the same height. To ensure image quality, we tried to maintain the drone at a constant height while flying between the trees.
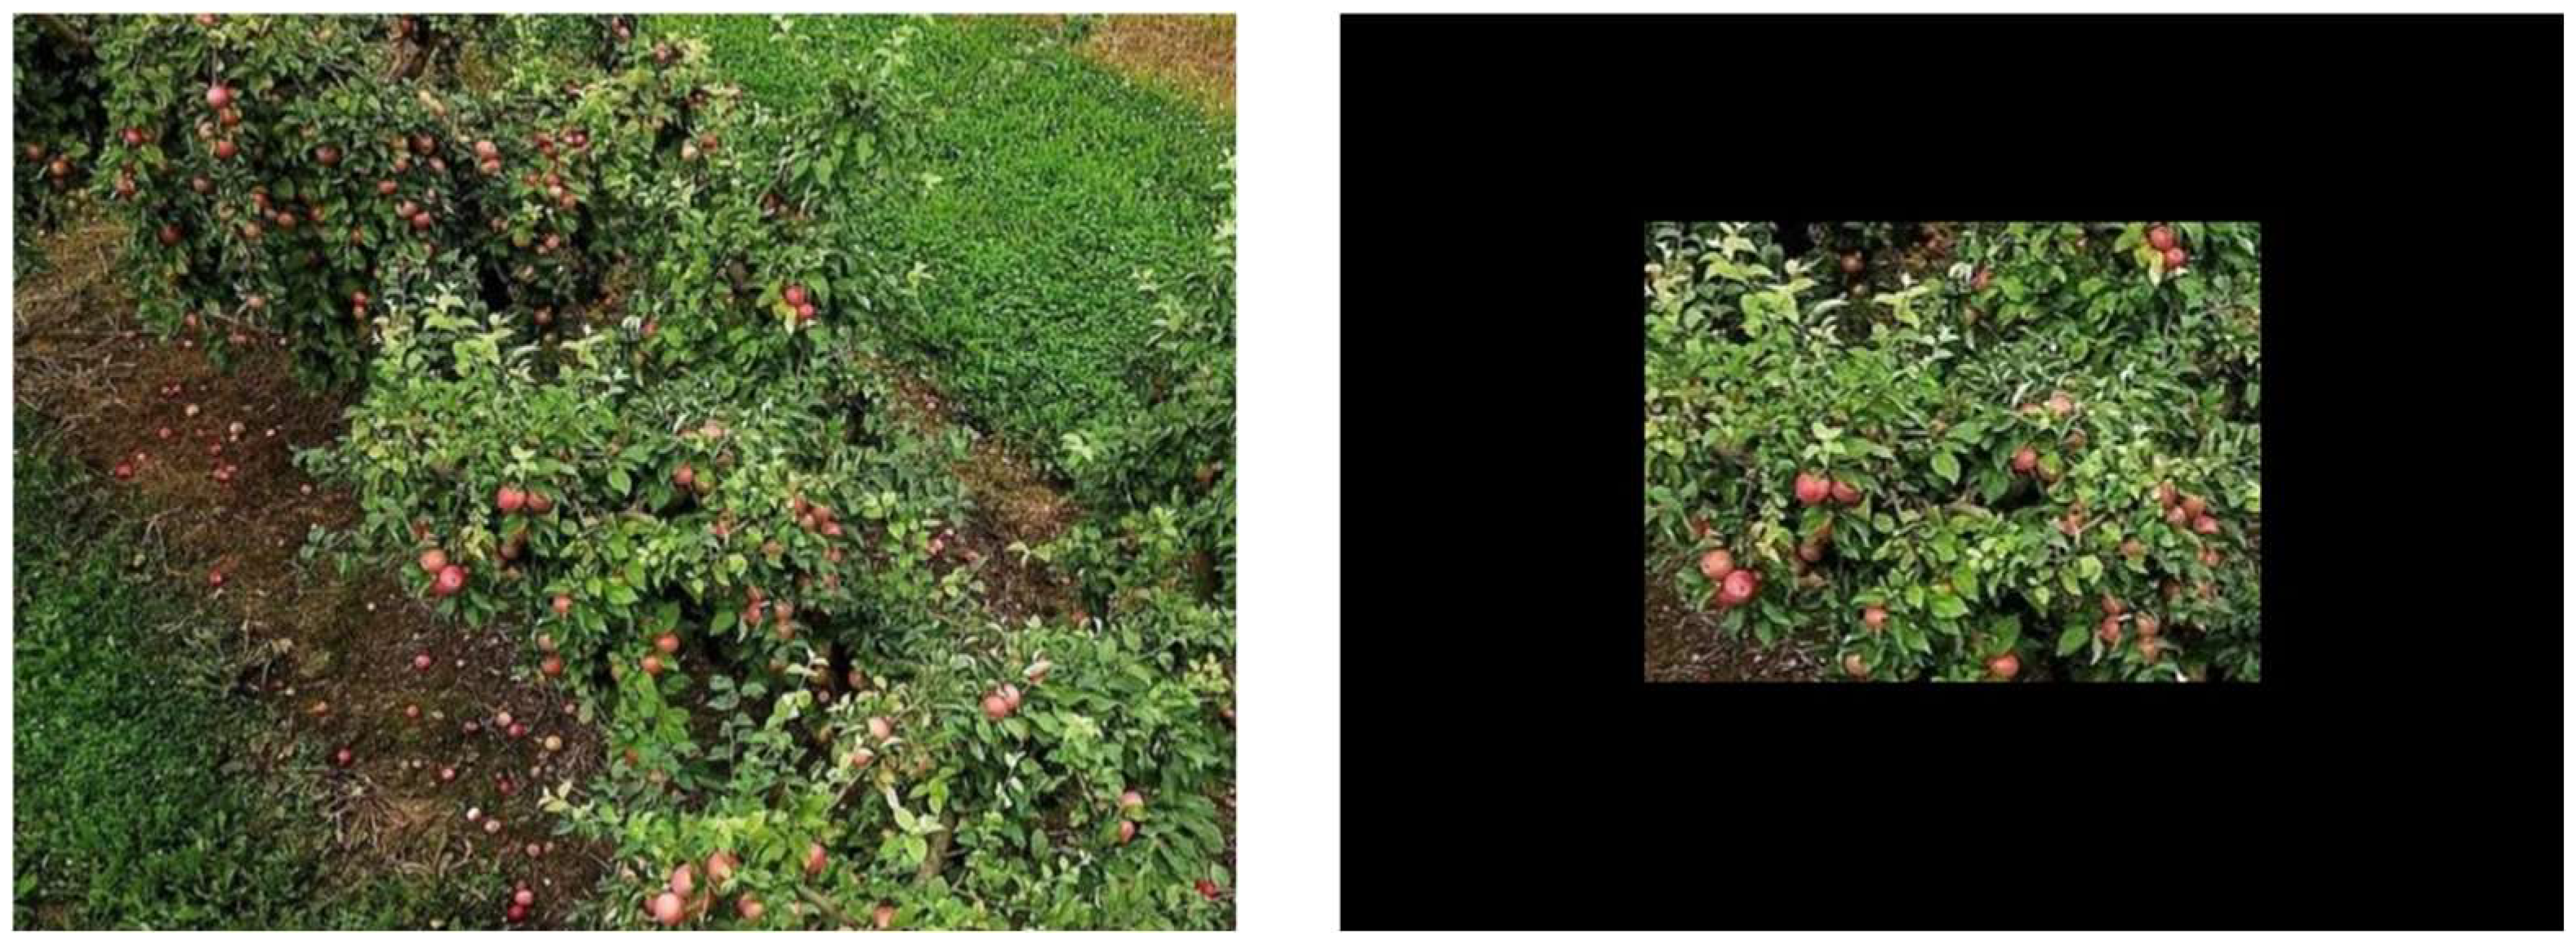
Images captured using drones during various activities often show non-target apple trees, so it is necessary to segment the area of interest to isolate the research entity. To address this issue, we developed a script utilizing the open source computer vision library OpenCV. This script generates an ROI (region of interest) mask on the original images around the study trees to isolate the target area. The algorithm in the script first calculates the center position of the image, and then defines an area of interest. It uses automatic methods to draw a white rectangle with a width of 1408 pixels and a height of 1056 pixels and applies it to the surrounding area of the region of interest. The closed surrounding area is represented in black. This approach works well with various fruit tree images and has excellent scalability. A schematic representation of the target area is shown in Figure 2.
Initially, we captured 300 high-resolution images of apple fruits using a drone. In order to optimize our dataset for training purposes, we applied various transformations to each raw image. These transformations included horizontal flips, vertical flips, and clockwise rotations of 180 degrees. To achieve these transformations, we utilized our Python scripts in conjunction with the Pillow library, an open source computer vision library. In addition to the original images, we also included a schematic diagram, as presented in Figure 3, which further enriched our dataset. Furthermore, to ensure uniformity, each image was resized to a fixed size of 640 pixels × 640 pixels. By employing our data enhancement method, we expanded our dataset from the original 300 images to a total of 900 images. To train our YOLOv5s model, the dataset was divided as follows: 80% of the images (720 images) were allocated for training, 20% (180 images) were assigned for validation to fine-tune the model’s parameters and prevent overfitting, and the initial 40 images acquired were reserved for testing to evaluate the model’s final performance. This careful division allowed for a fair assessment of the model’s performance and effectiveness, ensuring its robustness in real-life scenarios.
2.3. YOLOv5s Deep Learning Architecture
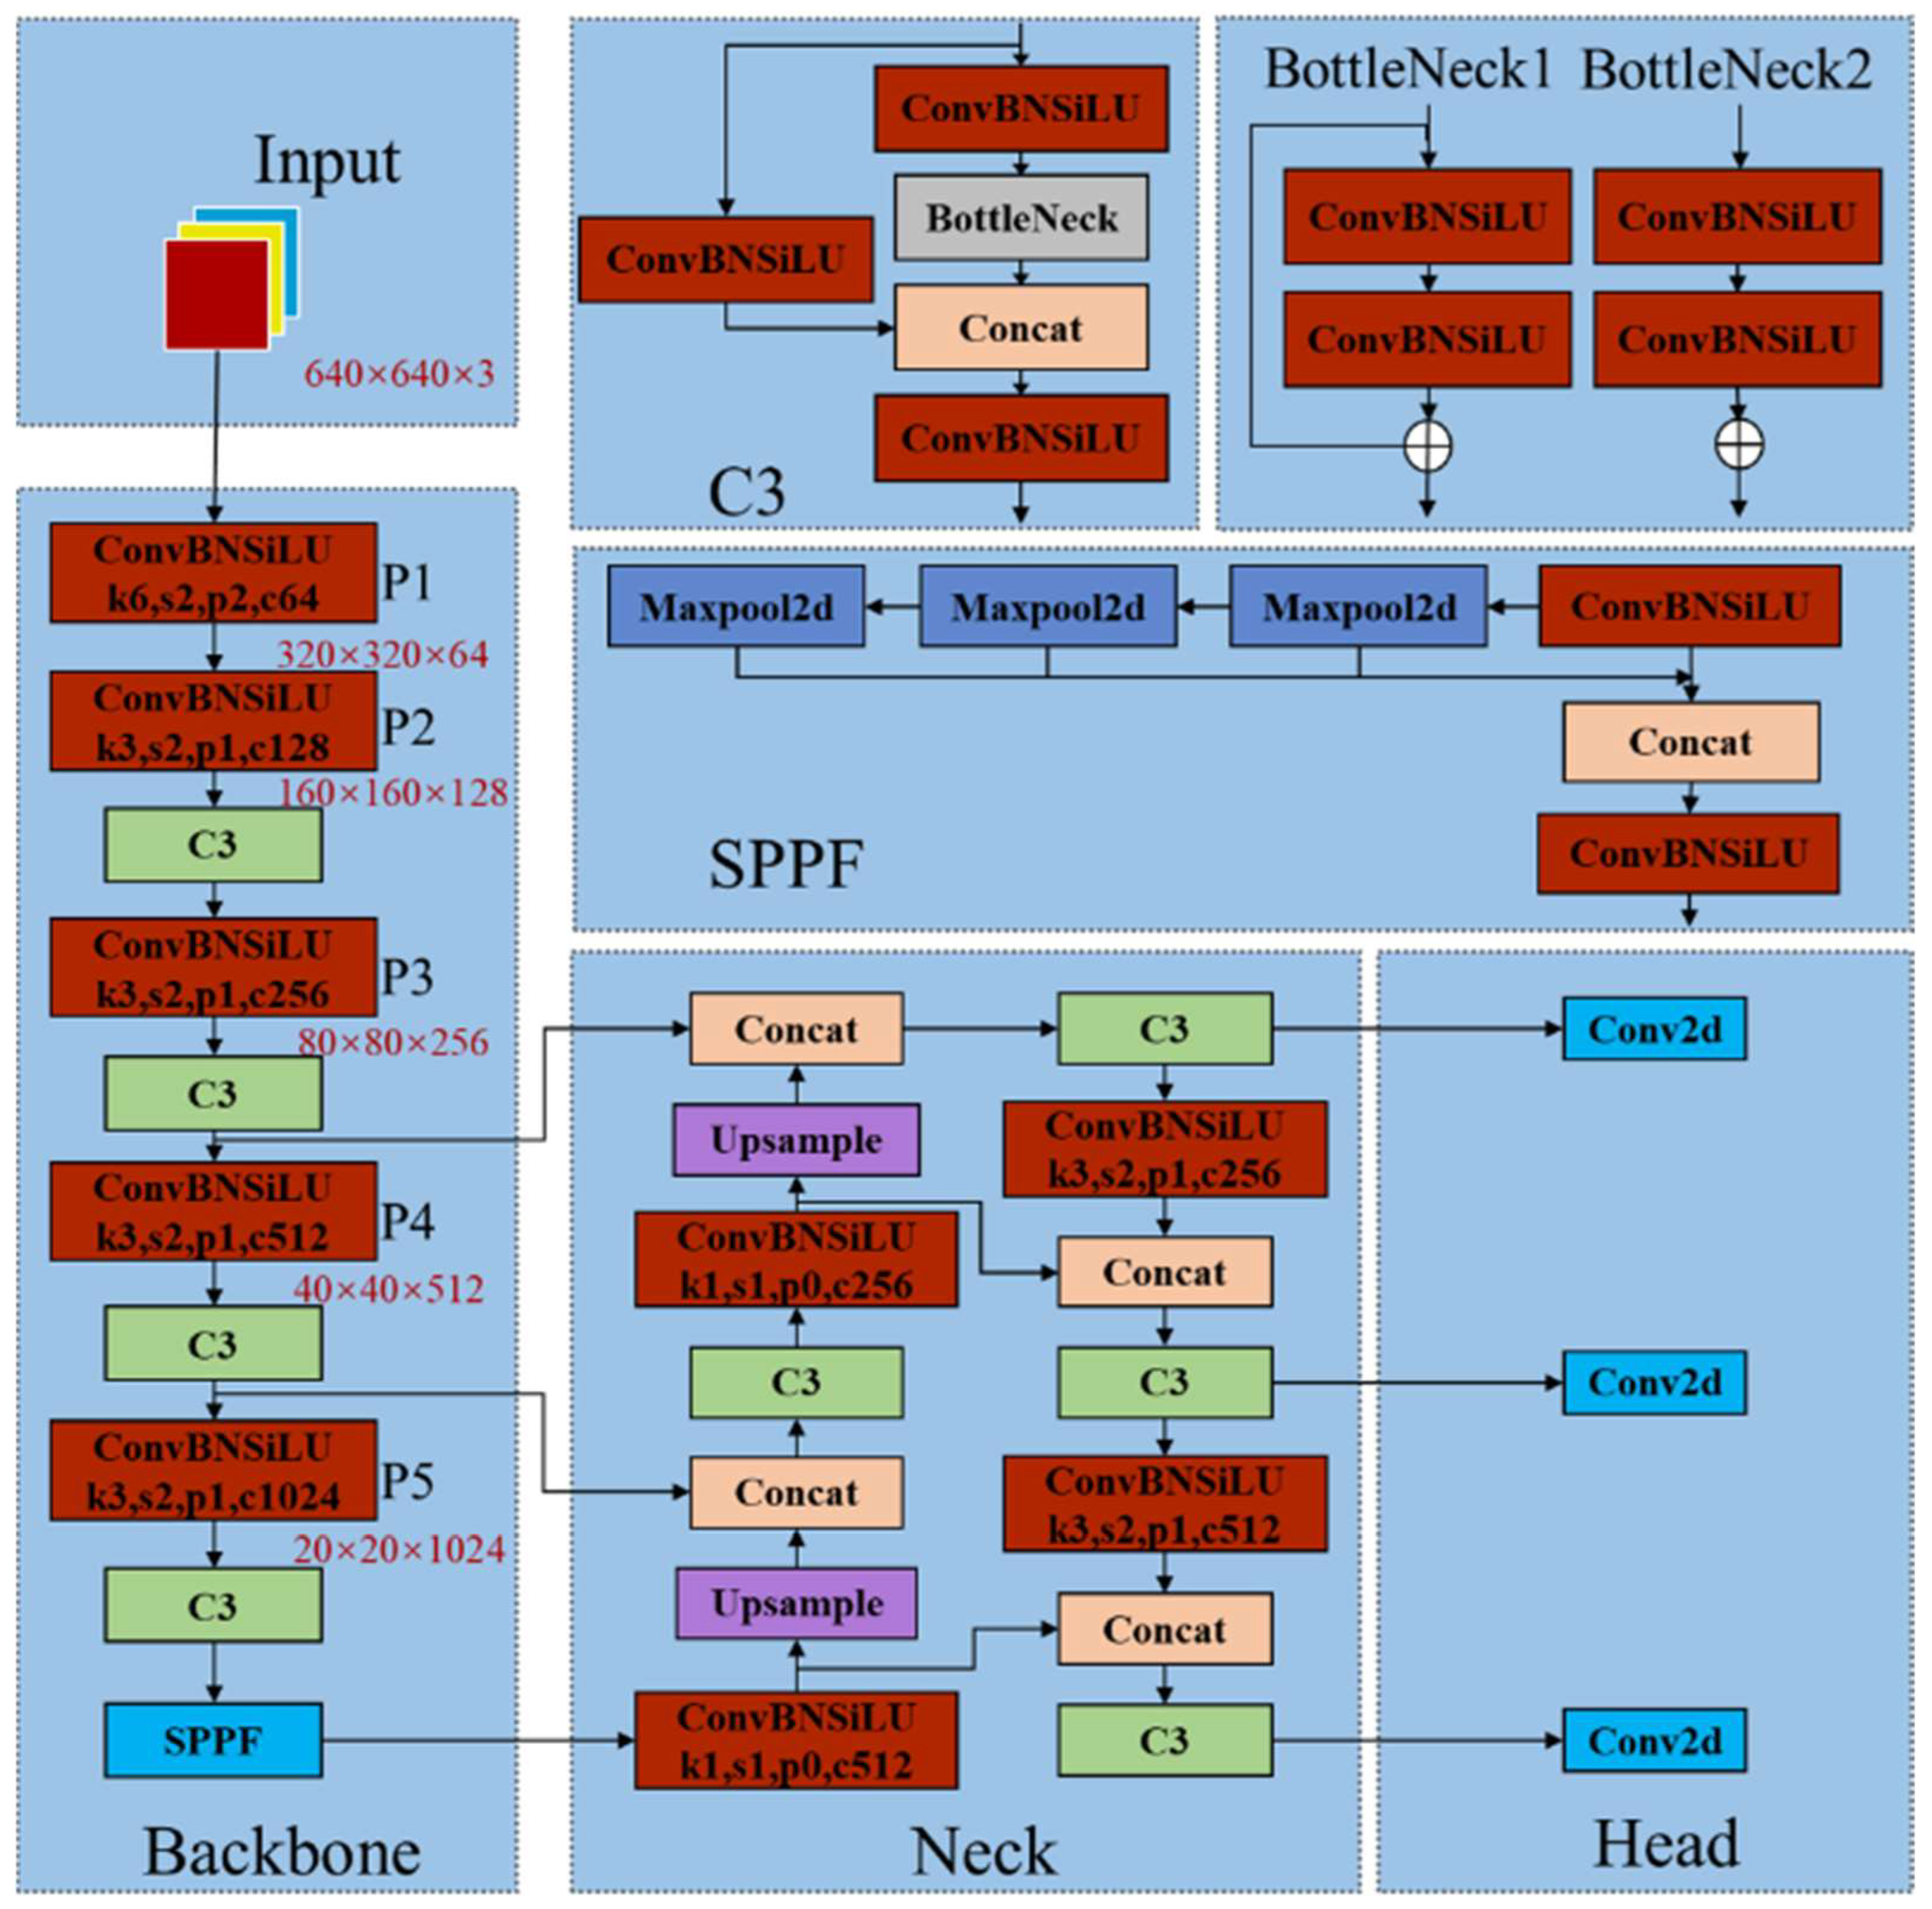
In the apple fruit target detection based on YOLOv5s, the network structure is divided into four parts: input, backbone, neck (a multi-scale feature fusion network), and head (the detection head), as shown in Figure 4. This hierarchical structure enables YOLOv5s to effectively capture the features of apple fruit and achieve accurate target detection.
The input end adopts methods such as mosaic data augmentation and adaptive anchor box computation to enrich the dataset and obtain the optimal size of the adapted anchor box. The backbone network is composed of CBS (Conv + BatchNorm + SiLU), C3, and SPPF modules. During the feature extraction phase, preprocessed images are fed into the backbone network to obtain the features of the detection target in different feature layers. These features are then fused through the feature fusion network. The neck part uses the Path Aggregation Network (PANet), which combines top-down and bottom-up structures. It can extract rich semantic features and compensate for the insufficiency of positional information in feature pyramids, thereby enhancing the network’s feature extraction capability. The detection heads draw features from different scales from the 3rd, 4th, and 5th layers of feature extraction for multi-scale detection. These three detection head scales are used to predict the position and category information of small, medium, and large targets, respectively. Through multi-scale detection, different sizes of apple fruits can be captured more comprehensively.
3. Improvements to the YOLOv5s Detection Algorithm
Our study aimed to explore the utilization of aerial drones in the detection of fruit on apple trees. We provide innovative insights into the primary factors that influence the performance of detection, such as the consistency of feature fusion, the difficulties faced in matching samples due to occlusion and dense arrangement, and the effectiveness of Non-Maximum Suppression (NMS) in detecting occluded fruit. Through our investigation, we identified these issues, which have not been thoroughly investigated in single-stage detection algorithms like YOLOv5s. Addressing these issues has the potential to improve the efficiency of detection algorithms and advance precision agriculture.
This article primarily focuses on the detection of fruits on apple trees. However, in the collected dataset, the actual fruit area is far less than 1% of the entire image, which classifies the task as small target detection. There are also situations where the fruit is obstructed. Through experiments, it was found that the performance of this network in detecting apple fruits in images taken using drones was suboptimal, with instances of missed detections or low detection accuracy. After analysis, three main reasons for this were identified:
- (1)
- Inconsistency in the feature fusion part: YOLOv5s uses PANet to fuse multi-scale features, obtaining richness in positional information and semantic information, thereby enhancing the feature extraction ability. However, for datasets containing small targets and complex scale changes, the fusion of different scale features may lead to inconsistent information, thereby affecting the accuracy of small target detection.
- (2)
- Sample matching problems caused by occlusion and dense arrangement: YOLOv5s is based on a single-stage detector algorithm and faces certain difficulties with occlusion and dense arrangement of apples on apple trees. Occlusion makes it difficult for the network to accurately identify occluded apples, which may lead to the partial coverage of bounding boxes or the misidentification of multiple apples as a single target. When apples are arranged densely, the network may be unable to accurately distinguish the boundaries between the apples, leading to the misidentification of multiple apples as a single target, or the expansion of a single apple to cover multiple apples. These sample matching problems can reduce the accuracy and recall of target detection, potentially leading to missed or false detections.
- (3)
- Poor handling of occluded fruits by NMS: NMS is a commonly used post-processing technique used to remove overlapping detection results to retain the most representative target box in YOLOv5s. However, NMS is not very effective at solving the problem of apple fruit occlusion. When the fruit is occluded, NMS might prematurely eliminate the occluded box, leading to missed detections. In addition, due to the complex size variations in apple fruits, overlapping fruits of different sizes may be present to varying degrees, and NMS might not adapt when setting thresholds, leading to the erroneous deletion or retention of fruits.
3.1. Receptive-Field Attention Convolution (RFAConv)
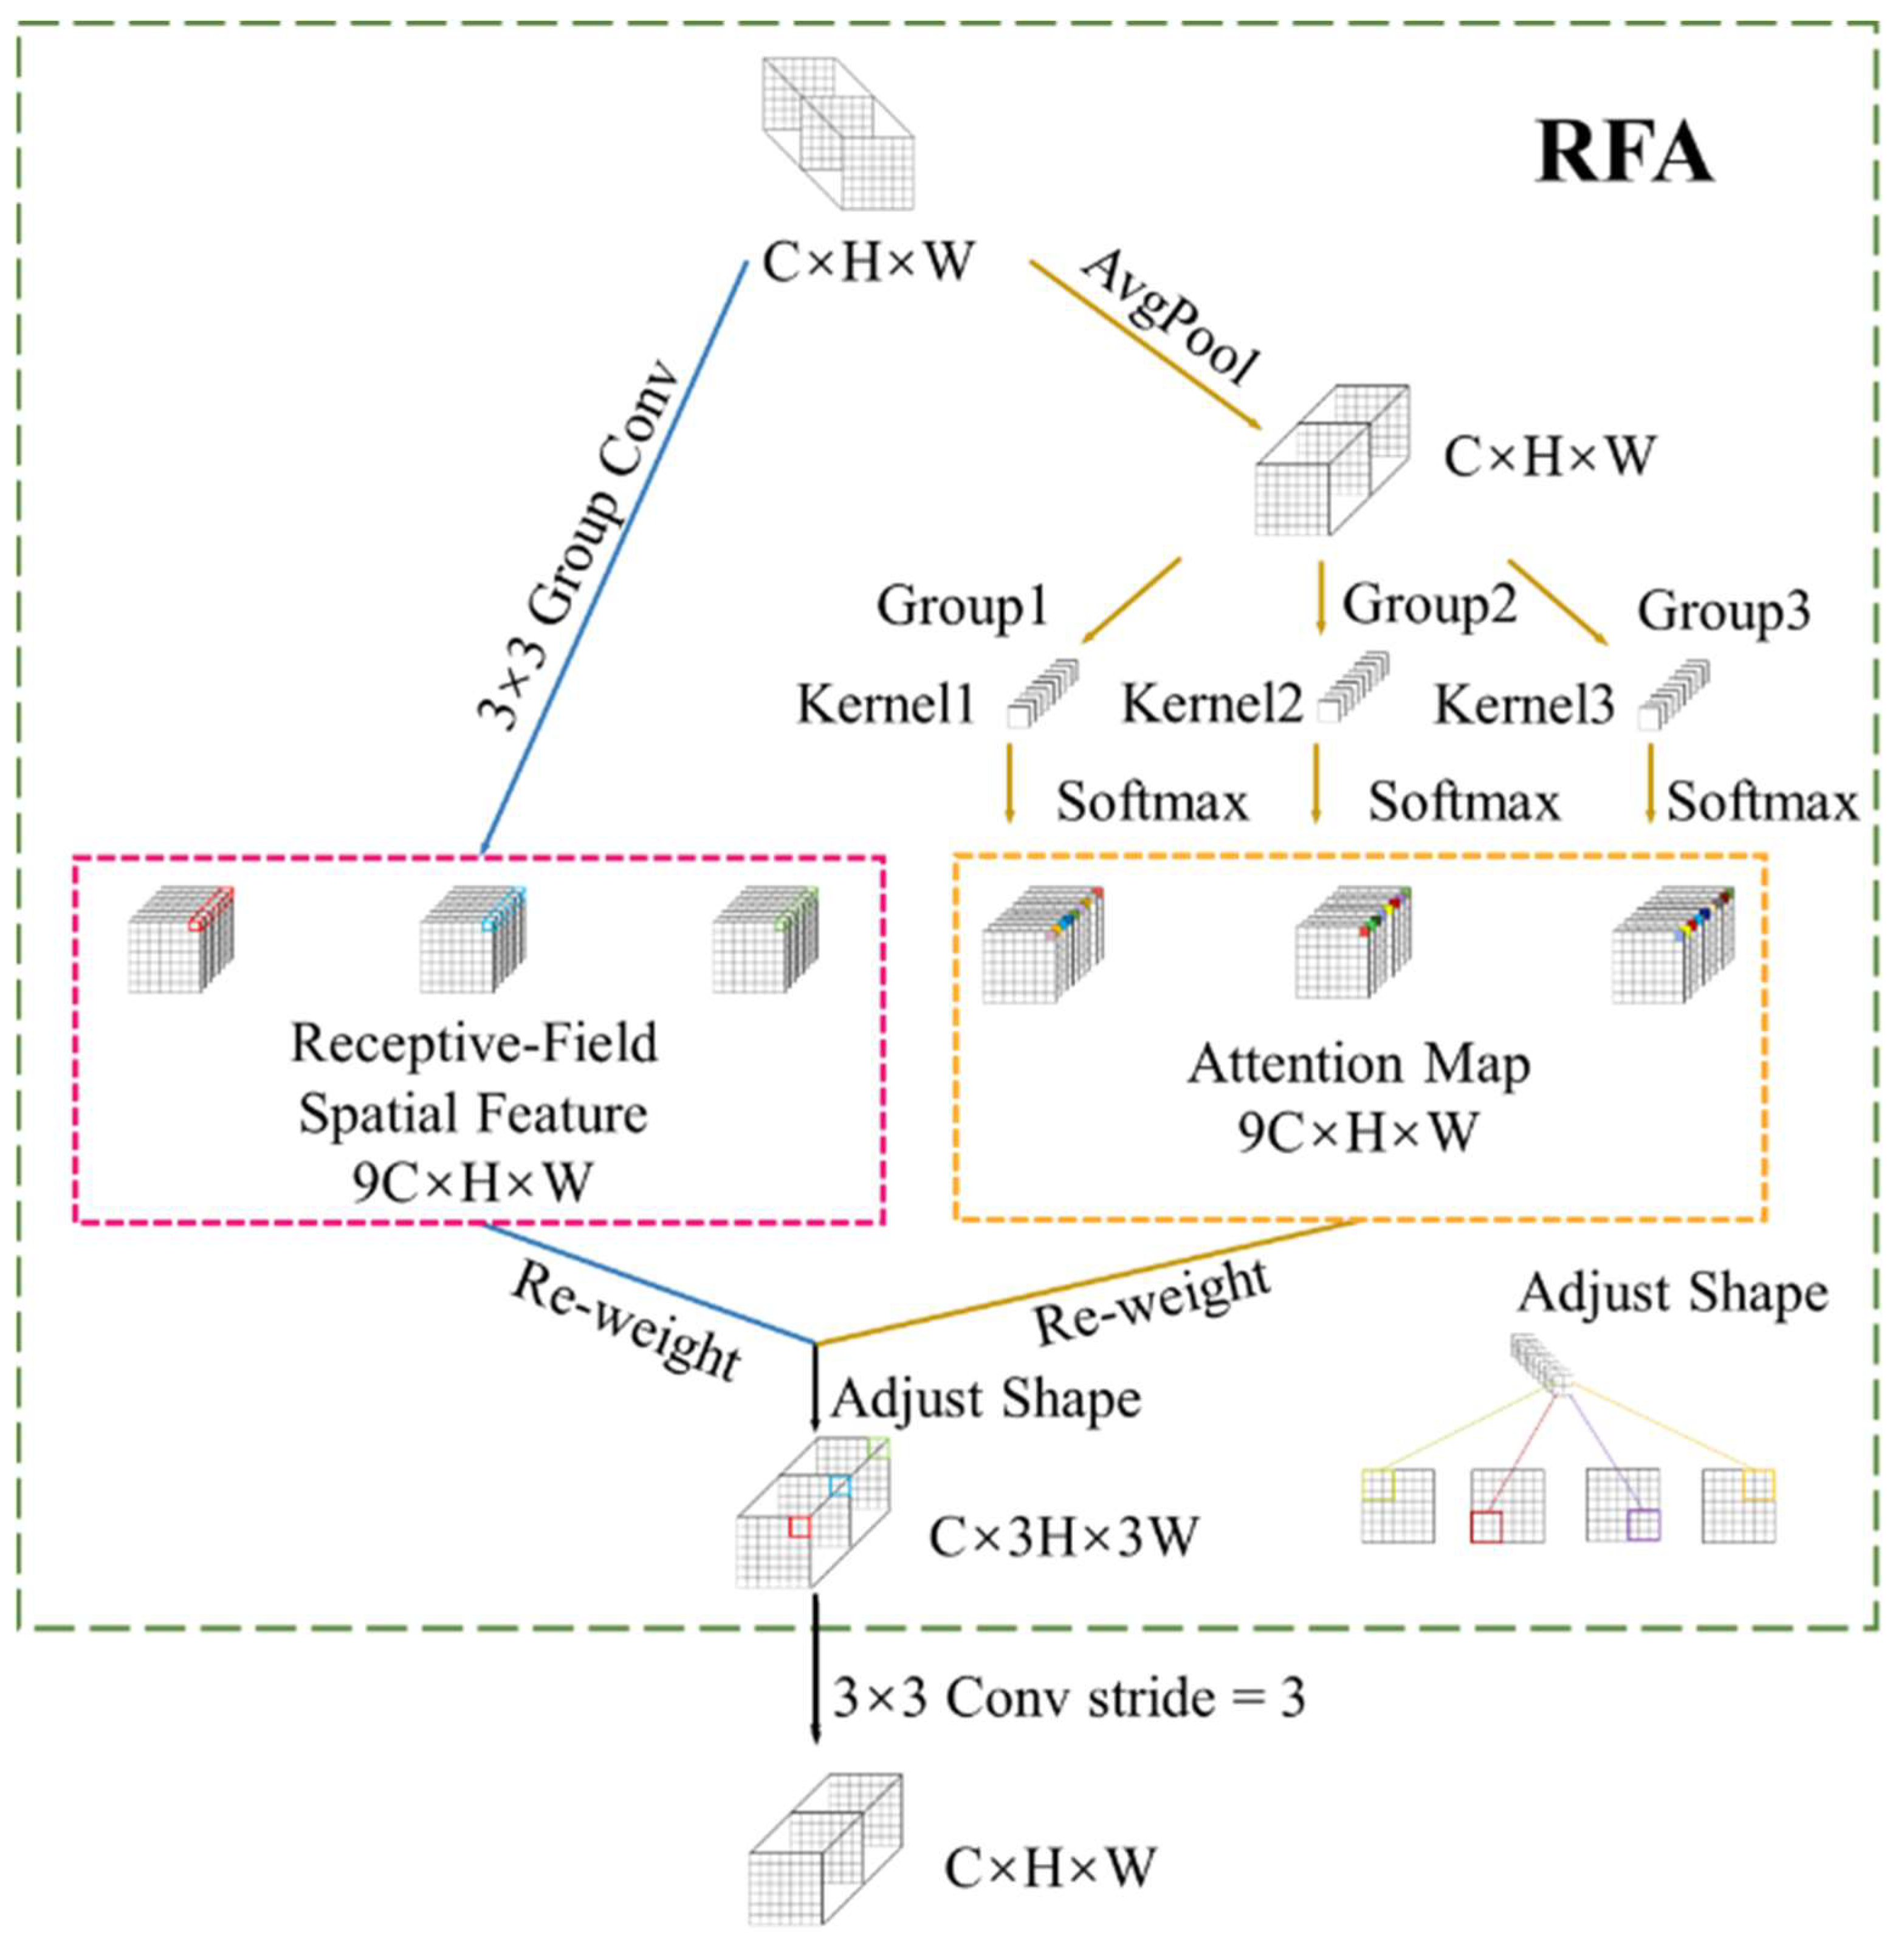
We improved the YOLOv5s model by introducing RFAConv. RFAConv is located after the convolution layer and adjusts the weight distribution of features within different receptive fields, highlighting important detailed features. The specific structure is shown in Figure 5. RFAConv uses a receptive field weight matrix to assign different weights to each receptive field position and feature channel, highlighting important detail information. In addition, RFAConv dynamically generates receptive field spatial features and adaptively adjusts the shape and range of the receptive field according to the size of the convolution kernel, accommodating different sizes of apple fruits. Smaller receptive fields are generated for small-sized fruits to retain fine details; larger receptive fields are generated for larger fruits to capture global features. Flexibly adjusting the size of the receptive field improves the detection accuracy for fruits of different sizes.
By integrating Receptive-Field Attention Convolution (RFAConv) into the YOLOv5s network, the performance of fruit detection in images of apple trees captured using drones was significantly enhanced. RFAConv emphasizes the detailed features of the apples, reduces information loss, and more accurately locates fruits and calculates the number of fruits, providing reliable data support for fruit farmers.
3.2. Dual-Feature Pooling (DFP) Structure
The detection of fruits on apple trees necessitates attention to detailed features. Small-sized fruits only occupy a tiny area of an image; therefore, details such as texture, color, and shape are crucial for distinguishing fruits. However, the high subsampling rate of the YOLOv5 model can easily lead to blurring or information loss of small fruits, affecting detection accuracy. To address this issue, we introduced a Dual-Feature Pooling (DFP) structure to enhance the model’s capability of detecting small objects, as shown in Figure 6.
The DFP structure includes three parts. Firstly, similar to the first part of CSPNet, it divides the three-level source features of the backbone network into two parts, reducing the limitations for small fruits and better preserving detailed features. Secondly, the second part merges features of different scales to form two feature pools, comprehensively integrating features for a better understanding of the fruits in an image. Lastly, the third part further combines the source features and feature pool outputs to increase the dimension of the detection head, improving the recognition and detection accuracy of occluded fruits. To further enhance performance, we introduced Interference Feature Filtering (IFF) and the Spatial Attention Module (SAM). The IFF module filters out interference features, allowing the network to focus more on fruit detection. The SAM enhances attention to fruit positions, improving localization accuracy.
By incorporating the Dual-Feature Pooling (DFP) structure into the YOLOv5 network, we successfully addressed the issues that existed in the original model. The introduction of DFP enables the model to better capture the detailed features of apple fruits and overcome the limitations in detecting small-sized fruits. Compared to traditional NMS algorithms, with the improvements brought about by DFP, the model can better handle potential occlusion between fruits, thus enhancing the accuracy and robustness of fruit quantity detection.
3.3. Soft-NMS (Soft Non-Maximum Suppression)
To address the potential issues arising with NMS when apple fruits are occluded, we employed Soft-NMS as a solution. Soft-NMS is a post-processing technique specifically designed for object detection, offering higher accuracy and effectiveness compared with traditional NMS. Soft-NMS suppresses overlapping bounding boxes by dynamically adjusting their confidences, incorporating a decay function to consider the overlap and distance relationship. This enables Soft-NMS to better handle occlusion and size variation in apple fruits, resulting in more accurate object detection results.
In this study, we applied Soft-NMS to apple fruit quantity detection, significantly enhancing accuracy and robustness. Even when fruits are occluded, the Soft-NMS post-processing algorithm increases the chances of preserving them, reducing the chances of missed detections. Additionally, Soft-NMS demonstrates flexibility in adapting to fruits of different sizes and complex overlapping scenarios, further improving detection accuracy.
4. Experiment and Analysis
4.1. Training Deep Learning Models
To ensure precise labeling of the training dataset, we utilized an open source annotation tool called LabelImg. This tool allowed us to accurately determine the exact location of each apple fruit in 900 images. LabelImg proved to be invaluable in streamlining our manual labeling process, thanks to its user-friendly interface and efficient performance. It enabled us to set object bounding boxes with great accuracy, which is especially important for small-scale objects like the apple fruits in our study. Once the annotation was completed, an Extensible Markup Language (XML) file was generated for each image, containing label data and information on the precise location of all targets in the image. The use of LabelImg not only ensured consistency in our data annotation but also greatly enhanced the stability and accuracy of the detection model.
After annotating the dataset, we needed to configure the computational hardware for the selected deep learning model to ensure efficient and accurate training. The software version and hardware configuration parameters used in this study are listed in Table 1.
In our experiments, we used the following specific parameters to train the model: an epoch of 100, a batch size of 32, and a learning rate of 0.001. These parameters ensured the accurate and gradual updating of network parameters during the learning process. To prevent overfitting the network, we applied a weight decay of 0.0005. For the optimizer selection, we chose the Stochastic Gradient Descent with Momentum (SGD) method, with the momentum value set at 0.928.
4.2. Evaluation Metrics
When evaluating the performance of a YOLOv5s object detection algorithm, the mean Average Precision (mAP) is commonly used to measure the accuracy of the model in recognizing object categories and their positions. Precision (P) and recall (R) together determine the mAP.
In fruit image detection, precision represents the ratio of correctly predicted fruit samples to all predicted samples, while recall represents the ratio of correctly predicted fruit samples to all actual fruit samples. True Positive (TP) indicates the number of times the algorithm correctly detects a fruit, False Positive (FP) represents the number of times the algorithm mistakenly detects a non-fruit as a fruit, and False Negative (FN) represents the number of times the algorithm fails to detect a fruit in a specific image. By calculating precision and recall, we can evaluate the accuracy and recall ability of the algorithm in fruit image detection. The specific formulas for calculation are as follows:
The F1 score combines precision and recall to provide a comprehensive evaluation of the classifier’s performance. The specific formulas for calculating precision, recall, and the F1 score are as follows:
The F1 score ranges from 0 to 1, with values closer to 1 indicating a better performance by the classifier.
Due to the negative correlation between precision and recall, we can use Average Precision (AP) to measure the performance of the model. AP is calculated by computing the area under the precision–recall curve. The curve area is formed by n different points of precision and recall. A higher AP value indicates a better performance of the model at different thresholds. The specific formula for calculation is as follows:
where is the accuracy rate when the recall rate is , and is the maximum accuracy rate corresponding to a recall rate greater than or equal to R.
AP measures the performance of the trained model for each individual class, representing the precision achieved for each class. Meanwhile, mAP is calculated as the average of the obtained AP values, and it measures the overall performance of the model across all classes.
where k represents the number of categories in the dataset. mAP can not only be used to measure the detection accuracy of the model but also to evaluate the detection speed of the model by considering the Frames Per Second (FPS), which represents the number of image frames the model can process per unit of time.
5. Results and Analysis
5.1. Ablation Experiment
This experiment strictly maintained the consistency of all data parameters and environmental configurations. Object detection was performed on a self-collected dataset, and precision, recall, mAP, F1 score, and FPS were used as evaluation metrics for the experiment. In this study, improvements were made based on the YOLOv5s model. In order to assess the performance of the improved method and compare it with other methods, a series of ablation experiments were conducted. In the following sections, a description of the methods used will be introduced first, as shown in Table 2. Subsequently, detailed experimental results will be presented, as shown in Table 3.
In Table 2, Method A, Method B, and Method C represent improvements applied to the original YOLOv5s model using the RFA module, DFP module, and Soft-NMS algorithm, respectively. Method D represents the integration of all three modules. From the table, it is evident that after individually applying these three modules to the dataset, the mAP improved by 0.021, 0.025, and 0.01, respectively. These results indicate that these improvement modules are reasonable and effective at addressing the small object detection task. The integration of the three modules (Method D) led to a significant improvement in precision, recall, mAP, and F1 score. Specifically, the precision and recall values reached 0.954 and 0.963, respectively, while the mAP was an impressive 0.985. Compared with the original model, the integrated model showed a 3.6% increase in detection accuracy. This suggests that the integrated model enhances feature extraction capabilities, resolves issues related to sample matching and occlusion, enables more accurate object detection, and exhibits a superior overall performance. This validates the effectiveness of the proposed improved method in small object detection tasks for unmanned aerial vehicle (UAV) imagery. It is worth noting that adding attention mechanisms increased model computation and decreased the FPS by 7 percentage points. However, this did not substantially affect the real-time detection performance of the model. Considering the overall analysis, sacrificing inference speed slightly to improve detection accuracy is acceptable, and the proposed improved method achieved good results in small object detection.
5.2. Results and Discussion
The YOLOv5s deep learning model was used for apple fruit detection on apple trees. To visually demonstrate the effectiveness of the proposed improved method, the training results for each improved method are displayed, with all parameters falling within an acceptable range. The curves for this task are shown in Figure 7.
To visually demonstrate the effectiveness of the proposed improved method, the original training results for YOLOv5s and the training results for each method are presented. Figure 7 shows a comparison between the proposed improved methods and the original method. In observing Figure 7a, it is clear that the mAP value of the proposed improved methods for the self-collected dataset was significantly higher than that of YOLOv5s. Further comparative analysis revealed that the proposed improved methods converged faster in terms of mAP, with Method D showing the most significant advantage. These results further validate the excellent performance of Method D in the object detection task. Figure 7b shows that Method D exhibited a faster convergence rate during training. With an increasing number of training epochs, it can efficiently learn the features and patterns of the object detection task from the training data. Additionally, after convergence, Method D demonstrated a lower loss value compared with other methods, indicating its ability to accurately predict the position and category of objects and achieve higher recognition accuracy. Figure 7c demonstrates that Method D had higher inflection points on the P-R curve and a larger area under the curve, which indicates its significant advantage in object detection tasks. Method D maintained high precision and recall simultaneously, accurately captured the position and category of objects, and improved the accuracy of object detection. Therefore, Method D exhibited higher precision and recall at different thresholds, providing a more comprehensive approach for object recognition.
An objective fruit detection model based on object detection is essential for practical applications, especially in accurately and efficiently estimating fruit yield. Our innovative ensemble model demonstrated a superior performance compared with the model developed by Shang et al. in their 2023 study [20]. Specifically, our model achieved an accuracy score of 0.954, a recall rate of 0.963, and a mAP score of 0.985. These results show significant improvements over Shang et al.’s model, for which they reported an accuracy score of 0.884, a recall rate of 0.861, and a mAP score of 0.918. The higher numerical values achieved by our model indicate its ability to detect the majority of fruits in most cases and provide reliable yield estimates. Additionally, our model exhibited exceptional resilience when faced with environmental obstacles, including variations in color. While it may not detect all discernible fruits, it remains an indispensable tool in the industry due to its promising outcomes and efficiency. Consequently, the fruit detection model based on object detection proves to be not only practical but also significantly superior in practice. The positive empirical findings provide strong evidence of the efficacy and stability of our ensemble model in predicting apple yield, thereby contributing to the advancement of the fruit sector.
Figure 8 visually presents the detection results for each method. An analysis of the graphs indicated that in the apple fruit detection task with a complex background, Method D surpassed its counterparts with 38 detections. These findings demonstrate the superior performance of Method D in handling complex and high-volume target detection tasks. This performance aligns with the findings of the original article, which highlights Method D’s superiority in key metrics such as mAP, precision, and recall.
While fruit detection models based on object detection have their limitations, their unique advantages should not be overlooked. One primary limitation is their inability to accurately identify invisible fruits that are obscured by foliage or other fruits, which can result in incomplete detection. However, these models effectively detect most visible fruits by leveraging factors like the color, texture, and contour of fruits (e.g., apples) in the canopy. Table 4 illustrates the distinct discrepancies between the fruit quantities obtained through manual counting and model detection. These findings suggest that simple data refinement techniques could enhance the effectiveness of this integrated model in developing a reliable instrument for high-yield estimation. Thus, the integrated model demonstrates high accuracy and robustness. Furthermore, it has the potential to leverage data enhancement techniques for further advances in the field of fruit detection.
6. Conclusions
In this study, an improved object detection method based on the YOLOv5s approach was proposed for images of small objects such as apples taken with unmanned aerial vehicles (UAVs). The improved method includes the RFA module, which introduces the receptive field attention mechanism to better highlight important details by adjusting the weight distribution within different receptive fields. Additionally, the Dual-Feature Pyramid (DFP) structure was employed to enhance detection accuracy by integrating source features from different levels and increasing the dimensionality of the detection heads. Moreover, the Soft-NMS algorithm was used instead of the traditional NMS algorithm to dynamically adjust the confidence of overlapping bounding boxes, effectively handling occlusion and size variation in small objects. The experimental results show that the improved method achieved significant improvements in performance for the small object UAV image dataset, with an increase in mAP value of 6.2%. These results fully demonstrate the effectiveness and universality of the proposed improved method in small object detection tasks. In terms of future development prospects, further investigations will focus on enhancing real-time performance to accelerate inference speed while simultaneously improving detection accuracy. This will result in improved performance and outcomes for real-world application scenarios. For instance, it will enable swift identification and localization of ripe fruit in automated apple picking, thereby enhancing overall production efficiency. Moreover, this enhanced method can also be extended to address similar tasks involving the detection of small targets, such as environmental monitoring and agricultural pest identification. Consequently, it holds significant potential for a wide range of applications. We firmly believe that as the method continues to be optimized and refined, it will generate practical value and make a positive impact across various domains.
Author Contributions
Conceptualization, H.W.; methodology, H.Y.; software, J.F.; validation, J.F.; formal analysis, J.F.; investigation, H.Y.; resources, H.Y.; data curation, J.F.; writing—original draft preparation, H.W.; writing—review and editing, H.W.; visualization, J.F.; supervision, H.W.; project administration, H.W.; funding acquisition, H.W. All authors have read and agreed to the published version of the manuscript.
Funding
This research was funded by the National Science Foundation of China (grant number 11772225) and Tianjin Municipal Education Commission Scientific Research Plan Project (grant number 2022ZD002).
Institutional Review Board Statement
Not applicable.
Data Availability Statement
The data will be made available on request.
Conflicts of Interest
The authors declare no conflict of interest.
References
- Zhu, Y.L.; Wu, S.S.; Qin, M.J.; Fu, Z.Y.; Gao, Y.; Wang, Y.Y.; Du, Z.H. A deep learning crop model for adaptive yield estimation in large areas. Int. J. Appl. Earth Obs. Geoinf. 2022, 110, 11. [Google Scholar] [CrossRef]
- Alibabaei, K.; Gaspar, P.D.; Lima, T.M. Crop Yield Estimation Using Deep Learning Based on Climate Big Data and Irrigation Scheduling. Energies 2021, 14, 3004. [Google Scholar] [CrossRef]
- Mohimont, L.; Alin, F.; Rondeau, M.; Gaveau, N.; Steffenel, L.A. Computer Vision and Deep Learning for Precision Viticulture. Agronomy 2022, 12, 2463. [Google Scholar] [CrossRef]
- Joshi, A.; Pradhan, B.; Gite, S.; Chakraborty, S. Remote-Sensing Data and Deep-Learning Techniques in Crop Mapping and Yield Prediction: A Systematic Review. Remote Sens. 2023, 15, 2014. [Google Scholar] [CrossRef]
- Di, Y.; Gao, M.F.; Feng, F.K.; Li, Q.; Zhang, H.J. A New Framework for Winter Wheat Yield Prediction Integrating Deep Learning and Bayesian Optimization. Agronomy 2022, 12, 3194. [Google Scholar] [CrossRef]
- Castro-Garcia, S.; Blanco-Roldán, G.L.; Ferguson, L.; González-Sánchez, E.J.; Gil-Ribes, J.A. Frequency response of late-season ‘Valencia’ orange to selective harvesting by vibration for juice industry. Biosyst. Eng. 2017, 155, 77–83. [Google Scholar] [CrossRef]
- Apolo-Apolo, O.E.; Martínez-Guanter, J.; Egea, G.; Raja, P.; Pérez-Ruiz, M. Deep learning techniques for estimation of the yield and size of citrus fruits using a UAV. Eur. J. Agron. 2020, 115, 11. [Google Scholar] [CrossRef]
- Chen, R.Q.; Zhang, C.J.; Xu, B.; Zhu, Y.H.; Zhao, F.; Han, S.Y.; Yang, G.J.; Yang, H. Predicting individual apple tree yield using UAV multi-source remote sensing data and ensemble learning. Comput. Electron. Agric. 2022, 201, 15. [Google Scholar] [CrossRef]
- Gao, F.F.; Fang, W.T.; Sun, X.M.; Wu, Z.C.; Zhao, G.A.; Li, G.; Li, R.; Fu, L.S.; Zhang, Q. A novel apple fruit detection and counting methodology based on deep learning and trunk tracking in modern orchard. Comput. Electron. Agric. 2022, 197, 11. [Google Scholar] [CrossRef]
- Zhao, F.K.; Xu, L.Z.; Lv, L.Y.; Zhang, Y. Wheat Ear Detection Algorithm Based on Improved YOLOv4. Appl. Sci. 2022, 12, 12195. [Google Scholar] [CrossRef]
- Jin, X.B.; Yu, X.H.; Wang, X.Y.; Bai, Y.T.; Su, T.L.; Kong, J.L. Deep Learning Predictor for Sustainable Precision Agriculture Based on Internet of Things System. Sustainability 2020, 12, 1433. [Google Scholar] [CrossRef]
- Nasir, I.M.; Bibi, A.; Shah, J.H.; Khan, M.A.; Sharif, M.; Iqbal, K.; Nam, Y.; Kadry, S. Deep Learning-Based Classification of Fruit Diseases: An Application for Precision Agriculture. CMC-Comput. Mater. Contin. 2021, 66, 1949–1962. [Google Scholar] [CrossRef]
- Punithavathi, R.; Rani, A.D.C.; Sughashini, K.R.; Kurangi, C.; Nirmala, M.; Ahmed, H.F.T.; Balamurugan, S.P. Computer Vision and Deep Learning-enabled Weed Detection Model for Precision Agriculture. Comput. Syst. Sci. Eng. 2023, 44, 2759–2774. [Google Scholar] [CrossRef]
- Bose, P.; Kasabov, N.K.; Bruzzone, L.; Hartono, R.N. Spiking Neural Networks for Crop Yield Estimation Based on Spatiotemporal Analysis of Image Time Series. IEEE Trans. Geosci. Remote Sens. 2016, 54, 6563–6573. [Google Scholar] [CrossRef]
- Coulibaly, S.; Kamsu-Foguem, B.; Kamissoko, D.; Traore, D. Deep neural networks with transfer learning in millet crop images. Comput. Ind. 2019, 108, 115–120. [Google Scholar] [CrossRef]
- Chew, R.; Rineer, J.; Beach, R.; O’Neil, M.; Ujeneza, N.; Lapidus, D.; Miano, T.; Hegarty-Craver, M.; Polly, J.; Temple, D.S. Deep Neural Networks and Transfer Learning for Food Crop Identification in UAV Images. Drones 2020, 4, 7. [Google Scholar] [CrossRef]
- Sun, H.N.; Xu, H.W.; Liu, B.; He, D.J.; He, J.R.; Zhang, H.X.; Geng, N. MEAN-SSD: A novel real-time detector for apple leaf diseases using improved light-weight convolutional neural networks. Comput. Electron. Agric. 2021, 189, 11. [Google Scholar] [CrossRef]
- Pang, Y.; Shi, Y.Y.; Gao, S.C.; Jiang, F.; Veeranampalayam-Sivakumar, A.N.; Thompson, L.; Luck, J.; Liu, C. Improved crop row detection with deep neural network for early-season maize stand count in UAV imagery. Comput. Electron. Agric. 2020, 178, 10. [Google Scholar] [CrossRef]
- Wang, Z.P.; Jin, L.Y.; Wang, S.; Xu, H.R. Apple stem/calyx real-time recognition using YOLO-v5 algorithm for fruit automatic loading system. Postharvest Biol. Technol. 2022, 185, 11. [Google Scholar] [CrossRef]
- Shang, Y.Y.; Xu, X.S.; Jiao, Y.T.; Wang, Z.; Hua, Z.X.; Song, H.B. Using lightweight deep learning algorithm for real-time detection of apple flowers in natural environments. Comput. Electron. Agric. 2023, 207, 12. [Google Scholar] [CrossRef]
- Dias, P.A.; Tabb, A.; Medeiros, H. Apple flower detection using deep convolutional networks. Comput. Ind. 2018, 99, 17–28. [Google Scholar] [CrossRef]
- Su, F.; Zhao, Y.P.; Shi, Y.X.; Zhao, D.; Wang, G.H.; Yan, Y.F.; Zu, L.L.; Chang, S.Y. Tree Trunk and Obstacle Detection in Apple Orchard Based on Improved YOLOv5s Model. Agronomy 2022, 12, 2427. [Google Scholar] [CrossRef]
- Yan, B.; Fan, P.; Lei, X.Y.; Liu, Z.J.; Yang, F.Z. A Real-Time Apple Targets Detection Method for Picking Robot Based on Improved YOLOv5. Remote Sens. 2021, 13, 1619. [Google Scholar] [CrossRef]
- Xu, Z.B.; Huang, X.P.; Huang, Y.; Sun, H.B.; Wan, F.X. A Real-Time Zanthoxylum Target Detection Method for an Intelligent Picking Robot under a Complex Background, Based on an Improved YOLOv5s Architecture. Sensors 2022, 22, 682. [Google Scholar] [CrossRef] [PubMed]
Figure 1.
Schematic diagram of on-site image collection by drone.

Figure 2.
Original image of apple tree (left) and masked image (right).

Figure 3.
Schematic diagram of dataset supplementation.

Figure 4.
Network model diagram of YOLOv5s.

Figure 5.
Detailed structure of RFA.

Figure 6.
Detailed structures of DFP and PAN.

Figure 7.
Training results for the improved YOLOv5s network.

Figure 8.
Detection results for improved YOLOv5s network.


Table 1.
Software and hardware environment parameters.
| Name | Parameters/Version |
|---|---|
| Operating System | Windows 11 |
| CPU | AMD Ryzen 7 6800H |
| GPU | NVIDIA GeForce RTX3060 |
| RAM | 16 GB (8 GB × 2) |
| Python | V3.8.5 |
| Pytorch | V1.10.0 |
| CUDA | V11.3 |
| OpenCV | V4.6.0 |
| Yolov5s | V5.0 |
Table 2.
Description of the methods.
| Method Definition | RFA | DFP | Soft-NMS |
|---|---|---|---|
| YOLOv5s | |||
| A | √ | ||
| B | √ | ||
| C | √ | ||
| D | √ | √ | √ |
The symbol √ indicates the method that has been chosen.
Table 3.
Experimental Results (Precision, Recall, mAP, F1 score, FPS).
| Method | Precision | Recall | mAP | F1 Score | FPS |
|---|---|---|---|---|---|
| YOLOv5s | 0.918 | 0.895 | 0.923 | 0.905 | 32 |
| A | 0.939 | 0.928 | 0.947 | 0.933 | 29 |
| B | 0.943 | 0.931 | 0.953 | 0.939 | 27 |
| C | 0.928 | 0.946 | 0.962 | 0.942 | 31 |
| D | 0.954 | 0.963 | 0.985 | 0.958 | 25 |
Table 4.
The number of fruits manually counted and the number of fruits detected with the model.
| Tree | Manual Count | Model Detection | Error (%) |
|---|---|---|---|
| 1 | 215 | 203 | 5.58 |
| 2 | 163 | 155 | 4.91 |
| 3 | 188 | 176 | 6.38 |
| 4 | 152 | 145 | 4.61 |
| 5 | 237 | 220 | 7.17 |
| 6 | 223 | 209 | 6.28 |
| 7 | 193 | 181 | 6.22 |
| 8 | 172 | 162 | 5.81 |
| 9 | 149 | 141 | 5.70 |
| 10 | 248 | 227 | 8.47 |
| 11 | 262 | 239 | 8.79 |
| 12 | 251 | 233 | 7.17 |
| 13 | 183 | 172 | 6.01 |
| 14 | 176 | 165 | 6.25 |
| 15 | 169 | 159 | 5.92 |
| 16 | 197 | 185 | 6.09 |
| 17 | 233 | 211 | 9.44 |
| 18 | 215 | 201 | 6.51 |
| 19 | 158 | 150 | 5.06 |
| 20 | 165 | 158 | 4.24 |
| Average value | 197.45 | 184.6 | 6.33 |
Disclaimer/Publisher’s Note: The statements, opinions and data contained in all publications are solely those of the individual author(s) and contributor(s) and not of MDPI and/or the editor(s). MDPI and/or the editor(s) disclaim responsibility for any injury to people or property resulting from any ideas, methods, instructions or products referred to in the content. |
© 2023 by the authors. Licensee MDPI, Basel, Switzerland. This article is an open access article distributed under the terms and conditions of the Creative Commons Attribution (CC BY) license (https://creativecommons.org/licenses/by/4.0/).
Share and Cite
MDPI and ACS Style
Wang, H.; Feng, J.; Yin, H. Improved Method for Apple Fruit Target Detection Based on YOLOv5s. Agriculture 2023, 13, 2167. https://doi.org/10.3390/agriculture13112167
AMA Style
Wang H, Feng J, Yin H. Improved Method for Apple Fruit Target Detection Based on YOLOv5s. Agriculture. 2023; 13(11):2167. https://doi.org/10.3390/agriculture13112167
Chicago/Turabian StyleWang, Huaiwen, Jianguo Feng, and Honghuan Yin. 2023. "Improved Method for Apple Fruit Target Detection Based on YOLOv5s" Agriculture 13, no. 11: 2167. https://doi.org/10.3390/agriculture13112167
Note that from the first issue of 2016, this journal uses article numbers instead of page numbers. See further details here.