
Changes in Polar Metabolites during Seed Germination and Early Seedling Development of Pea, Cucumber, and Wheat

Department of Plant Physiology, Genetics and Biotechnology, University of Warmia and Mazury in Olsztyn, Oczapowskiego Street 1A/103A, 10-719 Olsztyn, Poland
*
Author to whom correspondence should be addressed.
Agriculture 2023, 13(12), 2278; https://doi.org/10.3390/agriculture13122278
Submission received: 25 October 2023
/
Revised: 1 December 2023
/
Accepted: 11 December 2023
/
Published: 15 December 2023
(This article belongs to the Special Issue Seed Germination, Stress Tolerance and Aging: Physiological and Molecular Aspects)
Abstract
:Seed-to-seedling transition plays a crucial role in plant vegetation. However, changes in the metabolome of crop seedlings during seed germination and early seedling development are mostly unknown and require a deeper explanation. The present study attempted to compare qualitative and quantitative changes in polar metabolites during the seed germination and early development of seedlings of three different and important crop types: pea, cucumber, and wheat. The application of gas chromatography coupled with a flame ionization detector, as well as gas chromatography coupled with mass spectrometry, identified 51 polar metabolites. During seed imbibition/germination, the rapid degradation of raffinose family oligosaccharides (RFOs) preceded a dramatic increase in the concentrations of intermediates of glycolysis and the TCA cycle in embryonic axes (of pea and cucumber) or embryos (of wheat), confirming the important role of RFOs in the resumption of respiration and seed-to-seedling transition. After germination, the metabolic profiles of the growing roots, epicotyl/hypocotyl/coleoptile, and cotyledons/endosperm changed according to fluctuations in the concentrations of soluble carbohydrates, amino acids, and organic acids along the timeline of seedling growth. Moreover, the early increase in species-specific metabolites justified their role in seedling development owing to their participation in nitrogen metabolism (homoserine in pea), carbon translocation (galactinol, raffinose, and stachyose), and transitory carbon accumulation (1-kestose in wheat). The obtained metabolic profiles may constitute an important basis for further research on seedling reactions to stress conditions, including identification of metabolic markers of stress resistance.
1. Introduction
Seed germination and seedling development are the most extensively studied stages in plant development [1]. In recent years, intensive efforts have been made to investigate the molecular mechanisms underlying the breaking of seed dormancy [2,3,4] and seed-to-seedling phase transition [5]. Using post-genomic technologies, it is now possible to understand the global changes in the transcriptome, proteome, and metabolome of seeds during their development and maturation [6], germination [5,7,8,9], and seedling development [8]. Integrative studies have facilitated the advent of plant and seed systems biology [10,11] and approaches to uncover novel features of plant/seed physiology and quality that are suitable for both breeding programs and the use of seeds as food for humans and as livestock feed [12,13].
Changes in the transcriptome and proteome during seed imbibition and germination [5,7,14,15,16,17] lead to the reactivation of primary metabolic pathways and energy production [14,18]. The primary resources for the activation of metabolism are soluble sugars, organic acids, and amino acids [19,20,21], which are accumulated in the embryo and storage tissues at the later stages of seed maturation. The mobilization of the main reserves, starch, and proteins starts during seed germination [18], and their degradation in the cotyledons and/or endosperm is prolonged for several days, allowing subsequent seedling establishment [21,22,23,24]. Post-germinative growth is additionally supported by the mobilization of storage lipids in oilseeds, the process of which is regulated by the concentration of sugars [25,26,27]. Although intermediates that were produced by the degradation of both primary and main reserves might be transformed into starch again and utilized in the subsequent seedling growth [28], most of the products derived from hydrolyzed storage material are transported into growing tissues, enabling the biosynthesis of new components and providing a sufficiently high turgor for rapid cell elongation.
Global changes in the metabolome, both in the tissues of growing seedlings and storage tissues, can be analyzed using new metabolomic technologies [13,29]. Among them, gas chromatography–mass spectrometry (GC-MS) is the most popular, facilitating the identification and robust quantification of a few hundred metabolites (mostly low-molecular-weight primary metabolites and volatile compounds) in a single plant extract [30]. GC-MS was used to analyze the relative changes in the concentrations of the most prominent primary metabolites, including sugars, amino acids, and organic acids (key compounds in reserve catabolism, seedling growth, and energy production) in germinating seeds and whole seedlings of Arabidopsis [8,19,31], barley [32], rice [33], mung bean [34], black gram [35], tomato [36], Ricinus communis [37], and soybean [38]. However, it is thought that there are significant differences in the composition and concentration of metabolites between storage organs undergoing programmed cell death (such as the endosperm in cereals or cotyledons in dicots) or developing into primary photosynthetic active organs (such as growing cotyledons in epigeal germination seeds) and the roots and shoots of growing seedlings. Indeed, in tomato seedlings, clear organ- and developmental-stage-specific differences in secondary metabolite profiles have been observed [36]. Recently, comparative analyses of changes in proteomes [39] and metabolomes [40] in the embryos and endosperms (conducted separately) of germinating wheat grains confirmed the much higher metabolic activity of embryos compared to endosperms, as expected [1,14,18].
The concentrations of both primary [32,38] and secondary metabolites [36] change rapidly in germinating seeds and seedlings, and the most discriminating metabolites seem to be polar metabolites [32,41,42,43]. In Arabidopsis thaliana, the comparison of changes in primary metabolism during the transition from a dry seed to the active state of a vigorous seedling revealed two specific metabolite profiles: one involved in the metabolic preparation for seed germination and the other involved in efficient seedling establishment [9]. However, to date, there are no available data confirming such metabolic transition in the developing seedlings of crops.
In the present study, GC-FID (gas chromatography with a flame ionization detector) and GC-MS methods were used to compare qualitative and quantitative changes in polar metabolites during seed germination and early seedling development (up to the developmental stage corresponding to field emergence) of different crops (pea, cucumber, and wheat) representing important legume, vegetable, and cereal crops and differing in terms of germination type (hypogeal—pea and wheat; epigeal—cucumber) as well as in terms of the composition of the main reserves and in terms of localization (starch in the wheat endosperm, starch and protein in pea cotyledons, and oils in the cotyledons of cucumber). Moreover, the vegetative tissues of the above-mentioned species also contain species-specific metabolites, such as the amino acid homoserine in pea [44,45], galactinol, and oligosaccharides (raffinose and stachyose) in cucumber [46,47], and fructans (i.e., kestose) in wheat [48]. Their occurrence and role in germinating seeds/seedlings have not been thoroughly characterized.
2. Materials and Methods
2.1. Seed and Grain Germination
Seeds of pea (Pisum sativum L. cv. Hubal) and cucumber (Cucumis sativus L. cv. Polan F1), and grains of wheat (Triticum aestivum L. cv. Forkida), obtained from DANKO Plant Breeding, Kościan, Poland (pea, wheat) and Garden Seed and Nursery Stock Company TORSEED S.A., Toruń, Poland (cucumber), were surface-sterilized in a water solution of ethanol (60%) for 1 min, rinsed several times with sterilized double-distilled water, and placed on wet double-folded sheets of filter paper (Eurochem BDG, Tarnów, Poland). After rolling, the paper towels were transferred into 250 mL glass cylinders and incubated at temperatures of 20/10 °C (for pea and wheat) or 25/20 °C (for cucumber) under a photoperiod of 14 h light/10 h darkness (in climatic chamber ILW 115-T STD, Pol-Eko-Aparatura, Wodzisław Śląski, Poland) for 7 days. Samples of germinating seeds/grains and seedlings (in three to five biological replicates) were collected at 24 h intervals (each day at 09:00, only one sample per day). In dry and germinating seeds (0- to 2-day-old) of pea and cucumber, the embryonic axis was separated from the cotyledons (seed coat was removed), whereas in wheat, the embryo (including scutellum) was separated from the endosperm (including pericarp). Seedlings (3- to 7-day-old) were separated on the hypocotyl (in cucumber), epicotyl (in pea), shoot (coleoptile with the first leaf in wheat), cotyledons (pea, cucumber), endosperm (with pericarp, wheat), and roots (all species), weighed, and immediately frozen in liquid nitrogen. After 1 week of storage at −76 °C, the tissues were freeze-dried for 48 h (Alpha 1-2LD; Christ, Hamburg, Germany). The water concentration of tissues was calculated as the difference between fresh weight (FW) and dry weight (DW) and was expressed as a percentage of FW. The length of the seedling organs was measured in an additional lot of seedlings (20 seedlings in each of the three biological replicates).
2.2. Analysis of Polar Metabolites
Dry tissues were crushed (for 2 min at 22 Hz) to a fine powder in a mixed mill (MM200, Retsch, Verder Group, Utrecht, Netherlands). Polar metabolites were extracted from 40 to 45 mg of flour with 900 μL of a mixture of methanol/water (1:1, v/v), containing 100 μg of ribitol (as an internal standard). The homogenate (in a 2 mL Eppendorf tube) was heated at 70 °C with continuous shaking (500 rpm, Thermo-shaker MS-100 ALLSHENG, Hangzhou, China) for 30 min. After centrifugation (20,000 × g at 4 °C for 20 min), 600 μL of the supernatant was transferred into a 1.5 mL tube containing 400 μL of chloroform. After shaking (at 1300 rpm for 15 min) and centrifugation (20,000× g at 4 °C for 10 min), 200 μL of the upper layer (methanol/water polar fraction) was transferred into a 300 μL glass insert in a 2 mL vial and dried in a speed vacuum rotary evaporator (JWElectronic, Warsaw, Poland).
The dry residues were derivatized in two steps. First, 40 μL of O-methoxyamine hydrochloride (20 mg in 1 mL pyridine; Sigma-Aldrich, Merck, Burlington, MA, USA was added and the samples were heated at 37 °C for 75 min (with continuous shaking at 500 rpm). Next, 160 μL of a mixture of N-methyl-N-(trimethylsilyl)-trifluoroacetamide with pyridine (Sigma-Aldrich, Merck, Burlington, MA, USA) (1:1, v:v) was added, and the mixture was heated at 70 °C for 30 min, according to the method described by Lisec et al. [30].
Qualitative and quantitative analyses of polar metabolites were performed using the gas chromatography method (GC). For robust analyses, a gas chromatograph GC-2010 (Shimadzu, Kyoto, Japan) equipped with an FID was used. For the separation of a mixture of metabolites derivatives, the capillary column ZEBRON ZB5-MSi (length, 30 m, diameter 0.25 mm, film thickness 0.25 μm (5% phenyl–95% di-methyl-poly-siloxane), Phenomenex, Torrance, CA, USA) was used. The GC conditions were set with a detector and injector temperature of 350 °C and 230 °C, respectively, helium carrier gas at a flow rate of 1.82 mL/min, an injector split ratio of 10:1, and a resting column oven temperature of 70 °C. After sample injection (1 μL), the oven temperature was ramped to 130 °C at a rate of 20 °C/min, to 210 °C at 8 °C/min, to 220 °C at 3 °C/min, to 300 °C at 10 °C/min (held for 3 min), and to 335 °C at 20 °C/min. The final temperature was held for 12.42 min and the total time of analysis was 45 min. The initial resting oven temperature was equilibrated for 3 min before the next run. For the identification of metabolites, standards of carbohydrates, polyols (including cyclitols), sugar acids, sugar phosphates, organic and amino acids, amines, and polyamines (derived from Sigma, USA) were derivatized and separated under the conditions described above. Each compound was identified by the comparison of the retention time of the peak(s) with the retention time of the peak(s) of a known standard.
The identification of metabolites was confirmed by gas chromatography coupled with mass spectrometry (GC-MS). One to two samples, from 3 to 5 replicates analyzed by GC-FID, were used for GC-MS (GCMS-QP2010 Plus, Shimadzu, Japan) equipped with a quadrupole mass analyzer. The parameters for metabolite separation by GC-MS were identical to those described above. For the GC-MS analysis, the temperature of the interface was 280 °C, the ion source temperature was 250 °C, and an electron ionization of 0.8 kV was used. The flow rate of the helium carrier gas (helium) was 1.19 mL/min. The detector signal was recorded from 3.2 to 41.5 min after injection, and ions were scanned across the range of 50–600 m/z units with a scan speed of 20 scan/s. Data were collected and analyzed using GCMS Solution 2.50 SU3 software (Shimadzu, Japan). Polar metabolites were identified by comparing the retention indices and mass spectra collected in the NIST 05 library (Shimadzu, Japan) and the internal collection of mass spectra obtained for the original standards purchased from SIGMA [49]. On the GC-chromatograms of the TMS derivatives of metabolites from the pea seedling samples, two peaks (with relatively high signal values) of unknown polar metabolites were detected (Figure S1). According to the NIST05 database, these compounds could be di-ethylamine and hexose. However, a comparison of retention times and mass spectra with the original standards (di-ethylamine and a few hexoses and their alcohol derivatives and sugar acids) excluded these suppositions. Therefore, they were omitted from the calculation of the polar metabolite concentrations. Nonetheless, the proper identification of these compounds requires further study.
The concentration of polar metabolites analyzed by the GC-FID method was calculated from standard curves obtained for the appropriate original metabolites using the internal standard method. For each standard of polar metabolites, regression curves were calculated to describe the relationship between the ratio of the peak area of each standard (ranging from 20 to 200 μg) and the area of the internal standard (ribitol) in a constant amount (100 μg). Unknown compounds present in the chromatograms were omitted from the calculations if their similarity to the mass spectra from the original standard or from the NIST05 library was below 80%.
2.3. Targeted Analysis of Verbascose
The applied protocol for the extraction of polar metabolites and their GC analysis was not sufficient for the analysis of verbascose, an important compound of the mature seeds of peas [50]. Thus, from the same samples (replicates) of lyophilized plant material, additional extraction of soluble carbohydrates was performed. GC analyses (using ZEBRON ZB-1 column, Phenomenex, USA) were performed in accordance with a previously described procedure [51]. Data for the concentration of verbascose were added to the metabolite profiling results.
2.4. Statistical Analysis
The results are the means of three to five independent replicates ± SE, and they were subjected to an analysis of variance using a one-way ANOVA test and Tukey’s post hoc test (if overall p < 0.05) for multiple comparisons in GraphPad Prism and Statistica. Principal component analysis (PCA) for multivariate statistics was performed using COVAIN [52], a MATLAB toolbox that includes a graphical user interface (MATLAB version 2013a, Math Works).
3. Results
3.1. Polar Metabolites in Dry Seeds
In the water–methanol extracts from dry seeds of pea, cucumber, and wheat, 51 polar metabolites were identified (Tables S2–S4). Although most of them (27–30, depending on the part of the seedling) were ubiquitous in all species, some were species-specific: (i) in pea—sugar acids (galactonic and gluconic), verbascose, homoserine, and 2,3,4-tri-hydroxybutyric acids; (ii) in wheat—maltose, 1-kestose, sorbitol, tyrosine, and urea; and (iii) in cucumber—rythronic acid. Moreover, some metabolites were common found only for pea and cucumber (galactose and stachyose) or for pea and wheat (lysine and organic acids: fumaric, acetic, and propanoic). The metabolite common to cucumber and wheat, but not identified in pea, was 2-keto-d-gluconic acid.
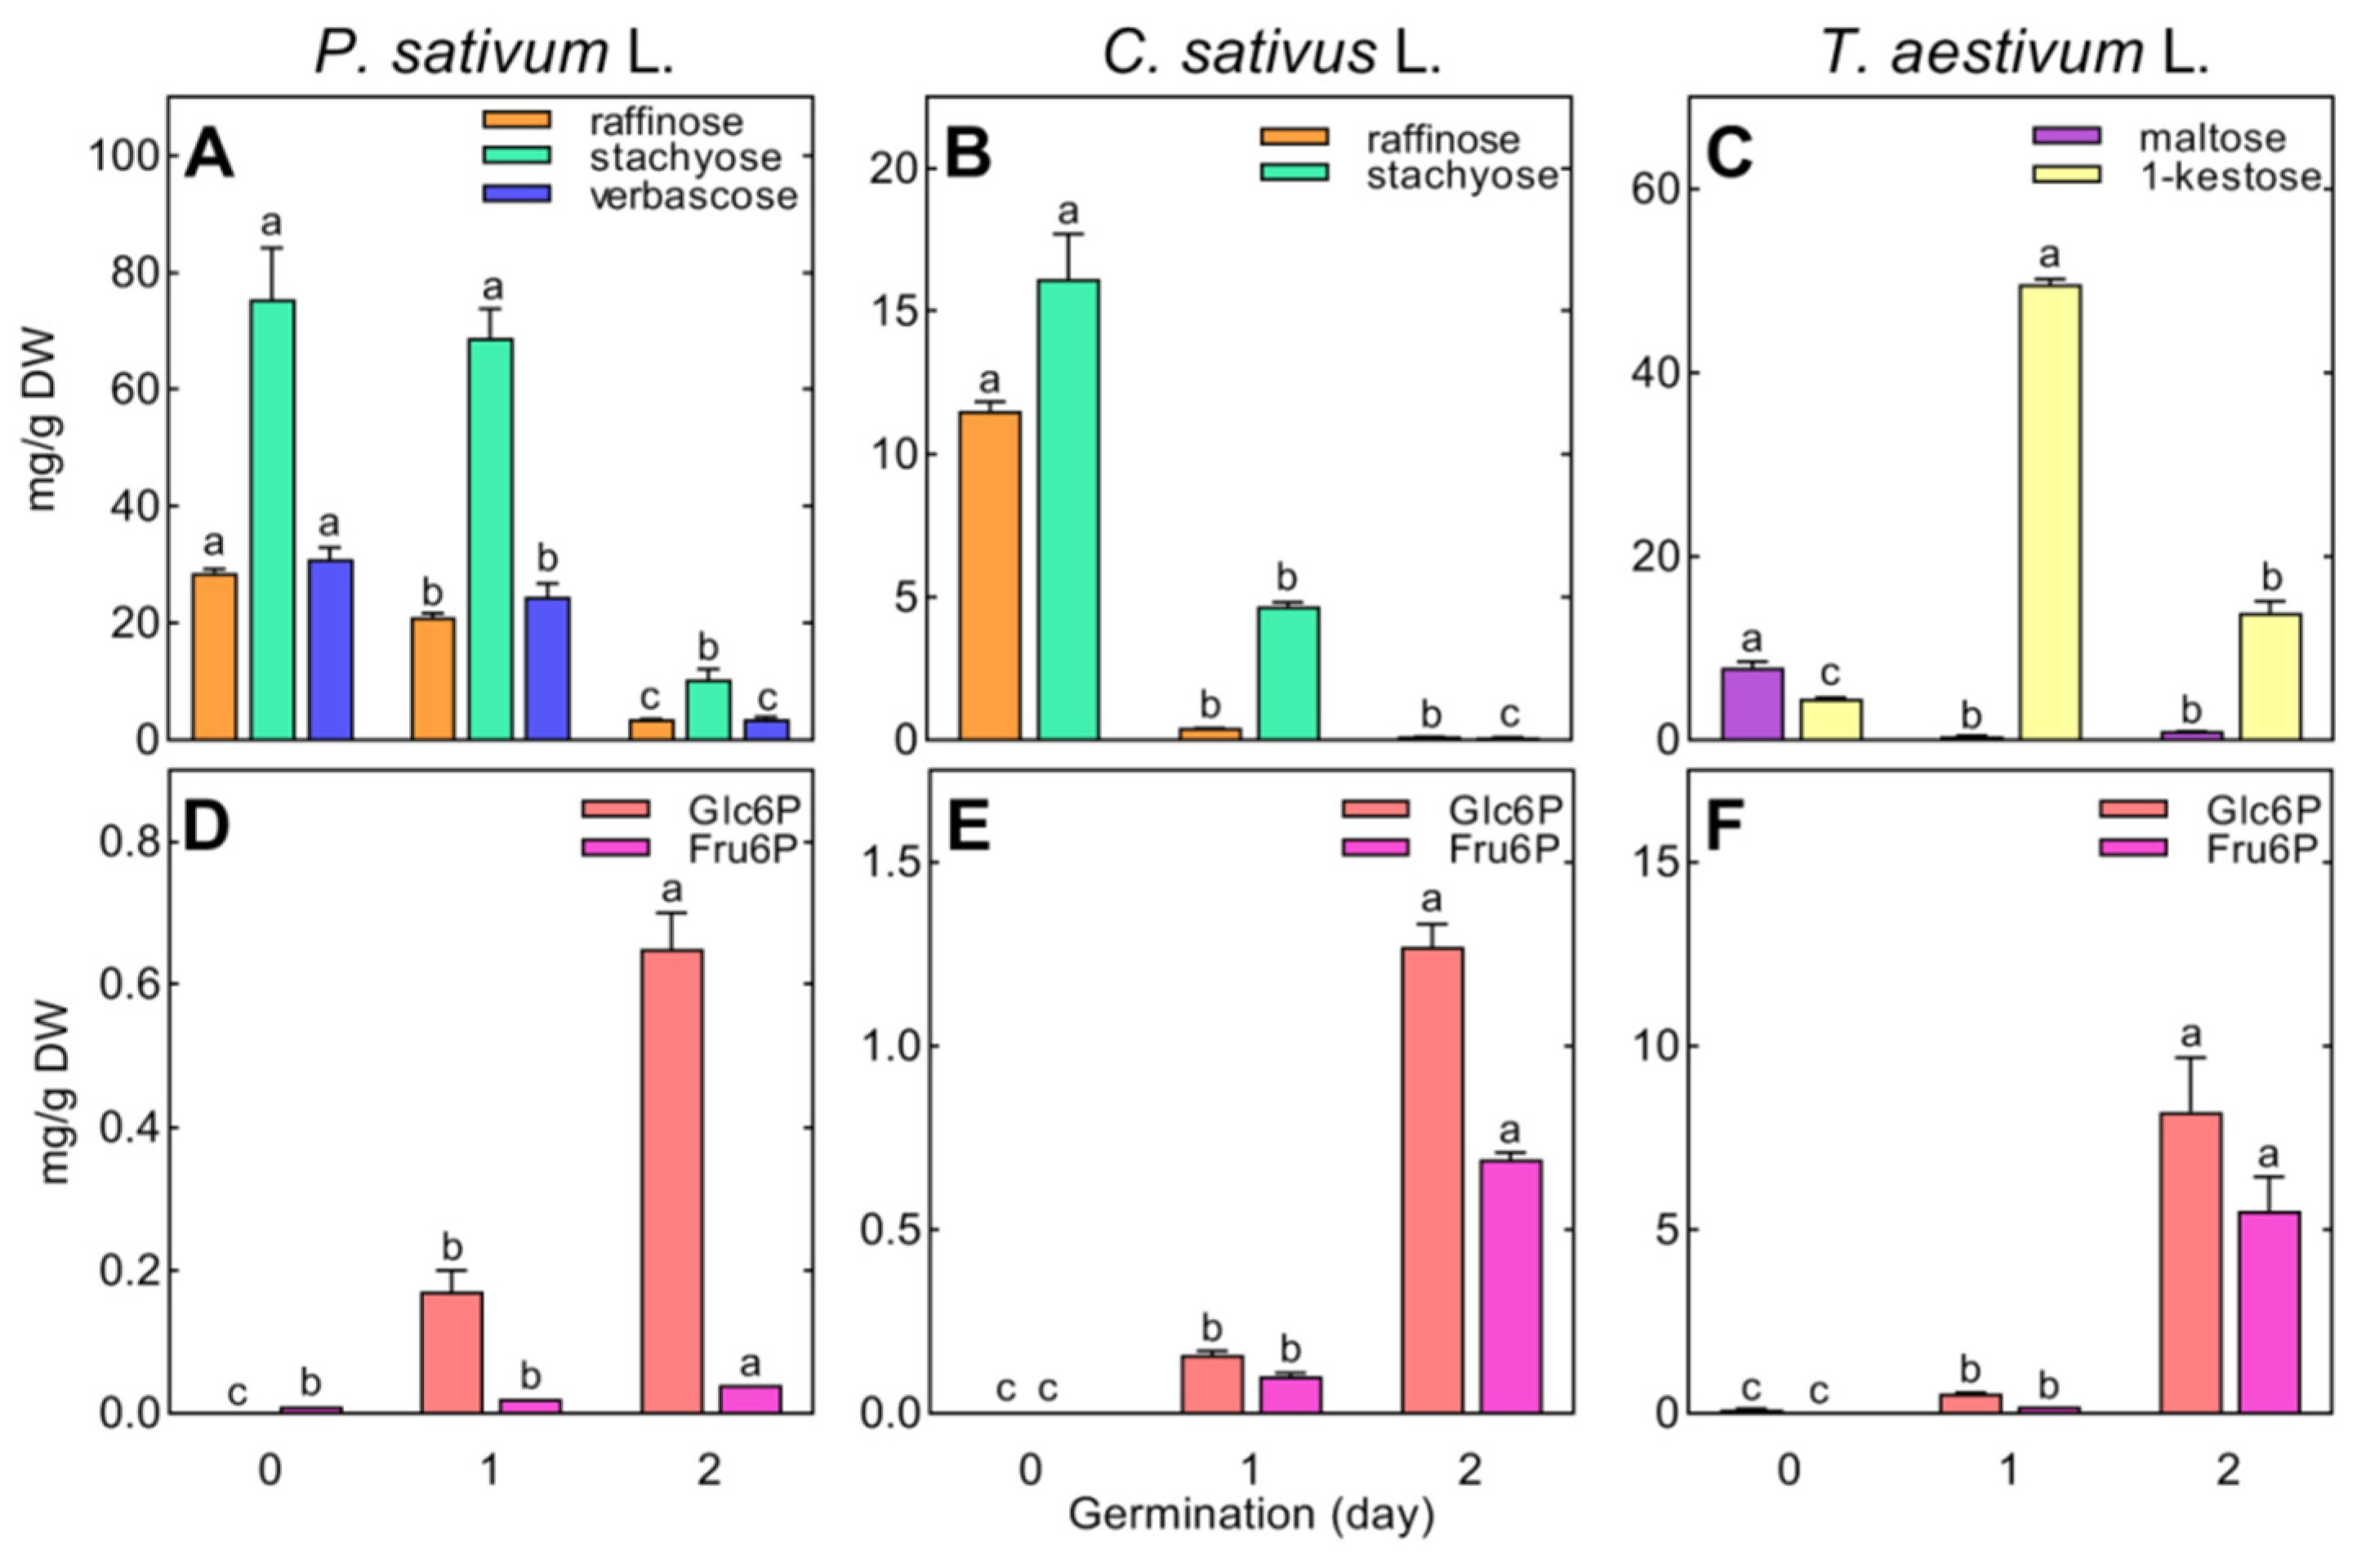
The concentration of identified polar metabolites in the embryonic axis (pea, cucumber) or embryo (wheat) was much higher than in the storage tissues (cotyledons, endosperm) of dry seeds, regardless of the species analyzed (Figure 1). However, the differences in the concentrations of polar metabolites among tissues were higher in pea (202.19 and 55.05 mg/g DW in embryonic axis and cotyledons, respectively, Figure 1A,D) than in cucumber and wheat (ca. 52 mg/g DW in embryonic axis/embryo, Figure 1B,C, compared to 23 mg/g DW in cotyledons/endosperm, Figure 1E,F).
Soluble carbohydrates were quantitatively the main fraction of polar metabolites in seeds, regardless of species and tissues analyzed (accounting for approximately 90% of identified polar metabolites in cucumber and pea, and 87 and 77% in the embryo and endosperm of wheat, respectively; Figure S2). In the seeds of pea and cucumber, RFOs dominated among sugars, accounting for 70% of soluble carbohydrates. In wheat, sucrose, 1-kestose, and maltose dominated (accounting for 80 and 89% of the sugars in the embryo and endosperm, respectively). The concentrations of other polar metabolites were higher in the embryonic axes of pea and cucumber, as well as in the wheat embryo, than in storage tissues. Among the amino acids, organic acids, and remaining compounds, glutamic acid, citrate/malate, and phosphoric acid dominated.
3.2. Seeds Germination
During the 24 h of seed imbibition, the FW of the whole embryo of pea increased from 261 to 397 mg, in cucumber from 19 to 29 mg, and in wheat from 44 to 71 mg (Table S1). Importantly, the FW of the embryonic axis of the pea increased up to 4-fold (from 2 to 8 mg), whereas the FW of the cucumber axis and wheat embryo increased by 50 and 33%, respectively (from 2 to 3 mg and from 3 to 4 mg, respectively). The increase in the FW of storage tissues was similar in the investigated species (ca. 50%). The WC in the embryonic axes of pea, cucumber, and embryo of wheat increased to 72, 87%, and 82%, respectively, whereas it increased to 54 and 46% in the cotyledons of pea and cucumber, and to 35% in the wheat endosperm (Table S1). After the next 24 h, seed germination sensu stricto finished, the growing root of pea and cucumber protruded the seed coat, reaching lengths of 1–5 and 5–8 mm, respectively, whereas the enlarging wheat embryo ruptured the seed coat (Figure S3).
3.3. Changes in Polar Metabolites during Seed Imbibition and Germination
During the first 24 h of seed germination, the total concentration of identified polar metabolites significantly (p < 0.05) decreased in the embryonic axes of pea (from 202.19 to 188.67 mg/g DW) and cucumber (from 52.22 to 37.82 mg/g DW), whereas it increased 3-fold in the embryo of wheat (from 52.91 to 173.12 mg/g DW). This was a result of a rapid breakdown of RFOs (in pea and cucumber, Figure 2A,B) or a fast accumulation of sucrose, glucose (Table S4), and 1-kestose in wheat (Figure 2C).
The degradation of raffinose also occurred in the wheat (from 7.11 to 1.32 mg/g DW, Table S4). However, changes in the concentrations of galactose and sucrose, as the products of RFO hydrolysis, were not related to this. In the embryonic axes of pea and cucumber, the reduction in RFOs by approximately 20–23 mg/g DW (Figure 2A) was accompanied by an increase in the content of sucrose by only 7.5 and 5 mg/g DW, respectively, while the increase in galactose and other monosaccharides was less than 1 mg/g DW (Table S2). In wheat embryos, the sucrose content increased 3-fold (from 25 to 75 mg/g DW), which was much higher than the amount of sucrose released from raffinose (ca. 4 mg/g DW). Moreover, at the same time, the concentration of 1-kestose (fructan of sucrose) increased 10-fold (from 4.5 to 49.6 mg/g DW, Figure 1C) and the level of monosaccharides (fructose and glucose) increased dramatically (from 0.24 and 0.26 up to 3.07 and 6.32 mg/g DW, respectively; Table S4).
The occurrence of hexose phosphates (glucose-6-phosphate and fructose-6-phosphate, Glc6P, and Fru6P, respectively) in the embryonic axes of pea and cucumber, as well as their accumulation in wheat embryos (Figure 2D–F), confirmed the activation of respiratory metabolism in rehydrated tissues. This suggestion is also based on the observed increase in intermediates of the tricarboxylic acid (TCA) cycle (Tables S2–S4).
According to the protrusion of the seed coat by the growing root (between the 1st and 2nd day of seed germination; Figure S1), considering the end of seed germination, changes in the concentrations of polar metabolites were species- and organ-specific (Tables S2–S4). In the embryonic axis of pea, the concentration of identified polar metabolites decreased from 188.67 to 137.42 mg/g DW due to the dramatic decrease in RFOs (Figure 2A). The hydrolysis of RFOs also occurred in the cotyledons (but at a lower intensity). The increase in the concentration of polar metabolites in the cotyledons (from 49.07 to 89.42 mg/g DW) was a result of the 3- and 2-fold increases in sucrose and citric acid, respectively (Table S2). It should be noted that the concentration of sucrose also increased in the embryonic axis of pea, reaching a level 2-fold higher (71.32 mg/g DW) than that in cotyledons (41.34 mg/g DW). Besides sugars, the concentration of free amino acids (with predominant glutamic acid) in the embryonic axis increased 3-fold, from 6.11 to 19.73 mg/g DW, and in cotyledons from 1.37 to 4.44 mg/g DW (Table S2).
In cucumber, the changes in the concentrations of polar metabolites were opposite to those observed in pea. There was an increase in their total content in the embryonic axis (2.6-fold, from 37.82 to 98.88 mg/g DW) due to a doubling of the concentration of soluble carbohydrates. The embryonic axis accumulated mainly glucose and myo-inositol instead of sucrose, which decreased (Table S3). The cucumber axis also accumulated proteinogenic amino acids (predominantly glutamic acid) and organic acids (malate and citrate; Table S3). In both the embryonic axis and cotyledons, the degradation of RFOs continued (Figure 2B), as was the case for pea seeds.
In wheat embryo, the concentration of polar metabolites decreased because of the breakdown of soluble carbohydrates, such as in the embryonic axis of pea. However, in addition to RFOs, there was a decrease in the concentrations of 1-kestose (Figure 2C) and sucrose (Table S3). The concentration of amino acids and organic acids (mainly malate and citrate) increased along the cucumber axis. In contrast to the embryo, the accumulation of maltose, glucose, and sucrose in the endosperm led to a significant increase in the levels of total polar metabolites (Table S4).
3.4. Seedling Growth and Development
Post-germinative seedling development was characterized by the rapid growth of root systems and a subsequent elongation of the epicotyl or coleoptile in pea or wheat, and the hypocotyl and cotyledons in cucumber, according to the type of seed germination (hypogeal in pea and wheat, and epigeal in cucumber). In cucumber, lateral roots develop between the 3rd and 4th day of seed germination (Figure S3), whereas in pea, they develop only a few days later (data not shown). The root system of wheat initially consists of a primary root and the first pair of seminal roots. Between the 4th and 5th day, the next pair of seminal roots developed (Figure S3). The WC in tissues still increased, reaching much higher levels in growing roots (91–95% of FW after 7 days of seed germination) and the epicotyl or coleoptile (89% of FW) than in the cotyledons of pea or the endosperm of wheat (55 and 64%). In cucumber, the WC in the roots and hypocotyl was equal (95–96%) and slightly higher than that in the cotyledons (82.5%, Table S1). In wheat seedlings, between the 6th and 7th days, the coleoptile stopped growing and the rolled green first leaf penetrated its top. In cucumber, the epicotyl was still covered by growing and adjacent dark-green cotyledons with visible main vascular bundles (Figure S3). In the epicotyl of pea, the primary leaf of wheat, and growing cotyledons of cucumber (as well as the upper part of hypocotyl), photosynthetic pigments appeared. Seven days after the start of seed germination, the developmental stage of the seedlings corresponded to field emergence (Figure S3).
3.5. Changes in Polar Metabolites during Seedling Growth
At the beginning of post-germinative seedling growth, between the 2nd and 3rd day after the start of seed imbibition, the concentration of total polar metabolites in the embryonic axis of pea increased from 137.42 up to 157.47 and 132.05 mg/g DW in the root and epicotyl, respectively (Figure 1A). At the same time, their concentration decreased in the cotyledons of pea from 89.42 to 44.15 mg/g DW (Figure 1D). In cucumber, it doubled in the root (from 98.88 to 183.15 mg/g DW; Figure 1B), but did not change significantly in the cotyledons (Figure 1E). In wheat, it clearly increased in all tissues (Figure 1C,F).
Quantitative changes in the concentrations of polar metabolites during the next few days led to different metabolic profiles in the seedlings of the studied species. PCA revealed differences between species in the metabolite profiles of developing seedlings (between the 3rd and 7th days of germination; Figure 3).
Moreover, the metabolite profiles of storage tissues were clearly separated from those of the roots and shoots of pea (Figure 4A), cucumber (Figure 4C), and wheat (Figure 4E). Sucrose, glucose, and homoserine were the most discriminating metabolites in pea (Figure 4B); glucose, fructose, and phosphoric acid in cucumber (Figure 4D); and sucrose, 1-kestose, maltose, glucose, and citrate in wheat (Figure 4F).
Changes in the concentration of polar metabolites between the 3rd and 7th day of seedling growth were generally different between species and tissues. In the roots of pea seedlings, it ranged from 150 to 170 mg/g DW (Figure 1A), whereas it increased temporarily in cucumber (from 175.92 to 221.25 mg/g DW, between the 4th and 5th days; Figure 1B), and in wheat, after initially decreasing (from 170.19 to 96.33 mg/g DW), and remained in the range of 92–111 mg/g DW (Figure 1C). In the growing epicotyl of pea, the concentration of polar metabolites gradually increased (Figure 1A) due to the accumulation of amino acids and phosphoric acid. However, only minor changes in soluble carbohydrates occurred in the epicotyl, contrary to the gradually decreasing concentration of sugars in the root (Table S2). In the hypocotyl of cucumber, the concentration of polar metabolites was the highest on the 4th day of seed germination and then fluctuated (Figure 1B). Only slight changes were observed in the wheat coleoptile (Figure 1C). The initial decrease in soluble carbohydrates and amino acids was compensated for by the dramatic accumulation of organic acids (Table S4).
The concentration of polar metabolites gradually increased in the cotyledons of cucumber (Figure 1E) and the endosperm of wheat (Figure 1F), whereas it temporarily increased in the cotyledons of pea (Figure 1D), according to the transitory accumulation of soluble carbohydrates (Table S2), and then decreased (between the 6th and 7th days of seed germination; Figure 1D).
3.5.1. Soluble Carbohydrates
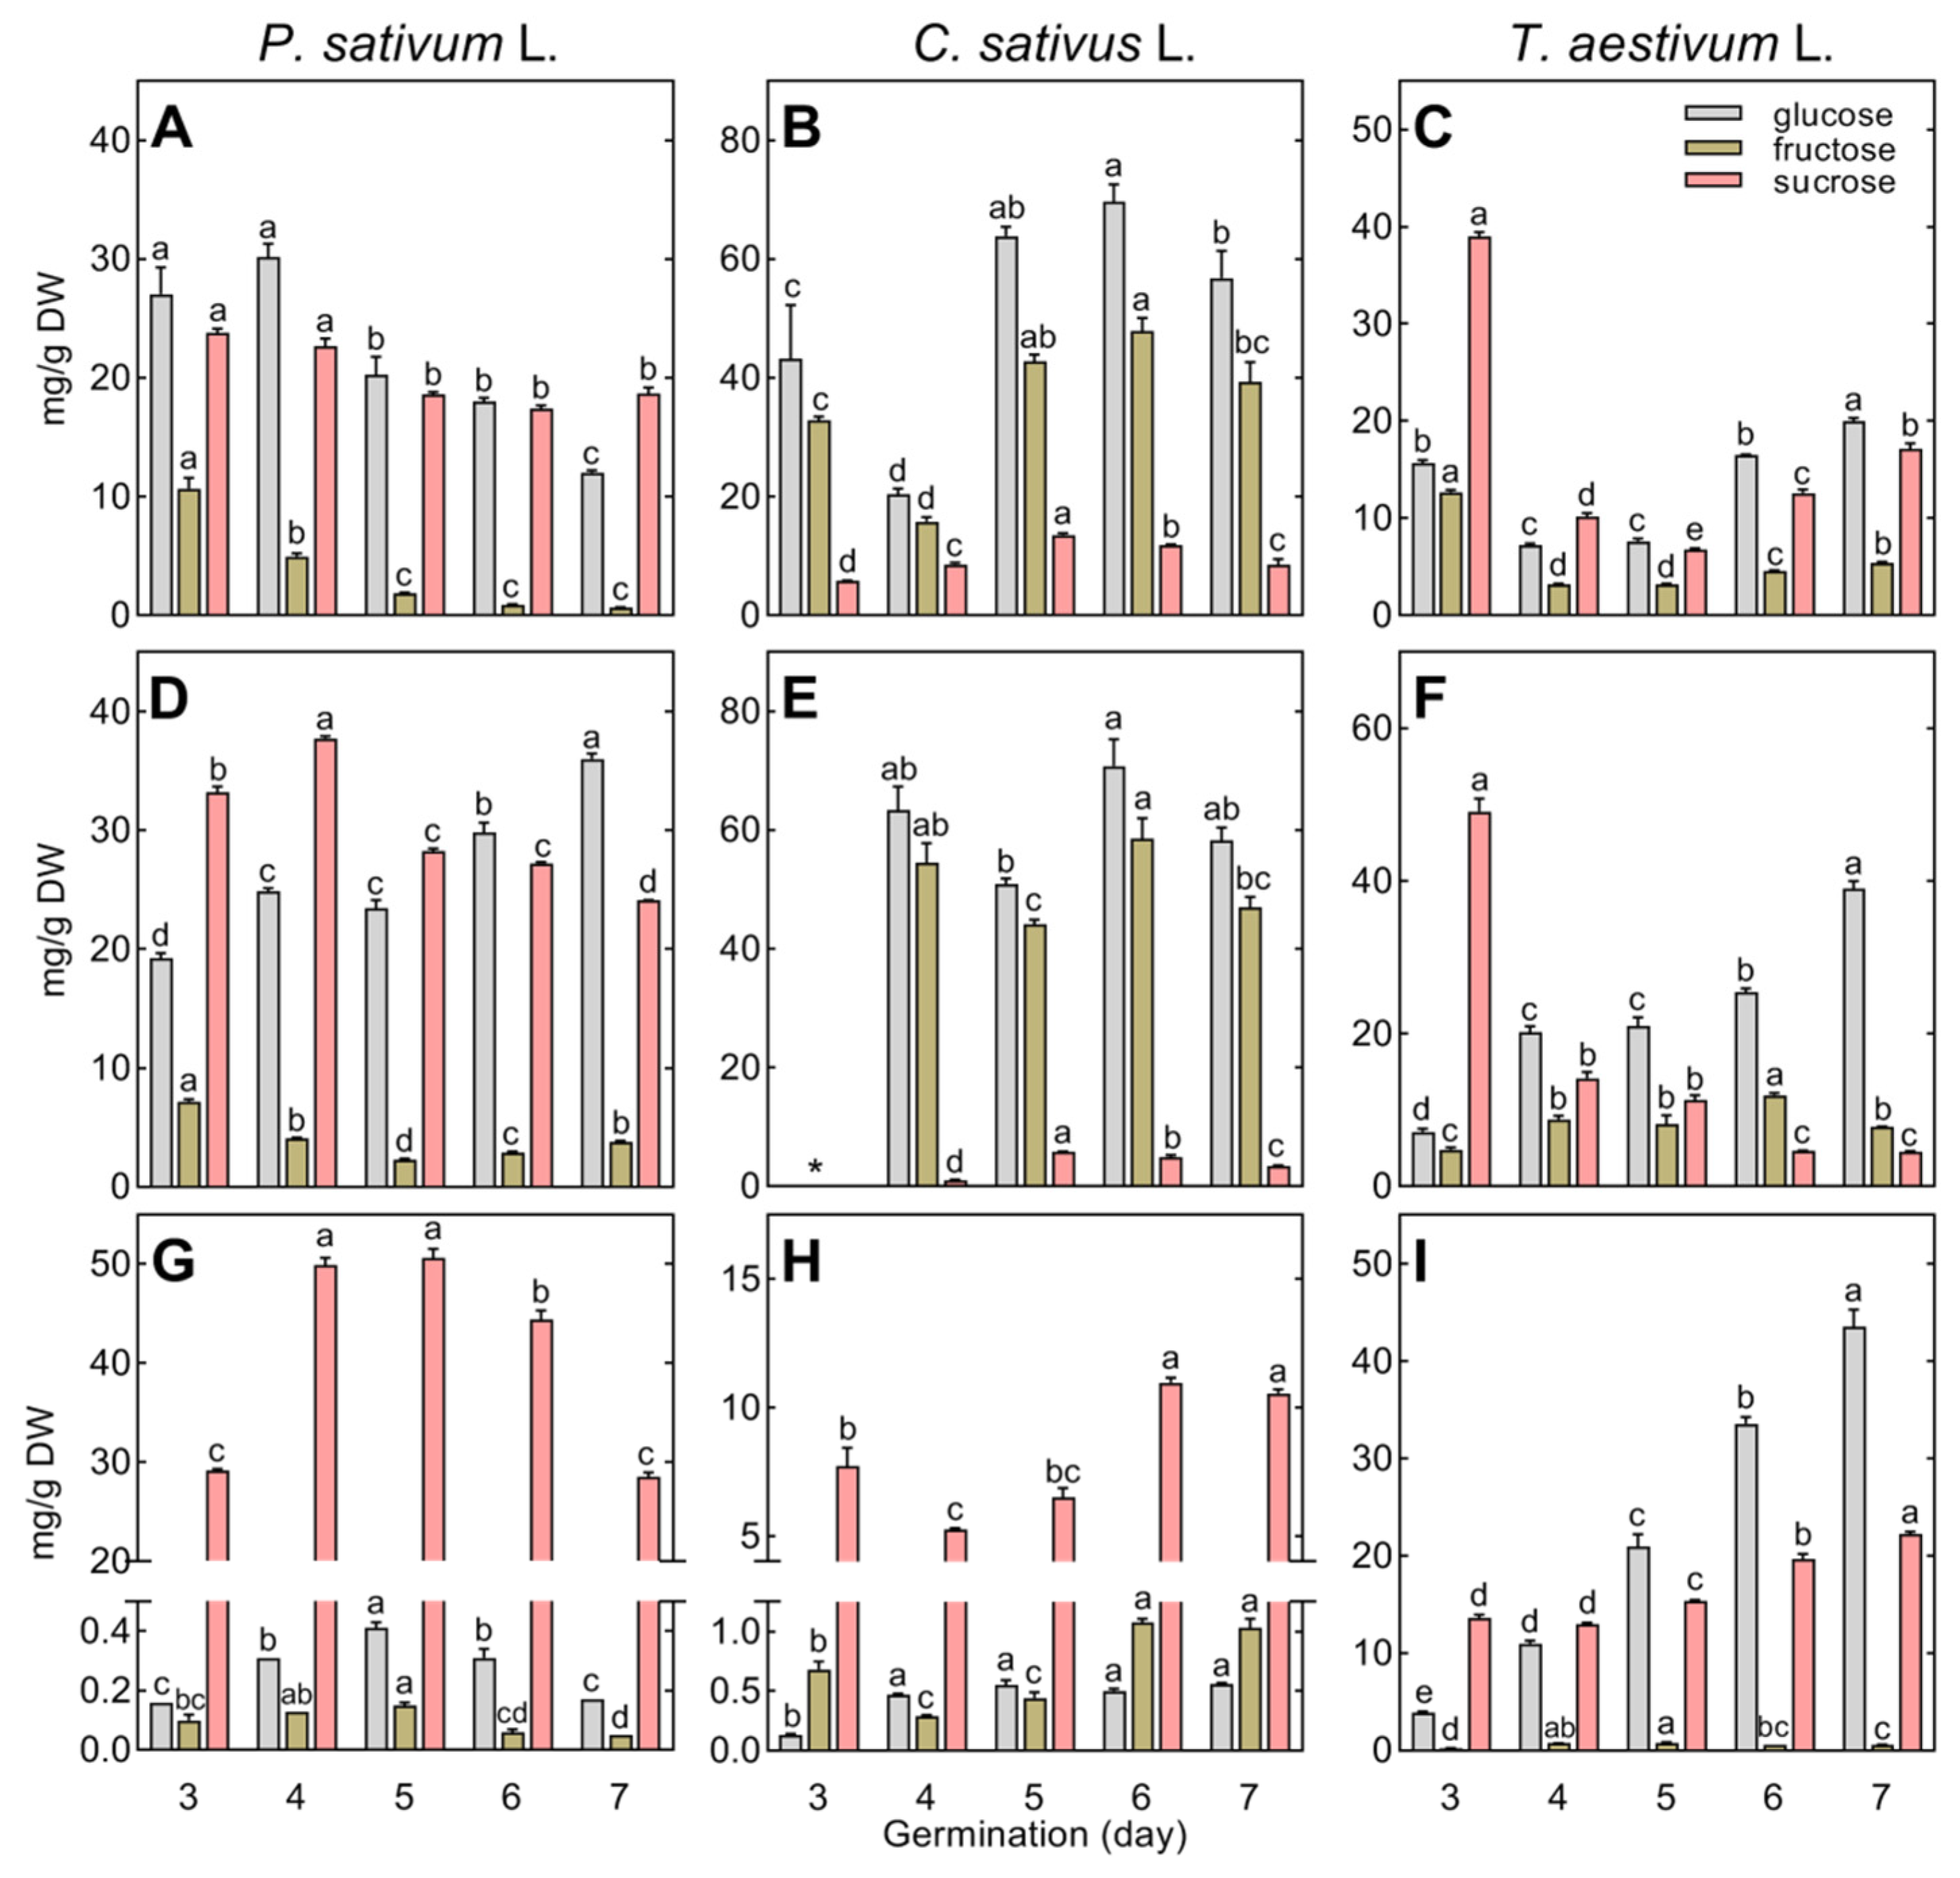
Changes in the composition and concentration of the major soluble carbohydrates (sucrose, glucose, and fructose) in the growing roots, epicotyl, hypocotyl, coleoptile, and storage tissues are presented in Figure 5.
Glucose and sucrose dominated the root and epicotyl of pea (Figure 5A,D), while glucose and fructose dominated cucumber (Figure 5B,E) and sucrose dominated wheat (Figure 5C,F). It should be emphasized that the concentration of total glucose and fructose in the growing roots and hypocotyl of cucumber was the highest among the species studied, reaching a level up to ca. 120 mg/g DW, whereas the concentration of sucrose was the lowest (<15 mg/g DW; Figure 5B,E).
Sucrose was dominant in the cotyledons of both pea and cucumber. Its concentration increased temporarily in pea or gradually in cucumber (Figure 5G,H). The endosperm of wheat, but not the cotyledons of pea and cucumber, accumulated high amounts of glucose (up to 43.5 mg/g DW), in addition to sucrose (Figure 5I).
The most differentiating carbohydrates were galactinol and RFOs, occurring only in cucumber and pea seedlings, whereas wheat seedlings contained 1-kestose (not detected in pea and cucumber) and maltose (Figure 2, Tables S2–S4). In pea, the breakdown of galactinol and RFOs (starting during seed imbibition) continued in the cotyledons up to the 7th day of seed germination, whereas in the growing roots and epicotyl, RFOs were below the detection limit (except for raffinose in the epicotyl on the 3rd day; Table S2). In cucumber, the degradation of RFOs finished between the 2nd and 3rd days of seed germination, and, thereafter, the accumulation of galactinol, raffinose, and stachyose started in the roots and hypocotyl (Table S3). A higher concentration of galactinol than stachyose or raffinose was revealed in the cotyledons (means for days 4–7: 0.76, 0.62, and 0.39 mg/g DW for galactinol, raffinose, and stachyose, respectively). Raffinose and stachyose were dominant in seedlings. In the roots and cotyledons, the concentration of stachyose was higher than that of raffinose (Figure 6A,C), whereas the opposite relationships between these oligosaccharides were found in the hypocotyl (Figure 6B).
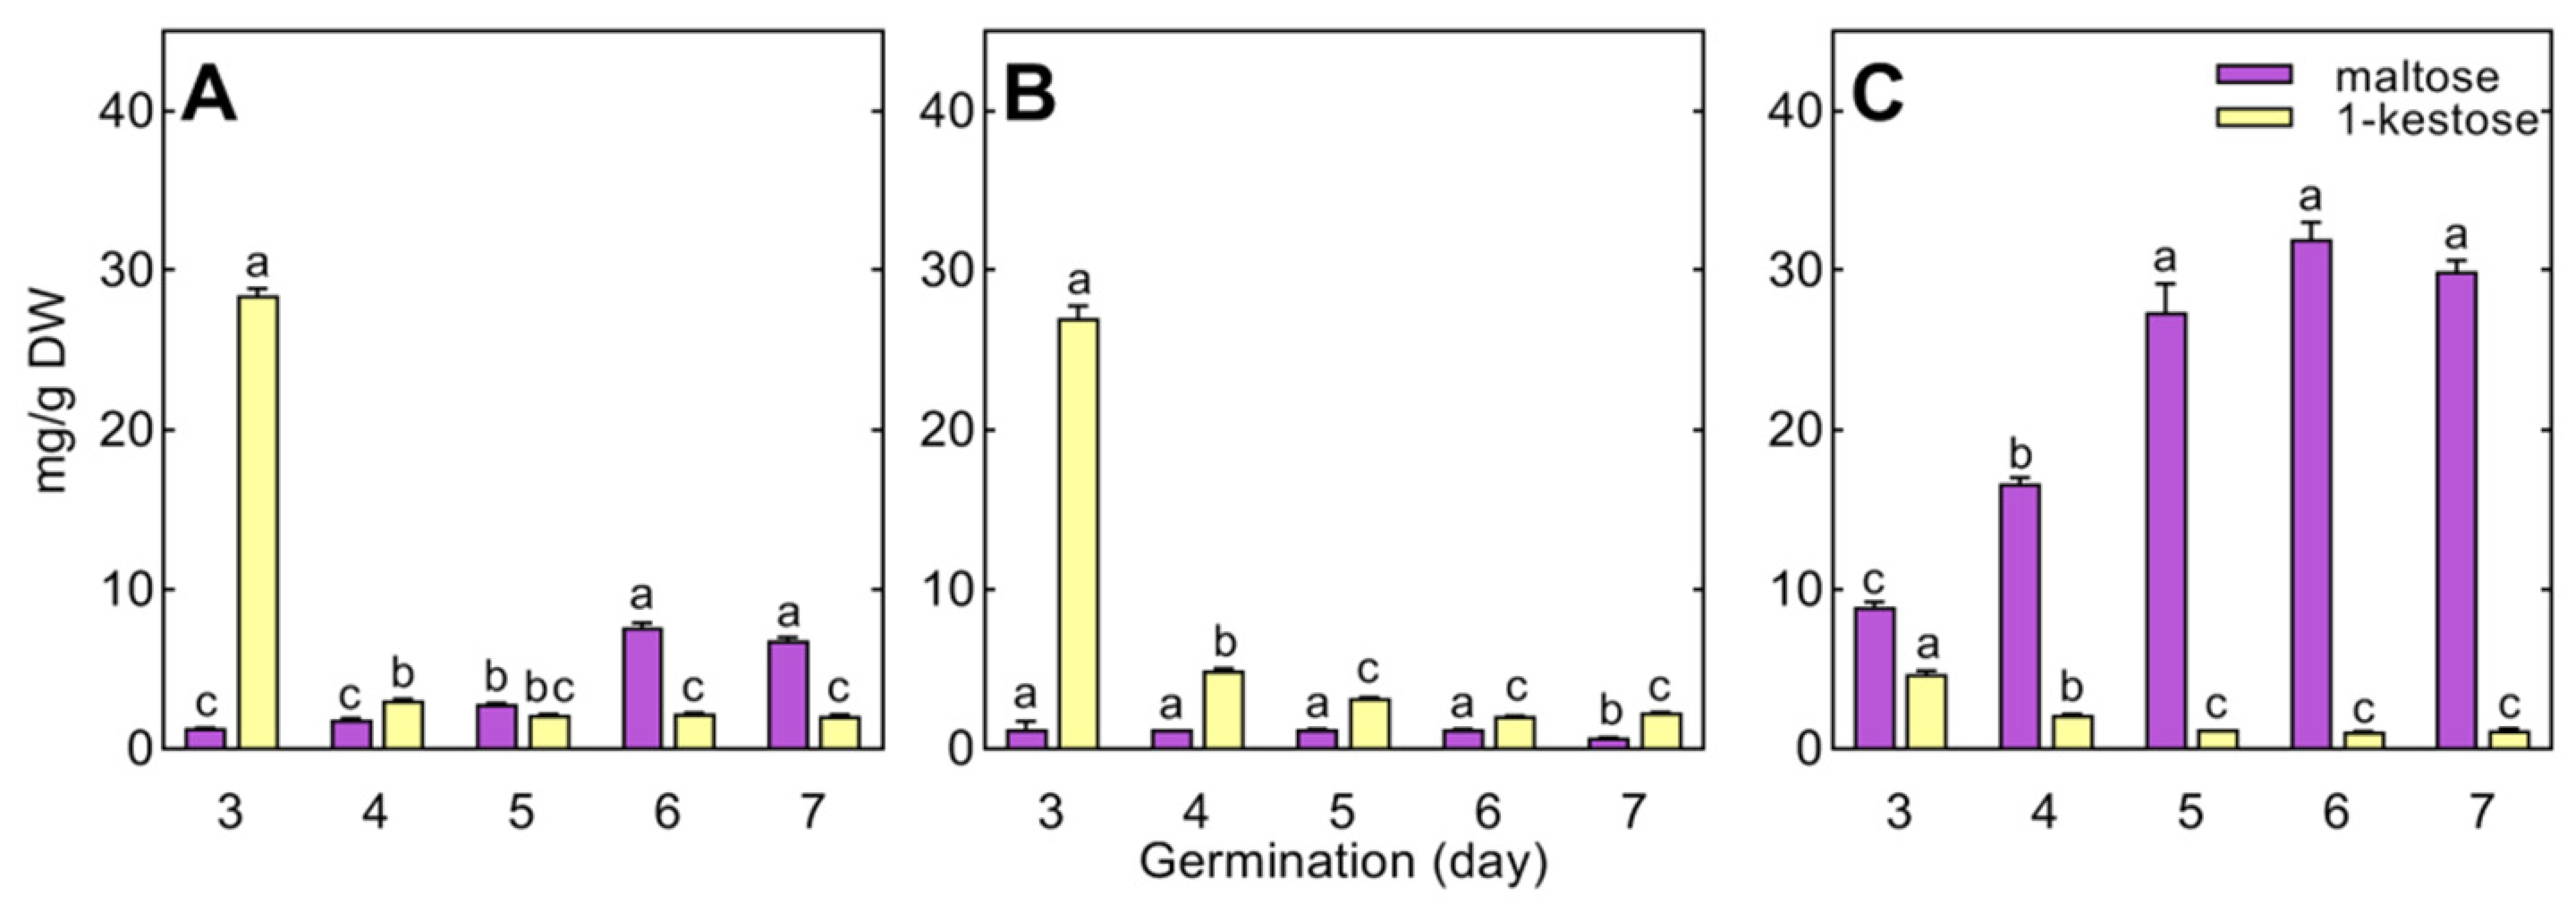
In wheat, raffinose and stachyose were not detected in 3- to 7-day-old seedlings, and only traces of galactinol were found (Table S4). Wheat seedlings contained 1-kestose, the concentration of which decreased during seedling development (Figure 7). Maltose accumulated in the roots and endosperm (up to 7 and 32 mg/g DW, respectively), remaining at a low level in the coleoptile (1.2 mg/g DW, Figure 7).
The sugar phosphates Glc6P and Fru6P were detectable in all samples. Their concentrations increased in the embryonic axis (pea and cucumber) or embryo (wheat) during seed germination and later decreased (Tables S2–S4). However, in pea and cucumber, the levels of both Glc6P and Fru6P were much lower than those in wheat. Moreover, the concentration of Fru6P and Glc6P dramatically increased in the germinating embryo of wheat (from 0.03 and 0.11 up to 5.5 and 8.2 mg/g DW, respectively), whereas later on it decreased in the roots and coleoptile to a level as low as that in the seedlings of pea and cucumber (less than 1.2 mg/g DW; Tables S2–S4).
3.5.2. Amino Acids
Among several identified proteinogenic amino acids, asparagine, glutamine, and glutamic acid occurred at relatively high concentrations (up to 15 mg/g DW). The concentration of asparagine gradually increased in the root and epicotyl of pea (up to 8–11 mg/g DW), whereas glutamic acid and glutamine increased in the cotyledons (Figure 8A,D,G).
The concentration of glutamine in the roots and hypocotyl of cucumber was much higher than that of glutamic acid or asparagine (Figure 8B,E). In cotyledons, glutamine and glutamic acid occurred at comparable levels, and their concentrations increased until the 6th day of seed germination (Figure 8H).
In growing wheat seedlings, decreasing concentrations of glutamine and glutamic acid coincided with the accumulation of asparagine in the roots, coleoptile, and endosperm (Figure 8C,F,I).
In addition to proteinogenic amino acids, seedlings contained traces of β-alanine and γ-amino-butyric acid (GABA). Moreover, homoserine, detected only in pea, occurred at a much higher concentration than total proteinogenic amino acids (Table S2). Homoserine accumulated in the pea root and epicotyl up to the 7th day (reaching levels of 72 and 59 mg/g DW, respectively, whereas 4.4 mg/g DW accumulated in cotyledons on the 6th day of seed germination).
3.5.3. Organic Acids
Among the organic acids, citrate and malate were the dominant ones (Figure 9). The remaining intermediates of the TCA cycle occurred at lower concentrations (except for considerable amounts of α-keto-glutarate in the coleoptile and roots of wheat, 11–18 and 6–7 mg/g DW) (Table S4).
The concentrations of each of the remaining organic acids (acetic, oxalic, lactic, and propanoic acids) were below 1 mg/g DW (Tables S2–S4). All parts of pea seedlings (Figure 9A,D,G), as well as the coleoptile and endosperm of wheat (Figure 9F,I), contained more citrate than malate throughout seedling growth. In contrast to pea and wheat seedlings, cucumber seedlings accumulated more malate than citrate (Figure 9B,E,H). Moreover, the concentration of malate increased in growing cotyledons (Figure 9H).
3.5.4. Remaining Compounds
In addition to organic acids, the seedlings also contain phosphoric acid. Its concentration increased in the storage tissues of all species, as well as in the root and epicotyl of pea and coleoptile of wheat (Tables S2–S4). In the roots of wheat and the root/hypocotyl of cucumber, the concentration of phosphate decreased. Irrespective of the trend in the accumulation of phosphate, its concentration (after 7 days of seedling development) ranged from 7 to 10 mg/g DW in roots and up to 13–15 mg/g DW in shoots, remaining much higher than (pea, wheat) or comparable with the concentration of phosphate in storage tissues (Tables S2–S4).
4. Discussion
The number of polar metabolites identified in plant tissues, including seeds, depends on both the extraction method used and the analytical platform. The GC-MS platform, which is widely used in metabolome analyses of plant tissues, allows for the identification of 40–50 [9,19,34] to approximately 200 polar and non-polar metabolites, mostly associated with primary metabolism [32,53]. In our study, 51 compounds were identified, and most of them (27–30) were present in all samples of seeds/seedlings. The main metabolites in the tissues of seeds and seedlings were soluble carbohydrates, phosphate, and alcohol derivatives of monosaccharides (myo-inositol and sorbitol), amino acids, and organic acids (including intermediate metabolites of the Krebs cycle). The same groups of metabolites have been identified in germinating soybean seeds [38], Arabidopsis thaliana [9], wheat grains [40], 4-day-old seedlings of pea [54], and 3-day-old seedlings of wheat [55,56,57].
4.1. Profile of Polar Metabolites in Dry Seeds
An important feature of dry seeds, common to the species tested in our study, was a much higher concentration of total polar metabolites in the embryonic axis (pea and cucumber) or embryo (wheat) than in the storage tissues. Similar differences in the metabolome of the embryo and endosperm have been demonstrated only in wheat grains [40]. The main polar metabolites of dry seeds (both the embryonic axis/embryo and the cotyledons/endosperm) were soluble carbohydrates, including sucrose, RFOs, myo-inositol, and galactinol in cucumber and maltose and 1-kestose in wheat. The concentration of sucrose in pea cotyledons was higher than that in cucumber and wheat endosperm. Pea seeds also contained significantly more RFOs than cucumber and wheat seeds did. Additionally, in pea, all RFOs (raffinose, stachyose, and verbascose) were detected, whereas in cucumber stachyose and raffinose were detected, and in wheat only raffinose. This result is consistent with previous reports [58,59], and may confirm the participation of sucrose and RFOs in the formation of the liquid glass phase in the drying cells of ripening seeds [60,61]. This state of the cytoplasm stabilizes cell membranes and macromolecules while preventing metabolic changes, which leads to a safe transition of the maturing embryo into the state of anabiosis [62].
In the embryonic axis of pea seeds, stachyose was the dominant oligosaccharide in the RFOs, whereas verbascose was present in the cotyledons. Such differentiation was not found in cucumber seeds (containing more stachyose than raffinose in both the axis and cotyledons) and wheat grains (containing only raffinose). This means that in each of the species studied, the differential accumulation of RFOs in maturing seeds is genetically determined [63]. The high concentration of RFOs in the embryonic axis of dry seeds and their rapid decrease during seed germination (Figure 1A,B) confirmed the important role of these metabolites as primary storage materials for the early stages of seed germination [64,65,66].
The presence of maltose and 1-kestose in the embryos of dry wheat grains at levels comparable to those of sucrose can be explained in two ways. Maltose, as a consequence of incomplete accumulation of storage starch in the embryo itself, and 1-ketose (fructan) are oligosaccharides that additionally protect tissues during grain desiccation [48]. Since fructans play a protective role in the response of plants to abiotic stresses, and as reserve materials in the vegetative tissues of cereals [67], it is possible that, in wheat grains, they also constitute additional compounds stabilizing the tissues of the embryo during drying, and later in seed dormancy.
Amino acids and organic acids were present in significantly lower concentrations than soluble carbohydrates (less than 1 mg/g DW, except for glutamic and citric acids—1.58 and 5.05 mg/g DW in the pea embryonic axis). Glutamic acid is the dominant proteinogenic amino acid in pea seeds, as well as in seeds of other species of legumes, such as chickpeas, cowpeas, and lentils [68]. However, this is not a universal feature, because in the seeds of wild taxa of sweet peas, lentils, peas, and vetch, the concentration of this amino acid may be very low, even below the detection threshold [69]. Kuo et al. [70] showed that the concentration of individual amino acids may be a species-specific feature—the seeds of pea contain mainly arginine, asparagine, glutamic acid, and aspartic acid; the seeds of bean contain mainly arginine, glutamic acid, asparagine, tyrosine and alanine; and the seeds of lentil contain mainly glutamic acid, aspartic acid, asparagine, arginine, and alanine. Our research showed that in wheat grains and cucumber seeds, the dominant amino acids were glutamic acid, hydroxyproline, and asparagine (in wheat), but they were present at a level below 0.4 mg/g DW. Knežević et al. [71] showed that glycine, glutamic acid, valine, and tryptophan are dominant in wheat grains. On the other hand, in the seeds of plants from the Cucurbitaceae family, arginine, glutamic acid, aspartic acid, leucine, glycine, and valine were found in the highest amounts [72].
4.2. Changes in the Polar Metabolites Profile during Seed Germination
The faster hydration dynamics of the embryonic axis (pea and cucumber) or the embryo (wheat) compared to the tissues of storage organs during seed imbibition, as found in our study, confirms earlier reports [74,75]. Early hydration of the tissues of the embryonic axis/embryo compared to the storage tissues initiated the resumption of metabolism, including respiration. Indeed, seed germination, regardless of the species, was accompanied by an increase in the concentration of hexose phosphates (higher in the embryonic axis/embryo than in the storage organs) and TCA cycle intermediates, as in the germinating seeds of Arabidopsis thaliana [9,19], soybean [38], and grains of rice [33]. Similarly, in wheat embryos and the embryonic axes of germinating seeds of pea and cucumber, the levels of intermediates of glycolysis (Glc6P and Fru6P) and the TCA cycle (citrate, malate) increased (Figure 2D–F, Tables S2–S4). These results confirm the key role of respiration in reactivating the metabolism of hydrated cells [76]. Given the very low levels of monosaccharides in dry tissues, di- and oligosaccharides, among them RFOs, could be the available carbon sources for initiated respiration. In pea seeds, the degradation of RFOs starts with tissue hydration and proceeds faster in the embryonic axis than in the cotyledons. Verbascose disappeared faster than stachyose and raffinose (the degradation products of verbascose and stachyose, respectively). However, the decomposition of RFOs was not accompanied by an adequate increase in monosaccharide concentration. To date, it has been shown that in the embryonic axis of lupine, pea, soybean, and vetch, RFOs are degraded during the first 48 h from the start of seed imbibition, whereas the hydrolysis of RFOs in cotyledons is extended to 4–6 days [65]. In the cotyledons of cucumber seeds, the decrease in the concentration of RFOs (stachyose and raffinose) was accompanied by a successive increase in the concentration of sucrose, while the concentration of sucrose in the embryonic axis increased only temporarily (after 24 h of imbibition), and then decreased, similar to the results of previous studies [46]. In wheat, as in germinating sorghum grains [77], raffinose, the only detected oligosaccharide from RFOs, was also dynamically degraded in both the embryo and endosperm.
The hydrolysis of RFOs in germinating pea seeds is initially catalyzed by acidic α-d-galactosidase, which breaks down the RFOs still present in the cotyledons during seedling development [78]. In cucumber seeds, RFO hydrolysis is also catalyzed by α-d-galactosidase, although it is not known whether different isoforms are activated here as well [47]. However, there are no literature data on raffinose catalysis in germinating cereal grains. Although it is possible to decompose raffinose with the participation of α-d-galactosidase and invertase, resulting in the formation of melibiose (galacto-glucose) and fructose [79], melibiose was not detected in our study, which indicates the decomposition of raffinose only by α-d-galactosidase.
Seed germination was accompanied by an intensive increase in the concentration of monosaccharides (fructose and glucose), probably as a result of the decomposition of RFOs, sucrose (catalyzed by invertase) [70], and presumably other reserve materials (e.g., starch in the embryonic axis of pea and embryo of wheat). In oilseeds, such as cucumber seeds, the increase in glucose levels could result from the activation of the glyoxylate cycle (key in the degradation of storage lipids) and the gluconeogenesis pathway [80].
During seed imbibition, in the wheat embryo, unlike in the embryonic axis of pea or cucumber, the levels of sucrose and 1-kestose increased dramatically, and during the next 24 h, the levels of these sugars decreased (Figure 1C). Considering the scale of increase/decrease in both sugars over 48 h, the explanation of these changes with adequate dynamic changes in the expression and activity levels of enzymes synthesizing/degrading 1-kestose and sucrose seems unlikely. Therefore, the increase in the concentrations of 1-kestose, sucrose, and fructose in the embryo was compared with the decrease in the concentration of 1-kestose in the endosperm (calculated in μg per embryo/endosperm, data not shown), and it was hypothesized that 1-kestose was transported from the endosperm to the embryo, where it might be partly hydrolyzed to sucrose and fructose. The temporary accumulation of 1-kestose in germinating wheat grains has not yet been described. The results of our study clearly indicate the accumulation of 1-kestose. Nevertheless, confirmation of the suggested flow of 1-kestose between the endosperm and embryo during the germination of wheat grains, based on the results of our research, requires further research.
The significant increase in the concentration of myo-inositol in the embryonic axis of pea and cucumber and in the germ of wheat during seed germination (Tables S2–S4) was probably a consequence of the hydrolysis of phytic acid [81] and/or the resumption of myo-inositol synthesis from Glc6P [82]. The accumulation of free myo-inositol in the wheat embryo (after the first day of germination) and in the cucumber embryonic axis (after the 2nd day of germination) was accompanied by a rapid increase in the level of orthophosphate (up to 5.44 and 9.19 and mg/g DW, respectively). In contrast, the concentration of phosphoric acid decreased in the embryonic axis of pea, which may have resulted from its use as a substrate for the synthesis of phospholipids and nucleic acids [83].
As expected, the embryonic axis/embryo of germinating seeds/grains significantly increased the concentration of most proteinogenic amino acids, probably released from storage proteins [84]. However, a similar increase in the level of amino acids was not observed in the cotyledons.
The activation of metabolism was also accompanied by a successive increase, similar to the embryonic axis of cucumber and wheat germ, or a decrease, similar to the embryonic axis of pea, in the predominant organic acids citric and malic acid. Both acids, as intermediate metabolites of the Krebs cycle, after transport from the mitochondria to the cytoplasm, can be converted to oxaloacetate in reactions catalyzed by citrate lyase and malate dehydrogenase [85], which, after conversion to pyruvate, can be included in the gluconeogenesis pathway [25] and the biosynthesis of branched-chain amino acids—lysine, isoleucine, and valine [86].
4.3. Changes in the Polar Metabolite Profiles of Growing Seedlings
The growth and development of seedlings before the formation of fully photosynthetically active organs, such as leaves, peas, and wheat, or growing cotyledons, as in cucumber, completely depend on the mobilization and transformation of storage materials. The decomposition of starch, proteins, and fat, ensuring the supply of carbon and nitrogen for the growing roots and shoots, was reflected in the reduction in the DW of the storage organs. Changes in the storage tissues of pea and wheat are also associated with the programmed death of cotyledons and endosperm cells [87], while the appearance and accumulation of chlorophyll in the enlarged cotyledons of cucumber (Figure S3C) indicate early development of the photosynthetic apparatus. However, cucumber cotyledons reach full capacity for photosynthesis several days after emergence [88]. In our study, an increase in the size of cucumber cotyledons was observed, and the visible system of conductive bundles confirmed the later role of the cotyledons as the primary autotrophic donors of photoassimilates for the developing plant. In wheat, the first leaf emerging above the coleoptile (between the 6th and 7th days of germination) also contained chlorophyll (Figure S3), but its contribution to the transition from the heterotrophic to autotrophic phase seems to be insignificant, as the developing leaf becomes a photoassimilate donor only after reaching more than half of its final size [89]. In pea seedlings, photosynthetic organs (stipules and leaves) began to form. The above observations suggest that until the 7th day from the beginning of seed germination, the seedlings were fed only heterotrophically.
For the growth of roots and shoots, it is crucial to maintain a sufficiently high turgor pressure as a motor force enabling cell elongation. This is possible because of the low osmotic potential of the cytoplasm and vacuole (which is directly influenced by the concentration of osmotically active compounds, mainly sugars and organic acids) that determines the inflow of water to the cell [90]. Perhaps the high concentrations of glucose and sucrose, as in the roots and epicotyl/coleoptile of pea and wheat, or glucose and fructose in cucumber seedlings (as well as malic and citric acid in all species; Figure 5 and Figure 9), determined the water uptake and persistence of high cell turgor.
Metabolomic analyses of the developing seedlings of soybean [38] and Arabidopsis [9] indicated that a decrease in sucrose with a simultaneous accumulation of fructose and glucose, as well as an increase in the concentration of amino acids (mainly glutamic acid, glutamine, aspartic acid, and asparagine) and organic acids, especially in the TCA cycle, seems to be a common feature of metabolism in the developing seedlings of various plant species. However, the results of our study revealed species-specific changes in the sugar concentrations. The common feature for pea, cucumber, and wheat seedlings was the highest concentration of glucose, sucrose, citric acid, and malic acid among the identified polar metabolites. Differences were observed in the changes in the concentration of the major amino acids: asparagine increased in the root and epicotyl of pea (similar to bean and lentil seedlings [70]); asparagine and glutamine increased in wheat; and alanine, glutamine, and serine increased in cucumber. High concentrations of glucose and fructose indicate that they are the main source of carbon skeletons and energy supply, securing the intensive metabolism of growing cells/tissues, while high concentrations of asparagine and glutamine seem to confirm the role of these amino acids as the main transport forms of nitrogen [91,92,93]. A common feature of changes in the metabolome of pea and wheat seedlings is the accumulation of phosphoric acid, presumably as a result of the decomposition of phytic acid (binding 60–90% of total phosphorus [94]), as in germinating seeds and seedlings of other plant species, such as rice, maize, millet, and sorghum [95].
It should also be noted that changes in the concentration of sugars can affect the mobilization of lipids [26,27,96], which seems to be especially important in germinating cucumber seeds (classified as oilseeds), utilizing lipids during germination, and in post-germinative growth [25,97]. The hydrolysis of triacylglycerol and the β-oxidation of fatty acids lead to the production of acetyl-CoA, which is then converted to sucrose through the glyoxylate cycle and gluconeogenesis [25]. Moreover, dynamic remodeling of the membrane lipid composition occurs during cucumber seed germination and post-germinative growth [98].
The presence of some metabolites is species-specific. Pea seedlings (root and epicotyl, but not cotyledons) were distinguished by the accumulation of homoserine (a major amino acid), which has been known for many years in germinating pea seeds [44]. It is assumed that homoserine is formed from aspartic acid [70] and may be a transport form of nitrogen flowing from storage tissues to growing seedlings [45]. Homoserine can also be produced in the chloroplasts of developed leaves [99] and serves as a precursor in the threonine, methionine, and isoleucine synthesis pathways [100].
The specificity of cucumber metabolism was the presence of galactinol and RFOs (raffinose and stachyose) during the 7 days of seedling growth and development. Changes in the concentration of galactinol and RFOs, and mainly their accumulation after the 3rd day of germination, indicate the early development of Cucurbitaceae-specific phloem loading and carbon transport systems in cucumber seedlings, which are transported through sieve tubes to sink tissues [101]. In cucumber seedlings, these organs are the roots and the hypocotyl, in which the concentrations of stachyose and raffinose are much higher than in the cotyledons. The increased level of galactinol, an essential substrate for the synthesis of RFOs in cotyledons, may indicate the location of its production and loading into the phloem.
Maltose and 1-kestose were specific metabolites of wheat seedlings (not detected in pea and cucumber). The successive increase in the concentration of maltose in the endosperm indicates that the decomposition of starch intensifies with seedling development, and the decreasing concentration of 1-kestose may result from its role as a temporary carbon store and/or participation in the regulation of the osmotic potential of cells [67].
5. Conclusions
The application of GC-FID and GC-MS platforms for polar metabolite profiling may be an appropriate strategy for the comparison and assessment of similarities and differences in the composition and concentration of polar metabolites during the seed-to-seedling transition of various plant species. The results of the present study revealed common metabolic features for the studied species: (i) higher metabolic activity in embryonic axes (pea, cucumber) or embryo than in storage tissues during seed germination; (ii) an earlier degradation of RFOs in the embryonic axes than in the cotyledons of germinating seeds; (iii) an early resumption of respiration (on the basis of a rapid increase in hexose phosphates from the glycolytic pathway and intermediates in the TCA cycle); (iv) an increase in soluble carbohydrates, amino acids, and organic acids during seedling development; and (v) an early synthesis of species-specific metabolites in growing seedlings—homoserine in pea; galactinol, raffinose, and stachyose in cucumber; and 1-kestose in wheat. Finally, in 7-day-old seedlings with a size corresponding to field emergence, the dominant polar metabolites were soluble carbohydrates in each organ of cucumber and wheat seedlings, as well as in the cotyledons of pea.
Supplementary Materials
The following supporting information can be downloaded at https://www.mdpi.com/article/10.3390/agriculture13122278/s1: Figure S1: Chromatograms of TMS derivatives of polar metabolites in roots of 3-day-old seedlings of pea (A), cucumber (B), and wheat (C), obtained by the GC-FID method. Selected metabolites common for seedlings: 1—fructose; 2—glucose; 3—myo-inositol; 4—sucrose; 5—phosphoric acid; 6—malate; 7—citrate; 8—hexose*. Species-specific metabolites: 9, 10—di-ethylamine** and homoserine (in pea); 11—raffinose (in cucumber); and 12—1-kestose (in wheat). * and **—both metabolites not confirmed with original standards. Figure S2: Percentage of total concentration of soluble carbohydrates (TSCs), amino acids (TAAs), organic acids (TOAs), and remaining compounds (TRCs) in the total content of polar metabolites in embryonic axis/embryo (A–C) and storage tissues (D–F) of dry seeds of pea (A,D), cucumber (B,E), and grains of wheat (C,F). Figure S3: Photographs of changes in the morphology of pea (Pisum sativum L. cv. Hubal (A)), wheat (Triticum aestivum L. cv. Forkida (B)), and cucumber (Cucumis sativus L. cv. Polan F1 (C)) during 7 days of germination at 20/10 °C (for pea and wheat) or 25/20 °C (for cucumber) at photoperiod 14 h light/10 h darkness. Table S1: Changes in length (L, mm), fresh weight (FW, in mg/part or mg/2 cotyledons), and water content (WC, as % of FW) during 7 days of seed germination and seedling development in pea, cucumber, and wheat. Values are means of 3–5 replicates. Abbreviations: PR—primary root; Rs—root system; Ep—epicotyl; C—2 cotyledons; S—shoot (coleoptile with leaf); E—endosperm with seed coat. Table S2: Concentration of polar metabolites in cotyledons, embryonic axis, root, and epicotyl of garden pea (Pisum sativum L. cv. Hubal) during seed germination and seedling development. Means (n = 3–5) in mg/g DW. Statistically significant differences (p < 0.05) are indicated by different letters after one-way ANOVA and Tukey’s post hoc test. Table S3: Concentration of polar metabolites in the cotyledons, embryonic axis, roots, and hypocotyl of cucumber (Cucumis sativum L. cv. Polan F1) during seed gemination and seedling development. Means (n = 3–5) in mg/g DW. Statistically significant differences (p < 0.05) are indicated by different letters after one-way ANOVA and Tukey’s post hoc test. Table S4: Concentration of polar metabolites in the endosperm, embryo, roots, and coleoptile of wheat (Triticum aestivum L. cv. Forkida) during grain germination and seedling development. Means (n = 3–5) in mg/g DW. Statistically significant differences (p < 0.05) are indicated by different letters after one-way ANOVA and Tukey’s post hoc test.
Author Contributions
Conceptualization, J.S.-P. and L.B.L.; methodology, J.S.-P.; software, J.S.-P.; validation, J.S.-P. and L.B.L.; formal analysis, J.S.-P. and L.B.L.; investigation, J.S.-P.; resources, J.S.-P.; data curation, L.B.L.; writing—original draft preparation, J.S.-P.; writing—review and editing, L.B.L.; visualization, J.S.-P.; supervision, L.B.L.; project administration, L.B.L.; funding acquisition, L.B.L. All authors have read and agreed to the published version of the manuscript.
Funding
This research was funded by the University of Warmia and Mazury in Olsztyn, Poland through statutory funding (No. 12.610.004-110) and by grant No. NN310776440, provided by the National Center of Science, Poland.
Institutional Review Board Statement
Not applicable.
Data Availability Statement
The data presented in this study are available in this article.
Conflicts of Interest
The authors declare no conflict of interest.
References
- Bewley, J.D. Seed germination and dormancy. Plant Cell 1997, 9, 1055–1066. [Google Scholar] [CrossRef] [PubMed]
- Finch-Savage, W.E.; Leubner-Metzger, G. Seed dormancy and the control of germination. New Phytol. 2006, 171, 501–523. [Google Scholar] [CrossRef] [PubMed]
- Nonogaki, H. Seed dormancy and germination–emerging mechanisms and new hypotheses. Front. Plant Sci. 2014, 5, 233. [Google Scholar] [CrossRef]
- Han, C.; Yang, P. Studies on the molecular mechanisms of seed germination. Proteomics 2015, 15, 1671–1679. [Google Scholar] [CrossRef]
- Silva, A.T.; Ribone, P.A.; Chan, R.L.; Ligterink, W.; Hilhorst, H.W.M. A predictive coexpression network identifies novel genes controlling the seed-to-seedling phase transition in Arabidopsis thaliana. Plant Physiol. 2016, 170, 2218–2231. [Google Scholar] [CrossRef]
- North, H.; Baud, S.; Debeaujon, I.; Dubos, C.; Dubreucq, B.; Grappin, P.; Jullien, M.; Lepiniec, L.; Marion-Poll, A.; Miquel, M.; et al. Arabidopsis seed secrets unravelled after a decade of genetic and omics-driven research. Plant J. 2010, 61, 971–981. [Google Scholar] [CrossRef] [PubMed]
- Catusse, J.; Job, C.; Job, D. Transcriptome- and proteome-wide analyses of seed germination. Comptes Rendus Biol. 2008, 331, 815–822. [Google Scholar] [CrossRef]
- Allen, E.; Moing, A.; Ebbels, T.M.D.; Maucourt, M.; Tomos, A.D.; Rolin, D.; Hooks, M.A. Correlation network analysis reveals a sequential reorganization of metabolic and transcriptional states during germination and gene-metabolite relationships in developing seedlings of Arabidopsis. BMC Syst. Biol. 2010, 4, 62. [Google Scholar] [CrossRef]
- Silva, A.T.; Ligterink, W.; Hilhorst, H.W.M. Metabolite profiling and associated gene expression reveal two metabolic shifts during the seed-to-seedling transition in Arabidopsis thaliana. Plant Mol. Biol. 2017, 95, 481–496. [Google Scholar] [CrossRef]
- Weckwerth, W. Metabolomics in systems biology. Annu. Rev. Plant Biol. 2003, 54, 669–689. [Google Scholar] [CrossRef]
- Sreenivasulu, N. Systems biology of seeds: Deciphering the molecular mechanisms of seed storage, dormancy and onset of germination. Plant Cell Rep. 2017, 36, 633–635. [Google Scholar] [CrossRef]
- Cramer, G.R.; Urano, K.; Delrot, S.; Pezzotti, M.; Shinozaki, K. Effects of abiotic stress on plants: A systems biology perspective. BMC Plant Biol. 2011, 11, 163. [Google Scholar] [CrossRef]
- Ramalingam, A.; Kudapa, H.; Pazhamala, L.T.; Weckwerth, W.; Varshney, R.K. Proteomics and metabolomics: Two emerging areas for legume improvement. Front. Plant Sci. 2015, 6, 1116. [Google Scholar] [CrossRef]
- Weitbrecht, K.; Müller, K.; Leubner-Metzger, G. First off the mark: Early seed germination. J. Exp. Bot. 2011, 62, 3289–3309. [Google Scholar] [CrossRef]
- Tamura, T.; Kamei, A.; Ueda, R.; Arai, S.; Mura, K. Characterization of the quality of imbibed soybean at an early stage of pre-germination for the development of a new protein food item. Biosci. Biotechnol. Biochem. 2014, 78, 115–123. [Google Scholar] [CrossRef] [PubMed]
- Yan, D.; Duermeyer, L.; Leoveanu, C.; Nambara, E. The functions of the endosperm during seed germination. Plant Cell Physiol. 2014, 55, 1521–1533. [Google Scholar] [CrossRef] [PubMed]
- Xu, H.H.; Liu, S.J.; Song, S.H.; Wang, R.X.; Wang, W.Q.; Song, S.Q. Proteomics analysis reveals distinct involvement of embryo and endosperm proteins during seed germination in dormant and non-dormant rice seeds. Plant Physiol. Biochem. 2016, 103, 219–242. [Google Scholar] [CrossRef] [PubMed]
- Rosental, L.; Nonogaki, H.; Fait, A. Activation and regulation of primary metabolism during seed germination. Seed Sci. Res. 2014, 24, 1–15. [Google Scholar] [CrossRef]
- Fait, A.; Angelovici, R.; Less, H.; Ohad, I.; Urbanczyk-Wochniak, E.; Fernie, A.R.; Galili, G. Arabidopsis seed development and germination is associated with temporally distinct metabolic switches. Plant Physiol. 2006, 142, 839–854. [Google Scholar] [CrossRef]
- Sreenivasulu, N.; Usadel, B.; Winter, A.; Radchuk, V.; Scholz, U.; Stein, N.; Weschke, W.; Strickert, M.; Close, T.J.; Stitt, M.; et al. Barley grain maturation and germination: Metabolic pathway and regulatory network commonalities and differences highlighted by new MapMan/PageMan profiling tools. Plant Physiol. 2008, 146, 1738–1758. [Google Scholar] [CrossRef]
- Zhao, M.; Zhang, H.; Yan, H.; Qiu, L.; Baskin, C.C. Mobilization and role of starch, protein, and fat reserves during seed germination of six wild grassland species. Front. Plant Sci. 2018, 9, 234. [Google Scholar] [CrossRef]
- Kelly, A.A.; Quettier, A.L.; Shaw, E.; Eastmond, P.J. Seed storage oil mobilization is important but not essential for germination or seedling establishment in Arabidopsis. Plant Physiol. 2011, 157, 866–875. [Google Scholar] [CrossRef] [PubMed]
- Tan-Wilson, A.L.; Wilson, K.A. Mobilization of seed protein reserves. Physiol. Plant 2012, 145, 140–153. [Google Scholar] [CrossRef]
- Lloyd, J.R.; Kossmann, J. Transitory and storage starch metabolism: Two sides of the same coin? Curr. Opin. Biotechnol. 2015, 32, 143–148. [Google Scholar] [CrossRef] [PubMed]
- Eastmond, P.J.; Germain, V.; Lange, P.R.; Bryce, J.H.; Smith, S.M.; Graham, I.A. Postgerminative growth and lipid catabolism in oilseeds lacking the glyoxylate cycle. Proc. Natl. Acad. Sci. USA 2000, 97, 5669–5674. [Google Scholar] [CrossRef] [PubMed]
- To, J.P.C.; Reiter, W.D.; Gibson, S.I. Mobilization of seed storage lipid by Arabidopsis seedlings is retarded in the presence of exogenous sugars. BMC Plant Biol. 2002, 2, 4. [Google Scholar] [CrossRef]
- Erbaş, S.; Tonguç, M.; Karakurt, Y.; Şanli, A. Mobilization of seed reserves during germination and early seedling growth of two sunflower cultivars. J. Appl. Bot. Food Qual. 2016, 89, 217–222. [Google Scholar]
- Han, C.; Yin, X.; He, D.; Yang, P. Analysis of proteome profile in germinating soybean seed, and its comparison with rice showing the styles of reserves mobilization in different crops. PLoS ONE 2013, 8, e56947. [Google Scholar] [CrossRef]
- Allwood, J.W.; Ellis, D.I.; Goodcare, R. Metabolomic technologies and their application to the study of plant and plant-host interactions. Physiol. Plant 2008, 132, 117–135. [Google Scholar] [CrossRef]
- Lisec, J.; Schauer, N.; Kopka, J.; Willmitzer, L.; Fernie, A.R. Gas chromatography mass spectrometry-based metabolite profiling in plants. Nat. Protoc. 2006, 1, 387–396. [Google Scholar] [CrossRef]
- Obata, T.; Matthes, A.; Koszior, S.; Lehmann, M.; Araújo, W.L.; Bock, R.; Sweetlove, L.J.; Fernie, A.R. Alternation of mitochondrial protein complexes in relation to metabolic regulation under short-term oxidative stress in Arabidopsis seedlings. Phytochemistry 2011, 71, 1081–1091. [Google Scholar] [CrossRef]
- Frank, T.; Scholz, B.; Peter, S.; Engel, K.H. Metabolite profiling of barley: Influence of the malting process. Food Chem. 2011, 124, 948–957. [Google Scholar] [CrossRef]
- Howell, K.A.; Narsai, R.; Carroll, A.; Ivanova, A.; Lohse, M.; Usadel, B.; Millar, A.H.; Whelan, J. Mapping metabolic and transcript temporal switches during germination in rice highlights specific transcription factors and the role of RNA instability in the germination process. Plant Physiol. 2009, 149, 961–980. [Google Scholar] [CrossRef] [PubMed]
- Na Jom, K.; Frank, T.; Engel, K.H. A metabolite profiling approach to follow the sprouting process of mung beans (Vigna radiata). Metabolomics 2011, 7, 102–117. [Google Scholar] [CrossRef]
- Na Jom, K.; Chanput, W.; Ngampongsai, S. Effect of genetic and climatic variability on the metabolic profiles of black gram (Vigna mungo L.) seeds and sprouts. J. Sci. Food Agric. 2015, 95, 1662–1669. [Google Scholar] [CrossRef] [PubMed]
- Gomez Roldan, M.V.; Engel, B.; de Vos, R.C.H.; Vereijken, P.; Astola, L.; Groenenboom, M.; van de Geest, H.; Bovy, A.; Molenaar, J.; van Eeuwijk, F.; et al. Metabolomics reveals organ-specific metabolic rearrangements during early tomato seedling development. Metabolomics 2014, 10, 958–974. [Google Scholar] [CrossRef]
- Ribeiro, P.R.; Willems, L.A.J.; Mudde, E.; Fernandez, L.G.; de Castro, R.D.; Ligterink, W.; Hilhorst, H.W.M. Metabolite profiling of the oilseed crop Ricinus communis during early seed imbibition reveals a specific metabolic signature in response to temperature. Ind. Crops Prod. 2015, 67, 305–309. [Google Scholar] [CrossRef]
- Gu, E.J.; Kim, D.W.; Jang, G.J.; Song, S.H.; Lee, J.I.; Lee, S.B.; Kim, B.M.; Cho, Y.; Lee, H.J.; Kim, H.J. Mass-based metabolomic analysis of soybean sprouts during germination. Food Chem. 2017, 217, 311–319. [Google Scholar] [CrossRef]
- He, M.; Zhu, C.; Dong, K.; Zhang, T.; Cheng, Z.; Li, J.; Yan, Y. Comparative proteome analysis of embryo and endosperm reveals central differential expression proteins involved in wheat seed germination. BMC Plant Biol. 2015, 15, 97. [Google Scholar] [CrossRef]
- Han, C.; Zhen, S.; Zhu, G.; Bian, Y.; Yan, Y. Comparative metabolome analysis of wheat embryo and endosperm reveals the dynamic changes of metabolites during seed germination. Plant Physiol. Biochem. 2017, 115, 320–327. [Google Scholar] [CrossRef]
- Shu, X.L.; Frank, T.; Shu, Q.Y.; Engel, K.R. Metabolite profiling of germinating rice seeds. J. Agric. Food Chem. 2008, 56, 11612–11620. [Google Scholar] [CrossRef] [PubMed]
- Rodziewicz, P.; Swarcewicz, B.; Chmielewska, K.; Wojakowska, A.; Stobiecki, M. Influence of abiotic stresses on plant proteome and metabolome changes. Acta Physiol. Plant. 2014, 36, 1–19. [Google Scholar] [CrossRef]
- Swarcewicz, B.; Sawikowska, A.; Marczak, Ł.; Łuczak, M.; Ciesiołka, D.; Krystkowiak, K.; Kuczyńska, A.; Piślewska-Bednarek, M.; Krajewski, P.; Stobiecki, M. Effect of drought stress on metabolite contents in barley recombinant inbred line population revealed by untargeted GC-MS profiling. Acta Physiol. Plant. 2017, 39, 158. [Google Scholar] [CrossRef]
- Virtanen, A.I.; Berg, A.; Kari, S. Formation of homoserine in germinating pea seeds. Acta Chem. Scand. 1953, 7, 1423–1424. [Google Scholar] [CrossRef]
- Melcher, I.M. Homoserine synthesis in dark-grown and light-grown seedlings of Pisum sativum. New Phytol. 1985, 100, 157–162. [Google Scholar] [CrossRef]
- Lin, T.P.; Yen, W.L.; Chien, C.T. Disappearance of desiccation tolerance of imbibed crop seeds is not associated with the decline of oligosaccharides. J. Exp. Bot. 1998, 49, 1203–1212. [Google Scholar] [CrossRef]
- Miao, M.; Zhang, Z. Carbohydrate metabolism of cucurbits. In Handbook of Cucurbits Growth, Cultural Practices, and Physiology; Pessarakli, M., Ed.; CRC Press: Boca Raton, FL, USA, 2016. [Google Scholar]
- Valluru, R.; Van Den Ende, W. Plant fructans in stress environments: Emerging concepts and future prospects. J. Exp. Bot. 2008, 59, 2905–2916. [Google Scholar] [CrossRef]
- Szablińska-Piernik, J.; Lahuta, L.B. Metabolite profiling of semi-leafless pea (Pisum sativum L.) under progressive soil drought and subsequent re-watering. J. Plant Physiol. 2021, 256, 153314. [Google Scholar] [CrossRef]
- Lahuta, L.B.; Górecki, R.J.; Zalewski, K.; Hedley, C.L. Sorbitol accumulation during natural and accelerated ageing of pea (Pisum sativum L.) seeds. Acta Physiol. Plant. 2007, 29, 527–534. [Google Scholar] [CrossRef]
- Lahuta, L.B.; Górecki, R.J. Raffinose in seedlings of winter vetch (Vicia villosa Roth.) under osmotic stress and followed by recovery. Acta Physiol. Plant. 2011, 33, 725–733. [Google Scholar] [CrossRef]
- Sun, X.; Weckwerth, W. COVAIN: A toolbox for uni- and multivariate statistics, time-series and correlation network analysis and inverse estimation of the differential Jacobian from metabolomics covariance data. Metabolomics 2012, 8, 81–93. [Google Scholar] [CrossRef]
- Abozeid, A.; Liu, J.; Ma, Y.; Liu, Y.; Guo, X.; Tang, Z. Seed metabolite profiling of Vicia species from China via GC-MS. Nat. Prod. Res. 2017, 32, 1863–1866. [Google Scholar] [CrossRef] [PubMed]
- Szablińska-Piernik, J.; Lahuta, L.B.; Stałanowska, K.; Horbowicz, M. The imbibition of pea (Pisum sativum L.) seeds in silver nitrate reduces seed germination, seedlings development and their metabolic profile. Plants 2022, 11, 1877. [Google Scholar] [CrossRef] [PubMed]
- Lahuta, L.B.; Szablińska-Piernik, J.; Stałanowska, K.; Głowacka, K.; Horbowicz, M. The size-dependent effects of silver nanoparticles on germination, early seedling development and polar metabolite profile of wheat (Triticum aestivum L.). Int. J. Mol. Sci. 2022, 23, 13255. [Google Scholar] [CrossRef] [PubMed]
- Lahuta, L.B.; Szablińska-Piernik, J.; Głowacka, K.; Stałanowska, K.; Railean-Plugaru, V.; Horbowicz, M.; Pomastowski, P.; Buszewski, B. The effect of bio-synthesized silver nanoparticles on germination, early seedling development, and metabolome of wheat (Triticum aestivum L.). Molecules 2022, 27, 2303. [Google Scholar] [CrossRef]
- Stałanowska, K.; Szablińska-Piernik, J.; Okorski, A.; Lahuta, L.B. Zinc Oxide Nanoparticles affect early seedlings’ growth and polar metabolite profiles of pea (Pisum sativum L.) and wheat (Triticum aestivum L.). Int. J. Mol. Sci. 2023, 24, 14992. [Google Scholar] [CrossRef]
- Kuo, T.M.; van Middlesworth, J.F.; Wolf, W.J. Content of raffinose oligosaccharides and sucrose in various plant seeds. J. Agric. Food Chem. 1988, 36, 32–36. [Google Scholar] [CrossRef]
- Horbowicz, M.; Obendorf, R. Seed desiccation tolerance and storability: Dependence on flatulence-producing oligosaccharides and cycylitols—Revew and survey. Seed Sci. Res. 1994, 4, 385–405. [Google Scholar] [CrossRef]
- Bernal-Lugo, I.; Leopold, A.C. Seed stability during storage: Raffinose content and seed glassy state. Seed Sci. Res. 1985, 5, 75–80. [Google Scholar] [CrossRef]
- Sun, W.Q.; Irving, T.C.; Leopold, A.C. The role of sugars, vitrification and membrane phase transition in seed desiccation tolerance. Physiol. Plant. 1994, 90, 621–628. [Google Scholar] [CrossRef]
- Hoekstra, F.A.; Golovina, E.A.; Buitink, J. Mechanisms of plant desiccation tolerance. Trends Plant Sci. 2001, 6, 431–438. [Google Scholar] [CrossRef] [PubMed]
- Obendorf, R.L.; Górecki, R.J. Soluble carbohydrates in legume seeds. Seed Sci. Res. 2012, 22, 219–242. [Google Scholar] [CrossRef]
- Blöchl, A.; Peterbauer, T.; Richter, A. Inhibition of raffinose oligosaccharide breakdown delays germination of pea seeds. J. Plant Physiol. 2007, 164, 1093–1096. [Google Scholar] [CrossRef]
- Lahuta, L.B.; Goszczyńska, J. Inhibition of raffinose family oligosaccharides and galactosyl pinitols breakdown delays germination of winter vetch (Vicia villosa Roth.) seeds. Acta Soc. Bot. Pol. 2009, 78, 203–208. [Google Scholar] [CrossRef]
- Gangl, R.; Tenhaken, R. Raffinose family oligosaccharides act as galactose stores in seeds and are required for rapid germination of Arabidopsis in the dark. Front. Plant Sci. 2016, 7, 1115. [Google Scholar] [CrossRef]
- Livingston III, D.P.; Hincha, D.K.; Heyer, A.G. Fructan and its relationship to abiotic stress tolerance in plants. Cell Mol. Life Sci. 2009, 66, 2007–2023. [Google Scholar] [CrossRef]
- Iqbal, A.; Khalil, I.A.; Ateeq, N.A.; Khan, M.S. Nutritional quality of important food legumes. Food Chem. 2006, 97, 331–335. [Google Scholar] [CrossRef]
- Pastor-Cavada, E.; Juan, R.; Pastor, J.E.; Alaiz, M.; Vioque, J. Protein and amino acid composition of select wild legume species of tribe Fabeae. Food Chem. 2014, 163, 97–102. [Google Scholar] [CrossRef]
- Kuo, Y.H.; Rozan, P.; Lambein, F.; Frias, J.; Vidal-Valverde, C. Effects of different germination conditions on the contents of free protein and non-protein amino acids of commercial legumes. Food Chem. 2004, 86, 537–545. [Google Scholar] [CrossRef]
- Knežević, D.; Mihajlović, D.; Kondić, D. Contents of amino acids in grains of different bread wheat genotypes. Agro-Knowl. J. 2013, 14, 431–439. [Google Scholar] [CrossRef]
- Jacks, T.J.; Hensarling, T.P.; Yatsu, L.Y. Cucurbit Seeds: I. Characterizations and uses of oils and proteins. A review. Econ. Bot. 1972, 26, 135–141. [Google Scholar] [CrossRef]
- Kazmi, R.H.; Willems, L.A.J.; Joosen, R.V.L.; Khan, N.; Ligterink, W.; Hilhorst, J.W.M. Metabolomic analysis of tomato seed germination. Metabolomics 2017, 13, 145. [Google Scholar] [CrossRef] [PubMed]
- Wojtyla, Ł.; Garnczarska, M.; Zalewski, T.; Bednarski, W.; Ratajczak, L.; Jurga, S. A comparative study of water distribution, free radical production and activation of antioxidative metabolism in germinating pea seeds. J. Plant Physiol. 2006, 163, 1207–1220. [Google Scholar] [CrossRef] [PubMed]
- Rathjen, J.R.; Strounina, E.V.; Mares, D.J. Water movement into dormant and non dormant wheat (Triticum aestivum L.) grains. J. Exp. Bot. 2009, 60, 1619–1631. [Google Scholar] [CrossRef]
- Bewley, J.D.; Black, M. SEEDS Physiology of Development and Germination; Springer: New York, NY, USA, 1994. [Google Scholar] [CrossRef]
- Aisien, A.O. Utilisation of soluble carbohydrates during sorghum germination and seedling growth. J. Inst. Brew. 1982, 88, 164–166. [Google Scholar] [CrossRef]
- Blöchl, A.; Peterbauer, T.; Hofmann, J.; Richter, A. Enzymatic breakdown of raffinose oligosaccharides in pea seeds. Planta 2008, 228, 99–110. [Google Scholar] [CrossRef] [PubMed]
- Du, L.; Pang, H.; Wang, Z.; Lu, J.; Wei, Y.; Huang, R. Characterization of an invertase with pH tolerance and truncation of its N-terminal to shift optimum activity toward neutral pH. PLoS ONE 2013, 8, e62306. [Google Scholar] [CrossRef]
- Borek, S.; Kubala, S.; Kubala, S. Regulation by sucrose of storage compounds breakdown in germinating seeds of yellow lupine (Lupinus luteus L.), white lupine (Lupinus albus L.) and Andean lupine (Lupinus mutabilis Sweet): I. Mobilization of storage protein. Acta Physiol. Plant. 2012, 34, 701–711. [Google Scholar] [CrossRef]
- Urbano, G.; Lopez-Jurado, M.; Aranda, P.; Vidal-Valverde, C.; Tenorio, E.; Porres, J. The role of phytic acid in legumes: Antinutrient or beneficial function? J. Physiol. Biochem. 2000, 56, 283–294. [Google Scholar] [CrossRef]
- Geiger, J.H.; Jin, X. The structure and mechanism of myo-inositol-1-phosphate synthase. In Biology of Inositols and Phosphoinositides; Lahiri Majumder, A., Biswas, B.B., Eds.; Springer: Berlin/Heidelberg, Germany, 2006. [Google Scholar]
- Frank, A.W. (Ed.) Phytic Acid. In Chemistry of Plant Phosphorus Compounds; Elsevier: Amsterdam, The Netherlands, 2013. [Google Scholar]
- Müntz, K.; Belozersky, M.A.; Dunaevsky, Y.E.; Schleretch, A.; Tiedemann, J. Stored proteinases and the initiation of storage protein mobilization in seeds during germination and seedling growth. J. Exp. Bot. 2001, 52, 1741–1752. [Google Scholar] [CrossRef]
- Hanning, I.; Baumgarten, K.; Schott, K.; Heldt, H.W. Oxaloacetate transport into plant mitochondria. Plant Physiol. 1999, 119, 1025–1031. [Google Scholar] [CrossRef]
- Binder, S. Branched-chain amino acid metabolism in Arabidopsis thaliana. Arab. Book 2010, 8, e0137. [Google Scholar] [CrossRef] [PubMed]
- Domínguez, F.; Cejudo, F.J. Programmed cell death (PCD): An essential process of cereal seed development and germination. Front. Plant Sci. 2014, 5, 366. [Google Scholar] [CrossRef] [PubMed]
- Moran, R.; Vernon, L.P.; Porath, D.; Arzee, T. Developmental stages of cucumber seedlings. Plant Physiol. 1990, 92, 1075–1080. [Google Scholar] [CrossRef] [PubMed]
- Starck, Z. Transport i Dystrybucja Substancji Pokarmowych w Roślinach; Wydawnictwo SGGW: Warsaw, Poland, 2003. (In Polish) [Google Scholar]
- Turner, N.C. Turgor maintenance by osmotic adjustment, an adaptive mechanism for coping with plant water deficits. Plant Cell Environ. 2017, 40, 1–3. [Google Scholar] [CrossRef] [PubMed]
- Lalonde, S.; Tegeder, M.; Throne-Holst, M.; Frommer, W.B.; Patrick, J.W. Phloem loading and unloading of sugars and amino acids. Plant Cell Environ. 2003, 26, 37–56. [Google Scholar] [CrossRef]
- Lea, P.J.; Sodek, L.; Parry, M.A.J.; Shewry, P.R.; Halford, N.G. Asparagine in plants. Ann. App Biol. 2006, 150, 1–26. [Google Scholar] [CrossRef]
- Sengupta-Gopalan, C.; Ortega, J.L. An insight into the role and regulation of glutamine synthetase in plants. In Amino Acids in Higher Plants; D’mello, P.F., Ed.; CABI: Wallingford, UK, 2015. [Google Scholar]
- Wu, P.; Tian, J.C.; Walker, C.E.; Wang, F.C. Determination of phytic acid in cereals—A brief review. Int. J. Food Sci. Technol. 2009, 44, 1671–1676. [Google Scholar] [CrossRef]
- Azeke, M.A.; Egielewa, S.J.; Eigbogbo, M.U.; Ihimire, I.G. Effect of germination on the phytase activity, phytate and total phosphorus contents of rice (Oryza sativa), maize (Zea mays), millet (Panicum miliaceum), sorghum (Sorghum bicolor) and wheat (Triticum aestivum). J. Food Sci. Technol. 2011, 48, 724–729. [Google Scholar] [CrossRef]
- Borek, S.; Stefaniak, S.; Nuc, K.; Wojtyla, Ł.; Ratajczak, E.; Sitkiewicz, E.; Malinowska, A.; Świderska, B.; Wleklik, K.; Pietrowska-Borek, M. Sugar starvation disrupts lipid breakdown by inducing autophagy in embryonic axes of lupin (Lupinus spp.) germinating seeds. Int. J. Mol. Sci. 2023, 24, 11773. [Google Scholar] [CrossRef]
- Matsui, K.; Hijiya, K.; Tabuchi, Y.; Kajiwara, T. Cucumber cotyledon lipoxygenase during postgerminative growth. Its expression and action on lipid bodies. Plant Physiol. 1999, 119, 1279–1288. [Google Scholar] [CrossRef]
- Yu, X.; Li, A.; Li, W. How membranes organize during seed germination: Three patterns of dynamic lipid remodelling define chilling resistance and affect plastid biogenesis. Plant Cell Environ. 2015, 38, 1391–1403. [Google Scholar] [CrossRef] [PubMed]
- Sainis, J.K.; Mayne, R.G.; Wallsgrove, R.M.; Lea, P.J.; Miflin, B.J. Localisation and characterisation of homoserine dehydrogenase isolated from barley and pea leaves. Planta 1981, 152, 491–496. [Google Scholar] [CrossRef] [PubMed]
- Rozan, P.; Kuo, Y.H.; Lambein, F. Amino acids in seeds and seedlings of the genus Lens. Phytochemistry 2001, 58, 281–289. [Google Scholar] [CrossRef] [PubMed]
- Schaffer, A.A.; Pharr, D.M.; Madore, M.A. Cucurbits. In Photoassimilate Distribution in Plants and Crops; Zamski, E., Schaffer, A.A., Eds.; Marcel Dekker: New York, NY, USA, 1996. [Google Scholar]
Figure 1.
Changes in the total concentration of identified polar metabolites in the embryonic axis, root, epicotyl (A), and cotyledons of pea (D); embryonic axis, roots, hypocotyl (B), and cotyledons of cucumber (E); and embryo, roots, shoot (C), and endosperm of wheat (F) during 7 days of seed germination. The same letters above the bars (separately for each part of the seedling) indicate no statistically significant differences (p < 0.05) based on ANOVA and Tukey’s post hoc test. *—hypocotyl was analyzed with root.
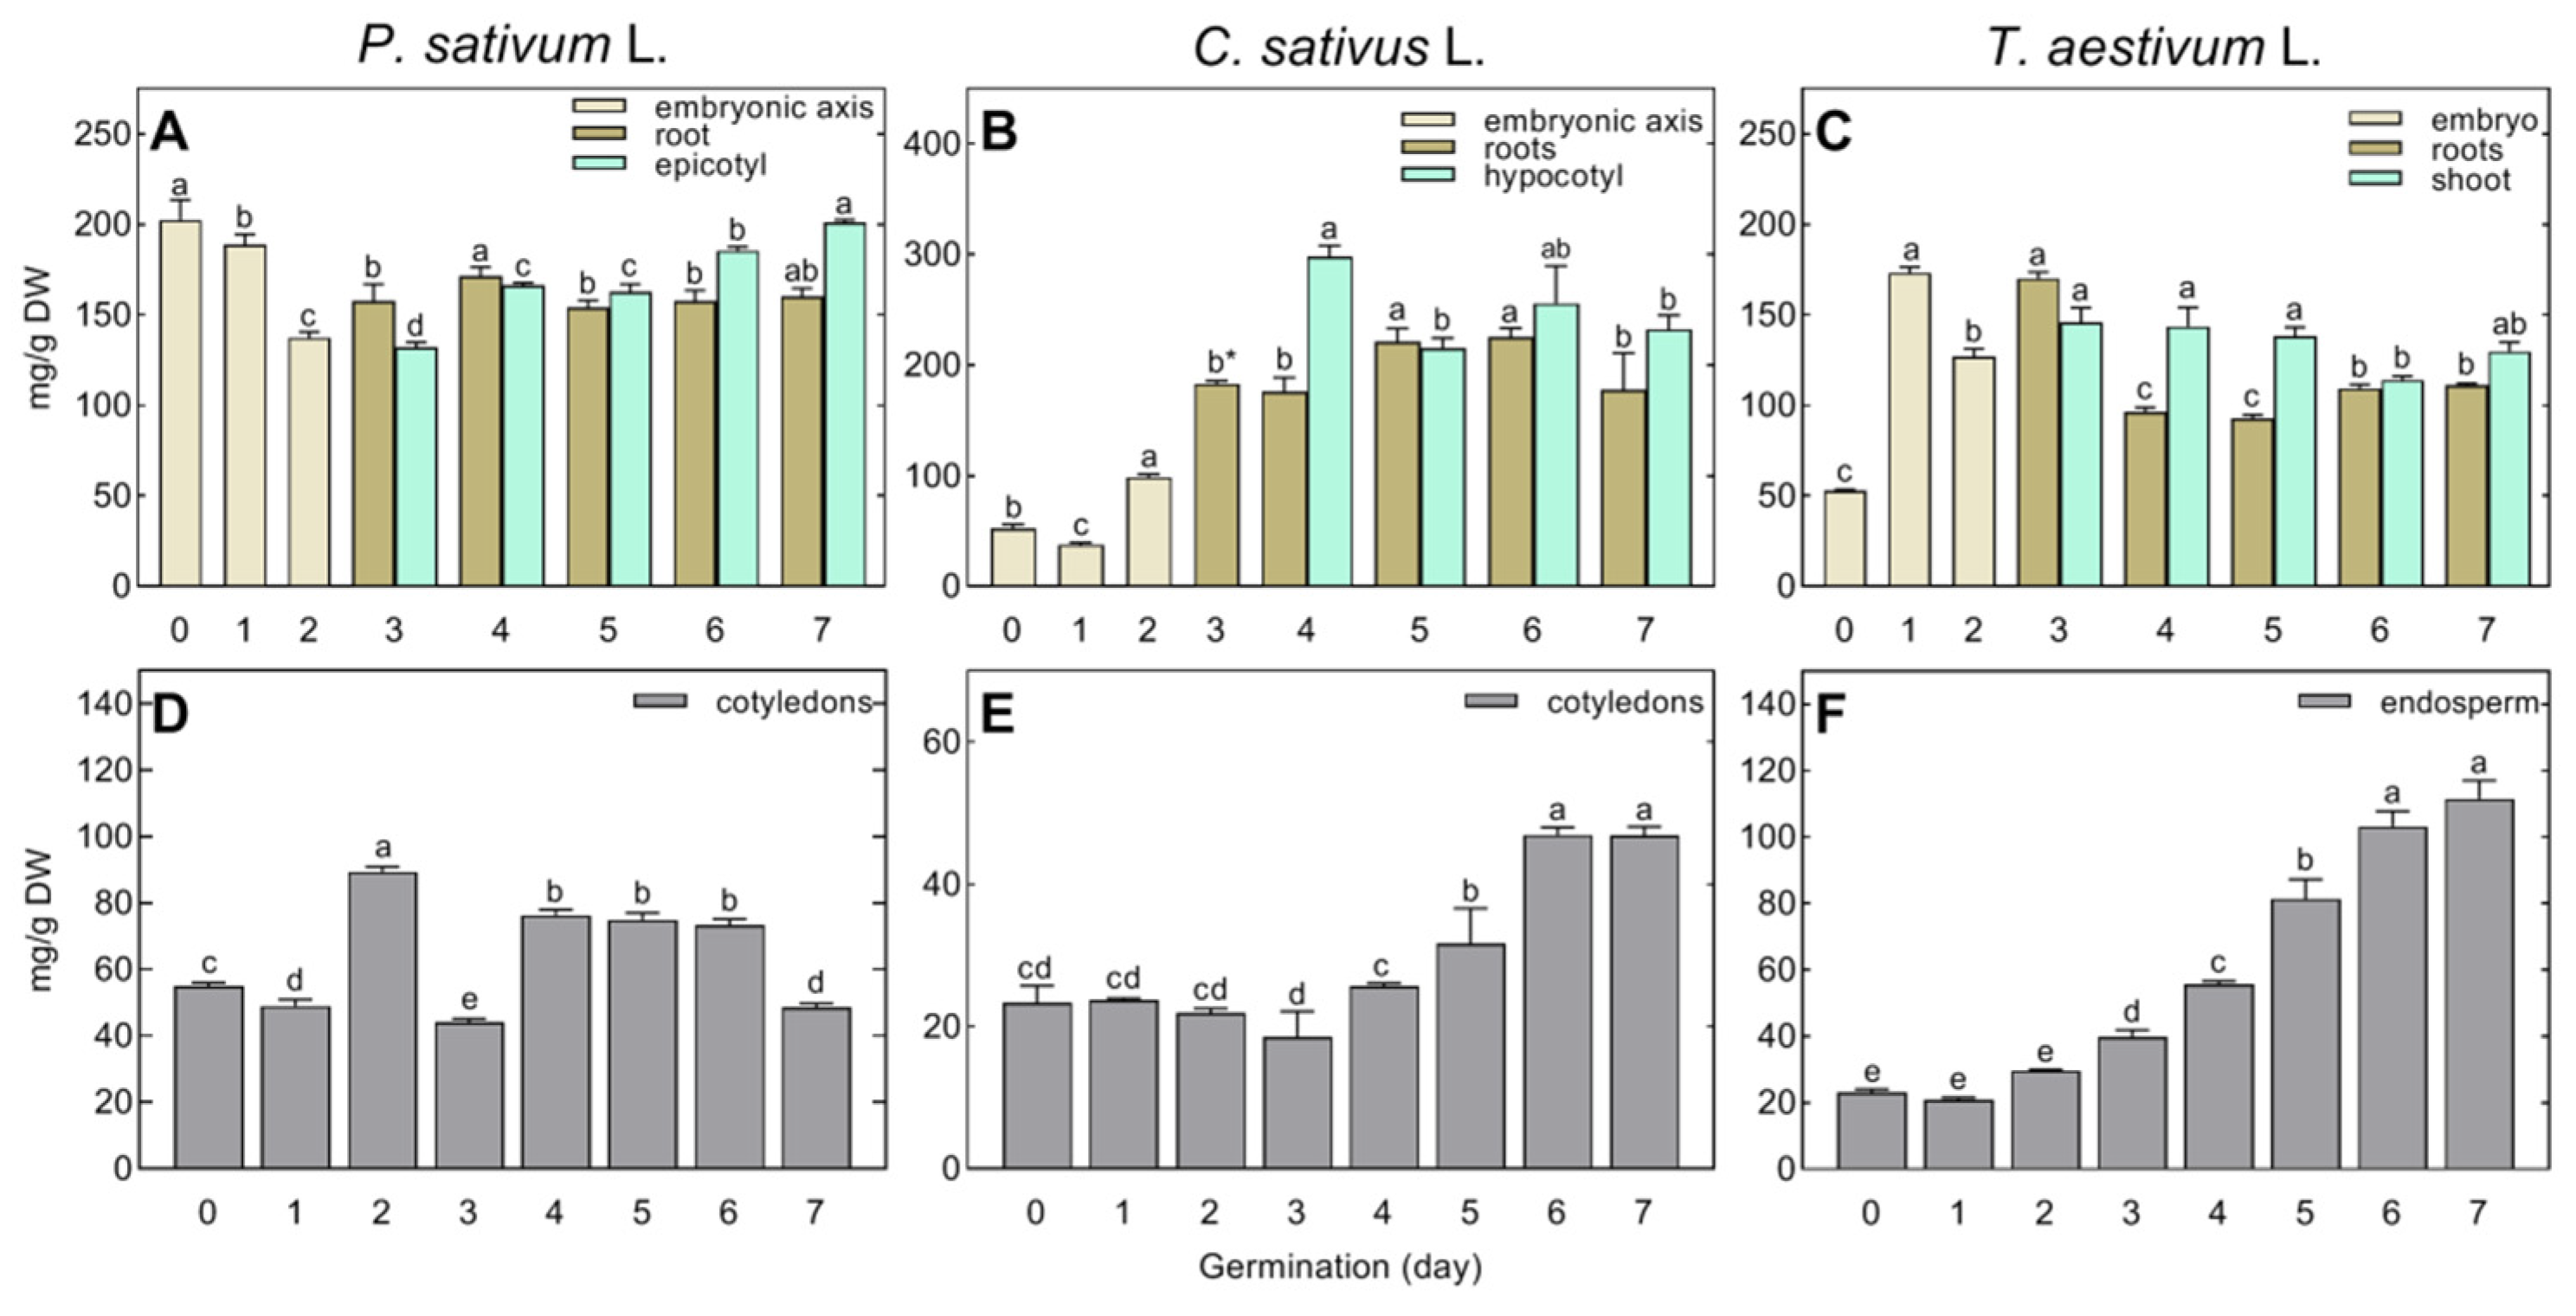
Figure 2.
Changes in the concentrations of RFOs (raffinose, stachyose, and verbascose) in the embryonic axes of pea (A) and cucumber (B), and maltose and 1-ketose in the embryo of wheat (C) during 48 h of seed germination. The concentrations of hexose phosphates (Glc6P and Fru6P) in the embryonic axes (pea and cucumber) and embryos (wheat) are shown in (D–F). The same letters above the bars (separately for each metabolite) indicate no statistically significant differences (p < 0.05) based on ANOVA and Tukey’s post hoc test.

Figure 3.
PCA score of polar metabolites in roots (A), shoots ((B) hypocotyl of cucumber; epicotyl of pea; and coleoptile of wheat) and storage tissues ((C) cotyledons of pea, cucumber, and endosperm of wheat) of developing seedlings (from the 3rd to 7th day of germination) of pea, cucumber, and wheat. Symbols: circles—pea; squares—cucumber; and diamonds—wheat. In cucumber seedlings, on the 3rd day of seed germination, the hypocotyl was analyzed together with the root, and data on changes in the hypocotyl started from the 4th day (B). Symbols for 3rd, 4th, 5th, 6th, and 7th day of germination are colored as follows: yellow, pink, green, navy blue, and sky blue.

Figure 4.
PCA score (A,C,E) and loading (B,D,F) plots of polar metabolites in developing seedlings (from the 3rd to 7th days of germination) of pea (Pisum sativum L.), cucumber (Cucumis sativus L.), and wheat (Triticum aestivum L.). Symbols: circles—cotyledons of pea and cucumber or endosperm of wheat; squares—epicotyl of pea, hypocotyl of cucumber, or coleoptile of wheat; diamonds—roots. In cucumber, on the 3rd day of seed germination, the hypocotyl was analyzed together with the root, and data on changes in the hypocotyl started from the 4th day (C). Symbols for 3rd, 4th, 5th, 6th, and 7th day of germination are colored as follows: yellow, pink, green, navy blue, and sky blue.
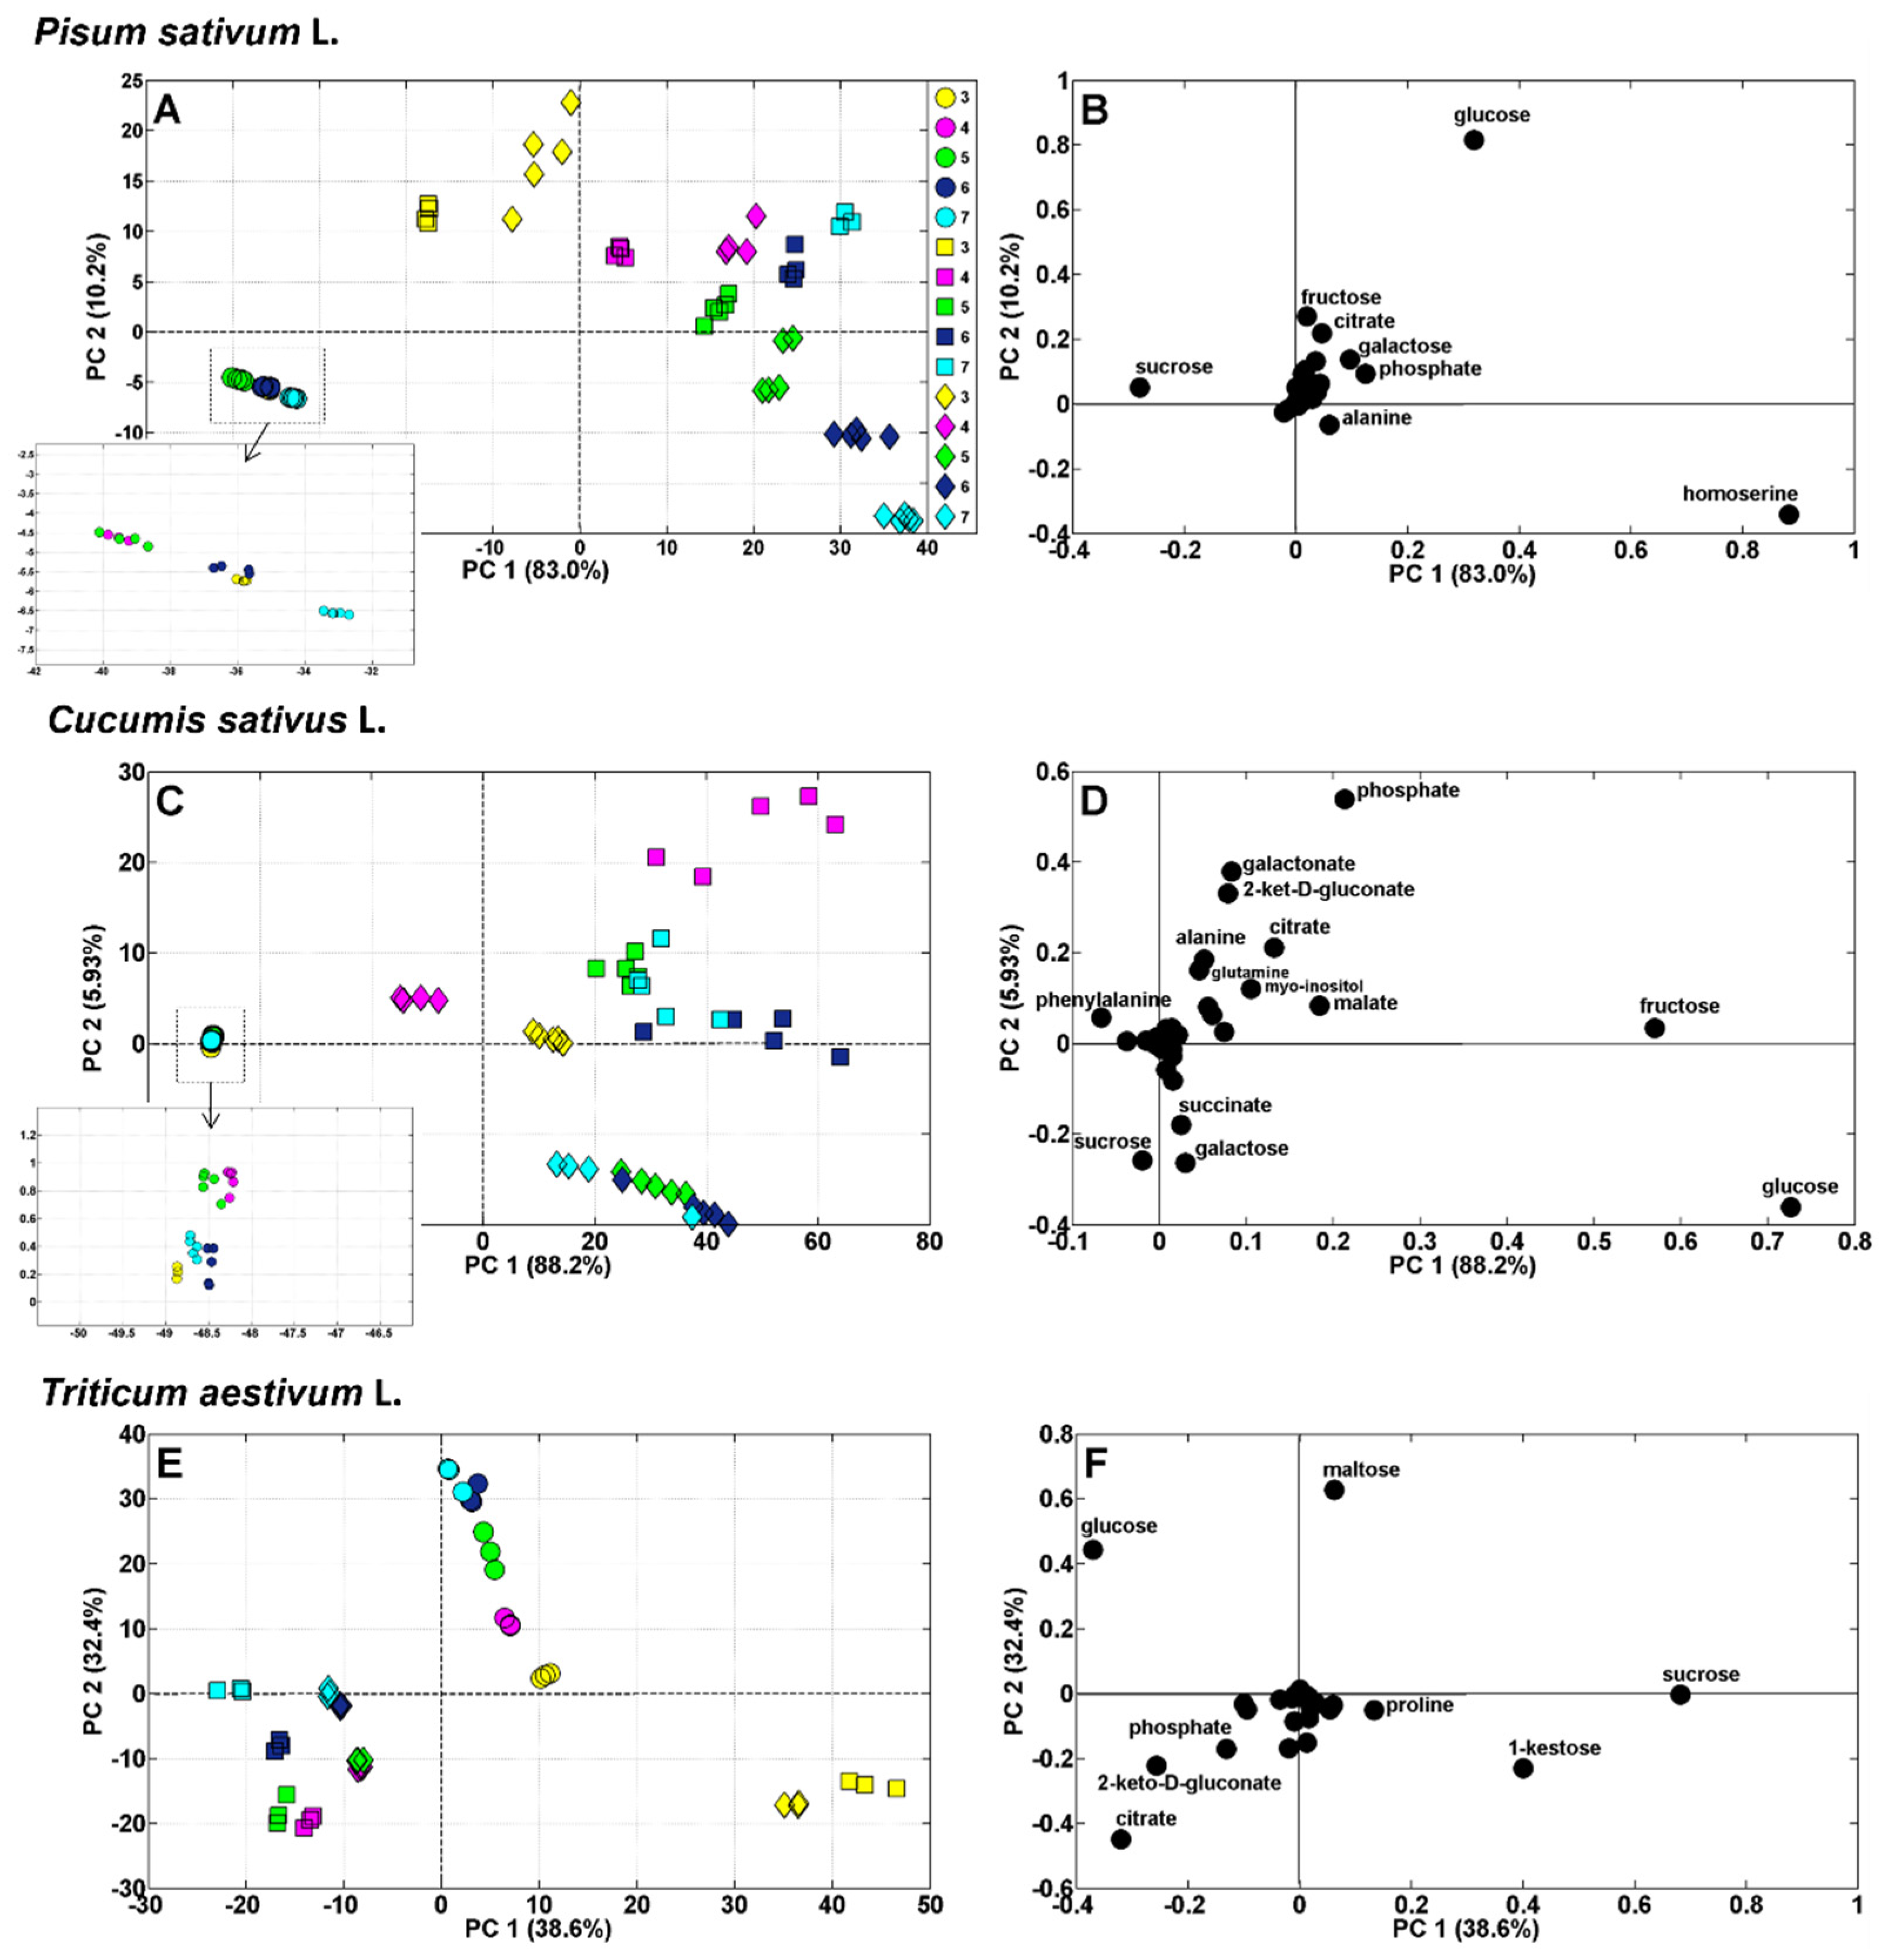
Figure 5.
The concentrations of glucose, fructose, and sucrose in roots (A–C), epicotyl of pea (D), hypocotyl of cucumber (E), shoot of wheat (F), and storage tissues—cotyledons (G,H) and endosperm (I)—of growing seedlings (between the 3rd and 7th day of seed germination) of pea (A,D,G), cucumber (B,E,H), and wheat (C,F,I). The same letters above the bars (separately for each metabolite) indicate no statistically significant differences (p < 0.05) based on ANOVA and Tukey’s post hoc test. *—hypocotyl was analyzed with root.

Figure 6.
Changes in the concentrations of raffinose and stachyose in the roots (A), hypocotyl (B), and cotyledons (C) of growing cucumber seedlings. The same letters above the bars (separately for each metabolite) indicate no statistically significant differences (p < 0.05) based on ANOVA and Tukey’s post hoc test. *—hypocotyl was analyzed with root.

Figure 7.
Changes in the concentrations of maltose and 1-kestose in roots (A), coleoptile (B), and endosperm (C) of growing wheat seedlings. The same letters above the bars (separately for each metabolite) indicate no statistically significant differences (p < 0.05) based on ANOVA and Tukey’s post hoc test.

Figure 8.
Changes in the concentration of asparagine, glutamine, and glutamate in roots (A–C), epicotyl of pea (D), hypocotyl of cucumber (E), shoot of wheat (F), and storage tissues (cotyledons (G, H) and endosperm (I)) of growing seedlings (between the 3rd and 7th day of seed germination) of pea (A,D,G), cucumber (B,E,H), and wheat (C,F,I). The same letters above the bars (separately for each metabolite) indicate no statistically significant differences (p < 0.05) based on ANOVA and Tukey’s post hoc test. *—hypocotyl was analyzed with root.

Figure 9.
Changes in the concentrations of citrate and malate in roots (A–C), epicotyl of pea (D), hypocotyl of cucumber (E), shoot of wheat (F), and storage tissues—cotyledons (G,H) and endosperm (I) of growing seedlings (between the 3rd and 7th day of seed germination) of pea (A,D,G), cucumber (B,E,H), and wheat (C,F,I). The same letters above the bars (separately for each metabolite) indicate no statistically significant differences (p < 0.05) based on ANOVA and Tukey’s post hoc test. *—hypocotyl was analyzed with root.

Disclaimer/Publisher’s Note: The statements, opinions and data contained in all publications are solely those of the individual author(s) and contributor(s) and not of MDPI and/or the editor(s). MDPI and/or the editor(s) disclaim responsibility for any injury to people or property resulting from any ideas, methods, instructions or products referred to in the content. |
© 2023 by the authors. Licensee MDPI, Basel, Switzerland. This article is an open access article distributed under the terms and conditions of the Creative Commons Attribution (CC BY) license (https://creativecommons.org/licenses/by/4.0/).
Share and Cite
MDPI and ACS Style
Szablińska-Piernik, J.; Lahuta, L.B. Changes in Polar Metabolites during Seed Germination and Early Seedling Development of Pea, Cucumber, and Wheat. Agriculture 2023, 13, 2278. https://doi.org/10.3390/agriculture13122278
AMA Style
Szablińska-Piernik J, Lahuta LB. Changes in Polar Metabolites during Seed Germination and Early Seedling Development of Pea, Cucumber, and Wheat. Agriculture. 2023; 13(12):2278. https://doi.org/10.3390/agriculture13122278
Chicago/Turabian StyleSzablińska-Piernik, Joanna, and Lesław Bernard Lahuta. 2023. "Changes in Polar Metabolites during Seed Germination and Early Seedling Development of Pea, Cucumber, and Wheat" Agriculture 13, no. 12: 2278. https://doi.org/10.3390/agriculture13122278
Note that from the first issue of 2016, this journal uses article numbers instead of page numbers. See further details here.