Article

Multi-Environment Trials and Stability Analysis for Yield-Related Traits of Commercial Rice Cultivars

1
Department of Crop Science and Biotechnology, Jeonbuk National University, Jeonju 54896, Republic of Korea
2
National Institute of Crop Science, Rural Development Administration, Jeonju 55365, Republic of Korea
*
Authors to whom correspondence should be addressed.
Agriculture 2023, 13(2), 256; https://doi.org/10.3390/agriculture13020256
Submission received: 2 December 2022 / Revised: 11 January 2023 / Accepted: 17 January 2023 / Published: 20 January 2023
(This article belongs to the Topic Plant Breeding, Genetics and Genomics)

Abstract

:
Multi-environment trials (METs) are essential in plant breeding programs to evaluate crop productivity and adaptability in diverse environments. In this study, we demonstrated the practical use of METs to evaluate grain yield and yield-related traits using 276 Korean rice cultivars, divided into three maturity groups (81 early-, 90 medium-, and 105 medium–late-maturing cultivars) grown in three regions (Jeonju, Suwon, and Miryang) and two planting seasons (early and regular planting) for two years. Due to the narrow genetic variability of the commercial cultivars, which are cultivated in relatively similar environmental conditions, genotype-by-environment interaction (GEI) effects were not statistically significant. However, genotype and environment evaluation using GGE biplot analysis exhibited distinct patterns of mega-environment formation, winning genotypes, ranking genotypes, discriminating power, and representativeness according to the differences in planting seasons and regions. Moreover, the simultaneous selection of stable high-performance genotypes using a weighted average of absolute scores from the singular-value decomposition of the matrix of BLUPs (WAASB) and a multi-trait stability index (MTSI) revealed six recommended genotypes each for early-maturing (Manho, Namil, Unkwang, Odae 1ho, Sinunbong 1ho, and Jonong) and medium-maturing (Sobi, Cheongdam, Shinbaeg, Boramchal, Mimyeon, and Saemimyeon) cultivars, and four genotypes for medium–late-maturing cultivars (Hanmauem, Dami, Baegseolchal, and Hangangchalbyeo). The winning genotypes of each trait can be used as parents to develop regional specialty cultivars by fine-tuning favorable traits, and recommended genotypes can be utilized as elite climate-resilient parents that can aid breeders in improving yield potential and stability across the planting seasons and regions.

1. Introduction

Rice (Oryza sativa L.) is a staple food for approximately 3.5 billion people, providing the primary source of calorie intake for more than half of the world’s population [1]. The global population is expected to reach nine billion by 2050, which demands more than a 60% increase in rice production to ensure food security [2]. Rice yield is a complex agronomic trait determined by three major components: panicle number per unit area, spikelets per panicle, and grain weight. In addition, other traits such as culm length and panicle length are crucial indirect factors affecting grain yield [3]. Previously, plant breeding programs have implemented various methods to improve yield potential and develop high-yielding cultivars; however, recent trends in breeding under a rapidly changing climate highlights the importance of stability and adaptability of the cultivar’s performance under various environmental conditions [4,5,6]. Moreover, breeding programs intend to maintain the ‘commercial value’ of the cultivar; therefore, crop improvements are largely undertaken by fine-tuning favorable traits derived from elite parental lines. The commercial value, such as grain yield and the quality of a single genotype, shows variation according to the environment due to genotype-by-environment interaction (GEI) [7]. Consequently, modeling the GEI and quantifying genotypic performance and the degree of stability are essential procedures to increase the selection efficiency and assess the genotype’s adaptability under multi-environment trials (METs) [8].
The stability and adaptability of the genotypes have been evaluated using various statistical tools such as analysis of variance (ANOVA), joint regression analysis, additive main effects and multiplicative interaction (AMMI), and genotype main effect plus genotype-by-environment interaction (GGE) biplots [9,10,11,12]. GGE biplot analysis is an effective tool that has been widely employed to evaluate annual MET data. The GGE biplot visualizes the relationships of environments in their discrimination of the genotypes, and genotypes in their response to the environments, in a two-dimensional graphical view [12]. The simultaneous selection index, a weighted average of absolute scores from the singular-value decomposition of the matrix of BLUPs (WAASB), measures the quantitative genotypic stability and effect of GEI derived from the linear mixed model (LMM). AMMI allocates the majority of GEI patterns in the first interaction principal component axis (IPCA), and most of the random errors are preserved in final IPCAs. Therefore, WAASB combines the features of AMMI and the best linear unbiased prediction (BLUP), thus considering the complete estimated interaction principal component axis (IPCA) to analyze GEI in METs [13]. The multi-trait stability index (MTSI) refers to simultaneous selection based on mean performance and stability (MPE) in MET analysis, which uses both fixed- and mixed-effects models. MTSI estimates the distance between the genotype and ideotype; then, it generates a factor analysis score for efficient genotypic selection for MPE-based multiple traits [14].
Variations in the growth duration are mainly determined by the heading date in rice [15]. For instance, photoperiod-insensitive cultivars generally possess a relatively short basic vegetative phase (BVP) in high-latitude regions during long days, which leads to early heading and short growth duration. On the other hand, photoperiod-sensitive cultivars tend to exhibit longer BVPs with late heading dates [16]. Therefore, early-maturing cultivars with short vegetative growth exhibit relatively low photosynthate assimilation during their BVP, thus resulting in low biomass accumulation and grain yield [17]. However, to lessen the greenhouse gas emissions released from rice paddy fields, reducing the amount of irrigation through planting early maturing cultivars is considered one of the best adaptive strategies to minimize methane emissions [18,19]. Therefore, to develop high-yielding low-methane rice cultivars, the evaluation and categorization of cultivars based on their maturity should be prioritized to select elite parents for future breeding programs.
Commercial rice breeders in Korea implement artificial crosses between elite temperate japonica cultivars to develop most new cultivars. For introducing a new trait derived from different subspecies such as indica or tropical japonica, the conversion of a genetic background to a temperate japonica is performed by constructing near-isogenic lines (NILs) prior to hybridization. Therefore, most commercial rice cultivars possess limited genetic variability [20]. Moreover, the majority of commercial cultivars are grown at representative granary regions, which are situated in temperate-climate zones. Despite the minimum interaction effect between the narrow genetic variability and environment invariability, wide phenotypic variation was observed among Korean cultivars grown in different regions [21]. In this study, we evaluated yield-related traits and the grain yield performance of 276 commercial rice cultivars of Korea, cultivated in three regions and over two cropping seasons for two years. Our main objective was to visualize the patterns in the genotypic performance of elite Korean cultivars according to different environmental conditions. We also performed simultaneous selection of recommended genotypes with high performance and stability that can be used as guidance for successful breeding programs.

2. Materials and Methods

2.1. Plant Materials and Field Experimental Design

In total, 276 Korean rice cultivars released by the National Institute of Crop Science (NICS) of the Rural Development Administration (RDA), comprising 244 japonica and 32 Tongil-types, were used for field experiments (Table S1). For the maturity category (81 early, 90 medium, and 105 medium–late cultivars), we followed the classification determined by breeders upon cultivar release based on the heading date records during regional adaptability trials [21]. The rice plants were cultivated at the experimental field stations of NICS located in Jeonju (35°84′ N, 127°05′ E), Suwon (37°24′ N, 126°98′ E), and Miryang (35°49′ N, 128°74′ E). The multi-environment trials (six environments) consisting of three regions—two planting seasons with two replicates—were conducted under interchanging cultivations of early (2019 and 2021) and regular (2018 and 2020) planting seasons. Detailed information of planting seasons is shown in Table S2. All environmental data were obtained from the Automated Synoptic Observing System (ASOS), Korea Meteorological Administration (KMA) (https://data.kma.go.kr accessed on 2 August 2022) (Table S3). Seedlings of each cultivar were transplanted in four rows of 4.5 m spaced 30 cm apart, with one plant per hill spaced 15 cm apart within each row. Fertilizers were applied at 9 kg N/10a, 4.5 kg P2O5/10a, and 4.5 kg K2O/10a at all experimental field stations. The plants were grown and managed according to the standard rice cultivation methods of NICS, RDA [22].

2.2. Phenotypic Data Collection

All the phenotypic data were collected from ten randomly chosen plants in each plot. Culm length (CL) was determined by measuring the length from the ground level to the panicle node of the main culm. Panicle length (PL) was determined by measuring the length from the panicle node to the end of the main panicle. Panicle number per plant (PN) and spikelets per panicle (SPP) were measured by counting the total number of the panicles and spikelets per plant, respectively. Thousand-grain weight (TGW) was determined by measuring the weight of 1000-hulled grain. Grain yield per plant (GY) was estimated using the following equation: GY = [(PN × SPP)/1000] × TGW.

2.3. Statistical Analysis

All statistical analyses and data visualization were conducted using R version 4.2.1 [23]. Boxplots of yield-related traits were visualized using the ‘ggplot2’, ‘gridExtra’, ‘gapminder’, and ‘dplyr’ packages. The mean significance of yield-related traits was determined via one-way analysis of variance (ANOVA) with Scheffe’s method for post hoc comparison (p ≤ 0.05) using the ‘agricolae’ package [24]. Network correlations between yield-related traits were analyzed via Pearson’s correlation coefficient (p ≤ 0.05) using the ‘corrr’ package [25]. To determine the presence of GEI, we performed LMM with genotype, environment, and their interaction as fixed effects and test year as a random effect using the ‘lme4’ [26], ‘lmerTest’, and ‘car’ packages (Table S4). A genotype main effect plus genotype-by-environment interaction (GGE) biplot was used to visualize the winning genotypes and mega-environments (MEs) for yield-related traits and grain yield [12,27]. Investigations of MEs and the best genotype in each environment were conducted using ‘which-won-where’ biplot. Ideal environments for each trait were evaluated using ‘discriminativeness vs. representativeness’ biplots. Ideal genotypes exhibiting both high mean performance and stability across all environments were illustrated using ‘ranking genotypes’ biplots. To select stable genotypes, the weighted average of absolute scores from the singular-value decomposition of the matrix of BLUPs for the GEI effects generated by a linear mixed model (WAASB) index were used to assess the combined ability of grain yield and stability. The WAASBY (WAASB/GY ratio) index was calculated by weighting crop productivity (GY) and stability (WAASB index) to select genotypes with high performance and stability (Table S5) [13,28]. Simultaneous selection for mean performance and stability (MPE) under consideration of the LMM performed by the WAASBY index was used to examine the genotype ranking for the multi-trait stability index (MTSI) [14,29]. All pre-analytical controls of errors, joint-ANOVA, GGE biplot, WAASB index analysis, and MTSI analysis were conducted using the ‘metan’ package [30].

3. Results

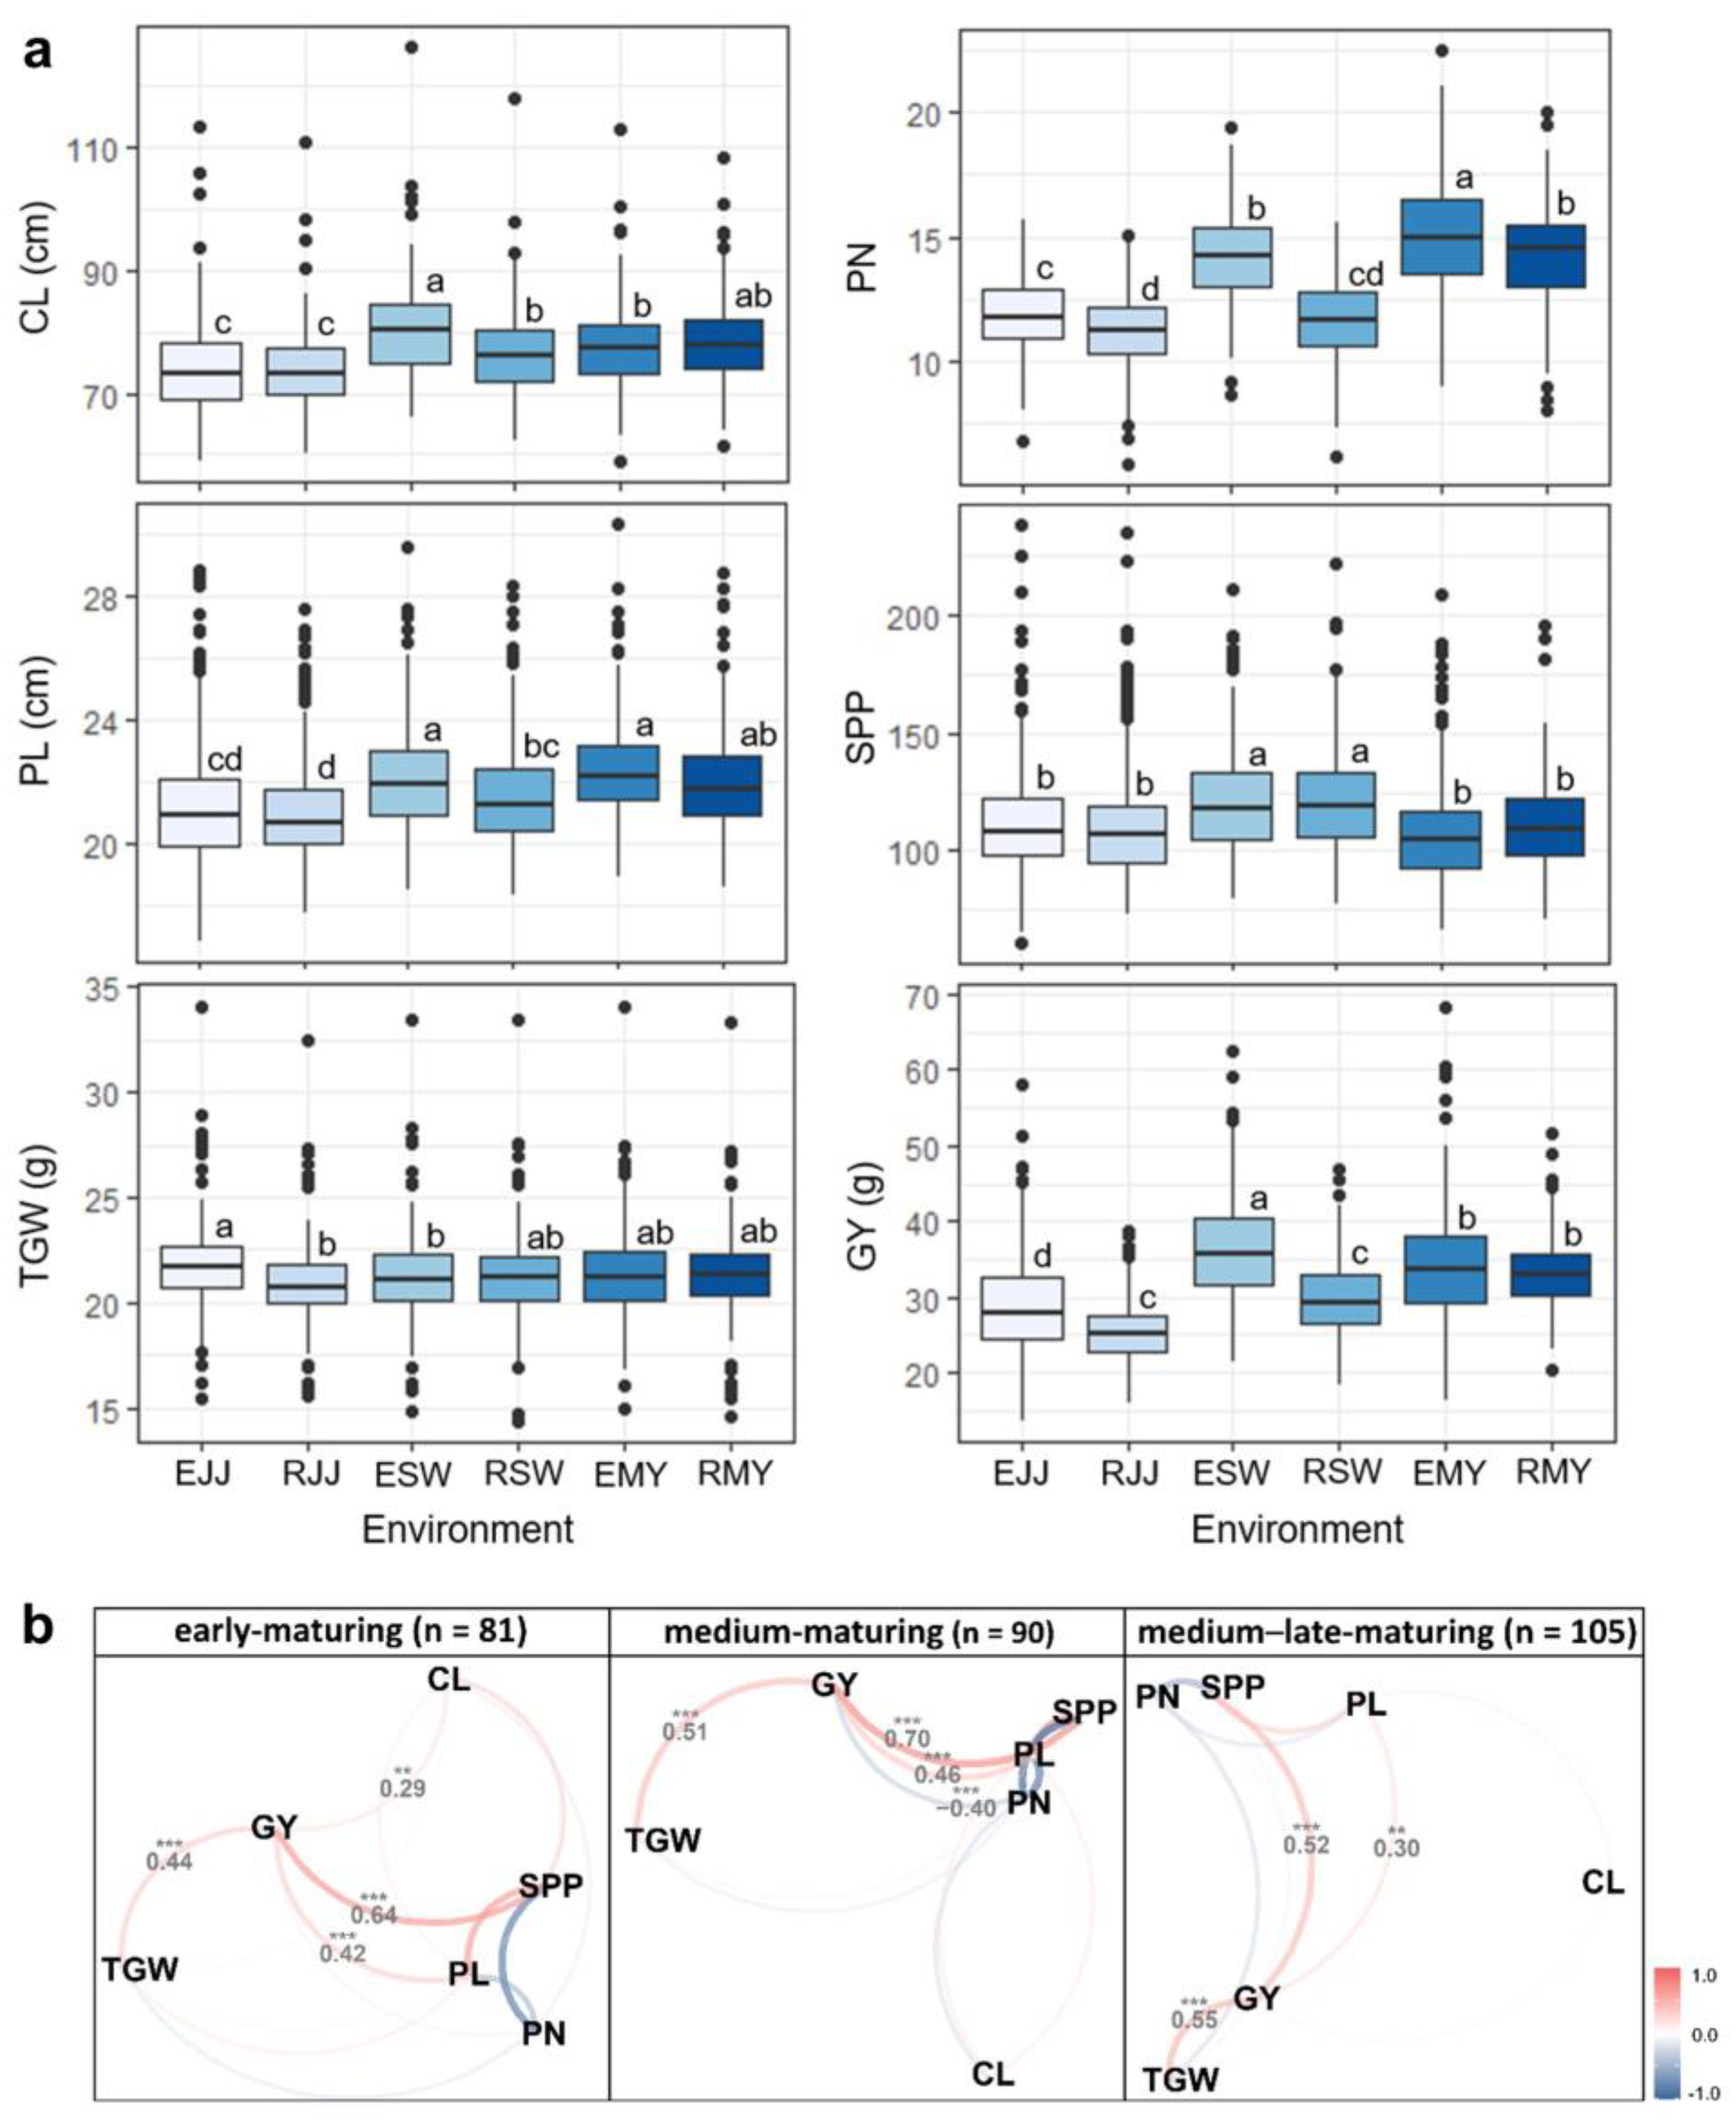
3.1. Descriptive Summary of Yield-Related Traits under Multi-Environments

The phenotypic performance of the yield-related traits of 276 Korean commercial rice cultivars was evaluated under six environments, consisting of three regions and two planting seasons, over two years. Environmental conditions, including temperature and precipitation, varied among the planting seasons and regions (Table S3). The growth period of the early planting season ranged from April to September, where a substantially low temperature in April was observed during early vegetative stages. In RJJ (regular planting in Jeonju) and RSW (regular planting in Suwon), significant amounts of precipitation were observed after heading (August) compared with other environments. The effects of genotype, environment, and their interaction on the yield-related traits were evaluated using an LMM (Table S4), which showed highly significant genotypic and environmental effect on all six traits in each maturity group, without the significant GEI effect. Variations among yield-related traits and grain yield (GY) were observed across the environments (Figure 1a). The Averages of PN (panicle number per plant) in EMY (early planting in Miryang) and of GY in ESW (early planting in Suwon) were significantly higher than those of other environments. On the other hand, the averages of PN in EJJ (early planting in Jeonju), RJJ, and RSW, as well as the averages of GY in EJJ, RJJ, and RSW, were significantly lower than those in other environments. The yield-related traits and GY varied among maturity groups, as well, where early-maturing cultivars exhibited lower values compared with medium- and medium–late-maturing cultivars (Table S6). Correlation analysis among yield-related traits and GY showed different patterns of interaction in each maturity group (Figure 1b). For early-maturing cultivars, culm length (CL; 0.29), panicle length (PL; 0.42), spikelets per panicle (SPP; 0.64), and thousand-grain weight (TGW; 0.44) showed significantly positive correlations with GY, while medium-maturing cultivars showed distinct patterns by exhibiting a significantly negative correlation between PN (−0.40) and GY. For medium–late-maturing cultivars, PL (0.30), SPP (0.52), and TGW (0.55) showed significantly positive correlations with GY (Figure 1b). Despite the narrow genetic background of Korean commercial rice cultivars grown under similar environmental conditions [31,32], our analysis demonstrated large phenotypic variation in yield-related traits and distinct interactions among them in each maturity group.

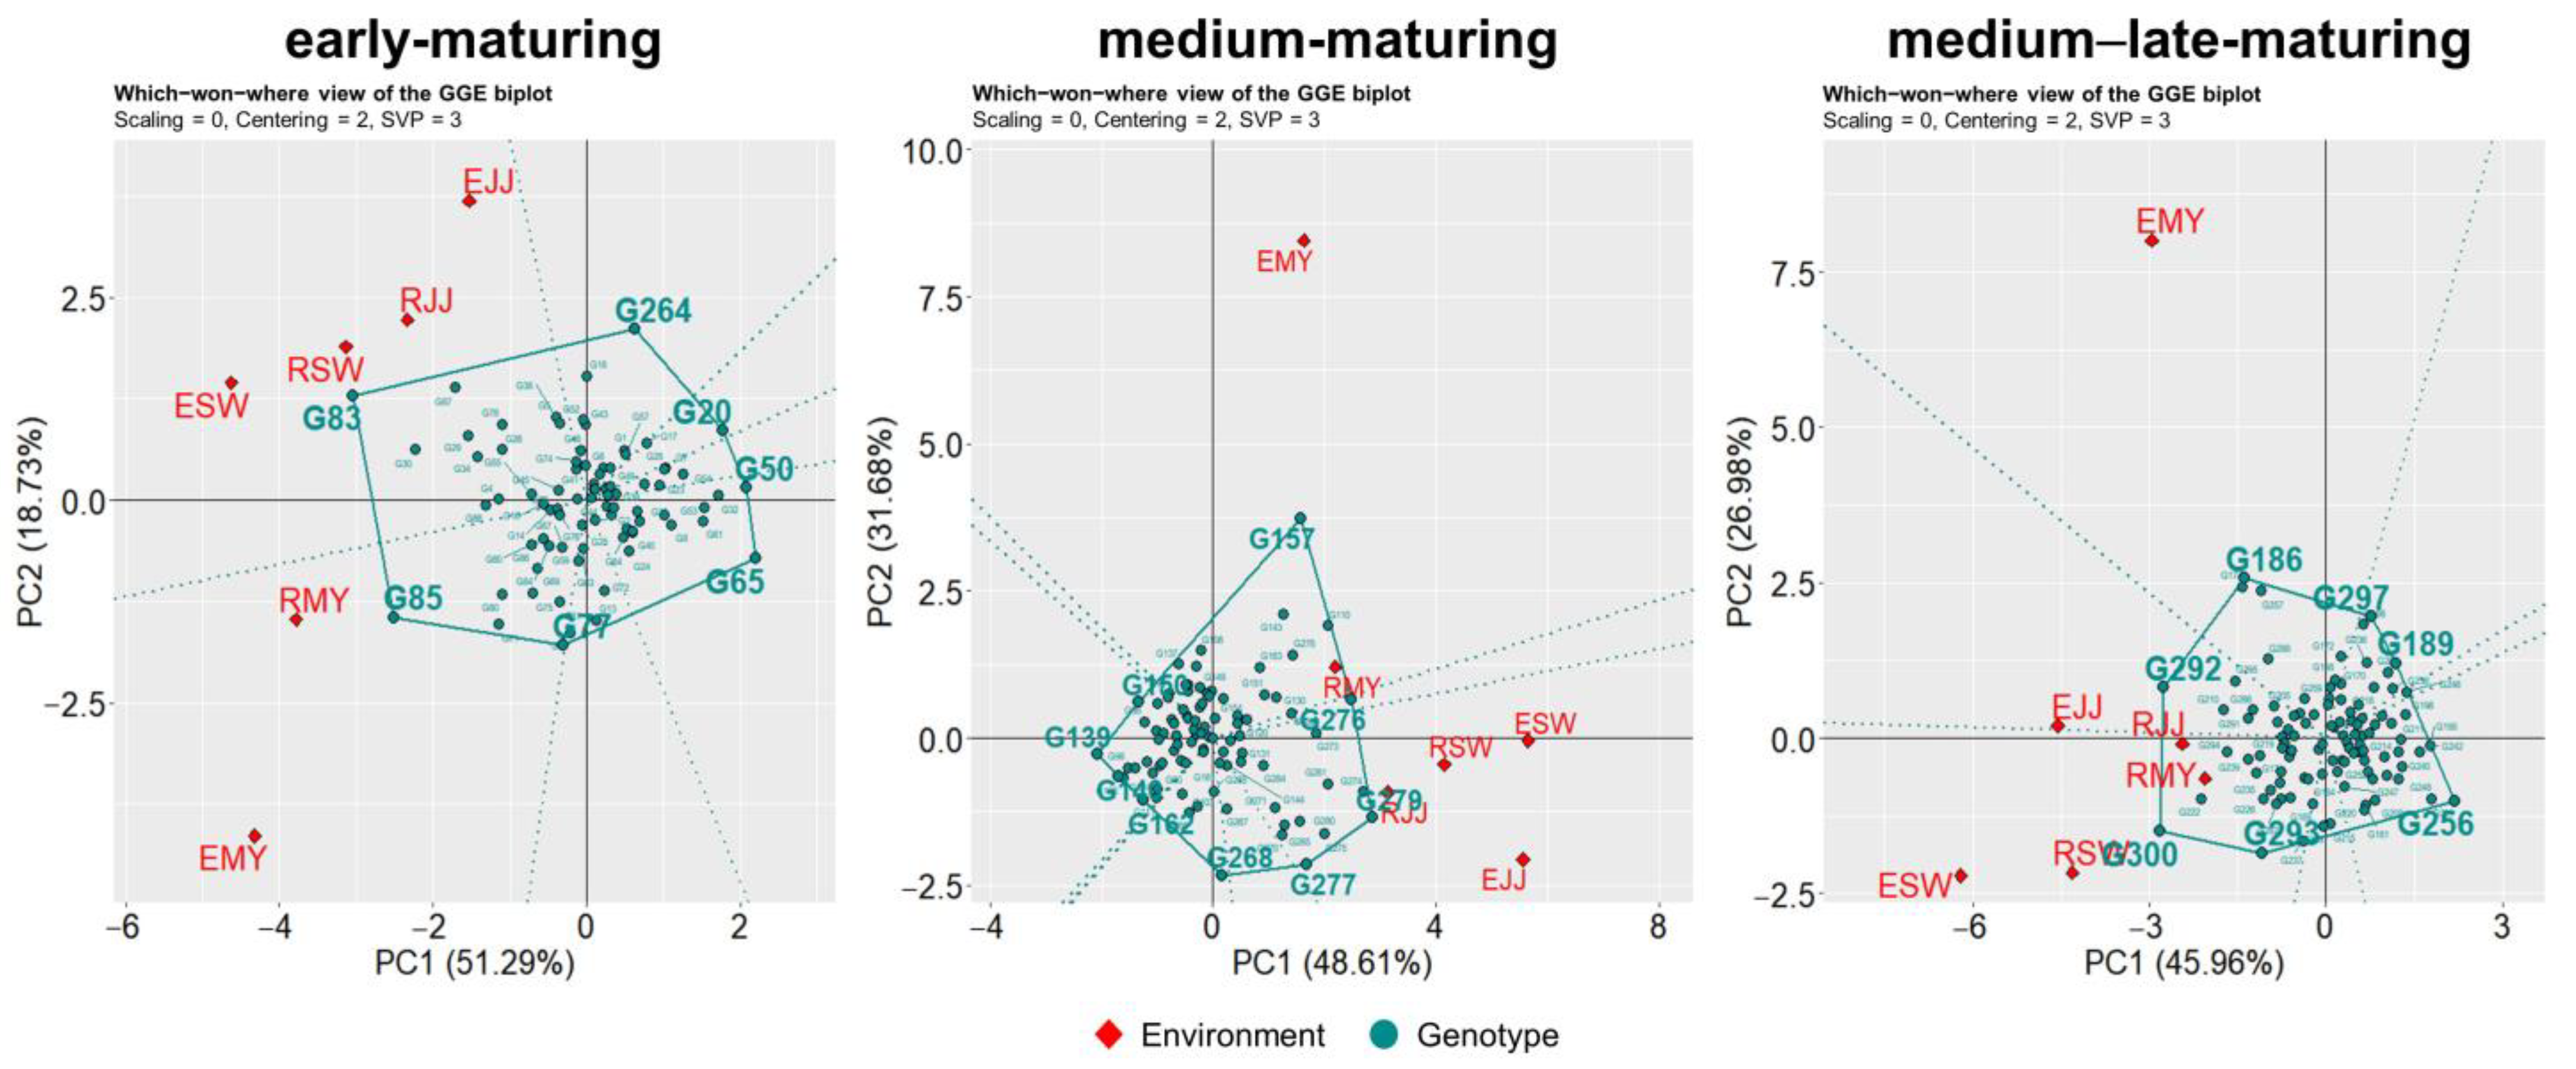
3.2. Mega-Environment Analysis

To identify the best-performing cultivars in each environment in different maturity groups, the polygon view of the ‘which-won-where’ GGE biplot was used to illustrate the interaction between genotype and environment and visualize the winning genotype (Figure 2). The polygon view was drawn by connecting the genotypes which were placed furthest from the origin with a straight line. The dotted line, centered from the origin, perpendicularly divides the biplot into different sectors and each sector represents a mega-environment (ME) [33]. The which-won-where pattern of yield-related traits (CL, PL, PN, SPP, and TGW) is shown in Figure S1. The biplot result confirms the presence of distinctive interactions between genotype and environment for all traits. For instance, in early-maturing cultivars, the genotype plus GEI (PC1 and PC2) explained 90.5%, 90.0%, 78.9%, 89.9%, 91.2%, and 69.4% of variation for CL, PL, PN, SPP, TGW, and GY, respectively. Moreover, the winning genotype that represented each ME differed across all traits. For the grain yield of early-maturing cultivars, six environments were separated into two MEs, with the first ME containing EJJ, RJJ, ESW, and RSW, and the second ME containing EMY and RMY (Figure 2). G83 (Jonong) was the vertex genotype of the first sector, which indicated that G83 served as the winning genotype, showing the highest grain yield performance among EJJ, RJJ, ESW, and RSW environments. For the second ME, where EMY and RMY were localized, G85 (CW92MR) showed the best GY performance. For medium-maturing cultivars, among the two MEs, the first ME contained EJJ, RJJ, ESW, and RSW, and G277 (Keunseom) and G279 (Dasan2ho) were the winning genotypes. The second ME contained EMY and RMY, where G157 (Seonpum) was the winning genotype. Lastly, for medium–late-maturing cultivars, six environments were segregated into three MEs. The first ME contained ESW and RSW, and G293 (Hanareum4ho) and G300 (Miwoo) were the best genotypes. G186 (Sindongjin) and G292 (Hanareum3ho) were the best genotypes in the other two MEs containing EMY and EJJ, respectively.

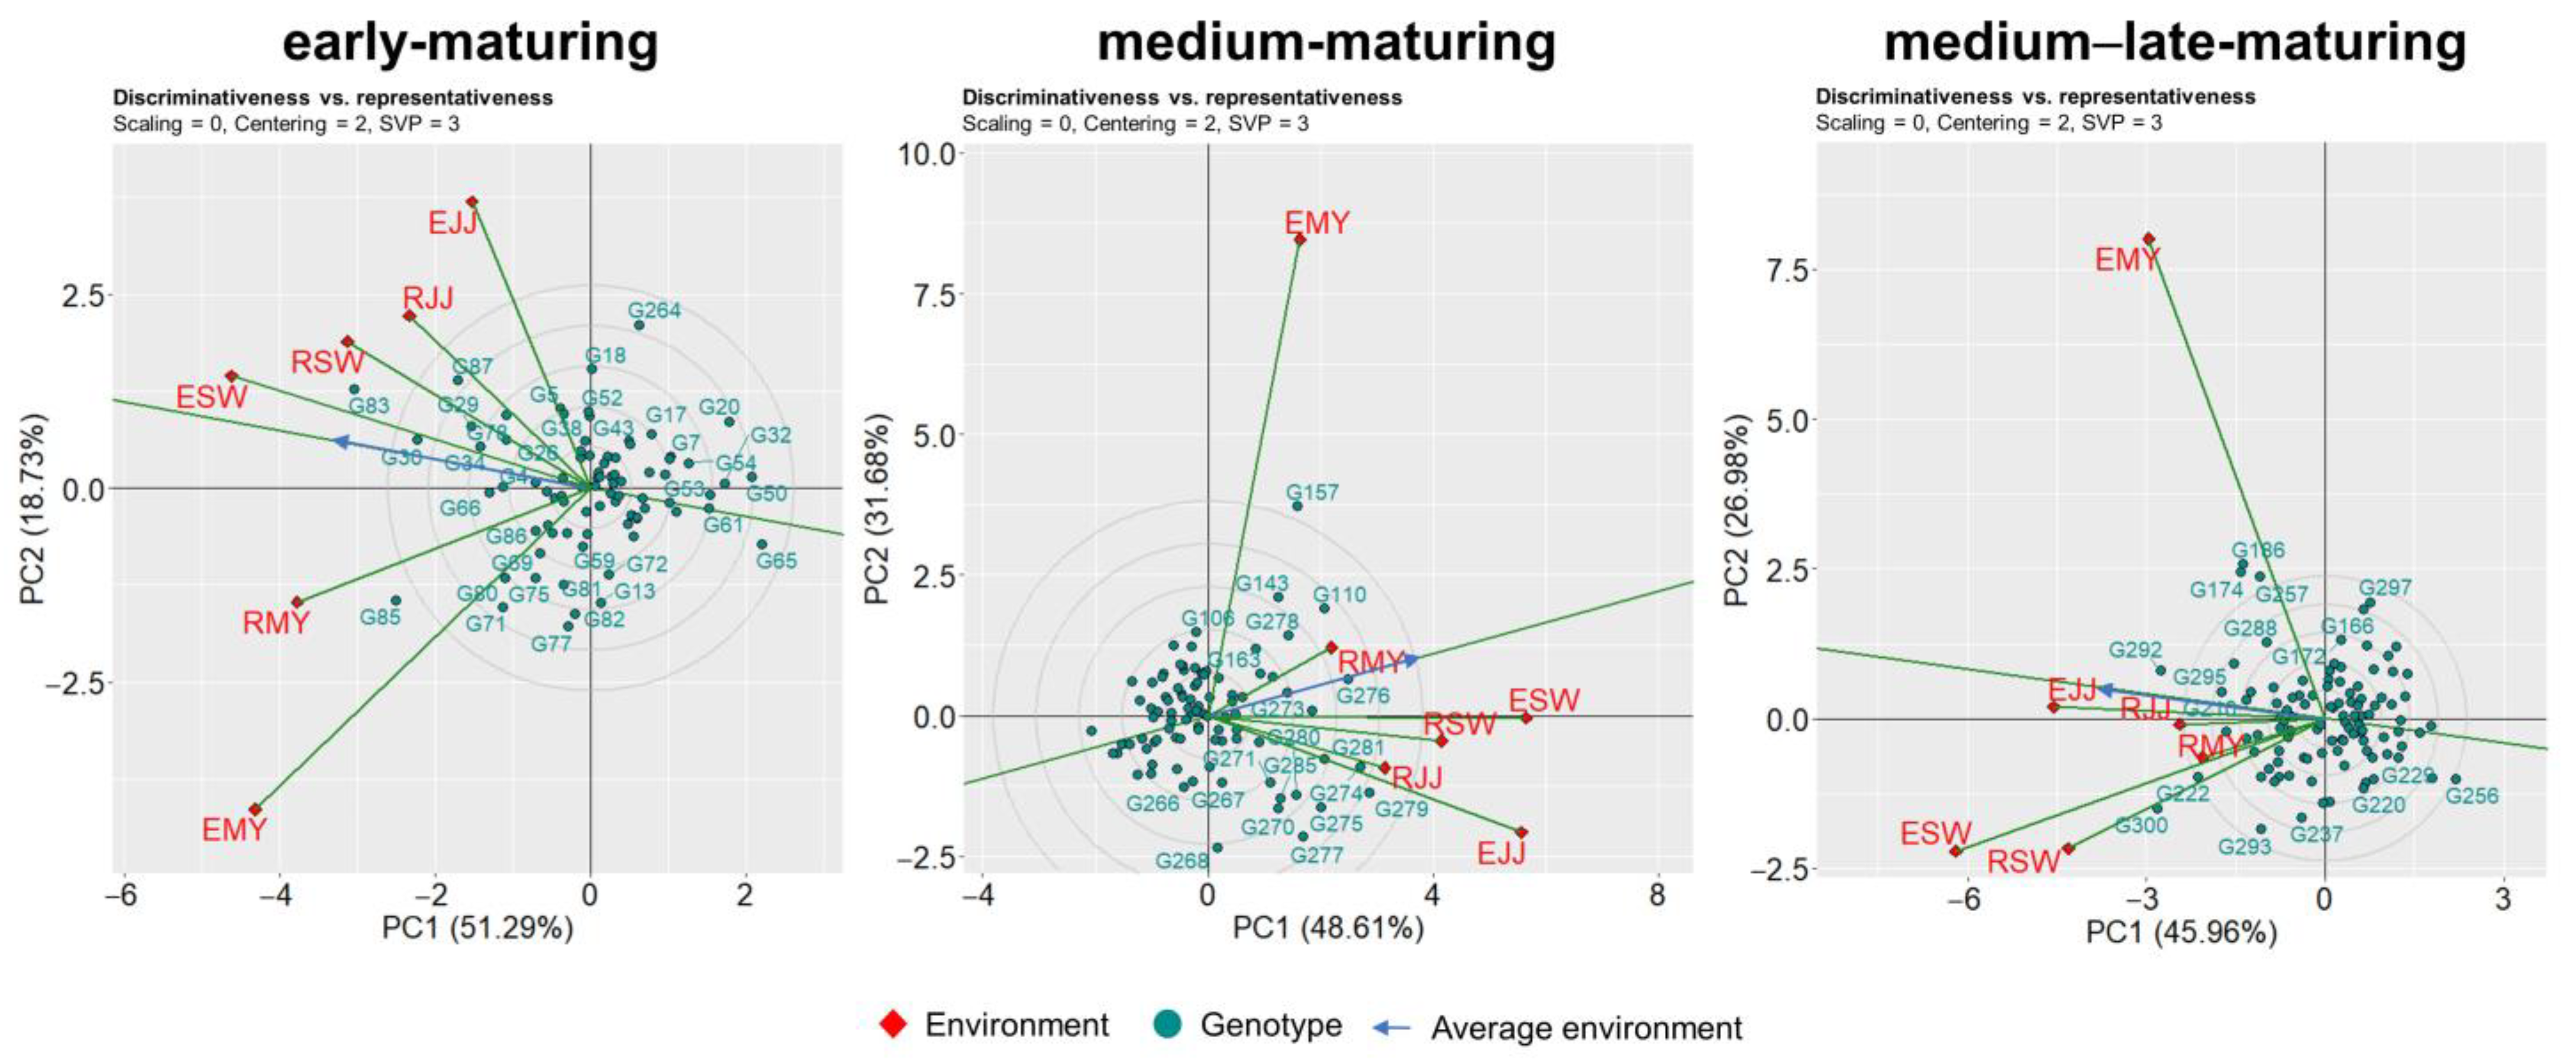
3.3. Evaluating Idealness of the Environment

Evaluating an ideal environment is essential for selecting superior genotypes that are suitable for specific MEs. Discriminativeness vs. representativeness GGE biplots assess the ability of an environment to distinguish genotypes and to represent all other evaluated environments [34]. The average environment coordination (AEC) view is based on genotype–environment-focused singular-value partitioning (SVP), and the length of the environment vector is proportional to the standard deviation of the average genotype across the environment [35]. Therefore, the length of the environment vector specifies the discriminating ability of a particular environment. All the traits showed distinct patterns of discriminativeness and representativeness (Figure S2). For grain yield, the discriminating ability was the highest in EMY among the six environments in all maturity groups, whereas the subsequent greatness of discriminating ability results was ESW > RMY > EJJ > RSW > RJJ for early-maturing cultivars; EJJ > ESW > RSW > RJJ > RMY for medium-maturing cultivars; and ESW > RSW > EJJ > RJJ > RMY for medium–late-maturing cultivars (Figure 3). An average environment axis (AEA) served as an indicator of an ‘ideal environment’, represented by an arrowed line that passes through the biplot origin; a smaller angle between AEA and the environment axis indicated representativeness compared with the other environments. For early-maturing cultivars, ESW was the most representative environment among the six environments, exhibiting the smallest angle between the AEAs. RMY and EJJ were the most representative environments for medium- and medium–late-maturing cultivars, respectively.

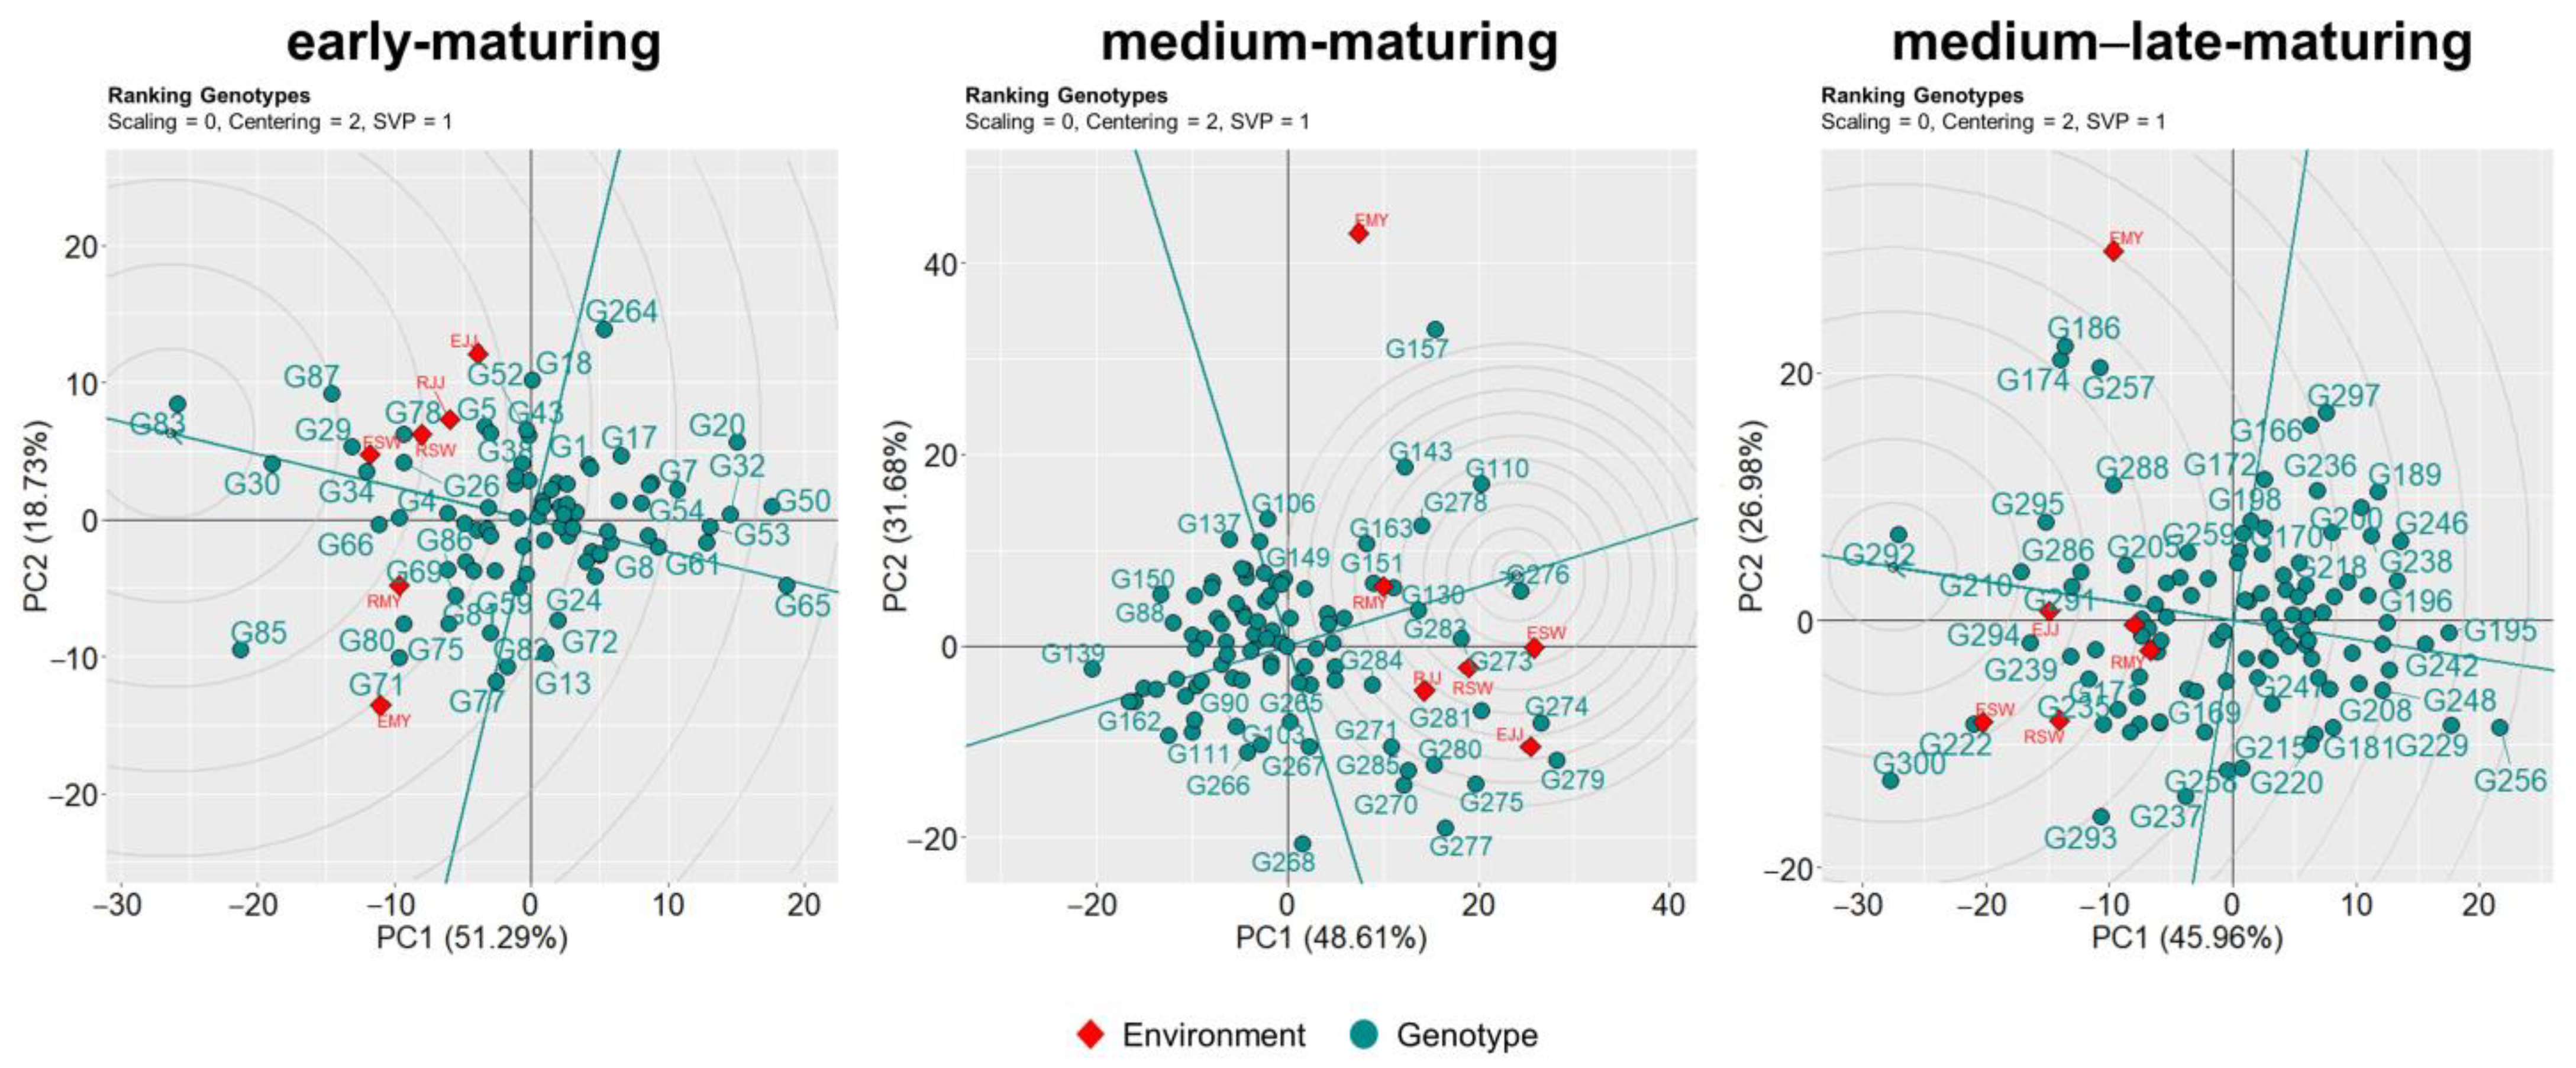
3.4. Ranking Genotypes Based on Performance and Stability

Genotype evaluations were conducted to identify the ideal genotype with high mean performance and high stability under various mega-environments exhibited for all maturity groups. The average environment coordination (AEC) view of the ranking genotypes GGE biplots is based on genotype-focused singular-value partitioning (SVP). The direction of the arrowed line that points towards the center of the concentric circle of the biplot denotes the average value of the ideal environment. Genotypes allocated outside the concentric circle indicate undesirable genotypes across the environment. Therefore, genotypes that are close to the center of the concentric circle and environment axis indicate superior genotypes with ‘absolute stability’ across the environments [33]. The patterns of ranking genotypes biplots showed variations among yield-related traits under different maturity groups (Figure S3). For GY, G83 (Jonong) and G30 (Namil) were positioned close to the ideal genotype among early-maturing cultivars (Figure 4). For medium-maturing cultivars, G276 (DASAN1HO) showed the highest GY performance with high stability. For medium–late-maturing cultivars, G292 (Hanareum3ho) showed superior GY performance and stability compared with the other genotypes.

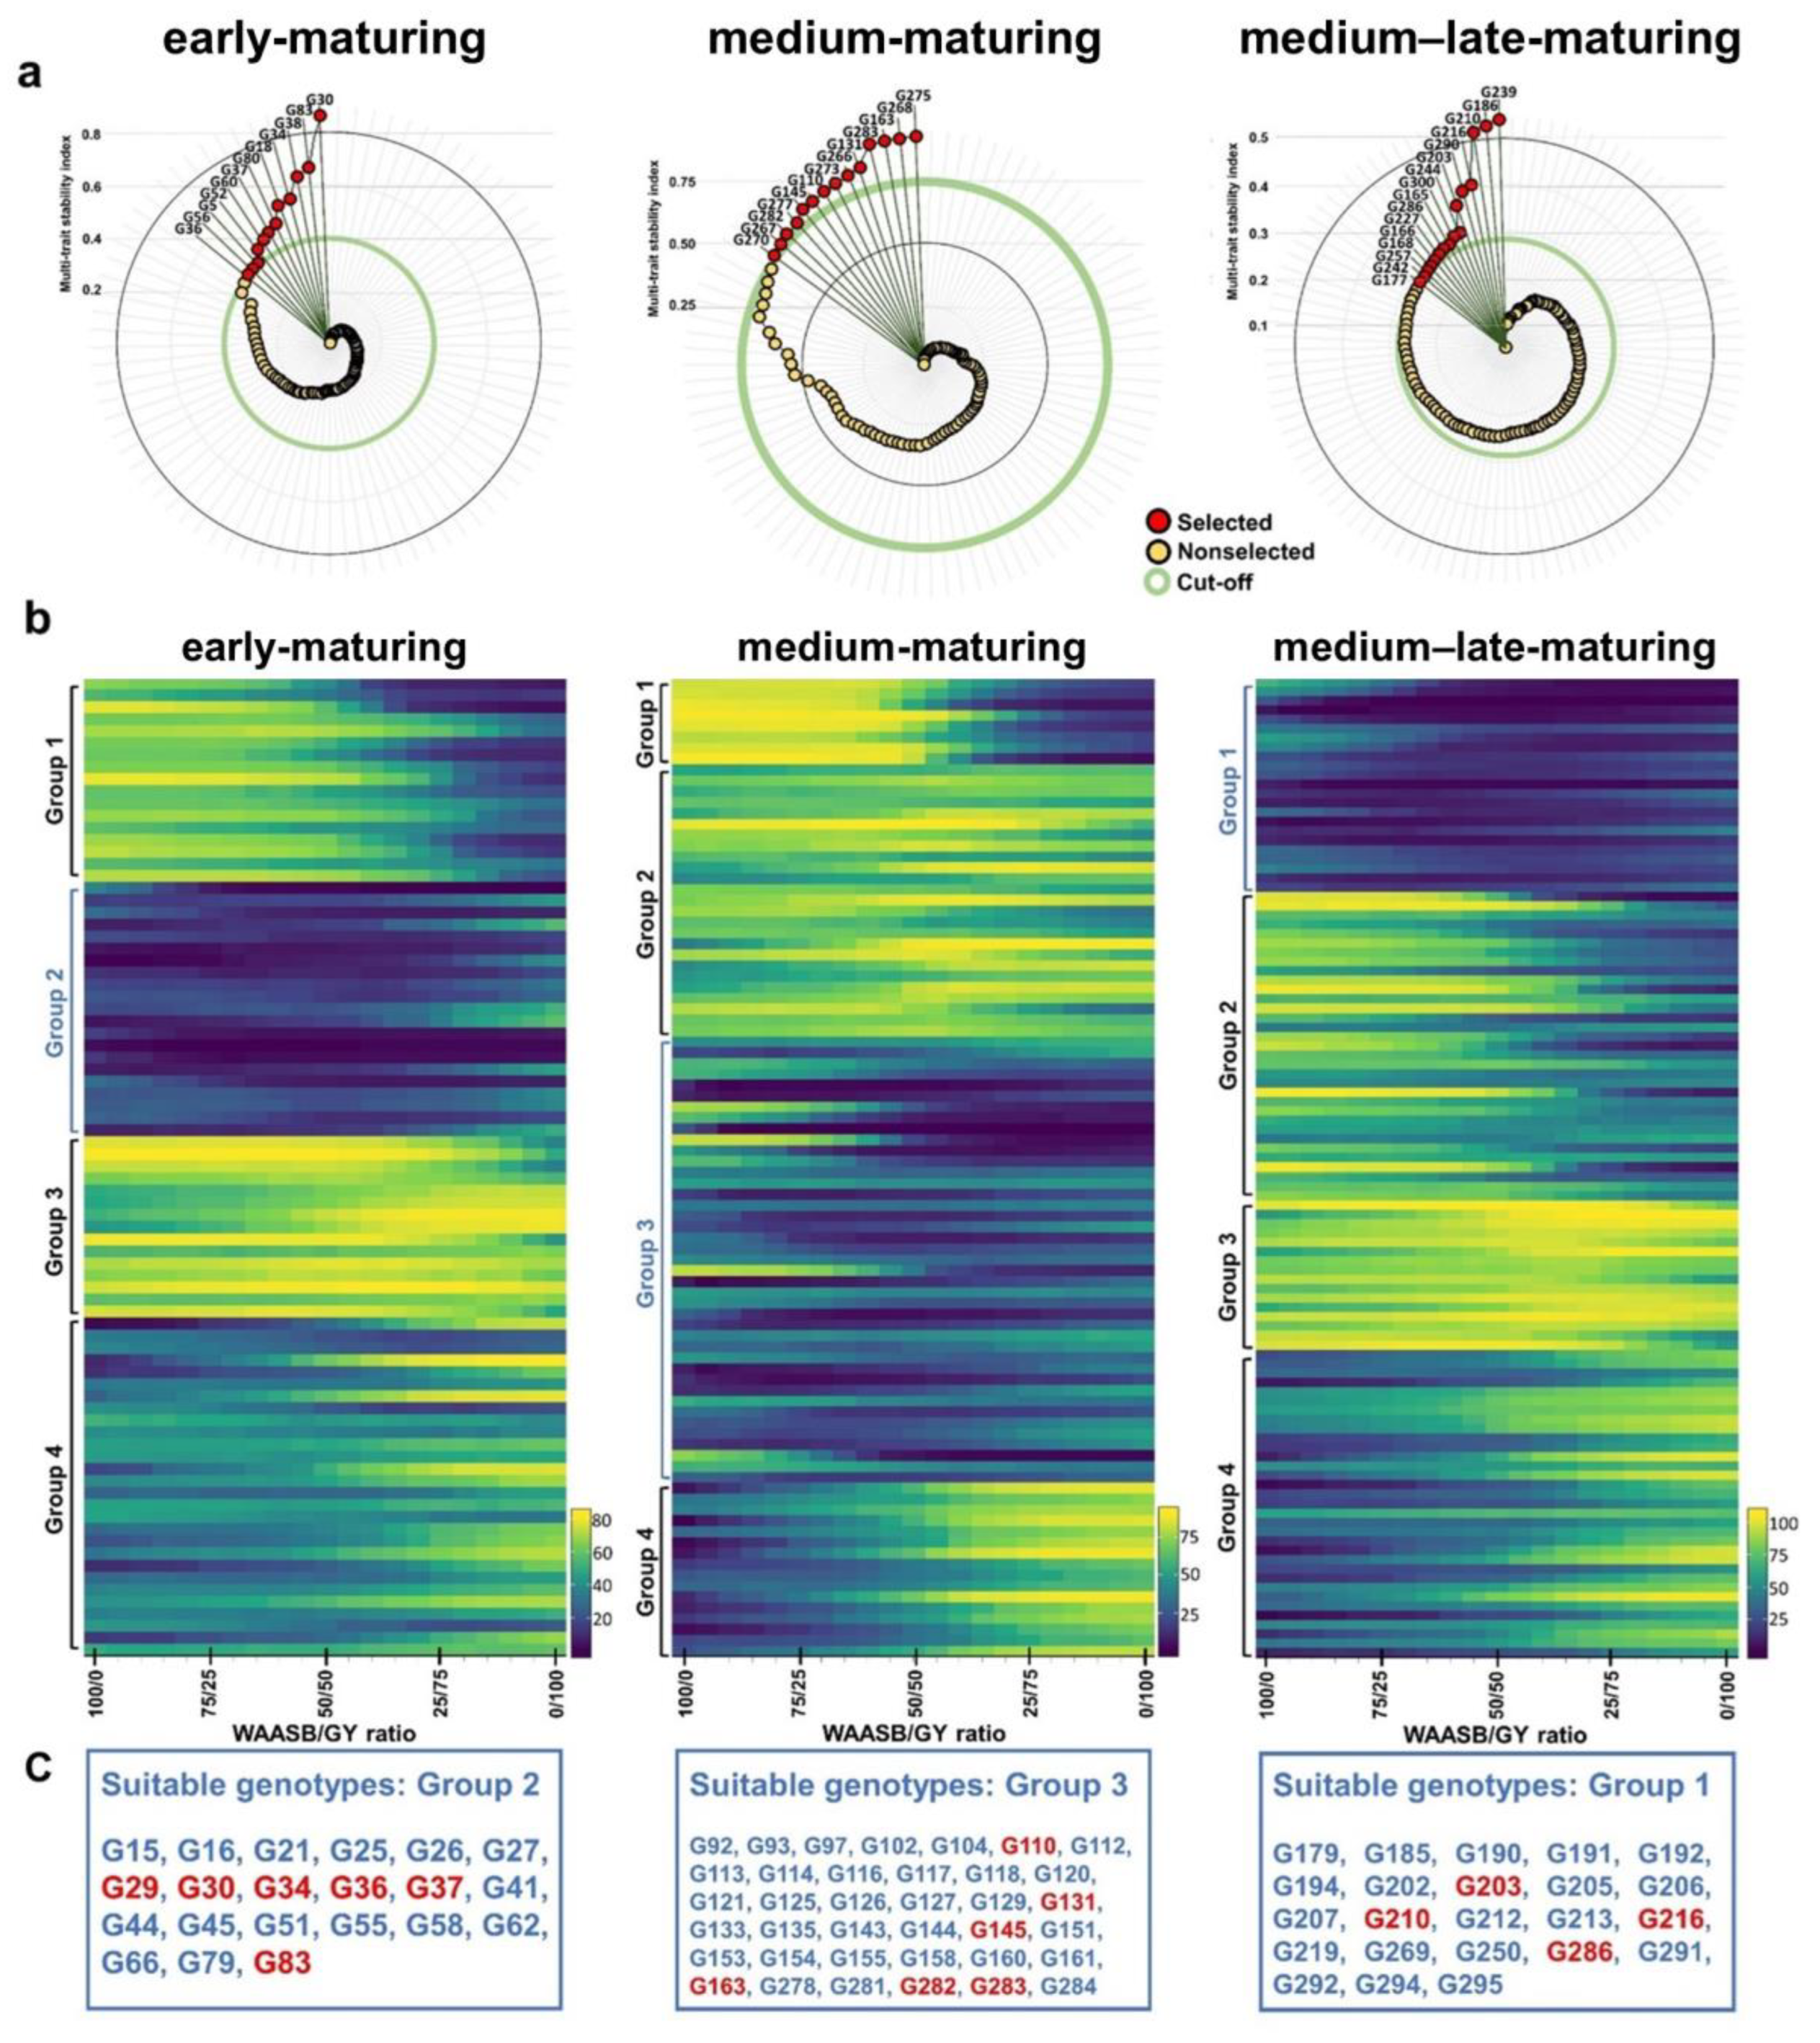
3.5. Superior Genotype Selection Based on Performance and Stability Indices

The genotype rankings for the MTSI for yield-component traits (PN, SPP, and TGW) were evaluated to observe the combined performance and stability across multiple traits. Under selection intensity of 15%, 12, 14, and 16 genotypes were selected among the early-, medium-, and medium–late-maturing cultivars, respectively (Figure 5a). Precise evaluation of GY performance and stability using the WAASBY index determined the changes in rank depending on the allocation of weight to the ratio. A WAASBY index of 100/0 assigns full weight to stability, while 0/100 gives full weight to GY (Table S5). The genotypes were clustered in four groups according to the similarity of their WAASBY indexes (Figure 5b). For early-maturing cultivars, the genotypes of group 2 exhibited high stability and GY performance, and thus, proposed 21 suitable genotypes. For medium-maturing cultivars, 37 genotypes of group 3 showed suitability across the environments. For medium–late-maturing cultivars, 23 genotypes belonging to group 1 were suggested to be suitable genotypes among the environments. By inter-correlating the results of the MTSIs composed of yield-component traits (PN, SPP, and TGW) and the WAASBY indexes, overlapping genotypes from the both analyses may serve as ‘recommended’ genotypes, where high stability and performance can be verified from the major contributor (yield components) of GY [13,14]. For early-maturing cultivars, we recommend G29 (Manho), G30 (Namil), G34 (Unkwang), G36 (Odae 1ho), G37 (Sinunbong 1ho), and G83 (Jonong). For medium-maturing cultivars, we recommend G110 (Sobi), G131 (Cheongdam), G145 (Shinbaeg), G163 (Boramchal), G282 (Mimyeon), and G283 (Saemimyeon). For medium–late-maturing cultivars, G203 (Hanmauem), G210 (Dami), G216 (Baegseolchal), and G286 (Hangangchalbyeo) were the recommended genotypes suitable across the environments (Figure 5c).

4. Discussion

Multi-environment trials are essential in plant breeding programs that evaluate crop productivity and adaptability in diverse environments [8]. The selection accuracy of genotypes can be improved by assessing the presence of genotype-by-environment interaction via mega-environment analysis, genotype evaluation, and multi-environment stability analysis [13,35]. Varying degrees of GEI have been extensively documented in rice and other field crops [36,37,38,39,40,41,42]. Genetic variability can be obtained by crossing inter-subspecific cultivars or accessions with different genetic backgrounds. Environmental variability can be acquired by enhancing the values of location effects such as geographical distance, variations in climatic zone (temperate vs. tropical), and differences in altitude. The interactions between genotype and environment under such circumstances may exhibit relatively large magnitudes of GEI. We evaluated cultivars mostly comprising temperate japonica rice that have been developed for commercial purposes; therefore, the non-significant GEI for the yield-related traits evaluated via LMM (Table S4) was not surprising. Our breeding programs mainly focus on maintaining the commercial value of cultivars, and crop improvements are mainly conducted by inter-crossing elite cultivars within limited genetic pools, which leads to narrow genetic backgrounds among the cultivars. Moreover, the geographical distances among the test environments were comparatively close in agriculturally favorable plain areas. Consequently, we focused on demonstrating the practical use of multi-environment trial analytical tools to visualize the performance patterns of the cultivars rather than basing our explanation on the significance of GEI effects. Similarly, the GGE biplot analysis enabled the identification of the ideal test environments, mega-environment formation, and winning genotypes, which would be informative in constructing further breeding programs [12,43].
The environments showed distinct patterns of mega-environment formation exhibiting different genotypes, serving as the winning genotypes in all the traits studied (Figure 2 and Figure S1). Variations in winning genotypes and genotype rankings represent potential sources that could be utilized for fine-tuning specific traits to improve cultivar performance in particular environments. Notably, G277 (Keunseom), a winning genotype of GY among medium-maturing cultivars, also showed the strongest GY performance among various inter-subspecific cultivars in tropical and temperate environment trials [39]. Despite the non-significant GEI effect, genotypes may exhibit distinct patterns of response to changes in the environment and can possibly be evaluated by their mean response in different environments [44,45]. A “discriminativeness vs. representativeness” view of the GGE biplot shows the discriminating power and representativeness of the test environments, which differed according to the corresponding planting seasons, regions, and maturity of the cultivars. For the grain yield of early-maturing cultivars, ESW was referred to as the most ideal environment, whereas RMY and EJJ were the most ideal for medium- and medium–late-maturing cultivars, respectively (Figure 3). Moreover, EMY and RMY exhibited different lengths of vectors, indicating distinct discriminating power according to the different planting seasons in the same location.
The concept of the stability of a cultivar/genotype generally refers to the extent of changes in the phenotypic expression of crop performance under different environments [46]. In this study, our objective was to evaluate the ‘dynamic’ concept of stability, the performance of a stable genotype corresponding with a prediction for each environment; therefore, genotype responses to the environment were not equal for all genotypes [47]. The simultaneous selection index, WAASB-based analysis, is an effective model that measures ideal genotypes based on combined genotypic performance and stability [39,48,49]. When the explanation of the GEI pattern in the first two interaction principal component axes (IPCA) is low, the widely used AMMI stability value (ASV) ranking may be misleading [13]. To avoid this, we implemented WAASBY; therefore, we generated groups of tentative suitable genotypes consisting of 21, 37, and 23 early-, medium-, and medium–late-maturing cultivars, respectively (Figure 5b). In addition, we employed MTSI to validate the simultaneous selection of stable genotypes based on GY, by considering the mean performance and stability of the three major yield components, i.e., PL, SPP, and TGW [14]. As a result, we suggest six genotypes as highly ‘recommended’ cultivars each for early- and medium-maturing cultivars, and four genotypes for medium–late-maturing cultivars.
Maturity group and planting season are the key sources of variation that should be addressed in breeding programs concerning climate change. By assessing 276 Korean commercial rice cultivars in different maturity groups under METs (three regions and two main planting seasons), we have characterized both environment-specific winning genotypes (Figure 2) and stable genotypes with wide adaptability (Figure 5c), which are crucial prerequisites to developing an elite core breeding panel. The recommended cultivars under specific environments can be used as parents to develop regional specialty cultivars; however, those with superior stability across environments may indicate their resilience under climatic fluctuations and serve as elite parents to ultimately improve yield potential and stability across the growing seasons and regions. Moreover, because utilizing early-maturing cultivars is emphasized as one of the most effective strategies to reduce methane emissions from paddy fields [50,51,52], the recommended genotypes we characterized from the early-maturing group could provide useful genetic material for breeding low-methane, high-yielding rice. It is also worth mentioning that all the genotypes assessed in our study were commercial rice cultivars which had been subjected to scrutinized yield trials, local adaptability tests, and various quality evaluations, as well as intensive selection for generations. Therefore, the recommended genotypes we characterized from this pool could serve as qualified elite parents for knowledge-based crop improvement systems such as the ‘OneRice’ breeding strategy of the International Rice Research Institute (IRRI), which combines the approaches of artificial crosses between elite parents, speed breeding, marker-assisted selection (MAS) for major genes, genomic selection, and multi-location trials of genotype–environment–management (GEM) interactions [50,53]. To achieve this, genotyping experiments such as whole-genome resequencing of the core Korean rice cultivars are also ongoing to enable breeding programs accompanied by genomic predictions and GEM interactions under METs to accelerate the development of climate-resilient rice cultivars.

5. Conclusions

In conclusion, we have demonstrated the practical use of multi-environment trial analysis as selection criteria for rice breeding programs to develop region-specific cultivars and climate-resilient parents to improve yield potential and stability. Genotype evaluations of each yield-related trait (winning genotypes and ranking genotypes) can also be used as sources for fine-tuning target traits to achieve cultivar improvements. In addition, the identification of recommended cultivars using the simultaneous selection of MTSI and WAASB would provide guidance to breeders to select ideal parents which fit the purpose of rice breeding.

Supplementary Materials

The following supporting information can be downloaded at: https://www.mdpi.com/article/10.3390/agriculture13020256/s1, Figure S1: ‘Which-won-where’ polygon view of GGE biplot for yield-related traits for all maturity groups; Figure S2: ‘Representativeness vs. discriminativeness’ view of GGE biplot for yield-related traits for all maturity groups; Figure S3: ‘Ranking genotypes’ view of GGE biplot for yield-related traits for all maturity groups; Table S1: Information on cultivars used in this study; Table S2: Information on the planting seasons; Table S3: Climate data from the test environments; Table S4. Analysis of deviance (Type III Wald chi-square test) of linear mixed models for yield-related traits; Table S5: Genotype ranking based on WAASBY index for all maturity groups; Table S6: Statistics summary of yield-related traits and grain yield.

Author Contributions

Conceptualization, S.Y.L.; methodology, S.Y.L.; software, S.Y.L.; validation, S.Y.L.; formal analysis, S.Y.L.; visualization, S.Y.L.; investigation, H.-S.L., C.-M.L., S.-K.H., H.-M.P., S.-M.L. and Y.K.; resources, H.-S.L., C.-M.L., S.-K.H., H.-M.P., S.-M.L. and Y.K.; writing—original draft preparation, S.Y.L.; writing—review and editing, Y.M.; supervision, Y.M. and J.-U.J.; project administration, Y.M. All authors have read and agreed to the published version of the manuscript.

Funding

This research was funded by the Rural Development Administration (RDA) of South Korea, grant number PJ01699704.

Data Availability Statement

The data presented in this study are available on request from the corresponding author.

Acknowledgments

Y.M. acknowledges that this paper was supported by research funds for newly appointed professors at Jeonbuk National University in 2021.

Conflicts of Interest

The authors declare no conflict of interest.

References

  1. Muthayya, S.; Sugimoto, J.D.; Montgomery, S.; Maberly, G.F. An overview of global rice production, supply, trade, and consumption. Ann. New York Acad. Sci. 2014, 1324, 7–14. [Google Scholar] [CrossRef] [PubMed]
  2. Tester, M.; Langridge, P. Breeding technologies to increase crop production in a changing world. Science 2010, 327, 818–822. [Google Scholar] [CrossRef] [PubMed]
  3. Sakamoto, T.; Matsuoka, M. Identifying and exploiting grain yield genes in rice. Curr. Opin. Plant Biol. 2008, 11, 209–214. [Google Scholar] [CrossRef]
  4. Hall, A.J.; Richards, R.A. Prognosis for genetic improvement of yield potential and water-limited yield of major grain crops. Field Crop. Res. 2013, 143, 18–33. [Google Scholar] [CrossRef] [Green Version]
  5. Li, R.; Li, M.; Ashraf, U.; Liu, S.; Zhang, J. Exploring the relationships between yield and yield-related traits for rice varieties released in China from 1978 to 2017. Front. Plant Sci. 2019, 10, 543. [Google Scholar] [CrossRef] [Green Version]
  6. Peng, S.; Cassman, K.G.; Virmani, S.; Sheehy, J.; Khush, G. Yield potential trends of tropical rice since the release of IR8 and the challenge of increasing rice yield potential. Crop. Sci. 1999, 39, 1552–1559. [Google Scholar] [CrossRef] [Green Version]
  7. Kang, M.S. Using genotype-by-environment interaction for crop cultivar development. Adv. Agron. 1997, 62, 199–252. [Google Scholar]
  8. Malosetti, M.; Ribaut, J.-M.; van Eeuwijk, F.A. The statistical analysis of multi-environment data: Modeling genotype-by-environment interaction and its genetic basis. Front. Physiol. 2013, 4, 44. [Google Scholar] [CrossRef] [PubMed] [Green Version]
  9. Eberhart, S.T.; Russell, W. Stability parameters for comparing varieties 1. Crop. Sci. 1966, 6, 36–40. [Google Scholar] [CrossRef] [Green Version]
  10. Gauch, H., Jr. Statistical Analysis of Regional Yield Trials: AMMI Analysis of Factorial Designs; Elsevier Science Publishers: Amsterdam, The Netherlands, 1992. [Google Scholar]
  11. Mooers, C. The agronomic placement of varieties. Agron. J. 1921, 13, 337–352. [Google Scholar] [CrossRef]
  12. Yan, W.; Hunt, L.A.; Sheng, Q.; Szlavnics, Z. Cultivar evaluation and mega-environment investigation based on the GGE biplot. Crop. Sci. 2000, 40, 597–605. [Google Scholar] [CrossRef]
  13. Olivoto, T.; Lúcio, A.D.; da Silva, J.A.; Marchioro, V.S.; de Souza, V.Q.; Jost, E. Mean performance and stability in multi-environment trials I: Combining features of AMMI and BLUP techniques. Agron. J. 2019, 111, 2949–2960. [Google Scholar] [CrossRef]
  14. Olivoto, T.; Lúcio, A.D.; da Silva, J.A.; Sari, B.G.; Diel, M.I. Mean performance and stability in multi-environment trials II: Selection based on multiple traits. Agron. J. 2019, 111, 2961–2969. [Google Scholar] [CrossRef]
  15. Vergara, B. The flowering response of the rice plant to photoperiod. Int. Rice Res. Instig. Technol. Bull 1976, 8, 75. [Google Scholar]
  16. Collinson, S.; Ellis, R.; Summerfield, R.; Roberts, E. Durations of the photoperiod-sensitive and photoperiod-insensitive phases of development to flowering in four cultivars of rice (Oryza sativa L.). Ann. Bot. 1992, 70, 339–346. [Google Scholar] [CrossRef]
  17. Bueno, C.S.; Lafarge, T. Maturity groups and growing seasons as key sources of variation to consider within breeding programs for high yielding rice in the tropics. Euphytica 2017, 213, 1–18. [Google Scholar] [CrossRef]
  18. Jadhav, S.; Balakrishnan, D.; Shankar V., G.; Beerelli, K.; Chandu, G.; Neelamraju, S. Genotype by environment (G × E) interaction study on yield traits in different maturity groups of Rice. J. Crop. Sci. Biotechnol. 2019, 22, 425–449. [Google Scholar] [CrossRef]
  19. The Government of the Republic of Korea. 2050 Carbon Neutral Strategy of the Republic of Korea: Towards a Sustainable and Green Society; The Government of the Republic of Korea: Seoul, Republic of Korea, 2020.
  20. Huang, X.; Kurata, N.; Wang, Z.-X.; Wang, A.; Zhao, Q.; Zhao, Y.; Liu, K.; Lu, H.; Li, W.; Guo, Y. A map of rice genome variation reveals the origin of cultivated rice. Nature 2012, 490, 497–501. [Google Scholar] [CrossRef] [Green Version]
  21. Lee, C.-M.; Kwon, Y.-H.; Park, H.-M.; Jeung, J.-U.; Park, H.-S.; Baek, M.-K.; Ha, S.-K.; Mo, Y. Days to heading and culm length variation of Korean rice varieties in different environments. Korean Soc. Breed. Sci. 2020, 52, 389–397. [Google Scholar] [CrossRef]
  22. RDA. Manual for Standard Evaluation Method in Agricultural Experiment and Research; RDA Press: Suwon, Korea, 2012. [Google Scholar]
  23. Team, R.C. R: A Language and Environment for Statistical Computing; R Core Team: Vienna, Australia, 2013. [Google Scholar]
  24. Mendiburu, F.D.; Yaseen, M. Agricolae: Statistical Procedures for Agricultural Research, R Package Version 1.4.0.; R Core Team: Vienna, Australia, 2020.
  25. Kuhn, M.; Jackson, S.; Cimentada, J. Corrr: Correlations in R, R Package Version 0.4.2; R Core Team: Vienna, Australia, 2020.
  26. Bates, D.; Mächler, M.; Bolker, B.; Walker, S. Fitting linear mixed-effects models using lme4. arXiv Prepr. 2014, arXiv:1406.5823. [Google Scholar]
  27. Yan, W.; Kang, M.S. GGE Biplot Analysis: A Graphical Tool for Breeders, Geneticists, and Agronomists; CRC Press: Boca Raton, FL, USA, 2002. [Google Scholar]
  28. Nataraj, V.; Bhartiya, A.; Singh, C.P.; Devi, H.N.; Deshmukh, M.P.; Verghese, P.; Singh, K.; Mehtre, S.P.; Kumari, V.; Maranna, S. WAASB-based stability analysis and simultaneous selection for grain yield and early maturity in soybean. Agron. J. 2021, 113, 3089–3099. [Google Scholar] [CrossRef]
  29. Rocha, J.R.D.A.S.D.C.; Machado, J.C.; Carneiro, P.C.S. Multitrait index based on factor analysis and ideotype-design: Proposal and application on elephant grass breeding for bioenergy. Gcb Bioenergy 2018, 10, 52–60. [Google Scholar] [CrossRef]
  30. Olivoto, T.; Lúcio, A.D.C. metan: An R package for multi-environment trial analysis. Methods Ecol. Evol. 2020, 11, 783–789. [Google Scholar] [CrossRef]
  31. Mo, Y.; Jeong, J.-M.; Kim, B.-K.; Kwon, S.-W.; Jeung, J.-U. Utilization of elite Korean japonica rice varieties for association mapping of heading time, culm length, and amylose and protein content. Korean J. Crop. Sci. 2020, 65, 1–21. [Google Scholar]
  32. Mo, Y.; Lee, C.-M.; Park, H.-M.; Ha, S.-K.; Kim, M.-J.; Kwak, J.; Lee, H.-S.; Lee, J.-H.; Jeung, J.-U. Hd1 Allele Types and Their Associations with Major Agronomic Traits in Korean Rice Cultivars. Plants 2021, 10, 2408. [Google Scholar] [CrossRef]
  33. Yan, W.; Tinker, N.A. Biplot analysis of multi-environment trial data: Principles and applications. Can. J. Plant Sci. 2006, 86, 623–645. [Google Scholar] [CrossRef] [Green Version]
  34. Khan, M.M.H.; Rafii, M.Y.; Ramlee, S.I.; Jusoh, M.; Al Mamun, M. AMMI and GGE biplot analysis for yield performance and stability assessment of selected Bambara groundnut (Vigna subterranea L. Verdc.) genotypes under the multi-environmental trials (METs). Sci. Rep. 2021, 11, 22791. [Google Scholar] [CrossRef]
  35. Yan, W.; Kang, M.S.; Ma, B.; Woods, S.; Cornelius, P.L. GGE biplot vs. AMMI analysis of genotype-by-environment data. Crop. Sci. 2007, 47, 643–653. [Google Scholar] [CrossRef] [Green Version]
  36. Sharifi, P.; Aminpanah, H.; Erfani, R.; Mohaddesi, A.; Abbasian, A. Evaluation of genotype× environment interaction in rice based on AMMI model in Iran. Rice Sci. 2017, 24, 173–180. [Google Scholar] [CrossRef]
  37. Enyew, M.; Feyissa, T.; Geleta, M.; Tesfaye, K.; Hammenhag, C.; Carlsson, A.S. Genotype by environment interaction, correlation, AMMI, GGE biplot and cluster analysis for grain yield and other agronomic traits in sorghum (Sorghum bicolor L. Moench). PLoS ONE 2021, 16, e0258211. [Google Scholar] [CrossRef]
  38. Pour-Aboughadareh, A.; Barati, A.; Koohkan, S.A.; Jabari, M.; Marzoghian, A.; Gholipoor, A.; Shahbazi-Homonloo, K.; Zali, H.; Poodineh, O.; Kheirgo, M. Dissection of genotype-by-environment interaction and yield stability analysis in barley using AMMI model and stability statistics. Bull. Natl. Res. Cent. 2022, 46, 19. [Google Scholar] [CrossRef]
  39. Huang, X.; Jang, S.; Kim, B.; Piao, Z.; Redona, E.; Koh, H.-J. Evaluating Genotype× Environment Interactions of Yield Traits and Adaptability in Rice Cultivars Grown under Temperate, Subtropical and Tropical Environments. Agriculture 2021, 11, 558. [Google Scholar] [CrossRef]
  40. Balakrishnan, D.; Subrahmanyam, D.; Badri, J.; Raju, A.K.; Rao, Y.V.; Beerelli, K.; Mesapogu, S.; Surapaneni, M.; Ponnuswamy, R.; Padmavathi, G. Genotype× environment interactions of yield traits in backcross introgression lines derived from Oryza sativa cv. Swarna/Oryza nivara. Front. Plant Sci. 2016, 7, 1530. [Google Scholar] [CrossRef] [PubMed] [Green Version]
  41. Das, A.; Parihar, A.K.; Saxena, D.; Singh, D.; Singha, K.; Kushwaha, K.; Chand, R.; Bal, R.; Chandra, S.; Gupta, S. Deciphering genotype-by-environment interaction for targeting test environments and rust resistant genotypes in field pea (Pisum sativum L.). Front. Plant Sci. 2019, 10, 825. [Google Scholar] [CrossRef] [PubMed]
  42. de Leon, N.; Jannink, J.L.; Edwards, J.W.; Kaeppler, S.M. Introduction to a special issue on genotype by environment interaction. Crop. Sci. 2016, 56, 2081–2089. [Google Scholar] [CrossRef] [Green Version]
  43. Yan, W.; Cornelius, P.L.; Crossa, J.; Hunt, L. Two types of GGE biplots for analyzing multi-environment trial data. Crop. Sci. 2001, 41, 656–663. [Google Scholar] [CrossRef] [Green Version]
  44. Islam, S.S.; Anothai, J.; Nualsri, C.; Soonsuwon, W. Analysis of genotype-environment interaction and yield stability of Thai upland rice ('Oryza sativa'L.) genotypes using AMMI model. Aust. J. Crop. Sci. 2020, 14, 362–370. [Google Scholar] [CrossRef]
  45. Tumuhimbise, R.; Melis, R.; Shanahan, P.; Kawuki, R. Genotype × environment interaction effects on early fresh storage root yield and related traits in cassava. Crop. J. 2014, 2, 329–337. [Google Scholar] [CrossRef] [Green Version]
  46. Becker, H.; Leon, J. Stability analysis in plant breeding. Plant Breed. 1988, 101, 1–23. [Google Scholar] [CrossRef]
  47. Lin, C.-S.; Binns, M.R.; Lefkovitch, L.P. Stability analysis: Where do we stand? 1. Crop. Sci. 1986, 26, 894–900. [Google Scholar] [CrossRef] [Green Version]
  48. Pour-Aboughadareh, A.; Sanjani, S.; Nikkhah-Chamanabad, H.; Mehrvar, M.R.; Asadi, A.; Amini, A. Identification of salt-tolerant barley genotypes using multiple-traits index and yield performance at the early growth and maturity stages. Bull. Natl. Res. Cent. 2021, 45, 117. [Google Scholar] [CrossRef]
  49. Sharifi, P.; Erfani, A.; Abbasian, A.; Mohaddesi, A. Stability of some of rice genotypes based on WAASB and MTSI indices. Iran. J. Genet. Plant Breed. 2020, 9, 1–11. [Google Scholar]
  50. Heredia, M.C.; Kant, J.; Prodhan, M.; Dixit, S.; Wissuwa, M. Breeding rice for a changing climate by improving adaptations to water saving technologies. Theor. Appl. Genet. 2021, 135, 17–33. [Google Scholar] [CrossRef] [PubMed]
  51. Wassmann, R.; Papen, H.; Rennenberg, H. Methane emission from rice paddies and possible mitigation strategies. Chemosphere 1993, 26, 201–217. [Google Scholar] [CrossRef]
  52. Yagi, K.; Tsuruta, H.; Minami, K. Possible options for mitigating methane emission from rice cultivation. Nutr. Cycl. Agroecosystems 1997, 49, 213–220. [Google Scholar] [CrossRef]
  53. Mahmood, T.; Ahmed, T.; Trethowan, R. Genotype × Environment × Management (GEM) Reciprocity and Crop Productivity; FAO: Rome, Italy, 2022. [Google Scholar]
Figure 1. Performance of yield-related traits under multi-environment trials. (a) Variation in yield-related traits among six environments: CL—culm length; PL—panicle length; PN—panicle number per plant; SPP—spikelets per panicle; TGW—thousand-grain weight; GY—grain yield; EJJ—early planting in Jeonju; RJJ—regular planting in Jeonju; ESW—early planting in Suwon; RSW—regular planting in Suwon; EMY—early planting in Miryang; RMY—regular planting in Miryang. Different lowercase letters above the box plots indicate significant differences according to Scheffe’s method for post hoc comparison at p ≤ 0.05. (b) Correlation network between yield-related traits and grain yield based on maturity groups. Pearson’s correlation coefficient: ** p < 0.01; and *** p < 0.001.
Agriculture 13 00256 g001
Figure 2. ‘Which-won-where’ polygon view of the GGE biplots for grain yield of early-, medium-, and medium–late-maturing cultivars in six environments. Red diamonds and green circles represent the environment and individual genotype, respectively. EJJ—early planting in Jeonju; RJJ—regular planting in Jeonju; ESW— early planting in Suwon; RSW—regular planting in Suwon; EMY—early planting in Miryang; RMY—regular planting in Miryang.
Agriculture 13 00256 g002
Figure 3. ‘Discriminativeness vs. representativeness’ view of GGE biplots for the grain yield of early-, medium-, and medium–late-maturing cultivars in six environments. Red diamonds and green circles represent environment and individual genotype, respectively. Green lines and blue arrows indicate the environment axis and average environment axis (AEA), respectively. EJJ—early planting in Jeonju; RJJ—regular planting in Jeonju; ESW—early planting in Suwon; RSW—regular planting in Suwon; EMY—early planting in Miryang; RMY—regular planting in Miryang.
Agriculture 13 00256 g003
Figure 4. ‘Ranking genotypes’ view of GGE biplots for grain yield of early-, medium-, and medium–late-maturing cultivars. Red diamonds represent environment. Green circles and green lines indicate individual genotype and average environment axis, respectively. EJJ—early planting in Jeonju; RJJ—regular planting in Jeonju; ESW—early planting in Suwon; RSW—regular planting in Suwon; EMY—early planting in Miryang; RMY—regular planting in Miryang.
Agriculture 13 00256 g004
Figure 5. Grain yield and yield-related trait performance and stability across the environments. (a) Plot of multi-trait stability indexes (MTSI) of early-, medium-, and medium–late-maturing cultivars. Red and yellow circles indicate selected and non-selected genotypes, respectively. Green circles indicate the cut-off. (b) Heatmaps of the WAASBY indexes showing ranks of the genotypes according to weighting scores of grain yield and stability. (c) List of suitable genotypes per maturity group. Red font indicates highly ‘recommended’ genotypes.
Agriculture 13 00256 g005
Disclaimer/Publisher’s Note: The statements, opinions and data contained in all publications are solely those of the individual author(s) and contributor(s) and not of MDPI and/or the editor(s). MDPI and/or the editor(s) disclaim responsibility for any injury to people or property resulting from any ideas, methods, instructions or products referred to in the content.

