
Quantitative Description and Classification of Growing Media Particle Morphology through Dynamic Image Analysis


1
EPHor, L’Institut Agro, 49045 Angers, France
2
Department of Horticultural Sciences, North Carolina State University, Raleigh, NC 27695, USA
*
Author to whom correspondence should be addressed.
Agriculture 2023, 13(2), 396; https://doi.org/10.3390/agriculture13020396
Submission received: 23 December 2022
/
Revised: 31 January 2023
/
Accepted: 4 February 2023
/
Published: 8 February 2023
(This article belongs to the Special Issue Advanced Research on Soilless Culture in Horticultural Production)
Abstract
:The physical properties of growing media are dependent on the morphological characteristics of the particles composing them. Thus, their characteristics can be more precisely altered for specific purposes by a better morphological design of materials to optimize the use of raw materials and increase water efficiency. There are many references on the relationship between basic particle size and physical properties, but the arrangement of the particles and the resulting physical properties are also affected by the shape of the particles. Growing media have seldom been characterized by shape criteria and, therefore, their influence remains unknown. A dynamic image analyzer, the QicPic device, was used to assess particle shape and size for a wide diversity of growing media constituents. As well as FeretMAX and ChordMIN diameters describing individual particle length and width, respectively, individual particle shape was analyzed in terms of several descriptors (aspect ratio, circularity, roundness, and convexity). A classification was established to discern different particle shapes and all materials were described accordingly. Correlations between particle morphology descriptors were reported, showing that the greater the particle length, the smaller the width/length ratio, circularity, roundness, and convexity. Circularity, roundness, particle length, and its associated relative span were identified as the most relevant parameters describing materials’ morphology. This work shows a large diversity in particle morphology of growing media constituents, which were categorized into four classes of materials. Three classes were mainly described according to their particle shapes, with a decreasing elongation and an increasing circularity, roundness, and convexity: (1) fine and coarse wood and coir fibers; (2) all Sphagnum white peats, milled or sod; and (3) black peats, sedge peat, coir pith, fresh and composted pine bark, green waste compost, and perlite. A fourth class was represented by coir medium (mixing pith and fibers) and was above all characterized by high diversity in particle length. These findings extend the characterization of the materials for a more thorough evaluation of the links between particle morphology and physical properties.
1. Introduction
Optimizing water efficiency in container growing systems is a critical issue. This is especially important as viable water sources for agriculture are declining on a global scale, as the demand for non-mineral soil alternatives are increasing rapidly. Indeed, Blok et al. expected a quadrupling in total volume of raw materials used as growing media by 2050 [1]. The need for more knowledge of these materials has never been greater to explain their water and air retention and flow properties, which affect irrigation strategies and, ultimately, plant growth. Research on physical properties of growing media from the 1960s to the 1980s focused on air and water contents in equilibrium, whereas dynamic approaches to flow and conductivity parameters have been pursued since the 1990s, as recently reported by Caron and Michel [2]. Examples of these endeavors are the effects of potting operations [3,4,5], container volume and geometry [6,7,8], and root development in the growing media over time [9,10]. Today, water retention curves are commonly used for assessing water and air retention properties of growing media, and, moreover, for selecting growing media constituents, particle size fractions, and the final blends by the industry.
Physical properties of growing media are dependent upon particle morphology and arrangement, as they are responsible for pore space organization and distribution. Indeed, given reasonable particle homogeneity, the larger the particle size, the higher the air-filled porosity and the lower the water retention properties [8,11,12,13,14,15].
In the past, particle morphology was characterized by sieving procedures. By design, sieving actually measures the second largest dimension of the particles, i.e., the width. Therefore, particle “sieve size” is characterized best on particles with width/length ratios near a value of one [16]. The methodological and accuracy limits of sieving methods have led to the suggestion of the use of dynamic image analysis (DIA) to better describe particle size and shape [17,18]. The principle of DIA is to analyze two-dimension images of randomly orientated particles passing in a flow in front of a high-speed camera [19]. Its use is particularly relevant for growing media constituents showing a large diversity of particle size and shape, with more or less elongated and granular materials. Initial studies have been recently conducted, allowing characterization of some materials and, initially, the introduction of DIA, the listing of parameters used for particle size descriptors, and the detailing of the principle and the limits depending on the devices used [15,17,18,20]. From these works, FeretMAX was chosen for describing particle length, where ChordMIN [15,20], or the width of the bounding rectangle, BrMIN [17], were selected as particle width descriptors.
In the literature, the particle shape of growing media is rarely studied, and even less its influence on physical properties. Particle shape is commonly described from the width/length ratio, and the aspect ratio or elongation, circularity, symmetry, convexity, and roundness are also noted [21]. Studies in soil science, civil engineering, and geotechnics have shown the value of characterizing particle shape to better understand the physical and mechanical properties of the systems under study [22,23,24]. Studies carried out on mono-sized grains of sand with varying shapes showed that the greater the circularity and aspect ratio (i.e., less elongated particles), the higher the bulk density and the less total porosity [25,26]. Moreover, from sand and biochar–sand mixtures, respectively, Yi et al. and Liu et al. reported that, the more the particle roundness, the lower the total porosity and the compressibility, due to the higher ability of those particles to fill voids than angular particles [27,28]. However, for growing media, very little has been done [17,18].
In view of both the lack of knowledge about particle shape and the limits to the particle size obtained from sieving, combining analysis of particle size and shape can be considered an important step to advance the understanding of particle arrangement and, then, of physical properties. From different organic materials, previous authors have shown that, the smaller the particles, the less their elongation, and the more their convexity and circularity [15,29,30]. The same observations were reported by Durand et al. on four growing media constituents (coir, pine bark, white peat, and wood fiber) [18].
The goal of this study was to extend the description of particle morphology using the DIA process with the following objectives:
- To define shape descriptors (aspect ratio, elongation, circularity, convexity, and roundness) and the parameters used for their calculations, then to discuss their relevance for describing growing media particles with the QicPic device;
- To propose a classification adapted from Blott and Pye to describe the particle shapes of growing media constituents [21];
- To catalog particle shapes of materials tested according to the classification proposed;
- To analyze relationships between particle shape and size descriptors;
- To propose a first classification of growing media constituents based on their particle size and shape, and to discuss its robustness.
2. Materials and Methods
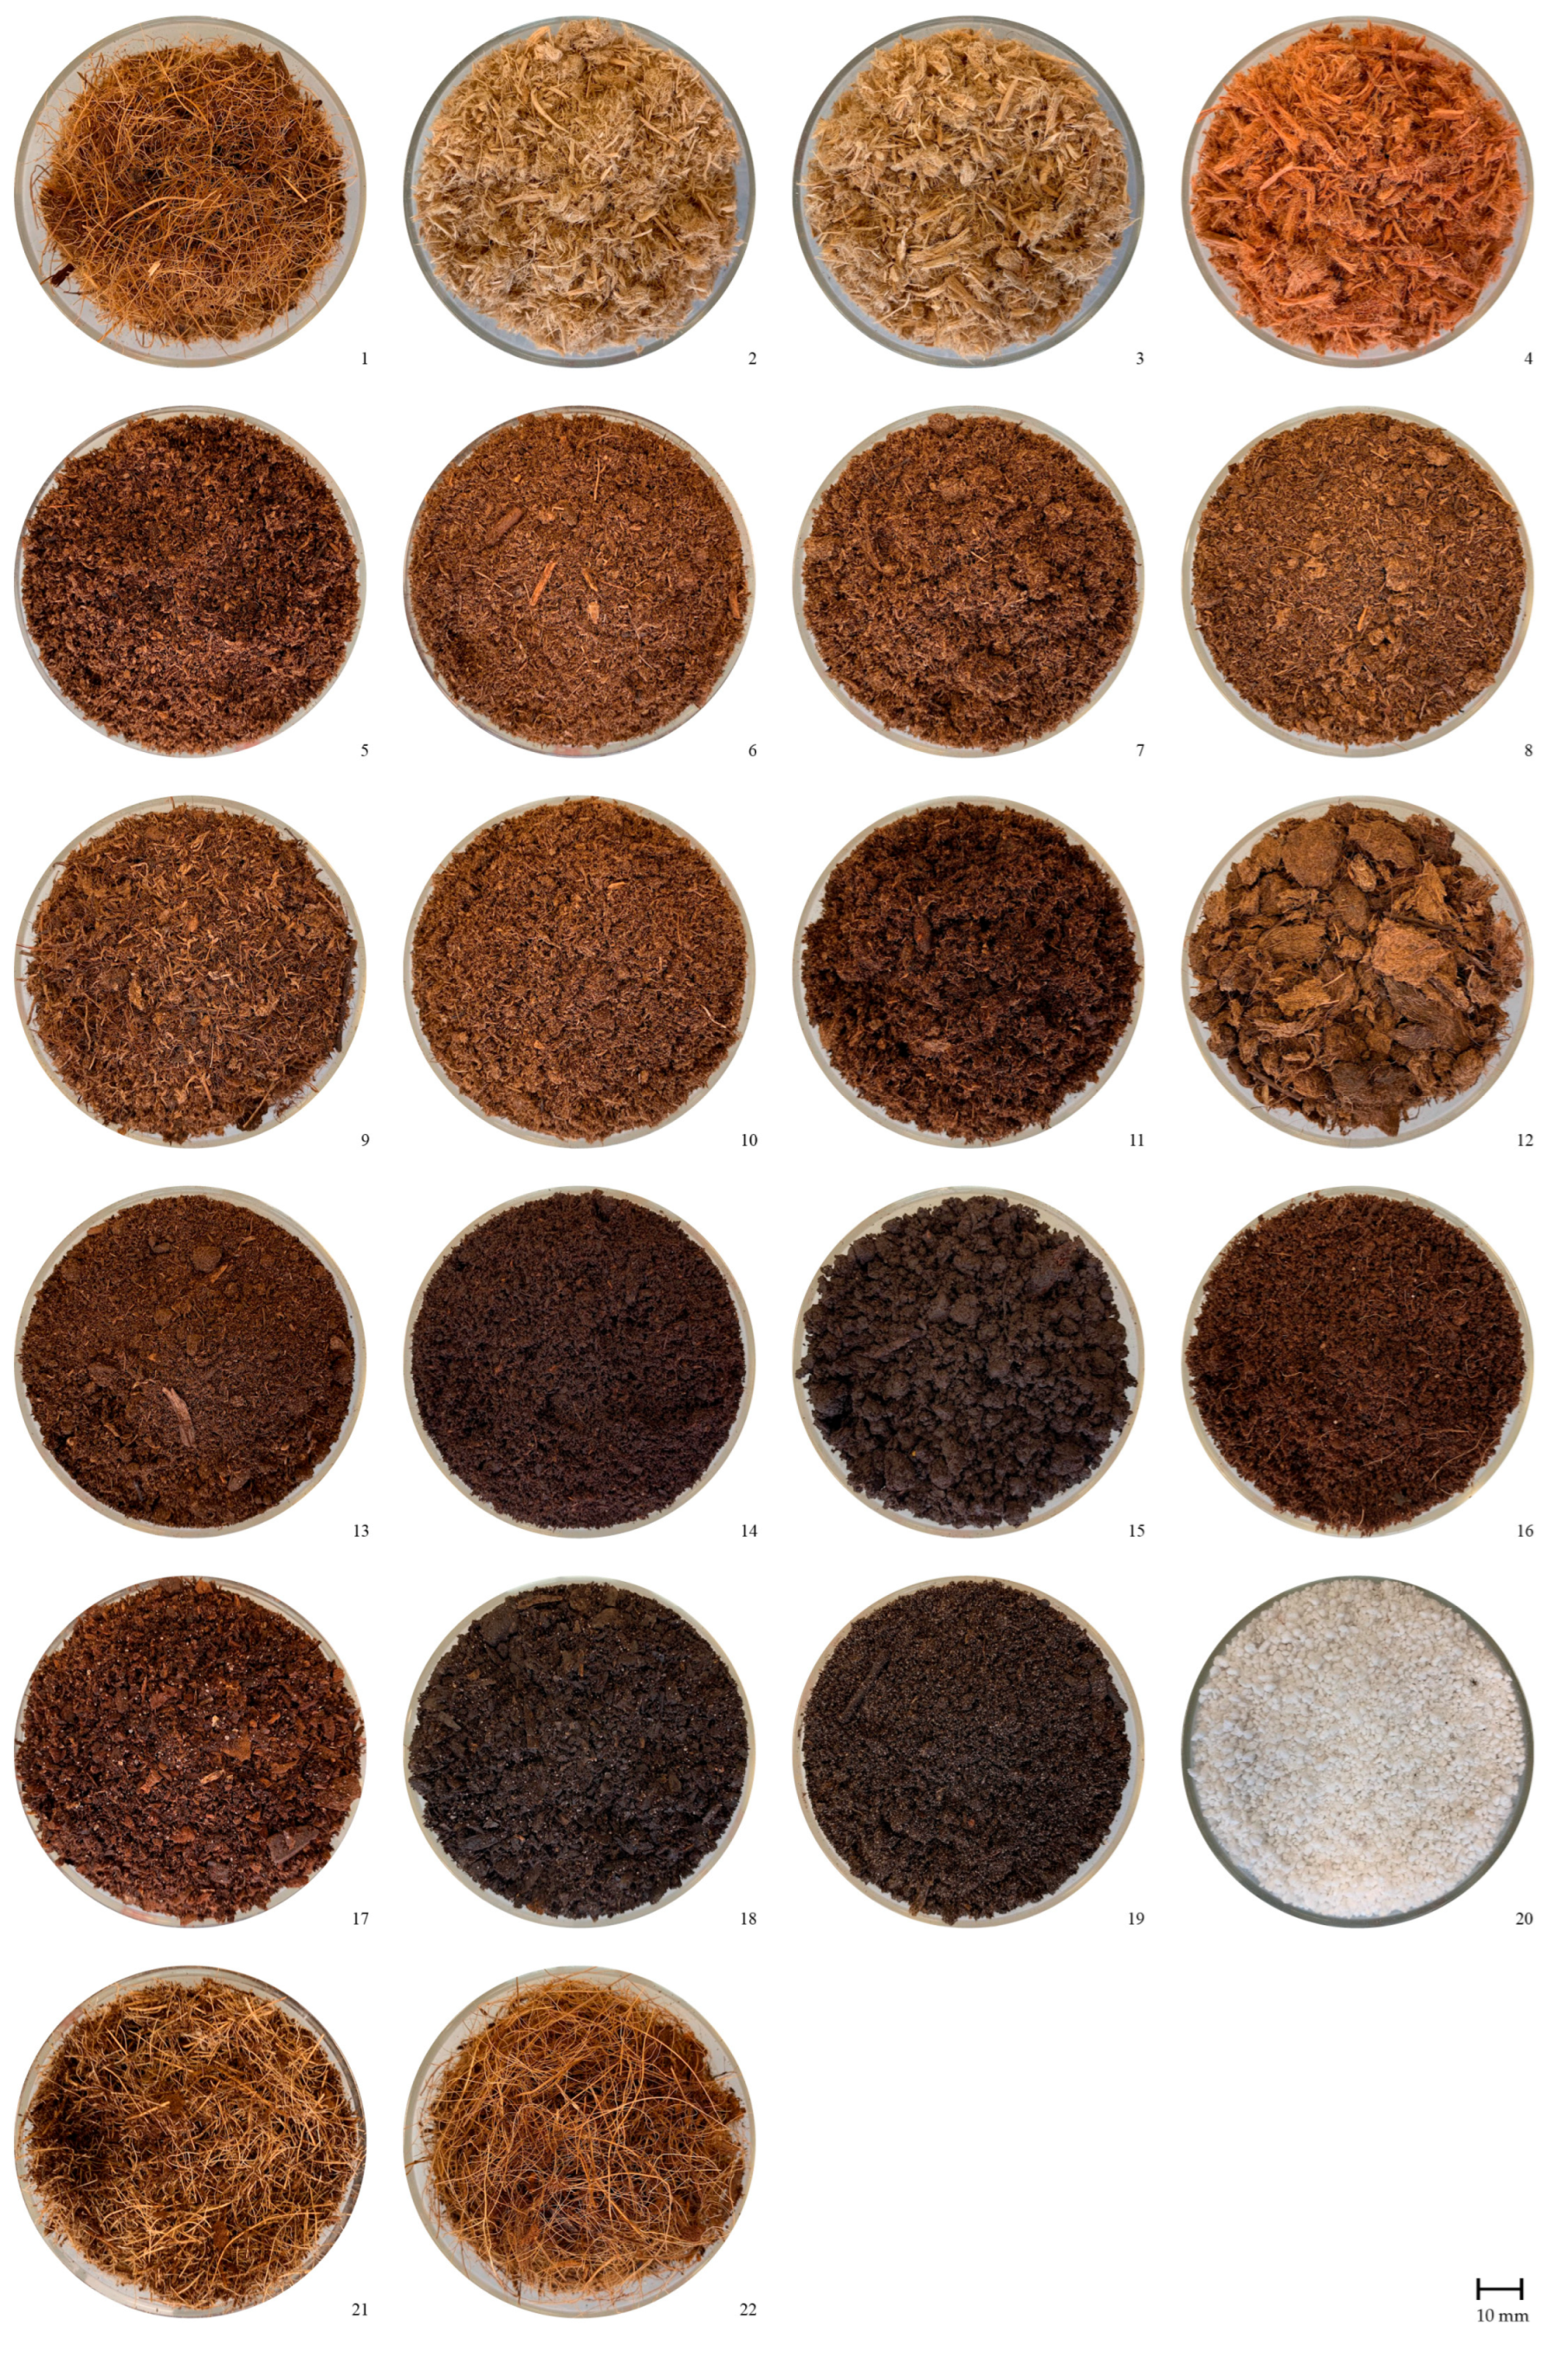
A wide range of raw materials (22 references) representing the main growing media constituents on the current global market were selected [31]. Information about these materials is given in Table 1, and pictures of the materials are provided in Figure 1.
2.1. Dynamic Image Analysis
Dynamic image analysis (DIA) measurements were conducted with the QicPic (Sympatec GmbH, Clausthal-Zellerfeld, Germany), using a wet dispersion unit called the “Flowcell”. This DIA device and its principle were previously described by Durand et al. [18]. It allows, from hydrated materials, the analysis of particles having sizes varying between 17 µm to 33.8 mm, and shapes from 50 µm, using a high-resolution camera. However, particle roundness can accurately be determined from 500 µm.
The material to be analyzed is agitated in water with a three-armed cone-shaped agitator (VJ100 Visco Jet, Küssaberg, Germany) in a 15 L tank for 10 min to cautiously separate particles without damaging them, and then transferred from pipes (20 mm diameter) to the camera area via a peristaltic pump. Three replicates per material were carried out, with 1 to 2 g per replicate, depending on particle size, density, and initial moisture content. This amount of material was defined to maintain an optimal optical concentration of ~1%, relative to the projected area density of the particles per image. Each measurement event was 2 min with a frequency of 80 digital images per second, which approximately represents 107 particles per replicate. The size and shape of all particles of all images were then analyzed via the PAQXOS 4.3 software (developed by Sympatec GmbH) associated with the QicPic device. The particle distribution was weighted by projected area, corresponding to the area of the particle observed on the two-dimensional image.
2.2. Shape Descriptors
One of the most common measurements utilizes diameters intrinsic to specific locations within each shape. The word “diameter” is usually associated with a straight line passing through the center of an object, usually a circle or sphere. In this case, a “diameter” is used more generically as a straight line passing through a specific portion of an object. Thus, technically, an object can have several different diameters depending on what dimension of the particle is being analyzed.
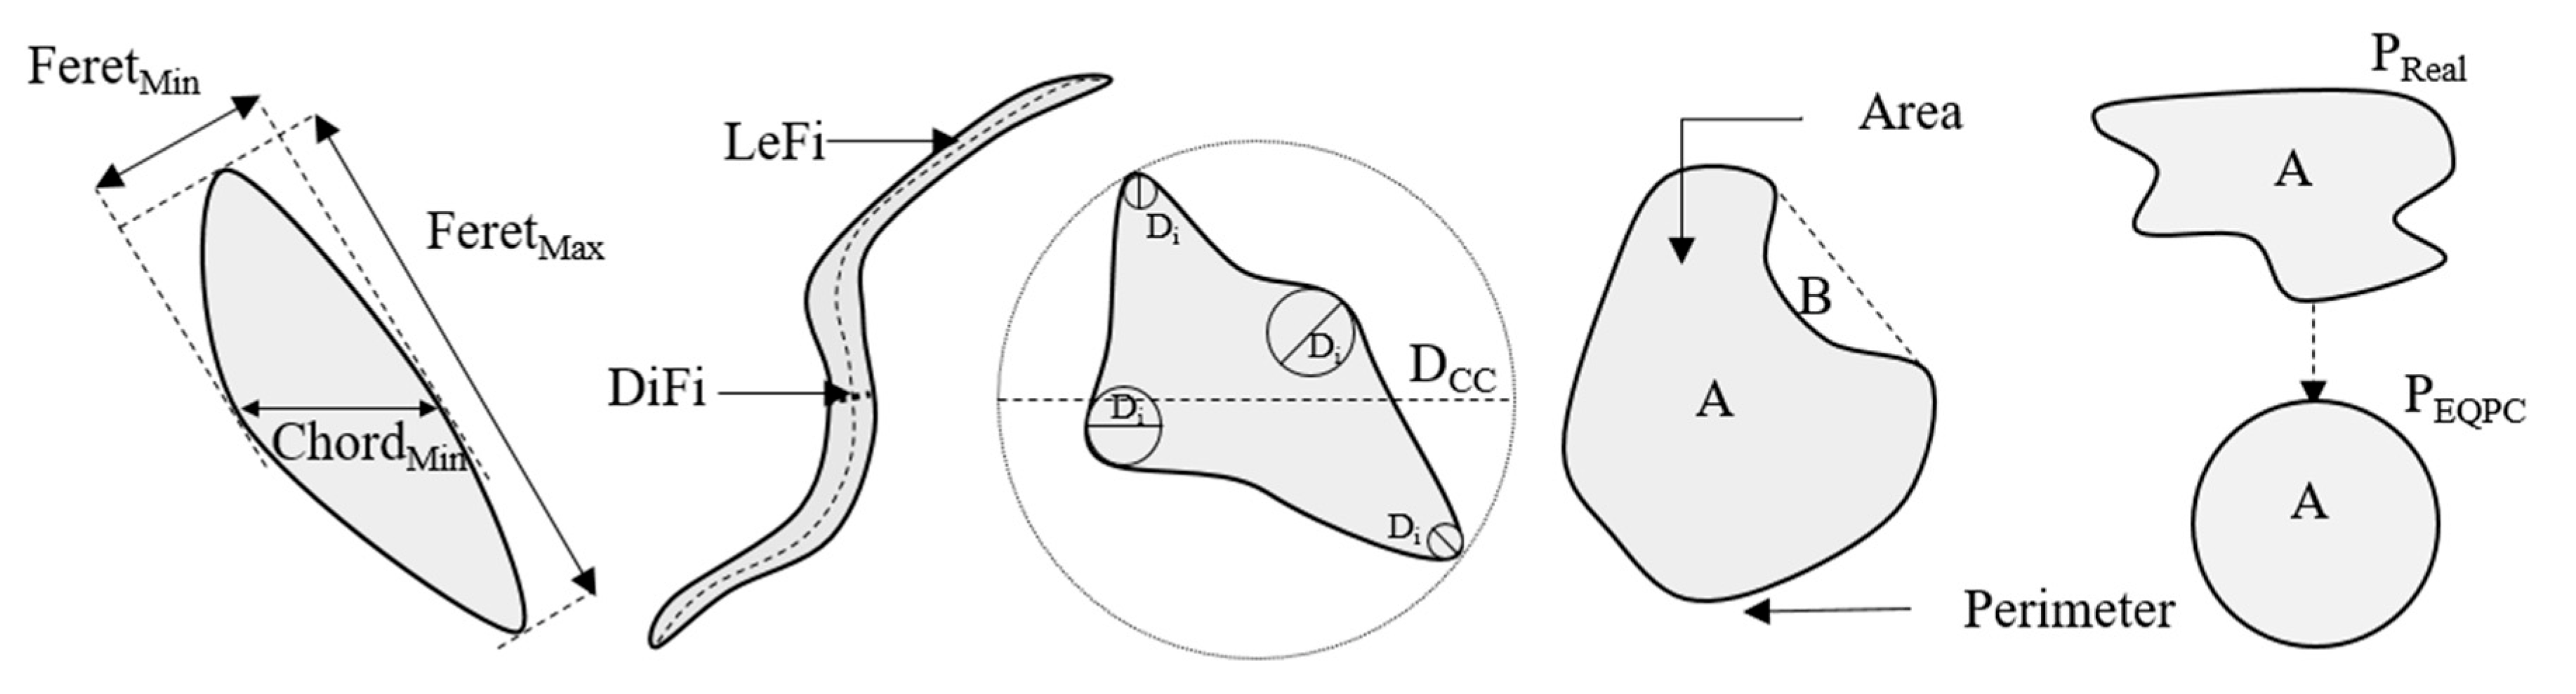
Five shape descriptors were calculated and studied for this work: elongation, aspect ratio, roundness, circularity, and convexity (Figure 2). All shape descriptor values vary from 0 to 1. Figure 3 shows examples of particles to illustrate the calculation of the associated morphological descriptor values.
- Aspect ratio: indicator of width/length ratio (Figure 2, Equation (1)) where width and length are respectively calculated from the minimum (FeretMIN) and maximum (FeretMAX) Feret diameters. Feret diameters are defined as the distance between two parallels tangents of the particle contour. Thus, Feret MIN is the smallest and Feret MAX the biggest distance among all Feret diameters of a particle.
- Elongation: another indicator of width/length ratio (Figure 2, Equation (2)). The length of fiber (LeFi) is calculated using the skeletonization technique, and corresponds to the longest direct path from one end to another within the particle contour. The diameter of fiber (DiFi) is calculated by dividing the projection area by the sum of all lengths of the branches of the fibre skeleton.
- Circularity: indicator of the deformation of the perimeter of a particle from a circle having the same area [33]. This shape descriptor is sometime wrongly called sphericity, but its measurement is done in two dimensions [21]. The circularity is calculated from the particle perimeter and area. An equal projection area circle (EQPC) is calculated from the measured area of the particle, and the perimeter of the EQPC is compared to the real perimeter of the particle (Figure 2, Equation (3)). Particle circularity decreases as the perimeter increases for a given area. As discussed by Blott and Pye [21], circularity is distinct from roundness. As an example, a square has high a circularity equal to 0.89, but a roundness equal to zero.
- Convexity: indicator of the compactness of a particle. Convexity corresponds to the ratio of the projection area itself (A) and the area of the convex hull (A + B) (Figure 2, Equation (4)), where (B) is the open concave region of the particle. The convex hull is a surface delimited by the line of shortest distance, which connects the maximum projections on a particle outline.
- Roundness: indicator of the relative sharpness of the corner of a particle [34]. Various formulas are available to assess the roundness of the particle [21]. Here, roundness measured by the QicPic is defined as the ratio of the average radius of curvature of all convex regions to the circumscribed circle of the particle (Figure 2, Equation (5)), in contrast with Wadell [34], who suggested to consider the largest inscribed circle of the particle as denominator in the roundness calculation equation.
With: Di, the diameter of the ith circle at the corner of the particle; n the number of corners; Dcc the diameter of the circumscribed circle.
2.3. Shape Classification
A new classification chart, largely inspired by that defined by Blott & Pye [21], is given in Table 2, with numerical values and illustrations for each shape descriptor. New class boundary values were calculated for circularity and roundness according to the equations used by the PAQXOS software (Equations (3)–(5)), differing from those used by Blott and Pye to set up their classification chart [21]. Aspect ratio and elongation class boundaries are those proposed by Blott and Pye [21]. The class boundaries of circularity correspond to a linear progression in four classes, ranging from a square to a four-pointed star (Table 2).
2.4. Particle Size Measurement
The ChordMIN diameter (Figure 2) was selected to assess the width of the particle [15,19,20]. A chord length is defined by the maximum straight distance of two points within the particle contour. ChordMIN is the shortest chord among all the maximum chords measured by the software (Figure 2). The FeretMAX diameter was selected to assess the particle’s length [15,19,20,35].
2.5. Data Treatment and Statistical Analysis
Analytics from the data measured by image analysis are provided by the software PAQXOS associated to the QicPic device. For each of size and shape descriptors mentioned above, the arithmetic mean and the values at the 10th, 50th and 90th percentiles of the cumulative distribution (D10, D50 and D90) were determined. Also, the proportion of particles into shape classes according to Table 2, is reported. The relative span of the distribution, indicator of the distribution’s width [17,36], was also calculated (Equation (6)) from the percentiles of the cumulative distribution, to highlight the diversity of size and shape within materials.
With: D10,50,90, the values of size or shape at the 10th, 50th and 90th percentile of the cumulative distribution
For the study of the diversity in particles as a function of particle size, the values of particle shape descriptors were averaged by particle size intervals. These intervals start from the lower value of 50 µm and are defined by a geometric progression with a ratio of 1.29.
Statistical analysis was carried out with the software R (version 4.1.1). Principal component analysis (PCA) and hierarchical cluster analysis (HCA) were conducted using the associated package Factoshiny [37], with the aim of distinguish similarities and differences between variables (PCA) and clusters of materials (HCA) based on particle size and shape descriptors. In addition to PCA and HCA, a Pearson correlation matrix was set up to highlight and to calculate the relationships between variables.
The statistical analysis was performed from the dataset describing the 22 materials by their particle mean size diameters (FeretMAX and ChordMIN), their mean shape descriptors values (aspect ratio, circularity, convexity and roundness), and the relative span (Equation (6)) of the mentioned particle size and shape descriptors.
Although the elongation variable was considered in the correlation matrix to analyze the relationships between particle size and shape descriptors, this variable was then removed for the PCA and HCA analyses. Indeed, the method of calculation makes the aspect ratio more relevant for characterizing the width/length ratio for a larger diversity of materials, whereas elongation is suitable and was calculated for fibrous particles only.
3. Results
3.1. Global Analysis of Particle Shapes for the 22 Growing Media Constituents
Among a total of 18 classes (5 classes for aspect ratio and circularity, 4 for roundness and convexity) used for describing the particle shapes, only two of them were of very low frequency for the whole of growing media constituents studied, i.e., very low convexity and very high circularity, for which both mean and standard deviation values were low (Table 3). The other sixteen classes exhibited large differences in their proportions between materials, as confirmed by higher standard deviations.
Beyond the detailed description of each material, statistical analysis (PCA then HCA) were subsequently performed to analyze the relationships between morphological descriptors (all particle shape and size descriptors) and to identify the relevant parameters allowing to group materials into clusters.
3.2. Correlations between Morphological Descriptors & Identification of Relevant Parameters
PCA correlation circle, performed from arithmetic mean of the size and shape descriptors and their associated relative span determined for the 22 materials, is presented Figure 4.
The first component of the PCA is mainly based on particle shape descriptors and their associated relative span, with the sole exception of span roundness. This component explained 66% of the total variance (Figure 4). Those significantly (p-value < 0.01) contributing the most (r > |0.95|) to the first component of the PCA were mean and span circularity, mean and span convexity, and span aspect ratio. The second component, built by the mean and span length and span roundness, only explained 14% of the variability.
Pearson correlation matrix (Table 4) also highlighted significant correlations between shape descriptors (p-value < 0.001), with higher correlations (r > 0.92) between elongation, aspect ratio, circularity and convexity, whereas roundness showed the least correlation with the other shape descriptors. Particle length and width were also significantly correlated (r = 0.75). Weaker but significant correlations were found between particle size (considering both length and width) and elongation, circularity and convexity, but not for roundness. Also, particle length was more correlated with shape descriptors than particle width. To sum up, the higher the particle length, the lower the width/length ratio (more elongated particles), the circularity and the convexity.
3.3. Hierarchical Clustering Analysis (HCA) of Growing Media Constituents
The HCA, performed from the two first components obtained from the PCA, allowed to identify four clusters of materials (Figure 5), for which mean and relative span of shape and size descriptors were presented in Table 5.
In details, clusters 1, 2 and 3 were only differentiated by the first PCA component, and then were mainly classified in ascending order according to the mean values of shape descriptors and in descending order according to their relative span, rather than the particle length. Although the cluster 4 was quite close to cluster 2 on the basis of the mean values of shape descriptors (main PCA component), this cluster 4 differed from the others due to the diversity (relative span) in roundness and by the particle length (2nd PCA dimension, Figure 4).
The first cluster regrouped fine (#2) and medium wood fibers (#3 and #4) and coir fiber (#1), and was defined by the lower mean values for aspect ratio (0.42 to 0.46), circularity (0.57 to 0.60), convexity (0.67 to 0.71), and roundness (0.09 to 0.16), i.e., by more elongated and angular, and less circular and convex particle shapes (Table 5). Indeed, these materials were particularly characterized by high contents in the most elongated particles (41% to 51% for the sum of extremely and very elongated particles), angular particles (48% to 66% of angular particles), the less circular particles (44% to 60% of very low circular particles), and by the less proportions in highly convex particles (44% to 62%) compared to the other clusters (Table 3). This first cluster also showed the highest relative span for the aspect ratio, circularity, and convexity, indicating a higher diversity in particle shapes for these materials (Table 5).
The second cluster regrouped all white peats, regardless of their geographical origins, particle sizes, and extraction processes (i.e., fine and medium, milled and sod (#5 to #12)), with intermediate mean values for aspect ratio (0.50 to 0.59), circularity (0.69 to 0.78), convexity (0.78 to 0.83), and roundness (0.15 to 0.20) (Table 5). The materials comprising this cluster were characterized by slightly to very elongated particles (86% to 91%, i.e., very low contents in extremely elongated and not-elongated particles), particles having moderately to very low circularity (94% to 97%), angular to sub-rounded particles (91% to 95%), and mainly highly convex particles (70% to 82%) (Table 3).
The third cluster was composed of black peats (#13 and #14), sedge peat (#15), coir fine (#16), fresh (#17) and composted (#18) pine bark, green waste compost (#19), and fine perlite (#20). This cluster was defined by higher mean values for aspect ratio (0.60 to 0.67), circularity (0.80 to 0.87), convexity (0.85 to 0.91), and roundness (0.19 to 0.29), i.e., by both less elongated and angular, and more circular and convex, particle shapes (Table 5). These materials were characterized by almost all having a very convex particle shape (>87%), and by the lowest proportions of very to extremely elongated particles (2 to 13%), particles having very low circularity (1 to 11%), and angular particles (6 to 29%) (Table 3). The relative spans of the materials comprising this cluster were also the lowest, indicating more homogeneous shapes (Table 5).
The fourth cluster was only composed of two raw materials: coir medium (#21 and #22). The mean values for aspect ratio (0.58 to 0.61), circularity (0.75 to 0.79), convexity (0.80 to 0.83), and roundness (0.19 to 0.22) were similar or very close to those that were highest for cluster 2 and lowest for cluster 3. However, in contrast with the other clusters, these materials were also characterized by very high relative spans in particle length, and, to a lesser extent, in particle roundness (Table 5). These large diversities in particle length and roundness observed for the coir medium seem to confirm the distinction of particle morphologies within this material. Indeed, its results from a mixture between coir pith (small size, slightly elongated, moderately circular, and highly convex particles) and coir fibers (large size, very or extremely elongated, slightly circular, and slightly convex particles), represented by samples #16 and #1 in clusters 3 and 1, respectively.
3.4. Shape Diversity as a Function of Particle Length
Mean values of the shape descriptors (aspect ratio, circularity, convexity, and roundness) are plotted (Figure 6) as a function of the particle length (expressed by FeretMAX) for the paragon of each cluster (Table 5): wood fiber medium (#3, Figure 6a), Irish white peat (#5, Figure 6b), composted pine bark fine (#18, Figure 6c), and coir medium (#22, Figure 6d).
Overall, decreases in values of shape descriptors and, thus, changes in shapes were observed according to an increasing particle length (Figure 6), except only roundness for wood fiber (cluster 1). Thus, the longer the particle, the more their width/length ratio (i.e., the less the aspect ratio), and the less their circularity, convexity, and roundness
Regardless of the magnitude of the decreases in the values of the shape descriptors observed, most important changes (i.e., diversity) in particle shape were observed for the finest fractions, for all materials (<1 to 1.5 mm for wood fiber medium, Irish white peat, and composted pine bark, and <2.5 mm for coir medium, approximately), but, in particular, for wood fiber medium and coir medium. For the longest particle size, changes in shape descriptors were quite low for wood fiber medium (cluster 1) and coir medium (cluster 4), suggesting a similar particle shape. Conversely, values in shape descriptors very slowly but continuously decreased for increasing particle length of Irish white peat (cluster 2) and composted pine bark (cluster 3). Thus, the magnitude and the evolution of decreases in shape descriptors according to particle length differed, depending on the cluster. The lower the magnitude, the higher the homogeneity in particle shapes (observed in Figure 6, and measured, through the relative spans of shape descriptors, in Table 5). Consequently, composted pine bark (cluster 3) can be described as the most homogenous material in terms of particle shape, in contrast with the other clusters, where higher diversity in shapes according to the particle size were observed. For clusters 1 and 4, high diversity in particle shape only concerned the finest <1.5 and 2.5 mm fractions, respectively, whereas similar shapes were observed for higher particle sizes. In contrast, the decrease (i.e., the changes) in shapes for cluster 2 was continuously observed according to the increasing particle length.
4. Discussion
4.1. Relevance of Shape Descriptors for Characterizing Growing Media Constituents
In addition to diameters describing particle size (Figure 2), five shape descriptors were studied in order to analyze particle shapes of growing media constituents as precisely and accurately as possible, and then to define the most relevant descriptors to be considered. Although multiple correlations were found between shape descriptors (Figure 4, Table 4), some limits and constraints should be considered regarding the relevance of using one or another shape descriptor to avoid misinterpretations in the particle shape analysis. Points for discussion are as follows:
- Both aspect ratio (Equation (1)) and elongation (Equation (2)) describe the width/length ratio. However, elongation calculated from Equation (2) assumes that the particle width is equal to its surface divided by its length, which is only true for elongated-rectangular shaped particles (e.g., fibers). For non-elongated particles, the particle length (LeFi) is overestimated, and consequently, the width/length ratio underestimated. In contrast, the aspect ratio is most appropriate for non-curved particles. Indeed, for curved particles, FeretMIN overestimates the particle width, and FeretMAX minimizes its length, resulting in an overestimation of the width/length ratio.
- Convexity is a relevant shape descriptor for non-curved particles, where concave areas are clearly defined (cf. area B on Figure 2). Indeed, for curved particles such as fibers, concave regions correspond to the inner area between the extremities of curved particles, thus resulting in underestimating the convexity.
- Although circularity is not based on particle length and width, but on particle area and perimeter, it is highly related to the width/length ratio of particles. The perimeter of a particle increases while its width/length ratio decreases for a given area. Moreover, circularity is also related to the convexity of a particle. Indeed, the more a particle has concavities, the more its perimeter increases compared to its area, which is reflected by the circularity. In contrast with previously mentioned shape descriptors, circularity is then adapted for all particle shapes, and could be considered as a strong indicator to differentiate materials.
- Roundness calculation also considers particle length, but is not influenced by the width/length ratio of particles, in terms of either its perimeter or area, nor its curvature. As observed, this shape descriptor was the less correlated with the others.
From these previous comments, circularity and roundness could be considered as the most relevant shape descriptors for the encountered diversity of growing media particle shapes.
Mean values and relative spans of shape descriptors were calculated according to the literature [17,36,38] to compare our materials. However, both values do not accurately describe particle shape distribution. An adapted shape classification previously given by the chart of Blott and Pye [21] was used to better reflect the particle distribution (Table 3).
4.2. Relevance of Growing Media Classification According to Particle Size and Shape
In addition to high correlations observed and already discussed between particle shape descriptors, relationships between particle shape and size descriptors were also shown. In general, the greater the particle length, the less the width/length ratio, circularity, convexity, and roundness. This interpretation, obtained from a large diversity of growing media constituents, agreed those already reported by Gil et al. [29] on milled poplar and corn stover, and by Guo et al. [30] on ground pine, beanstalk, rice straw, and reed.
Four clusters were defined from hierarchical cluster analysis. The first three of these (clusters 1, 2, 3) were mainly discriminated by their particle shapes rather than their sizes, as observed in the PCA correlation circle (Figure 4). The fourth was separated from the others by its particle length (mean length and, even more, span length) and its span roundness, due to the heterogeneity of these materials (coir medium) resulting from a mix of coir pith and fibers.
This classification is the first to consider both particle size and length. However, its robustness should be viewed with caution, although it was built from a large and diverse panel of 22 raw materials used as growing media constituents. Its main limit is a technical one, and based on the maximum particle width of <20 mm that can be analyzed by the QicPic device. Thus, coarser materials such as some coarse barks, sod peats, and coir chips cannot be analyzed and, thus, cannot be considered in such classification. It is likely that coarser particles would influence the HCA and then the definition of clusters, with a higher weight of particle size in comparison with particle shape. However, since most of growing media constituents do not exceed 20 mm, this classification into 4 clusters remains relevant.
4.3. Two-Dimensional Analysis
Comparing the particle size distribution obtained by sieving and image analysis has already shown that a projected area-weighted distribution places more importance on small particles than larger ones, in contrast to the mass-weighting used in sieving [17,20,39]. Volume weighting is possible using some DIA tools (including QicPic) and it would be preferable to have a better comparison with sieving. However, the transition from two-dimensional images to a three-dimensional modeled object implies a loss of information quality. Indeed, the image analysis tools require a parameterization that consists of choosing a single volume model (sphere, ellipse, or cylinder) for the whole measurement. However, as shown in this paper, the particles of a material are very diversified and do not necessarily have a morphology adapted to the volume models proposed. Therefore, the three-dimensional modeling of particles would induce a poor estimation of the real weight of the particles in the distribution. Although two dimensions do not reflect the complete shape of the particle, this way of representing a sample allows more accuracy.
5. Conclusions
From four shape descriptors (aspect ratio, circularity, roundness, and convexity) and the introduction of an adapted classification used to describe them, the diversity in particle shape for a wide panel of growing media constituents was detailed through the use of DIA.
High correlations were found between particle shapes, and between particle shape and length, and with particle length, so that the greater the particle length, the lower the values of width/length ratio, circularity, roundness, and convexity. Overall, circularity, roundness, particle length, and particle span (i.e., particle length diversity) seemed to provide the most useful variables to describe particle morphology.
Moreover, four types of growing media constituents were defined from hierarchical cluster analysis, combining particle shape and size. The first three of these were mainly arranged according to the increasing mean values of all shape descriptors (i.e., less and less elongated, as well as more and more circular, round, and convex particles) as follows:
- (1)
- Fine and coarse wood and coir fibers;
- (2)
- Sphagnum white peats, regardless of their particle sizes (fine and medium) and extraction processes (milled and sod);
- (3)
- Black peats, sedge peat, coir fine, fresh and composted pine bark, green waste compost, and fine perlite.
The coir medium representing cluster 4 was characterized by a particle shape similar to that of clusters 2 and 3, but more specifically by very high diversity in particle length, resulting from a mixture between coir pith and fibers.
Through the use of DIA, this work made an improvement to the qualification and quantification of particle morphology not previously reported for growing media constituents. This knowledge provides a more extensive characterization of the materials, which will enable a more refined evaluation of the relationship between particle morphology and physical properties. As relevant relationships will be discovered, growing media manufacturers will have better information to design the raw materials and blends.
Author Contributions
Conceptualization, J.-C.M., W.C.F. and S.D.; Methodology, S.D.; Software, S.D.; Validation, J.-C.M., W.C.F. and B.E.J.; Formal Analysis, S.D.; Investigation, S.D.; Resources, J.-C.M.; Data Curation, S.D.; Writing—Original Draft Preparation, S.D.; Writing—Review and Editing, S.D., J.-C.M. and W.C.F.; Visualization, S.D. and J.-C.M.; Supervision, J.-C.M. and W.C.F.; Project Administration, J.-C.M., W.C.F. and B.E.J.; Funding Acquisition, J.-C.M. All authors have read and agreed to the published version of the manuscript.
Funding
This research was funded by the companies EVADEA, Floragard, Klasmann-Deilmann, Premier Tech Horticulture, TurfTech Ltd., and by the regional programme “Objectif Végétal, Research, Education and Innovation in Pays de la Loire”, supported by the French Region Pays de la Loire, Angers Loire Métropole and the European Regional Development Fund.
Institutional Review Board Statement
Not applicable.
Informed Consent Statement
Not applicable.
Data Availability Statement
The data that support the findings of this study are available on request from the corresponding author.
Acknowledgments
The authors would like to thank the company partners, EVADEA, Floragard, Klasmann-Deilmann, Premier Tech Horticulture and TurfTech Ltd., for providing the materials. We also thank the France-USA Fulbright program to support this work and the collaboration between the Horticultural Substrate Lab of the North Carolina State University (USA) and the EPHOR research unit of L’Institut Agro Rennes-Angers (France).
Conflicts of Interest
The authors declare no conflict of interest.
References
- Blok, C.; Eveleens, B.; Van Winkel, A. Growing media for food and quality of life in the period 2020–2050. Acta Hortic. 2021, 1305, 341–356. [Google Scholar] [CrossRef]
- Caron, J.; Michel, J.-C. Understanding and optimizing the physical properties of growing media for soilless cultivation. In Advances in Horticultural Soilless Culture, 1st ed.; Gruda, N., Ed.; Burleigh Dodds Science Publishing: Cambridge, UK, 2021; pp. 107–138. [Google Scholar]
- Paquet, J.M.; Caron, J.; Banton, O. In situ determination of the water desorption characteristics of peat substrates. Can. J. Soil Sci. 1993, 73, 329–339. [Google Scholar] [CrossRef]
- Heiskanen, J.; Tervo, L.; Heinonen, J. Effects of mechanical container-filling methods on texture and water retention of peat growth media. Scand. J. For. Res. 1996, 11, 351–355. [Google Scholar] [CrossRef]
- Gruda, N.; Schnitzler, W.H. Suitability of wood fiber substrates for production of vegetable transplants II: The effect of wood fiber substrates and their volume weights on the growth of tomato transplants. Sci. Hortic. 2004, 100, 333–340. [Google Scholar] [CrossRef]
- Bilderback, T.E.; Fonteno, W.C. Effects of container geometry and media physical properties on air and water volumes in containers. J. Environ. Hortic. 2004, 5, 180–182. [Google Scholar] [CrossRef]
- Raviv, M.; Wallach, R.; Silber, A.; Bar-Tal, A. Substrates and their analysis. In Hydroponic Production of Vegetables and Ornamentals, 1st ed.; Savvas, D., Passam, H., Eds.; Embryo Publication: Athens, Greece, 2002; pp. 25–102. [Google Scholar]
- Owen, J.S.; Altland, J.E. Container Height and Douglas Fir Bark Texture Affect Substrate Physical Properties. HortScience 2008, 43, 505–508. [Google Scholar] [CrossRef]
- Michel, J.-C.; Kerloch, E. Evolution of hydraulic properties and wettability of organic growing media during cultivation according to irrigation strategies. Sci. Hortic. 2017, 217, 28–35. [Google Scholar] [CrossRef]
- Michel, J.-C. Relevant hydraulic properties of peat-based mixes for explaining root development according to irrigation strategies. Acta Hortic. 2019, 1266, 353–360. [Google Scholar] [CrossRef]
- Bunt, A.C. Physical properties of mixtures of peats and minerals of different particle size and bulk density for potting substrate. Acta Hortic. 1983, 150, 143–145. [Google Scholar] [CrossRef]
- Handreck, K.A. Particle size and the physical properties of growing media for containers. Commun. Soil Sci. Plant Anal. 1983, 14, 209–222. [Google Scholar] [CrossRef]
- Caron, J.; Rivière, L.-M.; Guillemain, G. Gas diffusion and air-filled porosity: Effect of some oversize fragments in growing media. Can. J. Soil Sci. 2005, 85, 57–65. [Google Scholar] [CrossRef]
- Fields, J.S.; Owen, J.S.; Scoggins, H.L. Exploring the Influence of Particle Size on Plant Water Availability in Pine Bark Substrates. In Proceedings of the 60th SNA Research Conference, McMinnville, TN, USA, October 2015; pp. 19–27. [Google Scholar]
- Nguyen, V.T.H.; Kraska, T.; Winkler, W.; Aydinlik, S.; Jackson, B.E.; Pude, R. Primary Mechanical Modification to Improve Performance of Miscanthus as Stand-Alone Growing Substrates. Agronomy 2022, 12, 420. [Google Scholar] [CrossRef]
- Bartley, P.C.; Fonteno, W.C.; Jackson, B.E. A Review and Analysis of Horticultural Substrate Characterization by Sieve Analysis. HortScience 2022, 57, 715–725. [Google Scholar] [CrossRef]
- Bartley, P.C. Multidimensional Characterization of Horticultural Substrates. Doctoral Dissertation, North Carolina State University, Raleigh, NC, USA, 2019. [Google Scholar]
- Durand, S.; Jackson, B.E.; Bartley, P.C.; Fonteno, W.C.; Michel, J.-C. New tools for particle shape analysis of substrate components: Initial results and future prospects. Acta Hortic. 2021, 1317, 335–342. [Google Scholar] [CrossRef]
- Trubetskaya, A.; Beckmann, G.; Wadenbäck, J.; Holm, J.K.; Velaga, S.P.; Weber, R. One way of representing the size and shape of biomass particles in combustion modeling. Fuel 2017, 206, 675–683. [Google Scholar] [CrossRef]
- Durand, S.; Jackson, B.E.; Fonteno, W.C.; Michel, J.-C. Particle size distribution of growing media constituents using dynamic image analysis: Parametrization and comparison to sieving. Soil Sci. Soc. Am. J. 2023. [Google Scholar] [CrossRef]
- Blott, S.J.; Pye, K. Particle shape: A review and new methods of characterization and classification. Sedimentology 2008, 55, 31–63. [Google Scholar] [CrossRef]
- Lim, M.S.; Wijeyesekera, D.; Zainorabidin, A.; Bakar, I. The Effects of Particle Morphology (Shape and Sizes) Characteristics on its Engineering Behaviour and Sustainable Engineering Performance of Sand. Int. J. Integr. Eng. 2012, 4, 27–37. [Google Scholar]
- Wu, Y.; Cui, J.; Huang, J.; Zhang, W.; Yoshimoto, N.; Wen, L. Correlation of Critical State Strength Properties with Particle Shape and Surface Fractal Dimension of Clinker Ash. Int. J. Geomech. 2021, 21, 04021071. [Google Scholar] [CrossRef]
- Ulusoy, U. A Review of Particle Shape Effects on Material Properties for Various Engineering Applications: From Macro to Nanoscale. Minerals 2023, 13, 91. [Google Scholar] [CrossRef]
- Puri, V.M.; Mancino, C.F. Importance of Particle Shape and Size on Rootzone Sands’ Bulk Mechanical Behavior. USGA Turfgrass Environ. Res. 2002, 1, 1–9. [Google Scholar]
- Miller, N.; Henderson, J. Correlating Particle Shape Parameters to Bulk Properties and Load Stress at Two Water Contents. Agron. J. 2011, 103, 1514–1523. [Google Scholar] [CrossRef]
- Yi, H.; Mittal, B.; Puri, V.M.; Li, F.; Mancino, C.F. Measurement of Bulk Mechanical Properties and Modeling the Load-Response of Rootzone Sands. Part 1: Round and Angular Monosize and Binary Mixtures. Part. Sci. Technol. 2001, 19, 145–173. [Google Scholar] [CrossRef]
- Liu, Z.; Dugan, B.; Masiello, C.A.; Gonnermann, H.M. Biochar particle size, shape, and porosity act together to influence soil water properties. PLoS ONE 2017, 12, e0179079. [Google Scholar] [CrossRef]
- Gil, M.; Teruel, E.; Arauzo, I. Analysis of standard sieving method for milled biomass through image processing. Effects of particle shape and size for poplar and corn stover. Fuel 2014, 116, 328–340. [Google Scholar] [CrossRef]
- Guo, Q.; Chen, X.; Liu, H. Experimental research on shape and size distribution of biomass particle. Fuel 2012, 94, 551–555. [Google Scholar] [CrossRef]
- Schmilewski, G. Growing media constituents used in the EU in 2013. Acta Hortic. 2017, 1168, 85–92. [Google Scholar] [CrossRef]
- Afnor, NF EN 13041; Soil Improvers and Growing Media—Determination of Physical Properties—Dry Bulk Density, Air Volume, Water Volume, Shrinkage Value and Total Pore Space. European Standard: Plzeň, Czech Republic, 2000.
- Wadell, H. Sphericity and roundness of rock particles. J. Geol. 1933, 41, 310–331. [Google Scholar] [CrossRef]
- Wadell, H. Volume, Shape, and Roundness of Rock Particles. J. Geol. 1932, 40, 443–451. [Google Scholar] [CrossRef]
- Igathinathane, C.; Pordesimo, L.O.; Columbus, E.P.; Batchelor, W.D.; Sokhansanj, S. Sieveless particle size distribution analysis of particulate materials through computer vision. Comput. Electron. Agric. 2009, 66, 147–158. [Google Scholar] [CrossRef]
- Bitra, V.S.P.; Womac, A.R.; Yang, Y.T.; Igathinathane, C.; Miu, P.I.; Chevanan, N.; Sokhansanj, S. Knife mill operating factors effect on switchgrass particle size distributions. Bioresour. Technol. 2009, 100, 5176–5188. [Google Scholar] [CrossRef]
- Vaissie, P.; Monge, A.; Husson, F. Factoshiny: Perform Factorial Analysis from ‘FactoMineR’ with a Shiny. Package to perform statistical analysis on R software. 2021. Available online: https://cran.r-project.org/web/packages/Factoshiny/ (accessed on 23 December 2022).
- Blott, S.J.; Pye, K. GRADISTAT: A grain size distribution and statistics package for the analysis of unconsolidated sediments. Earth Surf. Process. Landf. 2001, 26, 1237–1248. [Google Scholar] [CrossRef]
- Li, L.; Iskander, M. Evaluation of Dynamic Image Analysis for Characterizing Granular Soils. Geotech. Test. J. 2020, 43, 1149–1173. [Google Scholar] [CrossRef]
Figure 1.
Raw materials studied (with identification number (#ID) referenced in Table 1).
Figure 1.
Raw materials studied (with identification number (#ID) referenced in Table 1).
Figure 2.
Schematic representation of particle size and shape assessment (Equations (1) to (5)) derived from the calculation of diameters (FeretMIN, ChordMIN, FeretMAX, DiFi [diameter of fiber], LeFi [length of fiber], DCC), area, and perimeter assessed by dynamic image analysis.
Figure 2.
Schematic representation of particle size and shape assessment (Equations (1) to (5)) derived from the calculation of diameters (FeretMIN, ChordMIN, FeretMAX, DiFi [diameter of fiber], LeFi [length of fiber], DCC), area, and perimeter assessed by dynamic image analysis.

Figure 3.
Examples of particles of different materials (Wood fiber medium #3, Irish white peat #5, Composted pine bark ‘fine’ #18, and Coir #22) measured with QicPic and associated morphological descriptor values.
Figure 3.
Examples of particles of different materials (Wood fiber medium #3, Irish white peat #5, Composted pine bark ‘fine’ #18, and Coir #22) measured with QicPic and associated morphological descriptor values.
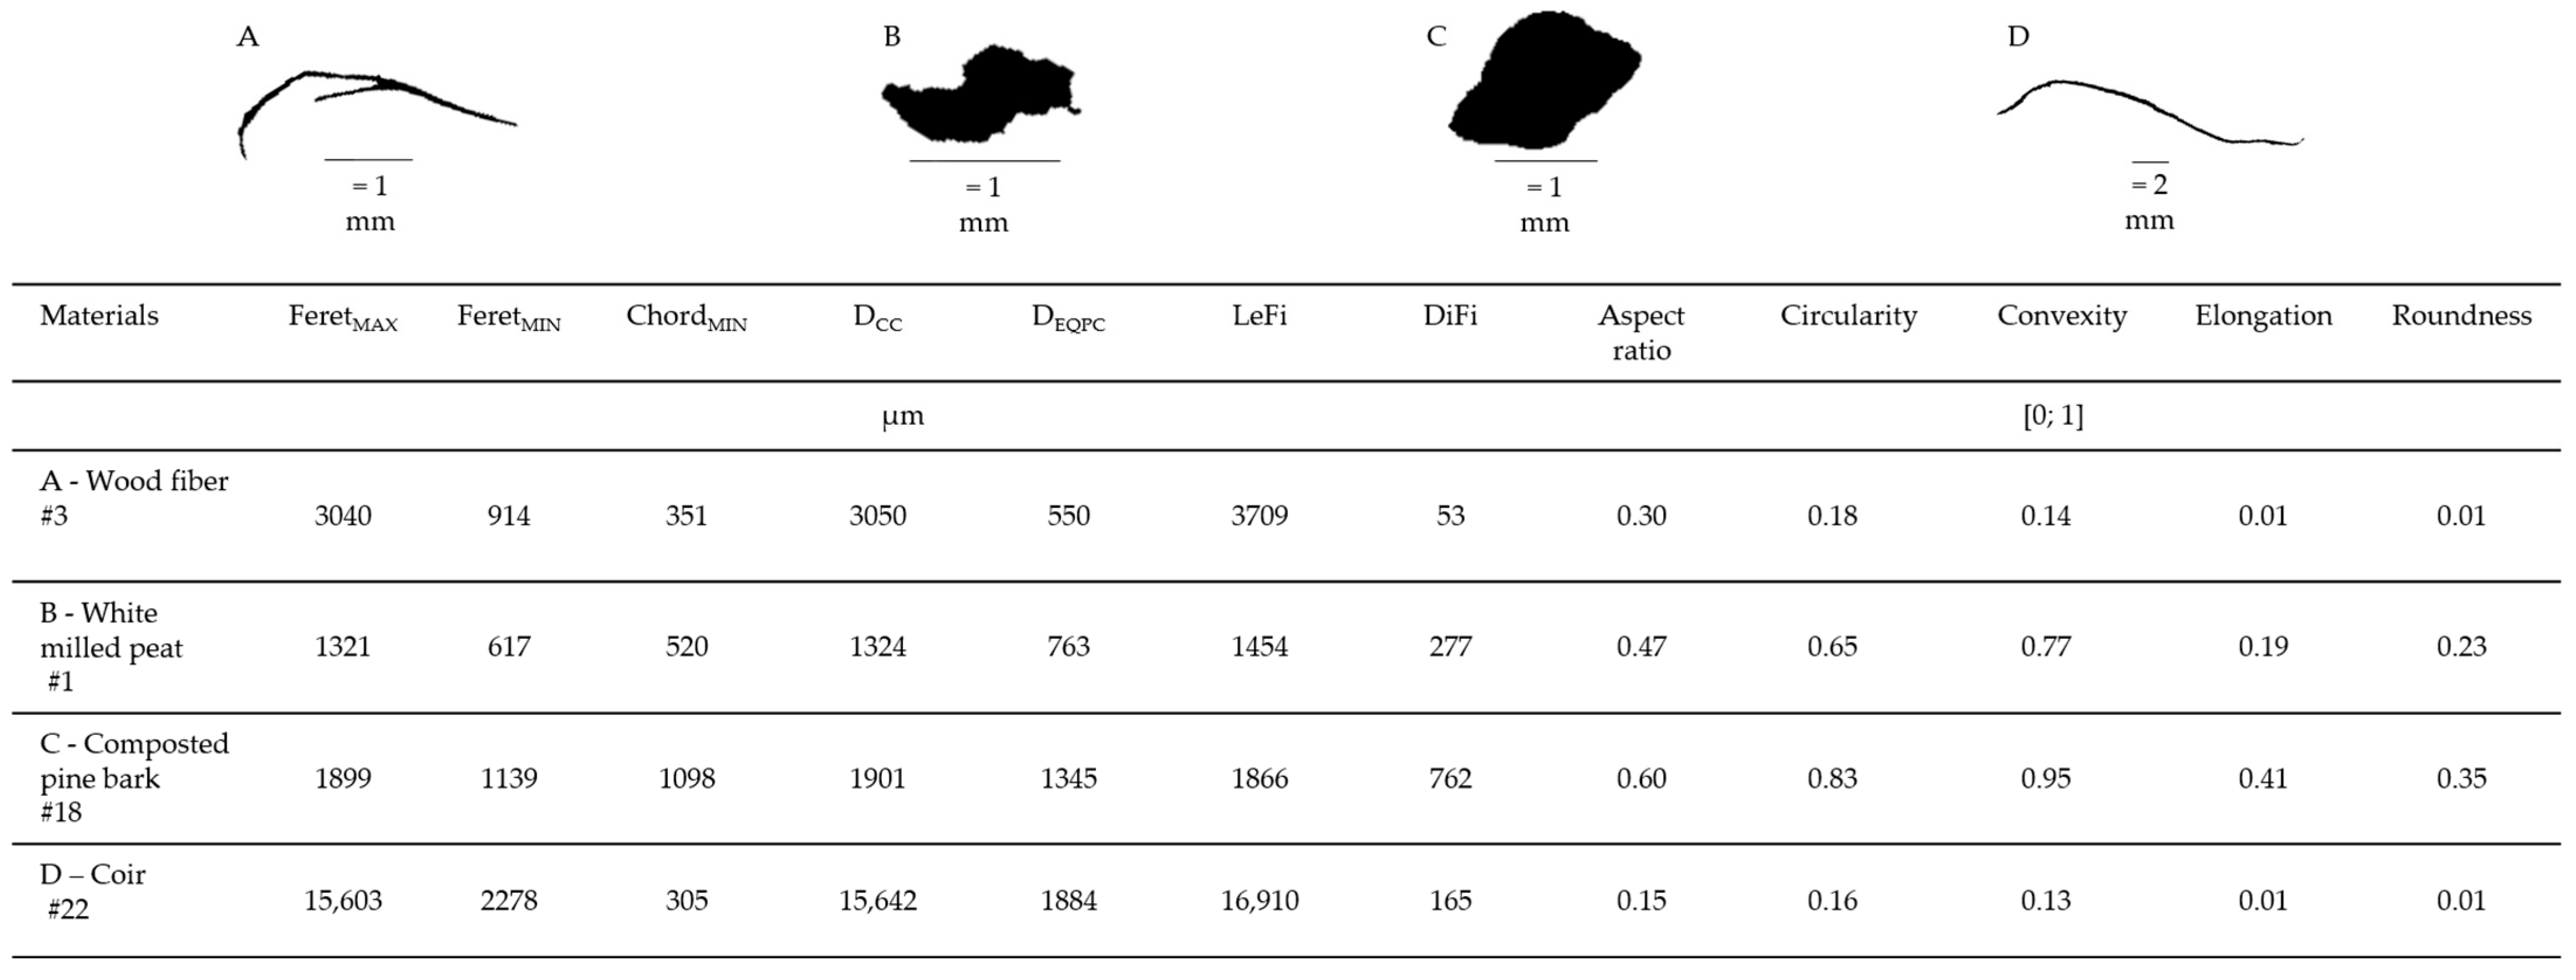
Figure 4.
PCA correlation circle for variables describing particle size, shape, and diversity.
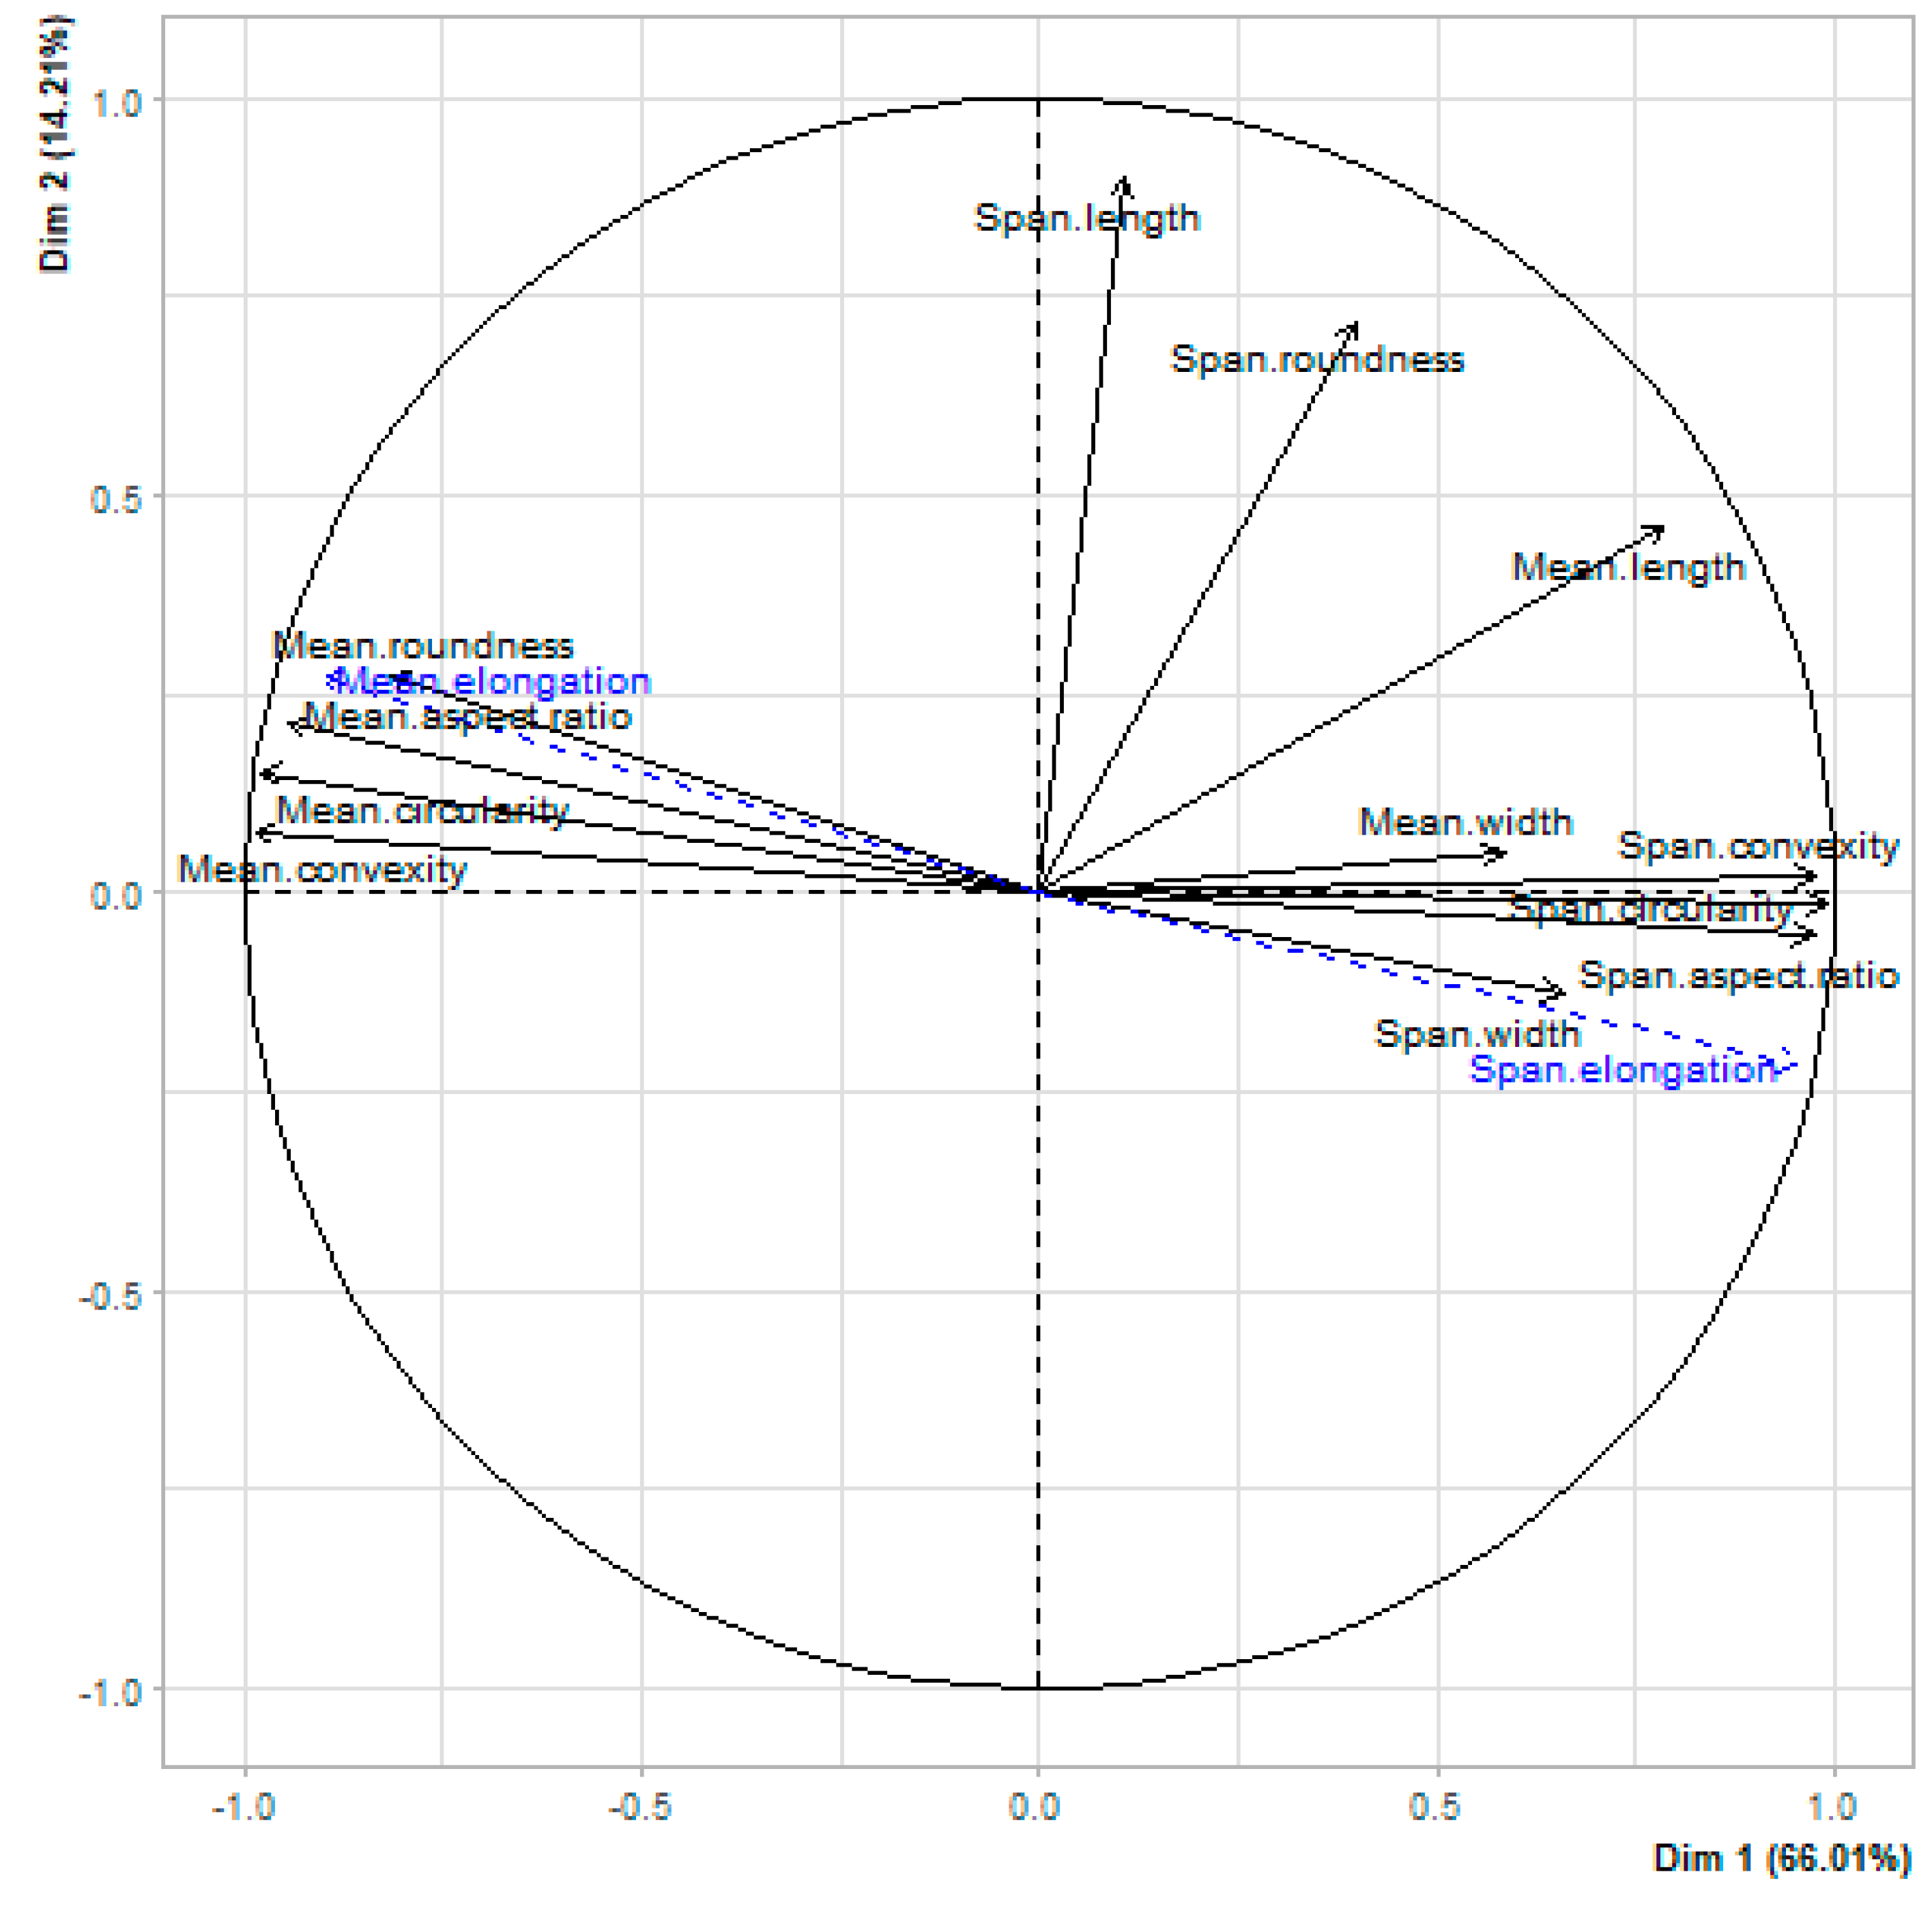
Figure 5.
Identification of four clusters by HCA obtained from the PCA individuals (numbers correspond to the ID number given for all growing media constituents listed in Table 1).
Figure 5.
Identification of four clusters by HCA obtained from the PCA individuals (numbers correspond to the ID number given for all growing media constituents listed in Table 1).
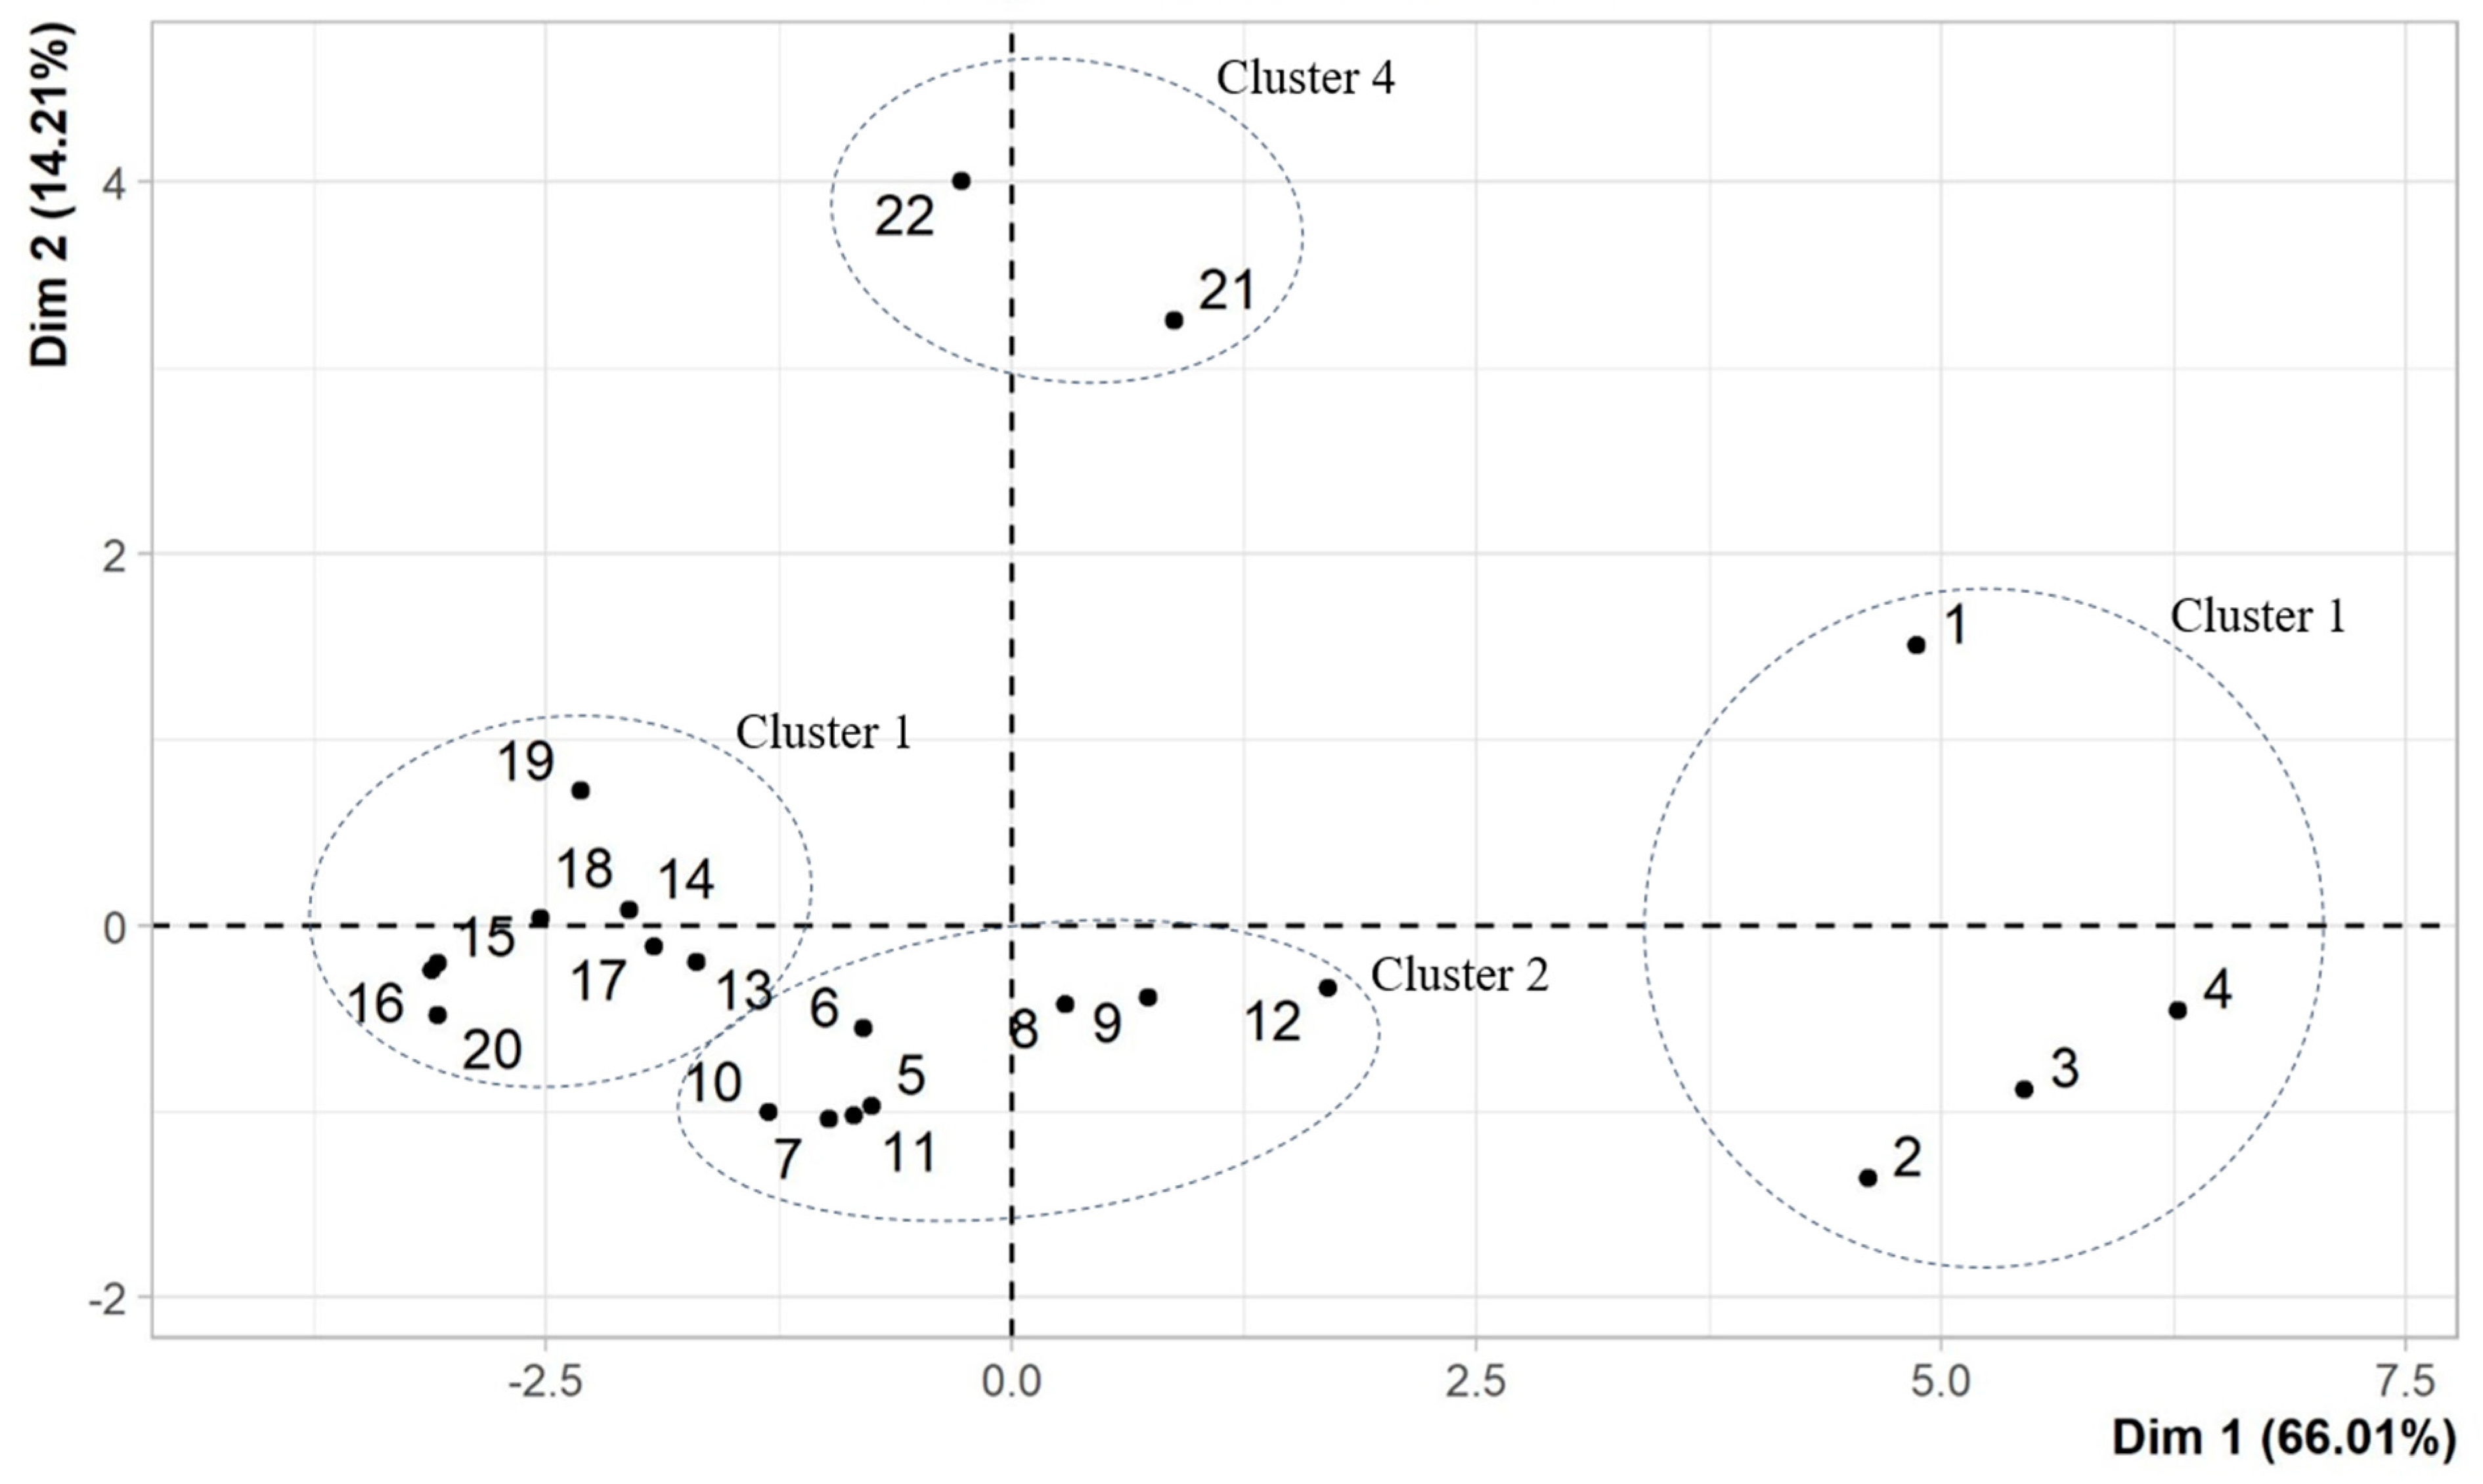
Figure 6.
Particle shapes according to their length (FeretMAX, in µm) for (a) Wood fiber medium #3, (b) Irish white peat #5, (c) Composted pine bark ‘fine’ #18, and (d) Coir #22.
Figure 6.
Particle shapes according to their length (FeretMAX, in µm) for (a) Wood fiber medium #3, (b) Irish white peat #5, (c) Composted pine bark ‘fine’ #18, and (d) Coir #22.


Table 1.
Growing media components studied.
| #ID Number | Materials | Supplier 1 | Origin | Extraction/Process | Bulk Density 2 | Indicated Particle Size Range 3 |
|---|---|---|---|---|---|---|
| g cm−3 | mm | |||||
| #1 | Coir fiber | PTH | Ivory Coast | Grounded, sieved | 0.07 | 5–25 |
| #2 | Wood fiber (fine) | KD | Germany | Defibrated | 0.08 | 0–2 |
| #3 | Wood fiber (medium) | KD | Germany | Defibrated | 0.09 | 2–4 |
| #4 | Wood fiber (medium) | FLO | Germany | Defibrated | 0.09 | N/A |
| #5 | White peat (fine), H5 4 | PTH | Ireland | Milled, screened | 0.10 | 0–5 |
| #6 | White peat (fine), H1–H3 | PTH | Canada | Milled, screened | 0.11 | N/A |
| #7 | White peat (fine), H2–H6 | KD | Lithuania | Milled | 0.10 | 0–7 |
| #8 | White peat (fine), H2–H5 | FLO | Latvia | Milled | 0.10 | 0–5 |
| #9 | White peat (fine), H2–H5 | FLO | Germany | Sod | 0.08 | 0–7 |
| #10 | White peat (fine), H2–H5 | KD | Lithuania | Sod | 0.11 | 0–7 |
| #11 | White peat (medium), H2–H6 | KD | Lithuania | Milled | 0.11 | 0–25 |
| #12 | White peat (medium), H2–H5 | FLO | Latvia | Milled | 0.10 | 5–20 |
| #13 | Black peat, H6–H8 | KD | Lithuania | Frozen, milled, sieved | 0.17 | 0–5 |
| #14 | Black peat, H5–H8 | FLO | Germany | Frozen | 0.18 | 0–7 |
| #15 | Sedge peat | ETF | France | Excavated | 0.24 | 0–10 |
| #16 | Coir pith | PTH | Sri Lanka | Grounded, sieved | 0.08 | 0–5 |
| #17 | Fresh pine bark (fine) | PTH | France | Screened | 0.22 | 0–5 |
| #18 | Composted pine bark (fine) | PTH | France | Screened | 0.25 | 0–5 |
| #19 | Green waste compost | KD | Germany | 0.50 | 0–5 | |
| #20 | Perlite (fine) | KD | Germany | 0.06 | 0.6–2.5 | |
| #21 | Coir (medium) | PTH | Ivory Coast | Grounded | 0.08 | 0–25 |
| #22 | Coir (medium) | ETB | Sri Lanka | N/A | 0.05 | 5–25 |
1: ETB = EVADEA Tourbières de France, FLO = Floragard Vertiebs-GmbH, KD = Klasmann-Deilmann, PTH = Premier Tech Horticulture France. 2: Bulk density measured through EN 13041 procedure [32]. 3: Particle size distribution range given by the supplier. 4: Von Post degree of humification of Sphagnum peats. N/A = Not Available.
Table 2.
Classification used for shape descriptors and illustrations.
| Shape Descriptor | Classes |
|---|---|
| Aspect ratio | 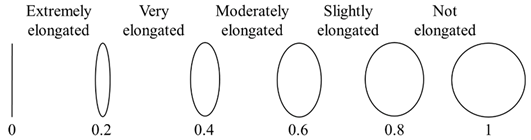 |
| Elongation |  |
| Circularity | 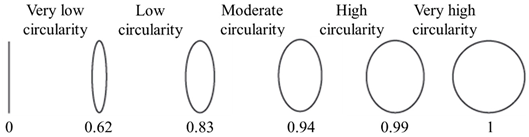 |
| Roundness | 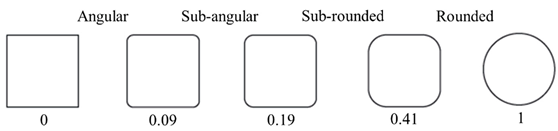 |
| Convexity | 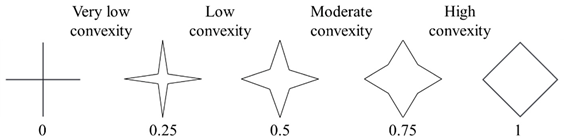 |
Table 3.
Particle shape distribution by classes, assessed from the classification proposed for shape descriptors in Table 2.
Table 3.
Particle shape distribution by classes, assessed from the classification proposed for shape descriptors in Table 2.
| Aspect Ratio | Circularity | Roundness | Convexity | |||||||||||||||
|---|---|---|---|---|---|---|---|---|---|---|---|---|---|---|---|---|---|---|
| Extre-mely | Very | Mode-rately | Slightly | Not | Very Low | Low | ModE-Rate | High | Very High | Angular | Sub-Angular | Sub-Rounded | Rounded | Very Low | Low | ModE-Rate | High | |
| #ID | Elongated | |||||||||||||||||
| #1 | 24 2 | 17 | 23 | 29 | 8 | 44 | 32 | 22 | 2 | 0 | 48 | 21 | 22 | 9 | 9 | 14 | 15 | 62 |
| #2 | 12 | 34 | 30 | 21 | 3 | 59 | 26 | 13 | 2 | 0 | 61 | 28 | 9 | 2 | 3 | 18 | 36 | 44 |
| #3 | 15 | 32 | 28 | 22 | 4 | 58 | 20 | 19 | 4 | 0 | 66 | 26 | 7 | 2 | 5 | 19 | 32 | 44 |
| #4 | 14 | 37 | 28 | 19 | 4 | 60 | 22 | 15 | 3 | 0 | 66 | 25 | 7 | 2 | 4 | 17 | 33 | 46 |
| #5 | 2 | 22 | 37 | 33 | 7 | 19 | 52 | 26 | 3 | 0 | 26 | 32 | 32 | 9 | 0 | 2 | 16 | 82 |
| #6 | 2 | 20 | 35 | 36 | 7 | 18 | 46 | 33 | 4 | 0 | 36 | 34 | 22 | 8 | 0 | 2 | 16 | 82 |
| #7 | 2 | 18 | 33 | 39 | 8 | 17 | 44 | 36 | 4 | 0 | 36 | 40 | 19 | 6 | 0 | 2 | 16 | 82 |
| #8 | 2 | 19 | 35 | 35 | 8 | 26 | 47 | 24 | 3 | 0 | 31 | 34 | 26 | 9 | 0 | 3 | 21 | 76 |
| #9 | 6 | 26 | 33 | 29 | 6 | 28 | 43 | 27 | 3 | 0 | 44 | 32 | 18 | 6 | 1 | 5 | 19 | 74 |
| #10 | 1 | 15 | 31 | 43 | 10 | 15 | 39 | 41 | 5 | 0 | 35 | 42 | 17 | 6 | 0 | 2 | 15 | 83 |
| #11 | 2 | 18 | 34 | 39 | 8 | 17 | 43 | 35 | 4 | 0 | 35 | 40 | 19 | 6 | 0 | 2 | 16 | 82 |
| #12 | 5 | 19 | 33 | 35 | 9 | 35 | 35 | 25 | 6 | 0 | 35 | 38 | 21 | 5 | 2 | 5 | 24 | 70 |
| #13 | 1 | 12 | 30 | 46 | 11 | 11 | 37 | 46 | 7 | 0 | 29 | 36 | 24 | 11 | 0 | 2 | 11 | 87 |
| #14 | 1 | 10 | 28 | 47 | 14 | 10 | 37 | 48 | 5 | 0 | 22 | 28 | 29 | 21 | 0 | 2 | 9 | 89 |
| #15 | 0 | 3 | 29 | 55 | 12 | 2 | 17 | 67 | 13 | 0 | 17 | 45 | 25 | 13 | 0 | 0 | 4 | 96 |
| #16 | 1 | 4 | 26 | 52 | 16 | 4 | 42 | 51 | 3 | 0 | 16 | 23 | 37 | 25 | 1 | 1 | 3 | 96 |
| #17 | 1 | 12 | 30 | 45 | 12 | 8 | 45 | 43 | 4 | 0 | 18 | 32 | 34 | 16 | 0 | 0 | 5 | 95 |
| #18 | 1 | 9 | 28 | 49 | 14 | 4 | 36 | 53 | 7 | 0 | 17 | 36 | 31 | 16 | 0 | 0 | 3 | 97 |
| #19 | 1 | 6 | 24 | 53 | 16 | 7 | 22 | 61 | 10 | 0 | 23 | 38 | 24 | 16 | 0 | 2 | 5 | 93 |
| #20 | 0 | 2 | 27 | 55 | 16 | 1 | 41 | 52 | 6 | 0 | 6 | 26 | 48 | 20 | 0 | 0 | 3 | 97 |
| #21 | 12 | 8 | 22 | 45 | 13 | 20 | 27 | 50 | 4 | 0 | 40 | 27 | 19 | 14 | 4 | 6 | 8 | 82 |
| #22 | 4 | 8 | 26 | 49 | 13 | 12 | 29 | 53 | 6 | 0 | 30 | 29 | 25 | 16 | 4 | 3 | 5 | 87 |
| Mean | 5.0 | 16.0 | 29.5 | 39.8 | 10.0 | 21.6 | 35.5 | 38.2 | 4.9 | 0.0 | 33.5 | 32.4 | 23.4 | 10.8 | 1.5 | 4.9 | 14.3 | 79.4 |
| SD 1 | 6.4 | 9.9 | 4.1 | 11.0 | 4.0 | 18.5 | 9.9 | 15.4 | 2.6 | 0.0 | 16.1 | 6.5 | 9.7 | 6.5 | 2.4 | 6.1 | 10.1 | 16.8 |
1: SD = standard deviation. 2: Standard deviation for each shape class measured on three replicates never exceeds 5%.
Table 4.
Correlation matrix between arithmetic means of particle shape and size descriptors for the 22 growing media constituents studied.
Table 4.
Correlation matrix between arithmetic means of particle shape and size descriptors for the 22 growing media constituents studied.
| Elongation | Aspect Ratio | Roundness | Circularity | Convexity | Width | Length | |
|---|---|---|---|---|---|---|---|
| Elongation | 1 | ||||||
| Aspect ratio | 0.95 *** | 1 | |||||
| Roundness | 0.77 *** | 0.88 *** | 1 | ||||
| Circularity | 0.97 *** | 0.97 *** | 0.82 *** | 1 | |||
| Convexity | 0.92 *** | 0.96 *** | 0.86 *** | 0.98 *** | 1 | ||
| Width | −0.56 ** | −0.42 | −0,14 | −0.57 ** | −0.48 * | 1 | |
| Length | −0.60 ** | −0.60 ** | −0.36 | −0.70 *** | −0.70 *** | 0.75 *** | 1 |
Significance of the linear correlation, *** p-value < 0.001, ** p-value < 0.01, * p-value < 0.05.
Table 5.
Mean and relative span of shape and size descriptors for the 22 tested materials, and identification of clusters from hierarchical cluster analysis.
Table 5.
Mean and relative span of shape and size descriptors for the 22 tested materials, and identification of clusters from hierarchical cluster analysis.
| Cluster | #ID 1 Material | Aspect Ratio | Circularity | Convexity | Roundness | Width (mm) | Length (mm) |
|---|---|---|---|---|---|---|---|
| Mean [Relative Span] | |||||||
| 1 | #1 Coir fiber | 0.46 2 [1.3] | 0.60 [0.9] | 0.71 [0.8] | 0.16 [3.8] | 0.62 3 [3.8] | 3.85 [5.2] |
| #2 Wood fiber (fine) | 0.43 [1.3] | 0.57 [1.1] | 0.68 [0.7] | 0.10 [2.4] | 0.48 [5.8] | 1.71 [4.3] | |
| #3 Wood fiber (medium) | 0.44 [1.3] | 0.58 [1.1] | 0.67 [0.9] | 0.09 [2.8] | 0.47 [9.2] | 1.86 [5.6] | |
| #4 Wood fiber (medium) | 0.42 [1.3] | 0.57 [1.1] | 0.68 [0.7] | 0.09 [2.7] | 0.82 [10.3] | 2.96 [7.3] | |
| Cluster 1 value range | 0.42–0.46 [1.3] | 0.57–0.60 [0.9–1.1] | 0.67–0.71 [0.7–0.9] | 0.09–0.16 [2.4–3.8] | 0.47–0.82 [3.8–10.3] | 1.71–3.85 [4.3–7.3] | |
| 2 | #5 White peat, H5 | 0.54 [0.8] | 0.74 [0.5] | 0.83 [0.3] | 0.20 [2.2] | 0.35 [2.7] | 0.81 [2.5] |
| #6 White peat, H1–H3 | 0.55 [0.8] | 0.76 [0.5] | 0.83 [0.3] | 0.17 [2.7] | 0.23 [2.6] | 0.60 [3.0] | |
| #7 White peat (fine), H2–H6 | 0.57 [0.8] | 0.76 [0.5] | 0.82 [0.3] | 0.15 [2.3] | 0.20 [2.4] | 0.52 [3.1] | |
| #8 White peat (fine), H2–H5 | 0.55 [0.9] | 0.71 [0.5] | 0.81 [0.3] | 0.18 [2.5] | 0.48 [4.2] | 1.21 [4.9] | |
| #9 White peat (fine), H2–H5 | 0.50 [1.0] | 0.71 [0.6] | 0.79 [0.4] | 0.15 [3.0] | 0.25 [2.9] | 0.82 [4.2] | |
| #10 White peat (fine), H2–H5 | 0.59 [0.8] | 0.78 [0.4] | 0.83 [0.3] | 0.15 [2.2] | 0.20 [2.7] | 0.49 [3.6] | |
| #11 White peat (medium), H2–H6 | 0.56 [0.8] | 0.76 [0.5] | 0.82 [0.3] | 0.15 [2.3] | 0.23 [2.7] | 0.56 [3.4] | |
| #12 White peat (medium), H2–H5 | 0.55 [0.9] | 0.69 [0.7] | 0.78 [0.4] | 0.16 [2.2] | 0.68 [6.4] | 1.89 [7.1] | |
| Cluster 2 value range | 0.50–0.59 [0.8–1.0] | 0.69–0.78 [0.4–0.7] | 0.78–0.83 [0.3–0.4] | 0.15–0.20 [2.2–3.0] | 0.20–0.68 [2.6–6.4] | 0.49–1.89 [2.5–7.1] | |
| 3 | #13 Black peat, H6–H8 | 0.61 [0.7] | 0.80 [0.4] | 0.85 [0.2] | 0.19 [2.8] | 0.23 [3.6] | 0.49 [4.0] |
| #14 Black peat, H5–H8 | 0.62 [0.7] | 0.80 [0.4] | 0.86 [0.2] | 0.25 [2.7] | 0.33 [3.6] | 0.64 [3.9] | |
| #15 Sedge peat | 0.64 [0.5] | 0.87 [0.2] | 0.90 [0.2] | 0.21 [2.5] | 0.12 [4.8] | 0.23 [5.3] | |
| #16 Coir pith | 0.65 [0.6] | 0.82 [0.2] | 0.88 [0.1] | 0.29 [2.0] | 0.41 [3.2] | 0.86 [3.9] | |
| #17 Fresh pine bark (fine) | 0.61 [0.7] | 0.80 [0.3] | 0.88 [0.2] | 0.24 [2.3] | 0.47 [4.3] | 1.00 [5.5] | |
| #18 Composted pine bark (fine) | 0.63 [0.6] | 0.83 [0.3] | 0.88 [0.2] | 0.24 [2.4] | 0.33 [4.2] | 0.70 [5.6] | |
| #19 Green waste compost | 0.65 [0.6] | 0.84 [0.3] | 0.87 [0.2] | 0.22 [3.1] | 0.28 [4.3] | 0.79 [5.9] | |
| #20 Perlite (fine) | 0.67 [0.5] | 0.84 [0.2] | 0.91 [0.2] | 0.29 [1.6] | 0.63 [4.5] | 1.00 [4.6] | |
| Cluster 3 value range | 0.61–0.67 [0.5–0.7] | 0.80–0.87 [0.2–0.4] | 0.85–0.91 [0.1–0.2] | 0.19–0.29 [1.6–3.1] | 0.12–0.63 [3.2–4.8] | 0.23–1.00 [3.9–5.9] | |
| 4 | #21 Coir (medium) | 0.58 [1.0] | 0.75 [0.7] | 0.80 [0.5] | 0.19 [3.9] | 0.28 [2.6] | 1.81 [19.6] |
| #22 Coir (medium) | 0.61 [0.7] | 0.79 [0.5] | 0.83 [0.3] | 0.22 [3.3] | 0.43 [4.5] | 2.47 [27.1] | |
| Cluster 4 value range | 0.58–0.61 [0.7–1.0] | 0.75–0.79 [0.5–0.7] | 0.80–0.83 [0.3–0.5] | 0.19–0.22 [3.3–3.9] | 0.28–0.43 [2.6–4.5] | 1.81–2.47 [19.6–27.1] | |
1: Identification number defined in Table 1. 2: Standard deviation of the mean of the shape descriptors measured on the three repetitions never exceeds 0.03. 3: Standard deviation of the mean width and length measured over three replicates varies from several tens to several hundred microns.
Disclaimer/Publisher’s Note: The statements, opinions and data contained in all publications are solely those of the individual author(s) and contributor(s) and not of MDPI and/or the editor(s). MDPI and/or the editor(s) disclaim responsibility for any injury to people or property resulting from any ideas, methods, instructions or products referred to in the content. |
© 2023 by the authors. Licensee MDPI, Basel, Switzerland. This article is an open access article distributed under the terms and conditions of the Creative Commons Attribution (CC BY) license (https://creativecommons.org/licenses/by/4.0/).
Share and Cite
MDPI and ACS Style
Durand, S.; Jackson, B.E.; Fonteno, W.C.; Michel, J.-C. Quantitative Description and Classification of Growing Media Particle Morphology through Dynamic Image Analysis. Agriculture 2023, 13, 396. https://doi.org/10.3390/agriculture13020396
AMA Style
Durand S, Jackson BE, Fonteno WC, Michel J-C. Quantitative Description and Classification of Growing Media Particle Morphology through Dynamic Image Analysis. Agriculture. 2023; 13(2):396. https://doi.org/10.3390/agriculture13020396
Chicago/Turabian StyleDurand, Stan, Brian E. Jackson, William C. Fonteno, and Jean-Charles Michel. 2023. "Quantitative Description and Classification of Growing Media Particle Morphology through Dynamic Image Analysis" Agriculture 13, no. 2: 396. https://doi.org/10.3390/agriculture13020396
Note that from the first issue of 2016, this journal uses article numbers instead of page numbers. See further details here.