Article

An Effective Pyramid Neural Network Based on Graph-Related Attentions Structure for Fine-Grained Disease and Pest Identification in Intelligent Agriculture

1
College of Information and Electrical Engineering, Shenyang Agricultural University, Shenyang 110866, China
2
National Engineering Research Centre for Agri-Product Quality Traceability, Beijing Technology and Business University, Beijing 100048, China
3
Research Center of Intelligent Equipment, Beijing Academy of Agriculture and Forestry Sciences, Beijing 100097, China
*
Authors to whom correspondence should be addressed.
Agriculture 2023, 13(3), 567; https://doi.org/10.3390/agriculture13030567
Submission received: 20 January 2023 / Revised: 19 February 2023 / Accepted: 24 February 2023 / Published: 26 February 2023
(This article belongs to the Section Digital Agriculture)

Abstract

:
In modern agriculture and environmental protection, effective identification of crop diseases and pests is very important for intelligent management systems and mobile computing application. However, the existing identification mainly relies on machine learning and deep learning networks to carry out coarse-grained classification of large-scale parameters and complex structure fitting, which lacks the ability in identifying fine-grained features and inherent correlation to mine pests. To solve existing problems, a fine-grained pest identification method based on a graph pyramid attention, convolutional neural network (GPA-Net) is proposed to promote agricultural production efficiency. Firstly, the CSP backbone network is constructed to obtain rich feature maps. Then, a cross-stage trilinear attention module is constructed to extract the abundant fine-grained features of discrimination portions of pest objects as much as possible. Moreover, a multilevel pyramid structure is designed to learn multiscale spatial features and graphic relations to enhance the ability to recognize pests and diseases. Finally, comparative experiments executed on the cassava leaf, AI Challenger, and IP102 pest datasets demonstrates that the proposed GPA-Net achieves better performance than existing models, with accuracy up to 99.0%, 97.0%, and 56.9%, respectively, which is more conducive to distinguish crop pests and diseases in applications for practical smart agriculture and environmental protection.

1. Introduction

With the wide application of the new generation of information and intelligent technologies, modern agriculture has gradually transformed into the production model of intelligent Precise Agriculture (PA), which is an advanced stage in the development of the world’s agriculture. Through the deep integration of PA navigation satellite systems, remote sensing, artificial intelligence, and the Internet of Things, multimodal environmental data, information, and knowledge are the core elements of data perception, decision-making, and application. It has milestone significance for the agricultural field and has become the research trend and hotspot, which attracts much attention from governments, institutions, and researchers around the world [1,2,3,4].
In recent years, many advanced information and intelligent technologies are widely employed by agriculture practitioners and agronomists to handle various practical tasks with optimizing their production efficiency [5]. In modern agricultural production, intelligent species identification helps to warn of large-scale crop production failures caused by pests and diseases, improve the analytical decision-making for agricultural management systems, and guide intelligent robot operations more scientifically. In fact, the crop diseases and insect pests are one of the biggest threats to agricultural development, which affect the overall function of crops, leading to reduced farmland yields and lower quality of agricultural products. To achieve sustained and stable growth in agriculture, it is indeed necessary to combine the advantages of image processing and intelligent model technologies to carry out accurate species distinction, primarily to manage and control crop pests and diseases actively. The identification process assigns a particular pest or disease object to a collection of features with explicit discrimination and high-dimensional representation, eventually matching with a biological name or specie label. For a long time, the early warning and prevention of plant diseases and pests required the technical support of professional researchers [6,7]. At the same time, relevant companies and departments were also invited to conduct on-the-spot training for professional identification knowledge, drug management plans, prevention suggestions, etc., for farmers and agricultural workers who lack expertise. This requires workforce and material resources, but the benefits are minimal. Plant diseases and insect pests have also become a common challenge facing global agricultural production. How to extract stable features and discriminant features from pest environmental monitoring data and how to design a fast classifier to classify large-scale pest monitoring data has also become an important research issue.
In the process of modern agricultural production, intelligent management of the agricultural production process has been applied in practice by using information and intelligent technologies, including Internet wireless sensors [8], unmanned robots [9], big-data computing systems [10], intelligent decision-making platform [11], and combination of various high-tech technologies such as sensor devices, edge mobile terminals, and cloud computing [12]. As one of the critical roles, recognizing plant diseases and pests via the Internet of Things and related technologies has become essential in modern agricultural production because of its rapidity, accuracy, and real-time. It can identify different kinds of objects in real-time by uploading users’ data on crop diseases and insect pests so that the staff can make timely corresponding decisions. Assessed from the actual application effect, excellent intelligent identification should achieve better accuracy, greater timeliness, and low labor-intensity than the manual identification process, which relies on expert experience, and can adapt to various complex applications and scenarios, such as planting product prediction [13], in-field plant disease detection [14], unmanned harvesting [15], and farmland environmental monitoring and management [16].
In the early days, several researchers relied on image engineering and machine learning technology to classify different species of crop diseases and pests [17,18]. The machine learning method mainly has two steps, and the first step is to manually design feature extractors, such as color and morphological features. Then, some typical classifiers, including k-means trees, support vector machine, fuzzy sets, etc., are applied to complete the classification. Human subjective factors in feature extraction interfere with this method; performance on big data is not good, and robustness is not strong.
With the rapid development of deep learning technology, many researchers are using some convolutional neural networks (CNNs) to carry out crop pest and disease identification, which has gradually become one of the hot research spots [19,20,21]. The deep learning method can extract more abstract features, and it does not need to design feature extractors manually. It is more robust for multiclass pest identification in different backgrounds. However, there are some problems in the existing research, such as insufficient description of fine-grained characteristics and internal correlation analysis of pests and diseases. Although there have been studies on pests and diseases using fine-grained methods [22,23], they are still insufficient, and there are still problems of low precision and low efficiency, so they are not competent for the actual pest identification research in complex agricultural environments.
To address these problems, this paper proposes a novel fine-grained image identification method on the basis of graph pyramid attention (GPA-Net), aiming to promote accurate recognition and treatment of various pest and disease species in agricultural production. There are two main innovative contributions in this study. Firstly, a cross-stage trilinear attention module is constructed to enhance the mining and representation capabilities for fine-grained feature maps, which make the backbone network learn the semantic features among different channels. Secondly, the pyramid graph convolution module is constructed to learn various scale features and use cross-stage attention to explore further the potential relationship among these features. In this way, our method can achieve better accuracy and robustness on large-scale pest datasets, thus improving fine-grained recognition performance in complex agricultural applications.
The follow-up organization of the paper is as follows. The second part introduces the related work of crop disease and pest identification. Then, the third section summarizes the general method of the fine-grained identification model via a graph convolution operation. In the fourth part, the recognition results of our proposed method compared with existing methods are verified on public datasets. Finally, we summarize the paper and look forward to future implementation.

2. Related Work

As is known to all, diseases and pests usually cause the roots, stems, leaves, and other parts of plants to show diseased areas, which are the focus of intelligent diagnosis methods. In agricultural planting, production, and product transportation management, many agronomists choose to use a combination of vision processing and machine learning modeling to automatically identify different pest categories. Following a detailed literature research, we conclude that the identification models are roughly divided into three categories, according to perceptual performance, namely, shallow-structure statistical methods, coarse-grained deep learning methods, and fined-grained graphic methods.

2.1. Shallow-Structure Statistical Identification Methods

In view of the large-scale parameters and complex structure of a deep learning network, its training process often requires a large amount of high-quality image data. In order to give full play to the technical advantages of deep learning models in agricultural identification, many studies have collected and shared public datasets of crop pests and diseases to facilitate the progress of related research. Wu [24] collected 102 images of crop pests, with the number of images exceeding 75,200. This dataset can be used for classification and detection tasks at the same time. Some public competitions also provide general plant pest datasets to attract many researchers to solve the problem of intelligent identification. Take the AI-challenger 2018 as an example, it provides over 50,000 high-quality images of leaf diseases on common fruits and vegetables, which are divided into 61 categories of host–disease [25]. Similarly, the Cassava Leaf Disease Classification Dataset consists of 21,367 cassava marker images. According to the degree of plant damage by disease, it is defined with four different categories and one health status [26]. Abundant image datasets provide a reliable foundation for model training and optimization, and transformation of theoretical models into practical applications.
Additionally, various statistical and machine learning algorithms with shallow structure have also been widely applied to the identification of pests and diseases in agricultural scenes, including logistic regression, Bayesian classifiers, decision trees, support vector machine, etc. For example, Qin [27] proposed a naive Bayesian-tree classifier based on cropped images and principal component analysis to identify alfalfa leaf disease images. Similarly, Kumar [28] designed a classifier based on SVM. This classifier eliminates the secondary features of pest images by the exponential spider monkey algorithm and keeps the main features, thus improving classification performance. Vetal [29] tried to apply different machine learning methods to classify tomato diseases. The proposed work achieved good recognition performance using the image processing technology of SVM, DT, and ANN algorithms, and the accuracy rate of all leaf diseases was 93.75%. Zhang [30] proposed a pest identification solution based on the integration of different models with parameter optimization by using SVM technology. In this scheme, two pretrained convolutional models are used to extract deep features individually, and then an SVM classifier is applied to evaluate parameter weights for each model to vote the best fusion effect. With a comparative experiment on the Turkey–Plant Dataset, the proposed model achieved reliable identification performance for 15 kinds of diseases and pests.
However, these methods and applications mainly rely on the shallow extraction structure to obtain various statistical features. These surface features depend on manual selection, which is full of subjectivity, so it is impossible to accurately describe the original data. In addition, these methods perform poorly on data with complex backgrounds. Therefore, increasingly more researchers focus on deep learning technology based on neural networks.

2.2. Coarse-Grained Deep Learning Identification Technology

With their deeper structure and powerful feature extraction ability, deep learning neural networks have achieved better results in the visual field than human recognition or traditional machine learning methods. At present, convolutional neural networks (CNN) based on deep learning, e.g., AlexNet [31], VGG-Net [32], ResNet [33], and GoogleNet [34], have achieved considerable performance in the field of image recognition of crop pests and diseases. For instance, Chen [35] proposed a pest detection system based on a deep learning algorithm, which solved the specific problem of pest scale detection based on pictures. The experimental results show that the classification accuracy of the YOLO v4 algorithm is the highest. At the same time, it has a better time advantage and is therefore suitable for practical applications in real time. Thenmozhi [36] proposed a field crop insect classification model consisting of six convolution layers, five maximum pool layers, one complete connection layer, and one output layer with a SoftMax classifier. Numerous experiments have proved that the proposed CNN model can classify all in-field insects more effectively in comparison with other pretraining models, and is helpful in promoting the quality and yield of agricultural products.
Many studies directly use migration learning strategy to solve identification problems. Some excellent network structures with pretrained parameters are transferred to the identification of diseases and insect pests in a more refined range. Li [37] proposed a finely adjusted GoogleNet model for the complex background of farmland scenes. By selecting different learning rates, optimizers, and other superparameters, the model was finally tested on self-collected datasets of 10 insect pests. The final result showed that the precision of the carefully debugged structure was improved by 6.22% compared with the original model. Liu [38] proposed a crop pest identification method on the basis of model fusion, which consists of the VGG16, Inception, and ResNet-v2 networks. Multiple parallel feature streams extracted by different submodels are ultimately fused by using the integration algorithm, which improves the accuracy of crop pest identification and classification models. Similarly, Park [39] designed a surveillance platform located on an unmanned ground vehicle to monitor pest invasion in a soybean planting. Three typical deep neural networks, including MRCNN, YOLOv3, and Detectron2, were selected to carry out real-time identification of pest categories and a quantitative statistical analysis. Accurate positioning of pesticides can effectively control the number of pests in the early stage of outbreaks.
In addition, other studies choose to modify the local structure or learning method of the deep network according to the specific problem, so as to further improve the model’s performance regarding the perception of the agricultural scene. Chen [40] used a similar method to add a new module to the network, replacing the complete connection layer with the global pool layer and adding batch normalization in the network layer. This method achieved excellent results on the selected datasets of corn leaves. Zhang [41] combined extended convolution with global convolution to identify cucumber disease and insect pest images, reducing computational complexity and significantly reducing the amount of computation. Zhang [42] proposed a lightweight AgriPest–YOLO network to accurately distinguish and detect crop pests. Under the basic architecture of the YOLO network, this study combined the coordination–local attention module and spatial pyramid pooling layer to distinguish 24 pest categories. The experimental results verified the good performance in recognition rate, model parameters, and detection time.
Many research achievements have been made by using coarse-grained methods to identify pests and diseases in different meta-categories. Still, there are apparent fine-grained characteristics of pests and diseases. Fine-grained methods must be considered to identify problems and diseases accurately and efficiently in the actual agricultural environment.

2.3. Fine-Grained Identification Technology via Graphic Structure Network

Fine-grained image classification is based on distinguishing the basic categories and is divided into different subclasses according to each biological characteristic. The first is the solid supervised learning method [43]. This method adds annotation boxes and other annotations on the surface of original images, in order to enhance the recognition ability of fine-grained properties. This kind of method requires much workforce. The second kind of solution is the weakly supervised learning strategy. With image-level labels, this method usually applies some attention modules or local feature extractors adaptively to focus on discrimination parts of the whole target. Compared with the robust supervision method, researchers favor the weak supervision attention method. Ding [44] proposed an attention pyramid convolution neural network (AP-CNN). By integrating low-level information such as color, edge connection, etc., it has a top–down feature path and a bottom–up attention path to learn high-level semantics and low-level detail feature representation to accurately locate the recognition area. Song [45] introduced the feature enhancement and feature suppression module, which enabled the network to mine other potential features when learning the most significant features. Through multilevel operations, the network was able to learn features of different significant levels, which improved the recognition performance. Ye [46] proposed a fine-grained identification method to identify pest species in different coarse-grain and fine-grain dimensions. To avoid having the gradients easily fall into a local optimum, they designed the GA-SGD method to automatically select suitable solutions. By establishing the compensation module, the recognition results achieve better accuracy and stability than other popular models.
Different discrimination areas are often used independently in the abovementioned algorithms, and the context relationship between other discrimination parts is ignored. Since each crop pest and disease has its own prominent physiological and visual characteristics, it is necessary to learn the latent relationship among distinguishable regions for improving the performance of the recognition model. A graph structure can represent this relationship between different local areas. Therefore, it is of tremendous research significance to learn the intrinsic relationship among various fine-grained features by using the advantages of a graph neural network in analyzing interpretable features with non-European data. With development of the graph neural network, many different structures have been derived, such as the graph convolution operation [47], the gated graph recurrent operation [48], and the graphic attention operation [49].
The convolution neural network has been applied to the research of fine-grained image recognition. Wang [50] proposed a novel cross-graphic module to learn the relevant semantics among different locations, which synchronously mines the context relationship between other discrimination regions. Zhao [51] proposed a relationship mining method to discover the graphic context of high-order features. Firstly, the feature library is established using the high-order constraints of semantic and location perception. Then, via the semantic grouping strategy, a high-order encoder is designed to explore the intrinsic graph associations of various features in low-dimensional space. At the same time, a swarm intelligence learning strategy centered on an embedded clustering center is proposed to regularize features.
Moreover, many researchers also gave much attention to optimizing network structure and node–edge representation of graphic methods. Wang [52] improved the network structure of the graph by beginning with the topological space and feature space of the graph neural network structure, and improved the ability of the graph neural network to learn topological structure and node features by learning features of different spaces and using the attention method to learn embedded adaptive importance weights. Wang [53] and others studied the confidence ability of the graph neural network. By applying a confidence correction structure to the graph neural network, the confidence of the graph neural network is improved and the classification ability of the graph is also improved.
In summary, neither the hollow-structure statistical methods nor coarse-grained deep learning models are suitable for the actual identification tasks in smart agriculture. Relying on the attention mechanism and graphic operation, a pyramid neural network under the graphic attention structure is proposed to manage the fine-grained identification problems of crop pest and disease species. The detailed description of the proposed method is illustrated in the sections that follow.

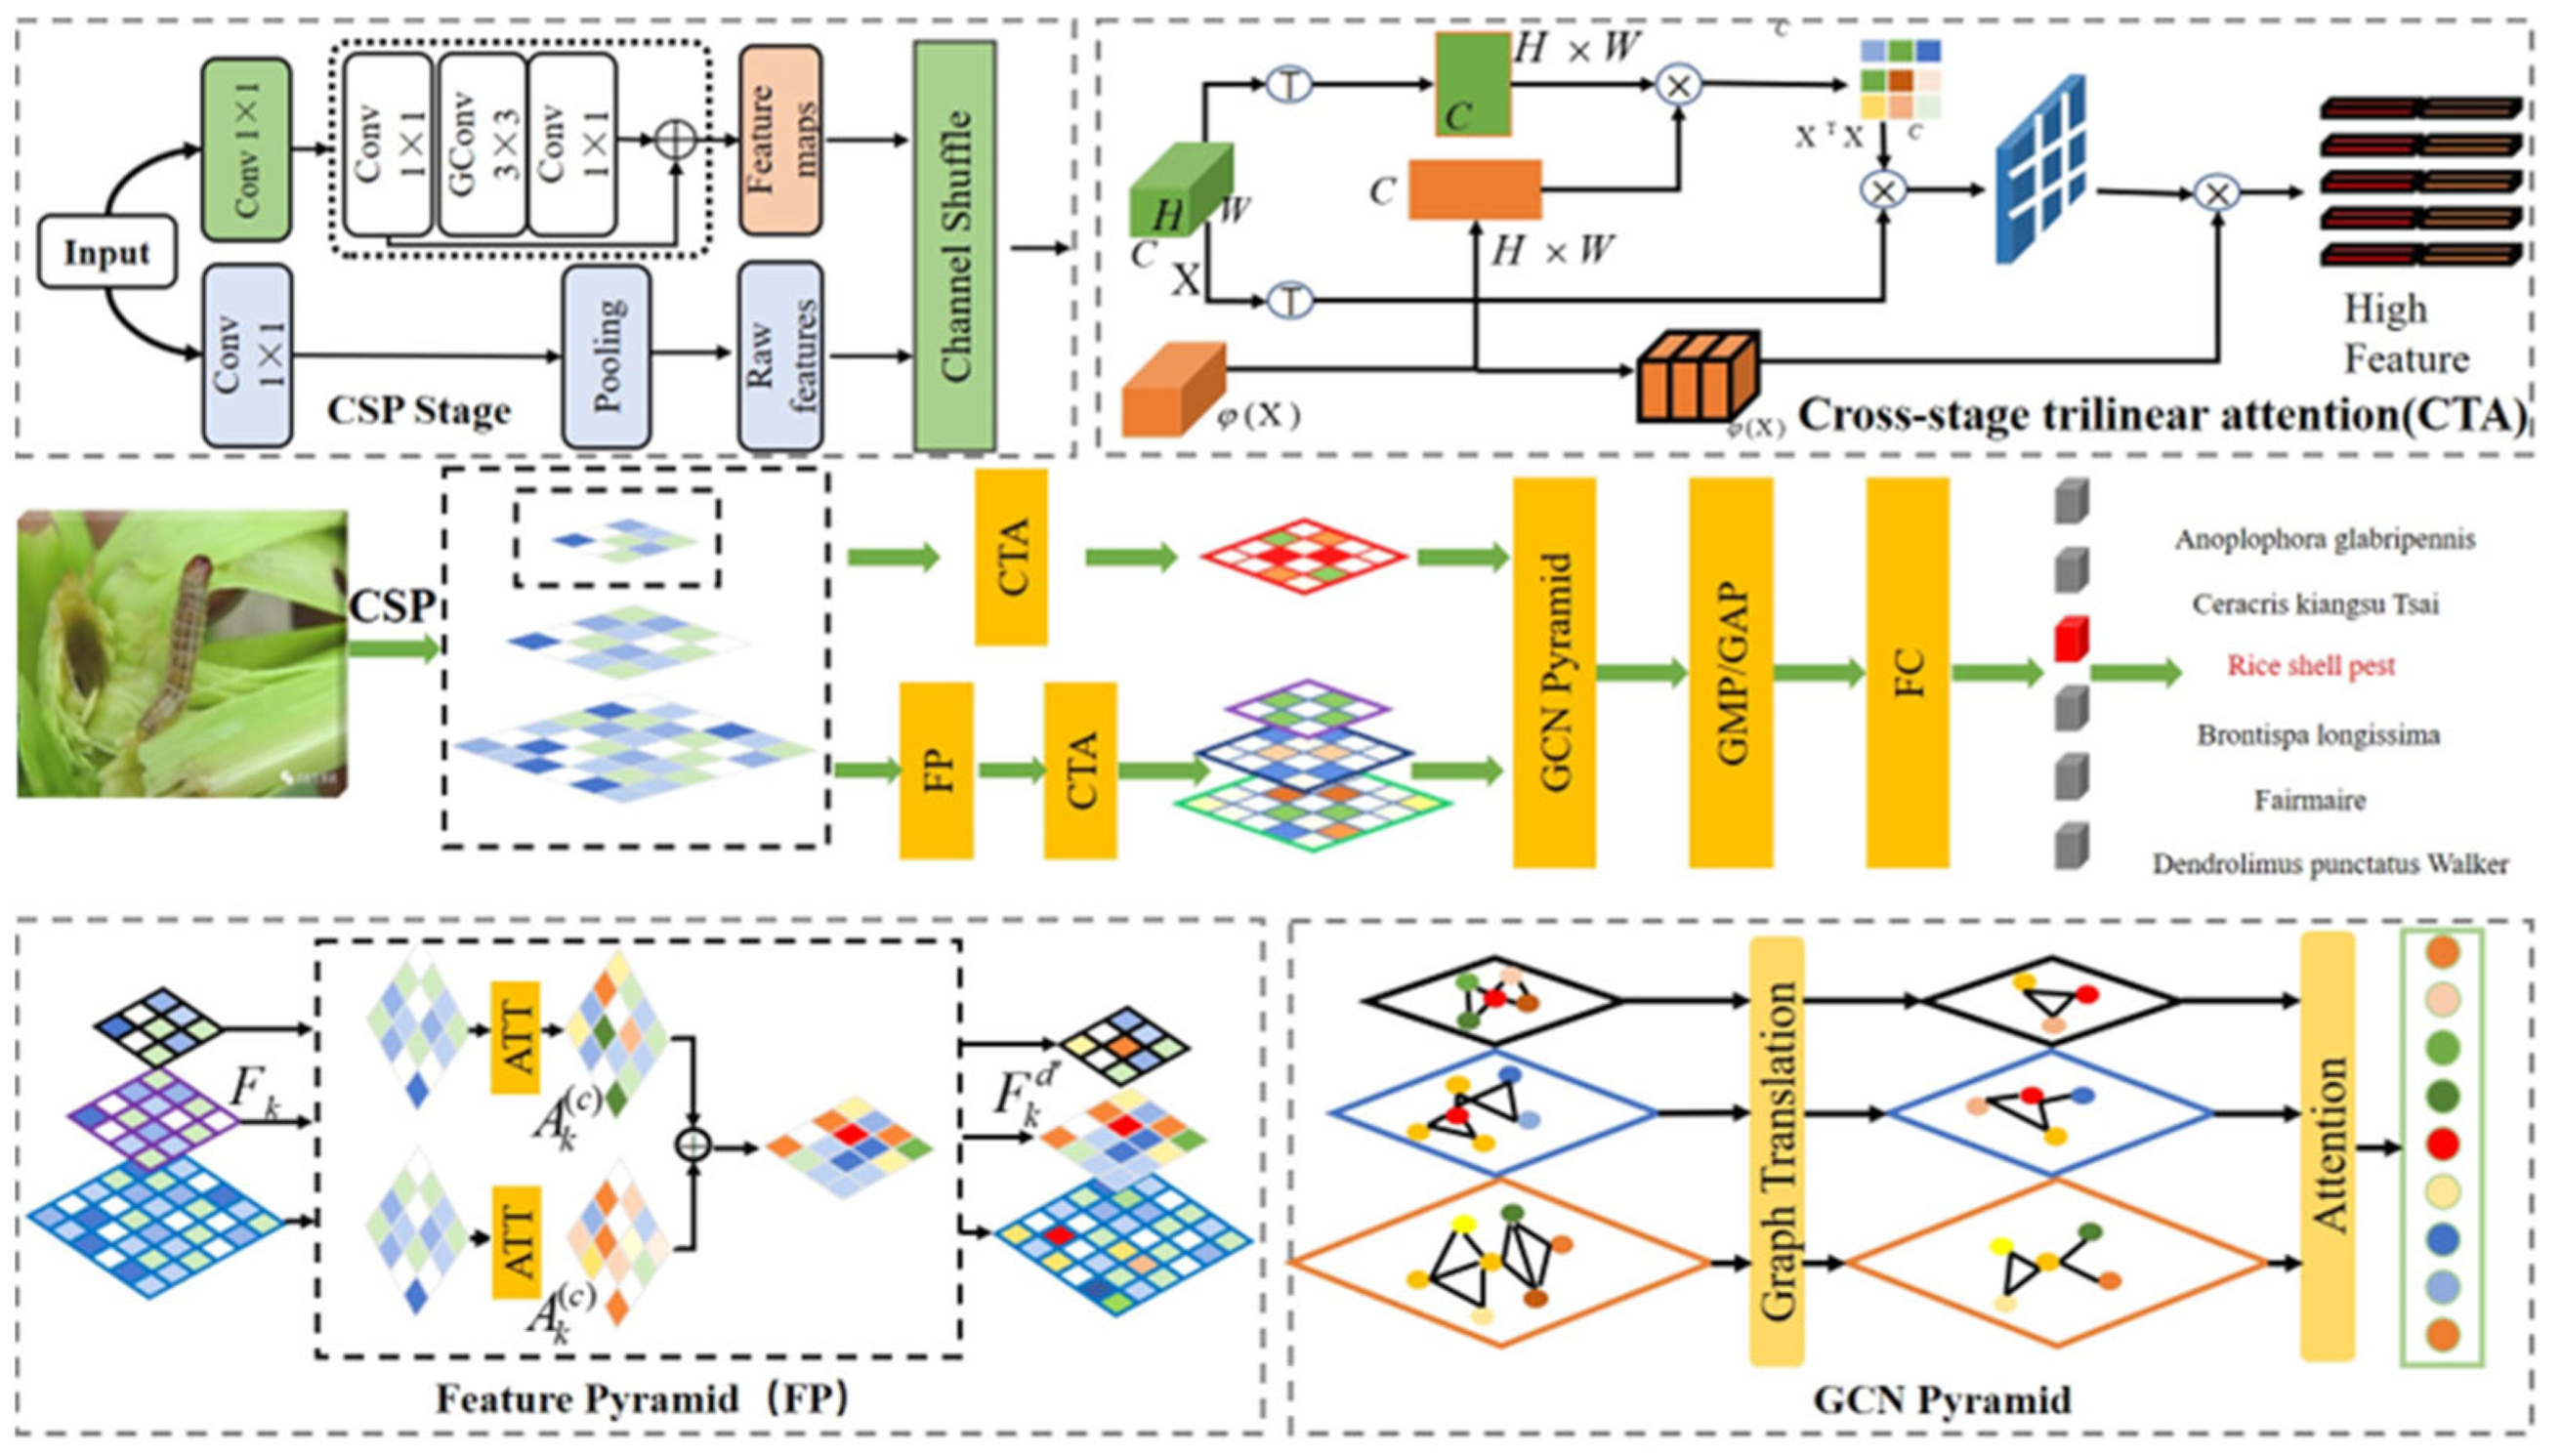
3. Fine-Grained Image Recognition via GPA-Net Model

In this section, in Figure 1, we introduce a convolutional neural network based on graph pyramid attention (GPA-Net) for fine-grained pest image classification. We first introduce the backbone network in Section 3.1. Considering the calculation cost, we utilize the CSP structure to optimize the computing cost and memory consumption, and increase the speed of network training. Section 3.2 proposes a cross-stage trilinear attention (CTA) module to exploit potential relations among different semantics and structures, extracting fine-grained information. Compared with other fine-grained tasks, the background of pests and diseases is more complex, and the target is smaller in the fine-grained identification tasks. Thus, in Section 3.3, we introduce the pyramid structure to learn features of different granularity levels. Those different granularity levels can utilize the CTA module to extract potential information. Section 3.4 proposes a graph pyramid module to embed high-dimensional features. Additionally, in Section 3.5, we introduce the details of the loss function and parameter adjustment used to optimize the whole network.

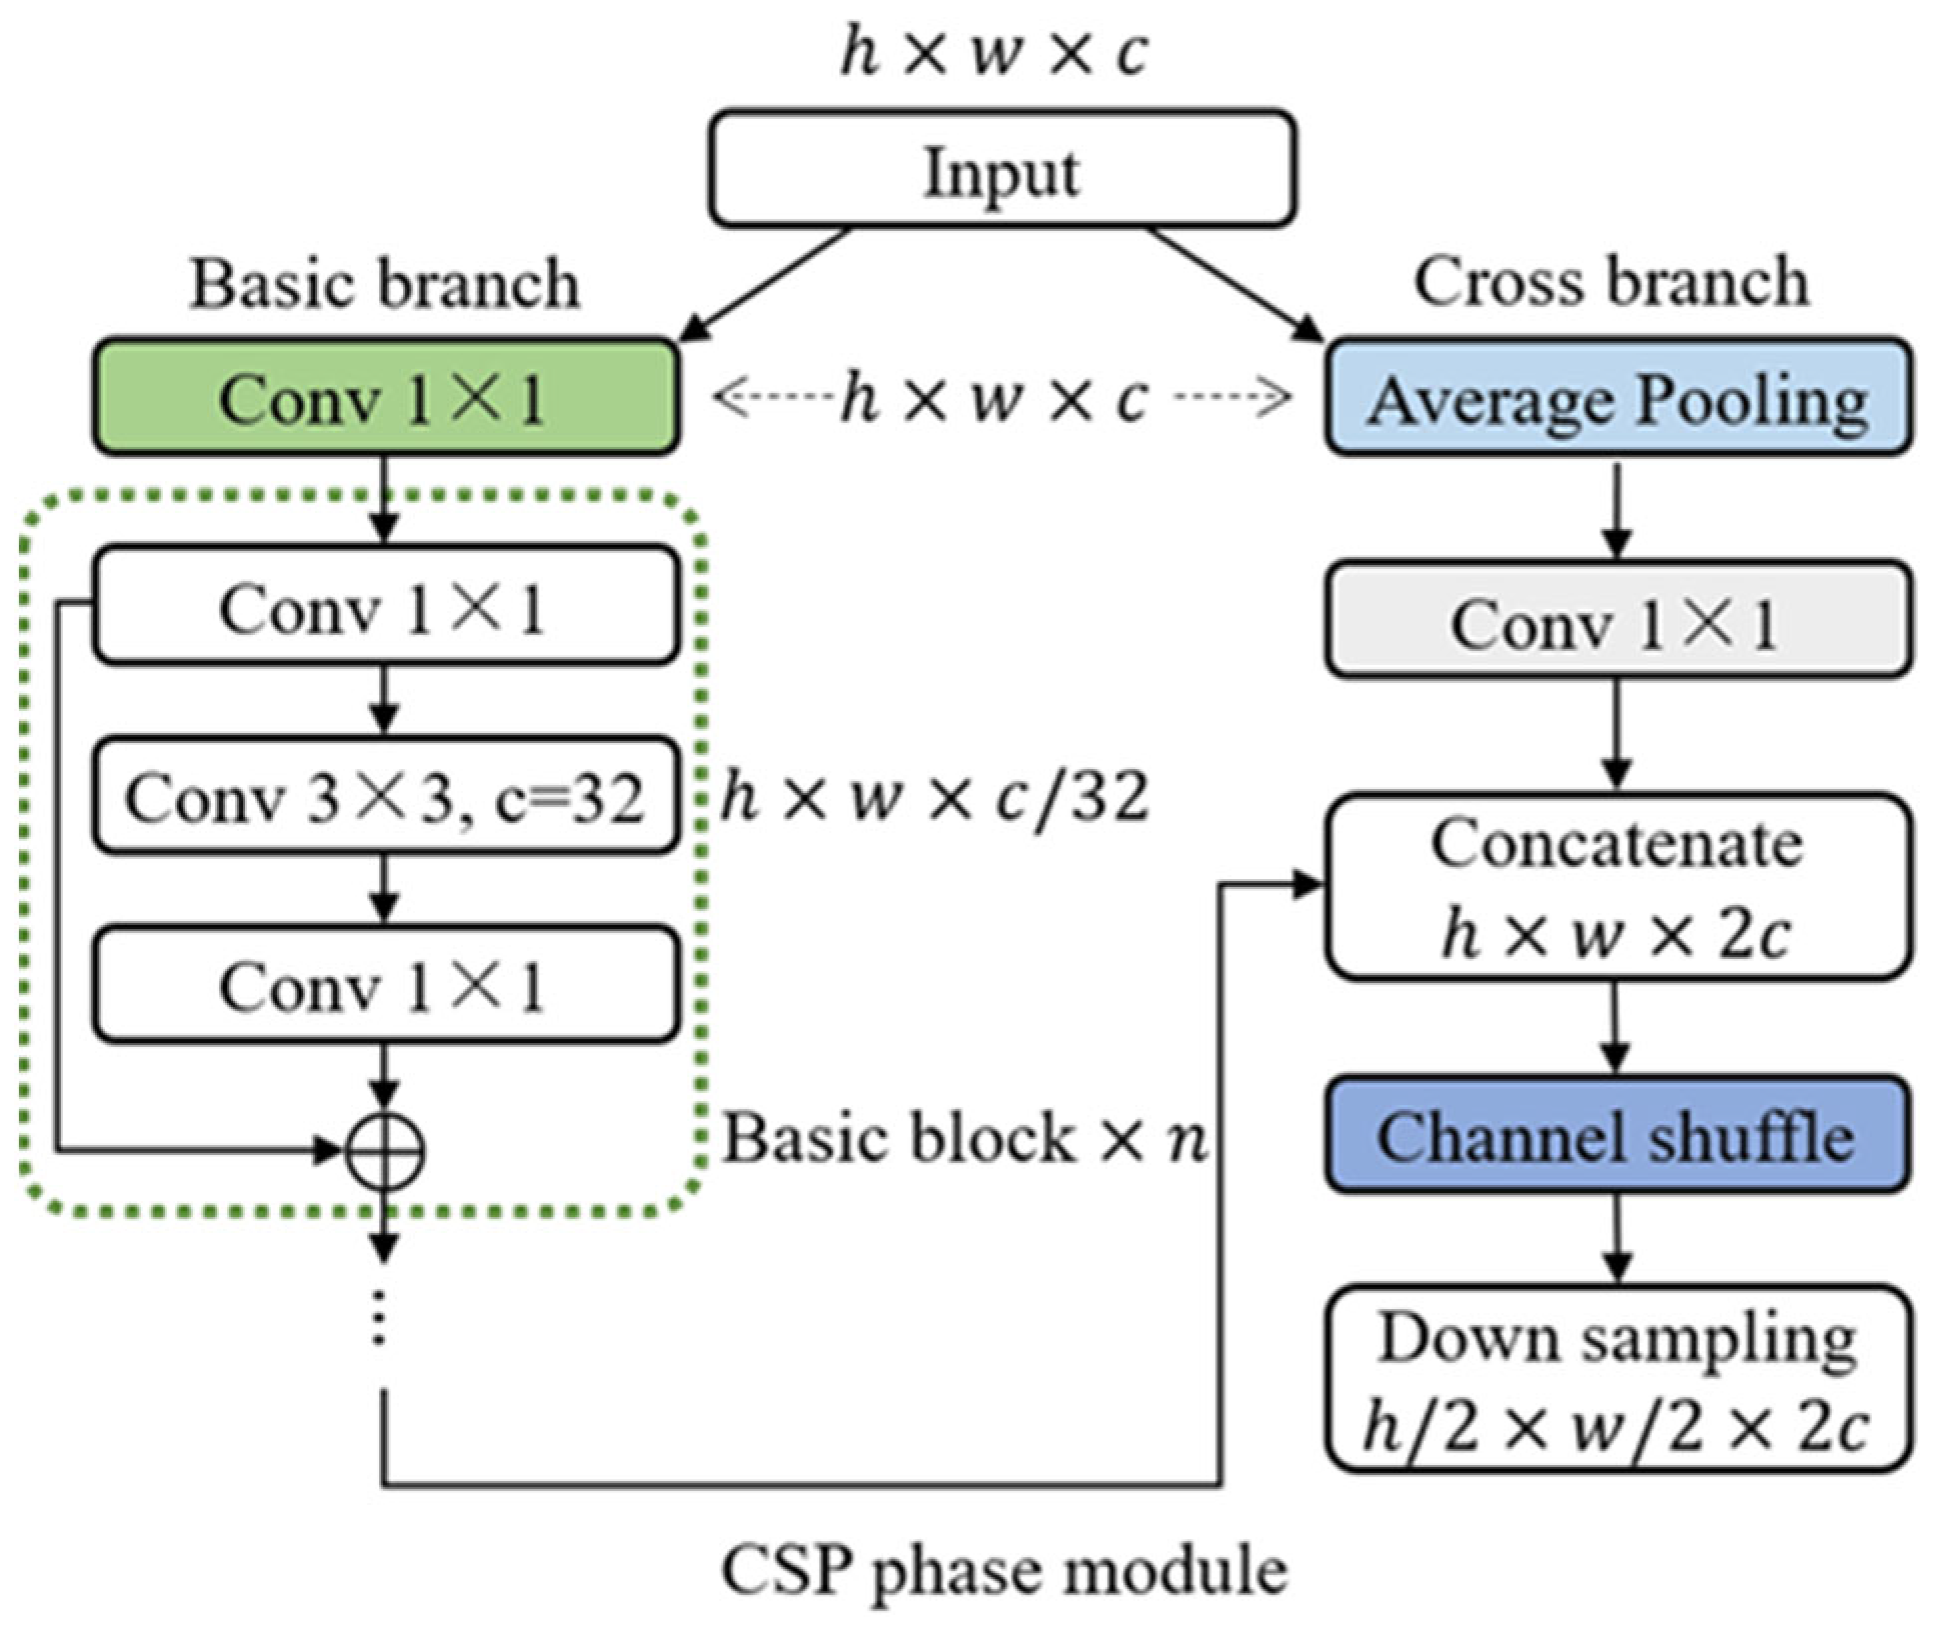
3.1. Backbone Network Based on CSP Structure

Before the actual model training, we use some data enhancement operations to enlarge the existing image samples, including random rotation, random flipping, random cropping, increasing Gaussian noise, etc. Then, the improved CSP backbone network is used for processing. CSP is a new variant of the ResNet network series. This structure prevents excessively repeated gradient information by cutting off the gradient stream, strengthening CNN’s learning ability, and eliminating the computational bottleneck, thereby effectively reducing the memory cost. The stage module of basic CSPNet consists of two parallel branch networks: the basic branch and the spanning branch. Their output characteristics are spliced at the end of each stage.
The phase module of the basic CSPNet includes the basic branch and the spanning branch, and the features of the two branches are spliced at the end of each phase, as shown in Figure 2. The input of each stage first goes through two 1 × 1 convolutions. The calculation process of the basic branch can be expressed by the following equation:
X B a s e = F b a s e f 1 × 1 X
where f 1 × 1 represents 1 × 1 convolution and F b a s e is a combination of n basic modules. Then, two groups of features in the basic branch and the generated branch are spliced together, and the information exchange between the two groups of features is increased by channel shuffling. Finally, the outputs of different stages are calculated by the down-sampling operation. The detailed process is as follows:
X ˜ = F d o w n S X B a s e , X C r o s s
where X B a s e represents the output of the basic branch, X C r o s s represents the output across the branch, S represents the channel shuffling, and X d o w n represents the down sampling.

3.2. Cross-Stage Trilinear Attention Fine-Grained Feature Learning Module (CTA)

To mine features suitable for fine-grained identification, we design a fine-grained feature-map extractor based on the cross-stage trilinear attention mechanism. Through the backbone network in Section 3.1, we can obtain a feature map X ˜ W × H × C , where W , H represents the width and height of the feature map, and C represents the number of channels in the feature map. Generally, the global average pool (GAP) or global maximum pool (GMP) is used to learn the final features X ˜ . One of the common problems with average or maximum pooling is that the interactive information between different semantic channels cannot be fully utilized.
Therefore, a common method is to use bilinear spatial attention, as shown in Figure 3a The second-order matrix F a of each position i , j is classified by merging itself X A W H × C A with another CNN stream X B W H × C B , and then the final feature is used in the final category through a fully connected (fc) layer.
F a = 1 W H i = 1 W j = 1 H v X A i , j T ( X B ) i , j
F b = W F a + b
where v : C A × C B C A C B × 1 represents the vectorization of the second-order matrix, and W C A C B × N c l s is the learnable weight of FC layer. Although abundant features are obtained through bilinear pooling, these high-dimensional features are easily optimized with poor usability. Therefore, in the method of trilinear attention, the cross-channel relationship is regarded as the attention diagram generated by the same feature map X T X C × C by a nonlocal operation, and then the channel-perceived attention map gives different annotations to the original features to produce the third-order result S X T X X T W H × C , where S represents the SoftMax normalization.
However, a disadvantage of the cross-channel relationship is that it ignores the learning between multiscale features. Because different network layers have different scales of receptive fields, the later network layers have larger receptive fields. Inspired by [40], we use features φ X from the next layer of the same stage of the network to conduct cross-layer semantic learning of cross-channels (see Figure 3b), which can be expressed as:
F c = N ( M ( 1 W H i = 1 W H ( X T φ ( X ) ) ) ) C × H W
where φ X is the output of one layer after the same stage of CSP, N represents the SoftMax normalization, and M x = s i g n x x 1 / 2 represents moment function normalization. Similar to trilinear attention, in order to make the feature map more consistent and enhance robustness, the spatial relationship is further integrated into the feature map by F c dot multiplication of F c and φ X , so a cross-stage trilinear attention map is obtained. The attention map can be expressed as:
F d = N ( M ( F c T φ ( X ) ) ) C × H W
Therefore, we construct an attention map F d , and each channel of the map F d represents an attention map F i d W × H .

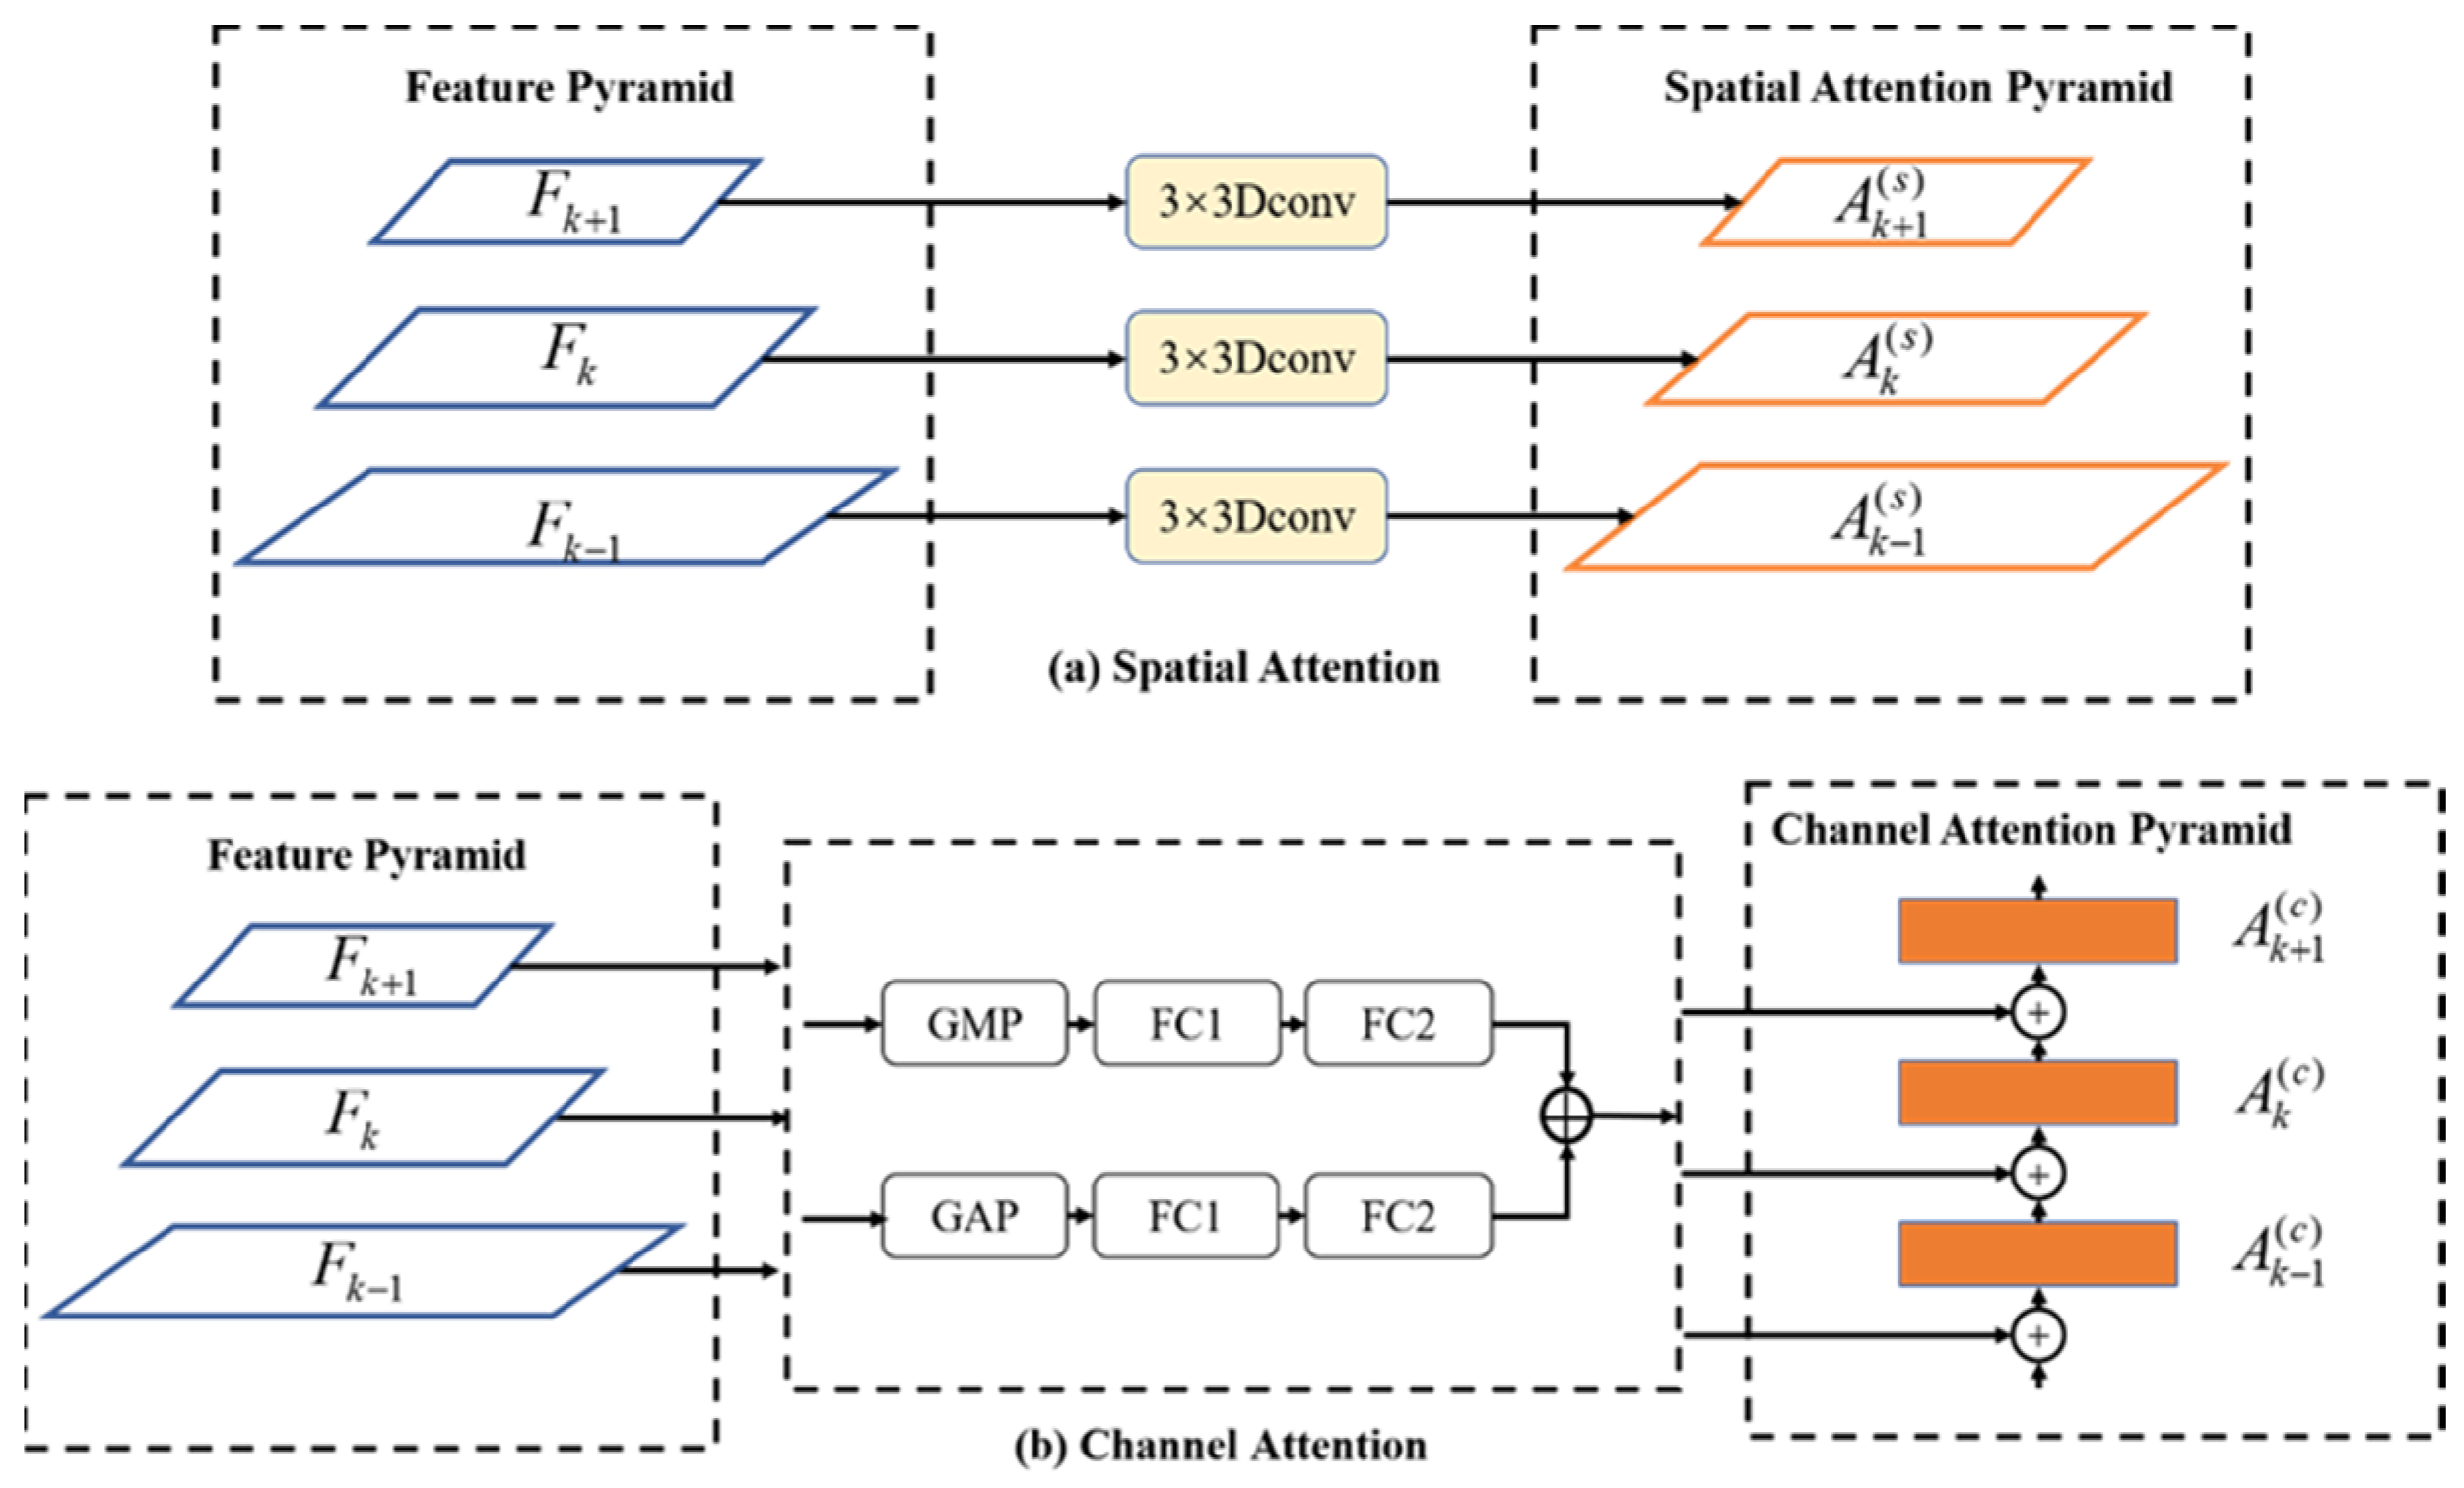
3.3. Multilevel Pyramid Feature Module (MPF)

In the tasks of fine-grained image classification, a series of convolution modules of the backbone network can be used to map the output features with different spatial sizes to X 1 , , X l , where l is the number of convolution blocks. The last feature mapping has strong semantic information but lacks detailed information. Additionally, it needs less receptive field information to classify pests and diseases, which have a smaller field of vision. Therefore, we consider obtaining more detailed classification information through different levels of mapping. Inspired by [51], we introduced the pyramid structure to learn features at different levels F 1 , F 2 , , F n , , F l 1 n l . At the same time, we used the top–down method to down sample the features with less spatial information but stronger semantics from the upper level of the pyramid to the lower level of the pyramid, and at the same time used horizontal connection to keep the original backbone information, as shown in Figure 4.
In the pyramid structure, we introduce an additional attention module { A 1 F , A 2 F , , A N F } to enhance the FPN structure. On the pyramid structure, it consists of a spatial pyramid { A 1 s , A 2 s , , A N s } and a channel pyramid { A 1 c , A 2 c , , A N c } , both of which are used in the bottom–up and top–down paths.
(1)
Spatial pyramid attention module
As shown in Figure 4a, each block takes the corresponding feature map F k as its input, and then the feature map A k s through a 3 × 3 deconvolution layer, and then uses sigmod function to scale each element of spatial attention to between 0 and 1, and the value of each element indicates the importance of its position. The specific formula is as follows:
A k s = σ ϕ F k
where σ represents sigmod function and ϕ ( ) represents 3 × 3 deconvolution. We obtain the spatial pyramid attention { A 1 s , A 2 s , , A N s } based on different levels. We use these spatial pyramid attentions to generate features from different levels for multiscale local feature representation, as shown in Figure 4.
(2)
Channel pyramid attention module
Inspired by the attention expression of CSPResNetx50 [54], channel attention components { A 1 c , A 2 c , , A N c } are generated through GAP, GMP, and two fully connected layers. The specific channel generation mode is as follows:
A k c = σ W 2 Re L U W 1 GAP F k + GMP F k
where σ represents the sigmod function and ReLU represents the activation function. W 1 , W 2 represent the weights of two fully connected layers. The dot product represents element-wise multiplication. In our framework, to convey information, spatial attention and channel attention are arranged in the bottom–up path from low pyramid level to high pyramid level, and in the top–down path from high pyramid level to low pyramid level. The learned attention F k is used to weight the feature maps to obtain pyramid-level features F k , as shown below:
F k = F k A k s A k c
where represents the addition operation of broadcast semantics. The features after the pyramid can generate fine-grained features from the cross-stage trilinear attention module.
F k d = ACT F k
where ACT represents cross-stage trilinear attention.

3.4. Graph Pyramid Embedding (GPE)

(1)
Multilevel graphic pyramid embedding
Multiscale fine-grained feature libraries can be generated through the cross-stage attention modules in Section 3.2 and Section 3.3, but these feature libraries are very high-dimensional matrices. The conventional way is to use an MLP for feature learning, which leads to a large number of learnable parameters. Inspired by [51], each element of these feature libraries can be regarded as a graph node, and then the adjacency matrix score of the node graph neural network is used to embed these features, as shown in Figure 5.
First of all, every element in attention F d = f 1 , , f C N is regarded as a graph node, and each graph node shares much information, so we can aggregate these nodes in the following ways.
A i , j = τ ( f i ) T τ f j τ f i τ f j
where τ is the convolution used for dimension transformation and represents A i , j , the adjacency matrix score of node i and j . Finally, the adjacency matrix of is A ˜ = A + I , where I C 1 × C 1 is identity matrix. Through similarity aggregation in this way, each node is updated as follows:
G 0 = Re L u ( D ˜ 1 2 A ˜ D ˜ 1 2 K d W d )
where W d is the graph node d h weight of learnable dimension, and D ˜ d = j A ˜ i , j d is the diagonal matrix to be normalized, and K d represents the matrix form of feature bank κ d .
Similarly, the features F k d in the pyramid structure also have embedded features G k d through similar operations, as shown below:
G k = Re L u ( D ˜ k 1 2 A ˜ k D ˜ 1 2 k   K k W k )
where W k is the graph-node weight of learnable d h dimension, and is D ˜ k = j A ˜ i , j k the diagonal matrix to be normalized, and K k represents the matrix form of feature library κ k .
(2)
Multilevel Graph Attention
Through the graph propagation structure indicated above, we obtain the embedded features G = G 0 , G 1 , , G k of the multilevel structure. Considering that the features of different levels play different roles, we use an adaptive attention att I = I 0 , I 1 , , I k to learn the importance between them, as shown below:
I = att G
where att is attention and its specific generation mode is as follows.
First of all, there is a node g m i , where 0 m k and i represents the i -th point. Secondly, we use nonlinear transformation to transform the embedding, and then use an attention vector η to obtain the attention value, as shown below:
η m i = t a n h ( W m g m i ) T + b m
where t a n h is a nonlinear function, W m is a learnable parameter weight, and b m is a bias. Through a similar operation, we can find all the embedded G = G 0 , G 1 , , G k attention values and normalize them with the SoftMax operation:
I m i = s o f t m a x ( η m i ) = e x p ( η m i ) m = 0 k η m i
The larger I m i , the more important the embedding is. For all n nodes, the attention vector I = I 0 , , I k can be obtained to distinguish the importance of different levels of features through attention adaptation. The final result score is as follows:
C = m = 0 k I m s o f t m a x ( G m )

3.5. Loss Function

In the training process, we use cross-entropy loss as the loss function, and in order to reduce the risk of overfitting, it is also applied to label smoothing technology, and the smoothed new label is used to replace the original label:
y = ( 1 ε ) y ˜ + ε u
where y   ˜ represents the sample label, ε is the smoothing factor representing the weight ratio, and u   is the fraction expression of each category. With the label smoothing operation, the probability result output from the SoftMax function is motivated to approach the correct labels of different categories, by restraining the output difference between positive and negative samples. Finally, the entire network achieves better generalization ability through the smooth loss function.

4. Experimental Results and Analysis

4.1. Datasets and Implementation Settings

Dataset: In order to demonstrate the scientific nature of this research fairly, we chose three public datasets to carry out a series of verification experiments. These specific datasets are available as follows:
(1) Cassava Leaf Disease Classification [24]: The task is to train a classification model that can accurately identify from the leaves the disease that infects cassava. Five categories are defined in this competition dataset, including Bacterial Blight, Brown Streak Disease, Green Mottle, Mosaic Disease, and Healthy. The whole dataset is divided into the training set and test set, containing 17,115 and 4282 high-quality images, respectively.
(2) AI Challenger Agricultural Disease [25]: The competition is to classify crop disease images, including a total of 61 categories according to “species–disease–degree”, which contains 27 disease situations in 10 species. The total number of training images and verification images are 31,718 and 4540, respectively. Test set A has 4514 images, and test set B has 4513 images.
(3) IP102 [26]: The purpose is to distinguish the categories of crop diseases and pests; the dataset contains more than 75,000 images of 102 pest categories in crops, including rice, corn, wheat, sugar beet, alfalfa, grape, citrus, and mango. Moreover, there are about 19,000 images with additional bounding annotation to further solve the target detection task.
Implementation details: In this experiment, all selected models were pretrained on the ImageNet dataset. Before the image enters the network, it is preprocessed by random cropping and random flipping. In the training and validation stages, the image size is set to 448 × 448, the batch size is set to 128, and the number of training times is set to 150. Using SGD as the optimizer and cosine annealing strategy, the attenuation period is 20, and the initial learning rate is 0.005. Finally, all experiments of this study are performed on a high-performance computing server with 8 NVIDIA-P40 GPUs and 4 Intel-i9-13900K CPUs. The whole learning process only utilizes original image-level labels, without any supernumerary manual annotation or information.

4.2. Experimental Results

To verify the overall performance of the proposed method, we selected some open source, coarse-grained recognition methods and fine-grained recognition methods for comprehensive comparison. We took the accuracy, precision, recall, F1 score, and parameter amount as our evaluation indicators to comprehensively evaluate the performance of different models on each dataset. The experimental results in detail are shown in Table 1, Table 2 and Table 3.
As shown in Table 1, the experimental results of cassava leaf disease indicates that the proposed GPA-Net achieves the best results in terms of Accuracy, Precision, and Recall, which reach the highest values 99.0%, 88.6%, and 87.4%, respectively. This clearly shows that it has better fine-grained discrimination ability. Specifically, the number of categories in the cassava leaf dataset is small, and the background is more straightforward. Moreover, our method also achieves quite good results in terms of F1 and parameter amount, which are 0.88 and 91.3 M-byte, respectively. It means that this study has good stability while obtaining high performance, and is suitable for actual deployment applications, including mobile robots and fixed-position video surveillance, owing to its small model size and low time consumption.
The contrasting performance of each model performed on the AI Challenger dataset is illustrated in Table 2. Our model still obtains the equivalent or superior results compared with other control group models. In addition to the parameter amount of 98.6 M-byte, other indicators have synchronously achieved the best values, including the accuracy rate of 97.0%, the precision rate of 87.5%, the recall rate up to 86.9%, and the F1 score up to 0.87. Similar situations also appear in the experiments on the IP102 dataset. As shown in Table 3, although GPA-Net has slightly more parameters than the other two models, Inception and DenseNet121, this gap does not affect the deployment of our model in practical applications. In contrast, the proposed method continues to achieve the best results in terms of Accuracy, Precision, Recall, and F1 score, which improves at most 2.7%, 2.8%, 1.8%, and 4.65%, respectively. From the comprehensive analysis of evaluation results for each indicator on different datasets, it can be seen that our GPA-Net achieves a good balance between timeliness, identification accuracy, and model parameters. It is capable of managing the problem of fine-grained visual identification of crop pests and diseases in complex agricultural scenarios.
Considering the differences in identification objects, picture number, and scene changes that exist among the different datasets, we conducted further in-depth comparative experiments to more objectively evaluate the performance of each method. We visually compared the F1 scores of ten selected models on Cassava, AI Challenger, and IP102, as shown in Figure 6. Although the number of pictures contained in the two former datasets is less than that of the third one, each model achieves higher results in the F1 value. We suggest that there are two reasons for this phenomenon. On the one hand, the number of categories that need to be distinguished is small. For example, the Cassava dataset only has 5 categories, while the AI Challenger dataset has 61 categories, which is less than the 102 categories in the IP102 dataset. This result is easy to understand. As the number of categories increases, the identification difficulty of the intelligent model becomes greater, and the probability of recognition errors gradually increases. The second aspect is that the picture quality of the Cassava and AI Challenger datasets are both very good. Each picture is obtained using a high-definition camera or device, with high pixel values and clear targets to be identified, unlike the third dataset, which uses images obtained by crawling many pictures from the web. This is very meaningful to us. If we need to solve practical agricultural problems, we still need to build high-quality datasets by ourselves, instead of relying on data published or crawled on the Internet. Of course, our method achieves the best results on the three datasets, which means that it has good stability and generalization, and will be less affected by data and scene difference.
In order to analyze the convergence changes, we compared the loss trend of different models on the different datasets. As shown in Figure 7, we can find that the convergence speed for the proposed GPA-Net is better than the other control models in the early stage, which means that our method has better convergence, reducing the occupation of computing resources and time costs. At the same time, the smooth loss function obtained the lowest result, which further shows that our method has good stability and can be adapted to the application of fine-grained pest identification in complex scenes.
Moreover, we also draw three confusion matrices of model accuracy to illustrate our model further, as shown in Figure 8. The confusion matrix of the cassava leaf dataset is shown in Figure 8a. The figure shows that the recognition accuracy of each category on the cassava leaf dataset is over 95%. This is because the cassava leaf dataset is relatively simple, so the recognition results of each category can reach a high level. The AI Challenger dataset results are shown in Figure 8b, and most of the recognition results on AI Challenger are also excellent. It can be seen from the figure that when the fifth class is identified, a large number of samples are identified as the third class. This is because the number of pieces in the fifth class is relatively small, and some are recognized as the third class, resulting in a large ratio. The confusion matrix of the IP102 dataset is illustrated in Figure 8c. Because most of images in the IP102 dataset are crawled on the network, the datasets are ambiguous, so the model’s accuracy on this dataset is relatively low.

4.3. Ablation Experiment Analysis

To verify the effectiveness of the proposed module, we conducted ablation experiments on the three datasets. As can be seen from Table 4, the accuracy of the CTA attention module on the cassava leaf dataset is improved by 2.7% compared with the CSP backbone network. It is also improved by 0.5% and 0.9% on the other two datasets, which shows that the CTA module can effectively enhance the ability of feature extraction. In addition, if the CTA module is not applicable, only adding the MPF module can effectively improve the model’s accuracy, which shows that the MPF module can significantly improve the performance of the basic model. After combining the CTA module with the MPF module, the model’s performance is further enhanced because the CTA module extracts fine-grained features and MPF extracts fine-grained features at different levels, and the combination of the two achieves better results. Finally, the model’s performance is also improved by adding a GPE module, which shows that the GPE module helps improve the feature extraction ability of the model.
Furthermore, we visualize some classes to analyze MPF effection. The visualization results are shown in Figure 9. Our model focuses on different areas in different passage stages, such as a specific pest’s tail, trunk, and head. This proves that constructing different feature levels benefits global object learning. Although there are noisy areas in the backbone network, the better activation areas of MPF are always concentrated in specific areas. In addition, the fusion of features at different levels can make up for the distinguishing features that are ignored but effective at a particular stage.

5. Conclusions

Aiming to solve the fine-grained image identification problems in practical monitoring of agriculture pests and diseases, this study proposed an effective neural network under the pyramid convolution structure with graphic attention optimization, namely GPA-Net, to enhance the fine-grained perception and recognition performance. Firstly, a cross-stage trilinear attention module is designed to improve the CSP-stage backbone network. At the same time, the pyramid architecture is proposed to optimize network parameters and complex structures, and obtain rich multidimensional features. Then, a novel graphic pyramid embedding module is introduced to converge the elements of high-order space into low-dimensional space, with adaptive importance judgment, enhancing the recognition ability. Abundant experiments on three public datasets proved that the proposed GPA-Net achieves better performance in distinguishing crop pests and diseases than existing models, in the terms of accuracy, timeliness, and stability. This also shows the potential and advantage of the proposed method in agricultural applications.
In future work, the model structure will be optimized to carry out practical deployment in intelligent agricultural applications. Additionally, relevant technologies will be studied to expand the application of this model to other fields, such as the temporal weather prediction [58], grain storage management, and IoMT systems [59].

Author Contributions

Conceptualization, S.L.; methodology and writing—original draft preparation, S.L. and Y.X.; writing—review and editing, J.K. and C.Z.; data analysis and software, Y.X. and C.Y.; funding acquisition and supervision, J.K. and C.Z. All authors have read and agreed to the published version of the manuscript.

Funding

This work was partly supported by the National Natural Science Foundation of China (No. 62006008), National Key Research and Development Program of China (No. 2021YFD2100605), the Science and Technology Innovation 2030’s sub-project (No. 2021ZD0113602), and the MOE (Ministry of Education in China) Project of Humanities and Social Sciences (No. 22YJCZH006).

Institutional Review Board Statement

Not applicable.

Informed Consent Statement

Not applicable.

Data Availability Statement

Data contained within the article are available at the link: Cassva Leaf Disease Classification [24]: https://www.kaggle.com/c/cassava-disease/overview (accessed on 19 January 2023); AI Challenger [25]: https://aistudio.baidu.com/aistudio/datasetdetail/76075 (accessed on 19 January 2023); IP102 [26]: https://github.com/xpwu95/IP102 (accessed on 19 January 2023).

Conflicts of Interest

The authors declare no conflict of interest.

References

  1. Kong, J.; Wang, H.; Yang, C.; Jin, X.; Zuo, M.; Zhang, X. Fine-grained pests & diseases recognition via Spatial Feature-enhanced attention architecture with high-order pooling representation for precision agriculture practice. Agriculture 2022, 2022, 1592804. [Google Scholar]
  2. Zheng, Y.-Y.; Kong, J.-L.; Jin, X.-B.; Wang, X.-Y.; Su, T.-L.; Zuo, M. CropDeep: The Crop Vision Dataset for Deep-Learning-Based Classification and Detection in Precision Agriculture. Sensors 2019, 19, 1058. [Google Scholar] [CrossRef] [PubMed] [Green Version]
  3. Jin, X.-B.; Wang, Z.-Y.; Kong, J.-L.; Bai, Y.-T.; Su, T.-L.; Ma, H.-J.; Chakrabarti, P. Deep Spatio-Temporal Graph Network with Self-Optimization for Air Quality Prediction. Entropy 2023, 25, 247. [Google Scholar] [CrossRef] [PubMed]
  4. Jin, X.-B.; Wang, Z.-Y.; Gong, W.-T.; Kong, J.-L.; Bai, Y.-T.; Su, T.-L.; Ma, H.-J.; Chakrabarti, P. Variational Bayesian Network with Information Interpretability Filtering for Air Quality Forecasting. Mathematics 2023, 11, 837. [Google Scholar] [CrossRef]
  5. Lu, J.; Tan, L.; Jiang, H. Review on Convolutional Neural Network (CNN) Applied to Plant Leaf Disease Classification. Agriculture 2021, 11, 707. [Google Scholar] [CrossRef]
  6. Kong, J.; Yang, C.; Wang, J.; Wang, X.; Zuo, M.; Jin, X.; Lin, S. Deep-stacking network approach by multisource data mining for hazardous risk identification in IoT-based intelligent food management systems. Comput. Intell. Neurosci. 2021, 2021, 1194565. [Google Scholar] [CrossRef]
  7. Jin, X.-B.; Gong, W.-T.; Kong, J.-L.; Bai, Y.-T.; Su, T.-L. A Variational Bayesian Deep Network with Data Self-Screening Layer for Massive Time-Series Data Forecasting. Entropy 2022, 24, 335. [Google Scholar] [CrossRef]
  8. Mishra, P.; Polder, G.; Vilfan, N. Close range spectral imaging for disease detection in plants using autonomous platforms: A review on recent studies. Curr. Robot. Rep. 2020, 1, 43–48. [Google Scholar] [CrossRef] [Green Version]
  9. Cai, W.; Liu, B.; Wei, Z.; Li, M.; Kan, J. TARDB-Net: Triple-attention guided residual dense and BiLSTM networks for hyperspectral image classification. Multimed. Tools Appl. 2021, 80, 11291–11312. [Google Scholar] [CrossRef]
  10. Cai, W.; Wei, Z. Remote Sensing Image Classification Based on a Cross-Attention Mechanism and Graph Convolution. IEEE Geosci. Remote Sens. Lett. 2020, 19, 1–5. [Google Scholar] [CrossRef]
  11. Kong, J.; Yang, C.; Xiao, Y.; Lin, S.; Ma, K.; Zhu, Q. A Graph-related high-order neural network architecture via feature aggregation enhancement for identify application of diseases and pests. Comput. Intell. Neurosci. 2022, 2022, 4391491. [Google Scholar] [CrossRef] [PubMed]
  12. Jin, X.-B.; Zheng, W.-Z.; Kong, J.-L.; Wang, X.-Y.; Zuo, M.; Zhang, Q.-C.; Lin, S. Deep-learning temporal predictor via bidirectional self-attentive encoder–decoder framework for IOT-based environmental sensing in intelligent greenhouse. Agriculture 2021, 11, 802. [Google Scholar] [CrossRef]
  13. Jin, X.-B.; Gong, W.-T.; Kong, J.-L.; Bai, Y.-T.; Su, T.-L. PFVAE: A Planar Flow-Based Variational Auto-Encoder Prediction Model for Time Series Data. Mathematics 2022, 10, 610. [Google Scholar] [CrossRef]
  14. Voulodimos, A.; Doulamis, N.; Doulamis, A.; Protopapadakis, E. Deep learning for computer vision: A brief review. Comput. Intell. Neurosci. 2018, 2018, 7068349. [Google Scholar] [CrossRef]
  15. Jin, X.; Zhang, J.; Kong, J.; Su, T.; Bai, Y. A Reversible Automatic Selection Normalization (RASN) Deep Network for Predicting in the Smart Agriculture System. Agronomy 2022, 12, 591. [Google Scholar] [CrossRef]
  16. Dawei, W.; Limiao, D.; Jiangong, N.; Jiyue, G.; Hongfei, Z.; Zhongzhi, H. Recognition Pest by Image-Based Transfer Learning. J. Sci. Food Agric. 2019, 99, 4524–4531. [Google Scholar] [CrossRef]
  17. Kong, J.; Wang, H.; Wang, X.; Jin, X.; Fang, X.; Lin, S. Multi-stream hybrid architecture based on cross-level fusion strategy for fine-grained crop species recognition in precision agriculture. Comput. Electron. Agric. 2021, 185, 106134. [Google Scholar] [CrossRef]
  18. Kong, J.; Wang, H.; Yang, C.; Jin, X.; Zuo, M.; Zhang, X. A Spatial Feature-Enhanced Attention Neural Network with High-Order Pooling Representation for Application in Pest and Disease Recognition. Agriculture 2022, 12, 500. [Google Scholar] [CrossRef]
  19. Kute, R.S.; Vyas, V.; Anuse, A. Component-Based Face Recognition under Transfer Learning for Forensic Applications. Inf. Sci. 2019, 476, 176–191. [Google Scholar] [CrossRef]
  20. Liao, W.X.; He, P.; Hao, J.; Wang, X.Y.; Yang, R.L.; An, D.; Cui, L.G. Automatic Identification of Breast Ultrasound Image Based on Supervised Block-Based Region Segmentation Algorithm and Features Combination Migration Deep Learning Model. IEEE J. Biomed. Health Inform. 2022, 24, 984–993. [Google Scholar] [CrossRef]
  21. Anagnostis, A.; Asiminari, G.; Papageorgiou, E.; Bochtis, D. A Convolutional Neural Networks Based Method for Anthracnose Infected Walnut Tree Leaves Identification. Appl. Sci. 2022, 10, 469. [Google Scholar] [CrossRef] [Green Version]
  22. Anagnostis, A.; Tagarakis, A.C.; Asiminari, G.; Papageorgiou, E.; Kateris, D.; Moshou, D.; Bochtis, D. A deep learning approach for anthracnose infected trees classification in walnut orchards. Comput. Electron. Agric. 2021, 182, 105998. [Google Scholar] [CrossRef]
  23. Ji, R.; Wen, L.; Zhang, L.; Du, D.; Wu, Y.; Zhao, C.; Liu, X.; Huang, F. Attention Convolutional Binary Neural Tree for Fine-Grained Visual Categorization. In Proceedings of the 2020 Computer Vision and Pattern Recognition (CVPR), Seattle, WA, USA, 13–19 June 2020; pp. 10468–10477. [Google Scholar]
  24. XWu, X.; Zhan, C.; Lai, Y.-K.; Cheng, M.-M.; Yang, J. Ip102: A Large-Scale Benchmark Dataset for Insect Pest Recognition. In Proceedings of the 2019 Computer Vision and Pattern Recognition (CVPR), Long Beach, CA, USA, 16–20 June 2019; IEEE: Piscataway, NJ, USA, 2019; pp. 8787–8796. [Google Scholar]
  25. Islam, M.; Anh, D.; Wahid, K.; Bhowmik, P. Detection of potato diseases using image segmentation and multiclass support vector machine. In Proceedings of the 2017 IEEE 30th Canadian Conference on Electrical and Computer Engineering (CCECE), Windsor, ON, Canada, 30 April–3 May 2017; pp. 1–4. [Google Scholar]
  26. Mwebaze, E.; Gebru, T.; Frome, A.; Nsumba, S.; Tusubira, J. iCassava 2019 fine-grained visual categorization challenge. arXiv 2019, arXiv:1908.02900. [Google Scholar]
  27. Qin, F.; Liu, D.; Sun, B.; Ruan, L.; Ma, Z.; Wang, H. Identification of alfalfa leaf diseases using image recognition technology. PLoS ONE 2016, 11, e0168274. [Google Scholar] [CrossRef] [PubMed] [Green Version]
  28. Kumar, S.; Sharma, B.; Sharma, V.K.; Sharma, H.; Bansal, J.C. Plant leaf disease identification using exponential spider monkey optimization. Sustain. Comput. Informatics Syst. 2018, 28, 100283. [Google Scholar] [CrossRef]
  29. Vetal, S.; Khule, R.S. Tomato Plant Disease Detection using Image Processing. IJARCCE 2017, 6, 293–297. [Google Scholar] [CrossRef]
  30. Turkoglu, M.; Yanikoğlu, B.; Hanbay, D. PlantDiseaseNet: Convolutional neural network ensemble for plant disease and pest detection. Signal Image Video Process. 2023, 16, 301–309. [Google Scholar] [CrossRef]
  31. Krizhevsky, A.; Sutskever, I.; Hinton, G.E. ImageNet Classification with Deep Convolutional Neural Networks. Adv. Neural Inf. Process. Syst. 2012, 25, 1097–1105. [Google Scholar] [CrossRef] [Green Version]
  32. Simonyan, K.; Zisserman, A. Very Deep Convolutional Networks for Large-Scale Image Recognition. Int. Conf. Learn. Represent 2015, 5048–5057. [Google Scholar] [CrossRef]
  33. He, K.; Zhang, X.; Ren, S.; Sun, J. Deep residual learning for image recognition. In Proceedings of the IEEE Conference on Computer Vision and Pattern Recognition, Las Vegas, NV, USA, 26 June–1 July 2016; pp. 770–778. [Google Scholar]
  34. Szegedy, C.; Vanhoucke, V.; Ioffe, S.; Shlens, J.; Wojna, Z. Rethinking the Inception Architecture for Computer Vision. In Proceedings of the IEEE Conference on Computer Vision and Pattern Recognition, Las Vegas, NV, USA, 26 June–1 July 2016; pp. 2818–2826. [Google Scholar]
  35. Chen, J.-W.; Lin, W.-J.; Cheng, H.-J.; Hung, C.-L.; Lin, C.-Y.; Chen, S.-P. A smartphone-based application for scale pest detection using multiple-object detection methods. Electronics 2021, 10, 372. [Google Scholar] [CrossRef]
  36. Thenmozhi, K.; Reddy, U.S. Crop pest classification based on deep convolutional neural network and transfer learning. Comput. Electron. Agric. 2019, 164, 104906. [Google Scholar] [CrossRef]
  37. Li, Y.; Wang, H.; Dang, L.M.; Sadeghi-Niaraki, A.; Moon, H. Crop pest recognition in natural scenes using convolutional neural networks. Comput. Electron. Agric. 2020, 169, 105174. [Google Scholar] [CrossRef]
  38. Liu, Y.; Zhang, X.; Gao, Y.; Qu, T.; Shi, Y. Improved CNN Method for Crop Pest Identification Based on Transfer Learning. Comput. Intell. Neurosci. 2022, 2022, 9709648. [Google Scholar] [CrossRef] [PubMed]
  39. Park, Y.-H.; Choi, S.H.; Kwon, Y.-J.; Kwon, S.-W.; Kang, Y.J.; Jun, T.-H. Detection of Soybean Insect Pest and a Forecasting Platform Using Deep Learning with Unmanned Ground Vehicles. Agronomy 2023, 13, 477. [Google Scholar] [CrossRef]
  40. Chen, J.; Chen, J.; Zhang, D.; Sun, Y.; Nanehkaran, Y.A. Using deep transfer learning for image-based plant disease identification. Comput. Electron. Agric. 2020, 173, 105393. [Google Scholar] [CrossRef]
  41. Zhang, S.; Zhang, S.; Zhang, C.; Wang, X.; Shi, Y. Cucumber leaf disease identification with global pooling dilated convolutional neural network. Comput. Electron. Agric. 2019, 162, 422–430. [Google Scholar] [CrossRef]
  42. Zhang, W.; Huang, H.; Sun, Y.; Wu, X. AgriPest-YOLO: A rapid light-trap agricultural pest detection method based on deep learning. Front. Plant Sci. 2022, 2022, 1079384. [Google Scholar] [CrossRef]
  43. Zhou, M.; Bai, Y.; Zhang, W.; Zhao, T.; Mei, T. Look-into-object: Self-supervised structure modeling for object recognition. In Proceedings of the Proceedings of the IEEE/CVF Conference on Computer Vision and Pattern Recognition, Seattle, WA, USA, 13–19 June 2020; pp. 11774–11783. [Google Scholar]
  44. Ding, Y.; Ma, Z.; Wen, S.; Xie, J.; Chang, D.; Si, Z.; Wu, M.; Ling, H. AP-CNN: Weakly supervised attention pyramid convolutional neural network for fine-grained visual classification. IEEE Trans. Image Process. 2021, 30, 2826–2836. [Google Scholar] [CrossRef]
  45. Song, J.; Yang, R. Feature Boosting, Suppression, and Diversification for Fine-Grained Visual Classification. arXiv 2021, arXiv:2103.02782. [Google Scholar]
  46. Ye, Y.; Huang, Q.; Rong, Y.; Yu, X.; Liang, W.; Chen, Y.; Xiong, S. Field detection of small pests through stochastic gradient descent with genetic algorithm. Comput. Electron. Agric. 2023, 206, 107694. [Google Scholar] [CrossRef]
  47. Yang, B.; Pan, H.; Yu, J.; Han, K.; Wang, Y. Classification of Medical Images with Synergic Graph Convolutional Networks. In Proceedings of the 2019 IEEE 35th International Conference on Data Engineering Workshops (ICDEW), Macao, China, 8–12 April 2019; pp. 253–258. [Google Scholar]
  48. Ruiz, L.; Gama, F.; Ribeiro, A. Gated Graph Recurrent Neural Networks. IEEE Trans. Signal Process. 2020, 68, 6303–6318. [Google Scholar] [CrossRef]
  49. Zhang, T.; Liu, B.; Niu, D.; Lai, K.; Xu, Y. Multiresolution Graph Attention Networks for Relevance Matching. In Proceedings of the 27th ACM International Conference on Information and Knowledge Management, Beijing, China, 3–7 November 2019; pp. 933–942. [Google Scholar]
  50. Wang, Z.; Wang, S.; Li, H.; Dou, Z.; Li, J. Graph-Propagation Based Correlation Learning for Weakly Supervised Fine-Grained Image Classification. In Proceedings of the AAAI Conference on Artificial Intelligence, New York, NY, USA, 7–12 February 2020; Volume 34, pp. 12289–12296. [Google Scholar]
  51. Zhao, Y.; Yan, K.; Huang, F.; Li, J. Graph-based high-order relation discovery for fine-grained recognition. In Proceedings of the IEEE/CVF Conference on Computer Vision and Pattern Recognition, Nashville, TN, USA, 19–25 June 2021; pp. 15079–15088. [Google Scholar]
  52. Wang, X.; Zhu, M.; Bo, D.; Cui, P.; Shi, C.; Pei, J. Am-gcn: Adaptive multi-channel graph convolutional networks. In Proceedings of the 26th ACM SIGKDD International Conference on Knowledge Discovery & Data Mining, Virtual Event, CA, USA, 6–10 July 2020; pp. 1243–1253. [Google Scholar]
  53. Wang, X.; Liu, H.; Shi, C.; Yang, C. Be Confident! Towards Trustworthy Graph Neural Networks via Confidence Calibration. Adv. Neural Inf. Process. Syst. 2021, 34, 23768–23779. [Google Scholar]
  54. Wang, C.Y.; Liao, H.Y.M.; Wu, Y.H.; Chen, P.Y.; Hsieh, J.W.; Yeh, I.H. Cspnet: A New Backbone That Can Enhance Learning Capability of Cnn. In Proceedings of the IEEE/CVF Conference on Computer Vision and Pattern Recognition Workshops, Seattle, WA, USA, 13–19 June 2020; pp. 390–391. [Google Scholar]
  55. Huang, G.; Liu, Z.; Van Der Maaten, L.; Weinberger, K.Q. Densely connected convolutional networks. In Proceedings of the IEEE Conference on Computer Vision and Pattern Recognition, Honolulu, Hawaii, 21–26 July 2017; pp. 4700–4708. [Google Scholar]
  56. Hu, J.; Shen, L.; Sun, G. Squeeze-and-excitation networks. In Proceedings of the IEEE Conference on Computer Vision and Pattern Recognition, Salt Lake, UT, USA, 18–22 June 2018; pp. 7132–7141. [Google Scholar]
  57. Zhuang, P.; Wang, Y.; Qiao, Y. Learning Attentive Pairwise Interaction for Fine-Grained Classification. In Proceedings of the AAAI Conference on Artificial Intelligence, New York, NY, USA, 7–12 February 2020; Volume 34, pp. 13130–13137. [Google Scholar]
  58. Kong, J.-L.; Fan, X.-M.; Jin, X.-B.; Su, T.-L.; Bai, Y.-T.; Ma, H.-J.; Zuo, M. BMAE-Net: A Data-Driven Weather Prediction Network for Smart Agriculture. Agronomy 2023, 13, 625. [Google Scholar] [CrossRef]
  59. Cai, W.; Gao, M.; Jiang, Y.; Gu, X.; Ning, X.; Qian, P.; Ni, T. Hierarchical Domain Adaptation Projective Dictionary Pair Learning Model for EEG Classification in IoMT Systems. IEEE Trans. Comput. Soc. Syst. 2022, 1–9. [Google Scholar] [CrossRef]
Figure 1. The proposed graph pyramid attention neural network approach, which consists of three essential modules: the cross-stage trilinear attention module to extract potential relations, the feature pyramid to exploit different granularity levels, and the adoption of the GCN pyramid to embed high-dimensional features.
Agriculture 13 00567 g001
Figure 2. Fine-tuned backbone network via CSP-Net structure.
Agriculture 13 00567 g002
Figure 3. Cross-stage trilinear attention fine-grained feature learning module: (a) bilinear pooling; (b) triple linear attention; (c) cross-stage trilinear attention.
Agriculture 13 00567 g003
Figure 4. Spatial attention and channel attention modules.
Agriculture 13 00567 g004
Figure 5. Graphic pyramid embedding operation.
Agriculture 13 00567 g005
Figure 6. F1 scores for different models on different datasets.
Agriculture 13 00567 g006
Figure 7. Loss function curves: (a) Cassava; (b) AI Challenger; (c) IP102.
Agriculture 13 00567 g007aAgriculture 13 00567 g007b
Figure 8. Confusion matrix: (a) Cassava; (b) AI Challenger; (c) IP102.
Agriculture 13 00567 g008
Figure 9. Class activation visualizations of baseline (CSP) and class activation visualizations of the MPF module for different stages.
Agriculture 13 00567 g009
Table 1. Contrast performance on the Cassava dataset.
Model ClassificationMethodAccuracy
(%)
Precision
(%)
Recall
(%)
F1Parameter Amount
(M)
Coarse-grainedVGG-19 [32]88.079.077.80.78544.3
ResNet-50 [33]89.777.074.50.7698.4
Inception [34]88.579.378.20.7880.1
DenseNet121 [55]89.179.678.40.7988.1
CSPResNetx50 [54]92.380.180.10.8187.9
SeNet [56]94.584.380.20.8290.2
Fine-grainedAPI-Net [57]98.588.386.60.88143.6
FBSD [45]98.488.487.20.88164.7
AP-CNN [44]98.687.286.50.87103.2
GPA-Net99.088.687.40.8891.3
Table 2. Contrast performance on the AI Challenger dataset.
Model ClassificationMethodAccuracy
(%)
Precision
(%)
Recall
(%)
F1Parameter Amount
(M)
Coarse-grainedVGG-19 [32]94.186.285.70.78543.6
ResNet-50 [33]94.586.485.80.7696.1
Inception [34]95.086.986.00.7872.3
DenseNet121 [55]95.386.886.30.7990.1
CSPResNetx50 [54]95.686.986.30.81110.4
SeNet [56]95.886.986.20.82112.3
Fine-grainedAPI-Net [57]95.987.086.10.87157.5
FBSD [45]96.287.186.30.87178.3
AP-CNN [44]96.487.386.40.87135.6
GPA-Net97.087.586.90.8798.6
Table 3. Contrast performance on the IP102 dataset.
Model ClassificationMethodAccuracy
(%)
Precision
(%)
Recall
(%)
F1Parameter Amount
(M)
Coarse-grainedVGG-19 [32]54.143.142.00.43548.1
ResNet-50 [33]54.743.442.10.4399.4
Inception [34]55.343.442.30.4396.9
DenseNet121 [55]55.443.642.40.4391.4
CSPResNetx50 [54]55.643.942.40.44114.9
SeNet [56]54.345.142.60.44114.3
Fine-grainedAPI-Net [57]56.945.442.90.44160.7
FBSD [45]54.845.643.30.45180.2
AP-CNN [44]56.445.443.10.44139.4
GPA-Net56.945.943.80.4597.3
Table 4. Accuracy results of the ablation experiment.
MethodCassava LeavesAI ChallengerIP102
CSP92.395.655.6
CSP + CTA95.596.156.5
CSP + MPF96.996.056.2
CSP + CTA + MPF97.896.657.5
CSP + CTA + MPF + GPE99.097.056.9
Disclaimer/Publisher’s Note: The statements, opinions and data contained in all publications are solely those of the individual author(s) and contributor(s) and not of MDPI and/or the editor(s). MDPI and/or the editor(s) disclaim responsibility for any injury to people or property resulting from any ideas, methods, instructions or products referred to in the content.

