Article

Influence of Plant Growth Retardants and Nitrogen Doses on the Content of Plant Secondary Metabolites in Wheat, the Presence of Pests, and Soil Quality Parameters

by
Joanna Lemanowicz
1,*,
Bożena Dębska
1,
Robert Lamparski
2,
Agata Michalska
1,
Jarosław Pobereżny
3,
Elżbieta Wszelaczyńska
3,
Agata Bartkowiak
1,
Małgorzata Szczepanek
4,
Magdalena Banach-Szott
1 and
Tomasz Knapowski
1
1
Department of Biogeochemistry and Soil Science, Bydgoszcz University of Science and Technology, 6/8 Bernardyńska Street, 85-029 Bydgoszcz, Poland
2
Department of Biology and Plant Protection, Bydgoszcz University of Science and Technology, 7 Kaliskiego St., 85-796 Bydgoszcz, Poland
3
Department of Microbiology and Food Technology, Bydgoszcz University of Science and Technology, 7 Kaliskiego St., 85-796 Bydgoszcz, Poland
4
Department of Agronomy, Bydgoszcz University of Science and Technology, 7 Kaliskiego St., 85-796 Bydgoszcz, Poland
*
Author to whom correspondence should be addressed.
Agriculture 2023, 13(6), 1121; https://doi.org/10.3390/agriculture13061121
Submission received: 18 April 2023 / Revised: 19 May 2023 / Accepted: 24 May 2023 / Published: 25 May 2023

Abstract

:
Wheat is the cereal most susceptible to lodging, particularly during the flowering period and at the early ripening stage. The use of plant growth retardants (PGRs) is especially recommended when intensive nitrogen (N) fertilisation is applied, which increases the susceptibility of plants to lodging. This paper presents the results of tests into the effects of PGRs (PGR0—control; PGR1—chlormequat chloride (CCC) + trinexapac-ethyl (TE); PGR2—chlormequat chloride (CCC) + ethephon (ET)), and N dose—N0, N20, N40, and N60 [0, 20, 40, and 60 kg N ha−1] on the content of selected plant secondary metabolites (PSM) in the Indian dwarf wheat (Triticum sphaerococcum Percival) of the Trispa cultivar, and on the abundance of insect pests. In the developmental stage of wheat (BBCH 39), insects were collected with an entomological net. The study also investigated the effect of experimental factors on the physicobiochemical properties of the soil (pH in KC, granulometric composition, total organic carbon TOC, total nitrogen TN, fractional composition of humus, and the activity of enzymes). An increase in the plant secondary metabolite (PSM) and FRAP (ferring reducing ability of plasma) contents following the application of PGRs and N fertilisation already from as low a rate as 20 kg ha−1 was demonstrated. A significant positive correlation was noted between the abundance of Oulema spp. and the contents of total polyphenols, chlorogenic acid, and FRAP. No such relationship was noted for Aphididae or Thysanoptera. TOC content was higher on the plots on which N fertilisation was applied at the highest rate and after the application of PGRs. The factor determining the TN content was N fertilisation. Soil samples of the PGR0 N0 treatment were characterised by the greatest proportion of carbon in the humic and fulvic acid fractions and by the smallest proportion of carbon in the humin fraction. N fertilisation increased the proportion of carbon in the humin fraction on the plots on which no PGRs were applied. The study demonstrated an increase in the activity of oxidoreductive enzymes following the application of higher N rates. The application of PGRs resulted in no inhibition of enzymes in the soil compared to the control (PGRs0).

1. Introduction

Plant growth retardants (PGRs) serve an important role in integrated cereal production, and their main task is to shorten and stiffen the stems [1]. According to Rademacher [2], the role of several main PGRs is to inhibit gibberellin biosynthesis at an early stage (e.g., chlormequat chloride (CCC) and mepiquat chloride), or at a later stage (e.g., trinexapac-ethyl (TE) and prohexadione-Ca), or to release ethylene (e.g., ethephon). In this way, they prevent lodging, i.e., a permanent inclination of the canopy or its part. In the soil, CCC is adsorbed on soil particles, which provides it with temporary protection against chemical and microbiological degradation. For this reason, it may pose a potential risk to the environment [3].
The application of PGRs affects plant metabolism by inducing abiotic stress [4]. They can alter plant metabolism, leading to the inhibition or promotion of plant secondary metabolites (PSM). PGRs can affect the levels of PSMs, such as phenolic compounds (TP) responsible for the antioxidant potential of plants, through nonspecific mechanisms or by interfering with the key biosynthetic stages. Moreover, PGRs are able to modulate plant metabolism by affecting the rate of micronutrient assimilation. Full assessment of the effects of PGRs on PSM requires knowledge of the biochemical and physiological responses of plants [5].
Altuntaş et al. [6] concluded that due to their nonselective character, PGRs affect several components of the ecosystem, including pests and beneficial insects. Studies by Giron et al. [7] demonstrated modifications of insects’ behaviour in the phytophage–host plant interaction. Gupta et al. [8] tested two PGRs (chlormequat chloride and mepiquat chloride) for their effects on the survivability and development of the larvae of the butterfly Spilarctia obliqua Walker (Lepidoptera: Arctiidae). They concluded that PGRs considerably reduced larval survivability at concentrations higher than the doses indicated on the label. No impact on the butterfly larval development period was demonstrated. The PGRs applied to winter wheat also showed a negative effect on aphid parasitoids. True bugs (Hemiptera) fed on plants treated with PGRs were parasitised to a lesser extent than true bugs fed on control plants [9].
Nitrogen (N) is the most important plant nutrient, is crucial for plant growth and development, and influences the yield and quality of field crops such as wheat (Triticum aestivum L. ssp. aestivum). A factor that strongly influences the content of PSM, including phenolic compounds, is the level of plant nutrition with nitrogen, as polyphenols are formed in the phenylpropanoid pathway from aromatic amino acids. The aim of PSM accumulation in plants is to ensure the structural and functional stability of plants [10,11]. A study by Prescott et al. [12] demonstrated that PSM is produced in plants with a reduced nitrogen content, mainly to remove excess carbon. Root secretions contain more of the elements that plants have in excess and less of those that are in short supply.
A study by Hu et al. [13] demonstrated that the protective effect of multifunctional plant secondary metabolites (PSM) against the main pests is determined by the chemical composition of the soil. Many plant secondary metabolites protect plants against herbivorous insects by acting as toxins, digestibility reducers, and/or repellents [14]. The soil environment can affect plant defence expression and the interactions between plants and herbivores. Nutrients in the soil are able to reprogramme plant defences through mutual communication between the defence and signalling [15] or by affecting soil microorganisms that modulate plant defence responses [16]. Phenolic compounds are leached out from green leaves and reach the soil with root secretions. Some of them (e.g., tannins) can be toxic to microorganisms and inhibit enzyme activity. This affects both the C and N transformations in the soil [17] and the humification processes in which phenolic compounds play a significant role [18,19].
Nitrogen has an effect on all levels of tritrophic interactions, e.g., the quality of a plant as food for a phytophage, and also on their natural enemies. Pests respond differently to nitrogen provided to plants. There were noticeable changes in the selection of food at the time of foraging and food acceptance following the onset of feeding until changes in pest fecundity, behaviour, foraging rate, and survivability [20,21].
To date, the effects of numerous groups of phenolic compounds on the feeding and development of insects have been investigated [22,23,24]. One of the most important properties of these plant allelochemicals is their antifeedant action. These compounds reduce the growth and development of insects and influence their behaviour [25]. A study by Lamparski [26] showed that short-term (2-day) damage to barley plants did not result in significant variation in the total phenolic compound content as compared to the plants subjected to no damage.
The application of mineral fertilisers plays a crucial role in the improvement and regulation of nutrient levels in the soil. However, the intensive use of mineral nitrogen fertilisers has resulted in increased N deposition in recent times. This results in soil degradation (a reduction in the organic matter content and the pH), water pollution, increased nitrate leaching, and the production of reactive N compounds [27,28]. A reduced organic matter content due to increased rates of nitrogen fertilisation may be a consequence of the reduced root mass of plants [29]. Sustainable nitrogen fertilisation has a positive effect on crop yields and increases the weight of crop residues, and, consequently, contributes to an increase in the organic matter content in soils [30]. Not only do the weight and chemical composition of harvest residues determine the organic matter content but also their fractional composition, i.e., the content and proportion of dissolved organic matter (DOM) and the humic (HA) and fulvic (FA) acid fraction as well as the humin (h) fraction [31,32]. According to the literature reports [33,34,35], the dynamics of changes in the (DOM) content in soils are not unambiguous and do not depend on the rate of mineral fertilisation applied. Mineral (mainly nitrogen) fertilisation may reduce the dissolved organic carbon (DOC) content through the stimulation of microbial activity, which in turn contributes to an increase in the consumption of soluble organic carbon compounds [36] or an increase in the content due to intensified processes of the microbial decomposition of both soluble and more stable organic matter fractions: HAs, FAs, and H [33].
The biogeochemical properties of soils (pH, the redox potential, dissolved organic carbon, loam content, Fe/Mn/Al oxides, and biological activity) are directly responsible for the mobility and bioavailability of the risk elements [37]. Nitrogen fertilisation affects, for example, the rate of organic carbon decomposition in the soil through the regulation of enzyme activity [38]. Oxidoreductases are nonspecific enzymes and are often produced not to directly acquire nutrients but rather to degrade humic complexes or toxic substances such as phenols [39]. Soil enzymes are incorporated into the cycle of elements (C, N, P, S) and affect the efficiency of the use of natural, organic, and mineral fertilisers [40,41,42]. They are, therefore, considered indicators or predictors of organic carbon decomposition and nutrient mineralisation as well as indicators of the soil quality status. The extracellular enzymes comprise the classes of oxidoreductases and hydrolases and decompose substrates of varying composition and complexity. Oxidoreductases oxidise soil phenols to quinones which can bind with amino acids, polymerise into soil humus, and transform other soil organic compounds. Enzyme responses to N fertilisation showed differences in both the direction and the magnitude. According to [38], nitrogen fertilisation significantly increased the activity of β-d-cellobiosidase, acid phosphatase, β-1,4-xylosidase, β-1,4-glucosidase, α-1,4-glucosidase, and urease by 6.4, 10.6, 11.0, 11.2, 12.0, and 18.6% (p < 0.05), while significantly reducing the activity of peroxidase and phenol oxidase by 6.1 and 11.1%, respectively.
An important task is to determine an optimum N fertilisation rate that would satisfy the nutritional needs of plants without leading to a significant yield reduction but would induce mechanisms leading to PSM synthesis. Currently, there are no studies assessing the effect of PGRs on the properties of soil, which consequently determine the growth and development of crops.
Therefore, the research hypothesis assumed that the application of plant growth retardants and nitrogen fertilisation would modify the activity of multifunctional plant secondary metabolites in wheat, thus affecting the intensity of insect pest feeding. Furthermore, it was assumed that the factors applied could affect the basic soil quality parameters.
The aim of this study was to assess the effect of plant growth retardants and different nitrogen fertilisation rates on the content of selected plant secondary metabolites in Indian dwarf wheat (Triticum sphaerococcum Percival) of the Trispa cultivar and on the abundance of insect pests. This study also assessed the role played by the experimental factors applied in shaping the physicobiochemical properties of the soil.

2. Materials and Methods

2.1. Experiment Design

The experiment was set up at the Research Station in Mochełek, Kujawsko-Pomorskie Voivodeship, Poland (53°13′ N; 17°51′ E). All tests were carried out in 2018–2020, at the beginning of June in the flag leaf stage of spring wheat (BBCH 39). The soils at the experimental sites were characterised as Alfisol [43]. The forecrop was winter triticale (Triticosecale Wittmack). Immediately after harvesting the forecrop, garden pea (Pisum sativum L.) was sown as the winter catch crop. Immediately before winter, prewinter ploughing was performed on the last days of November. In spring, presowing fertilisation was conducted on the first days of April at the rates of 30 kg ha−1 P2O5, 50 kg ha−1 K2O, and nitrogen at rates according to the second-factor levels. This study focused on Indian dwarf wheat (Triticum sphaerococcum Percival) of the Trispa cultivar. It was sown on the first days of April, having assumed a sowing density of 600 plants per m2 and the current parameters of the seeds (weight of a thousand grains and germination capacity). Since this species produces rather long generative stems (87–90 cm) [44], it is advisable to shorten them.
The first experimental factor was the type of plant growth retardants applied at the beginning of the stem elongation stage: a mixture of chlorocholine chloride at a rate of 720 g a.i. ha−1 with trinexapac-ethyl (TE) at a rate of 75 g a.i. ha−1 (PGR1) or with ethephon at a rate of 255 g a.i. ha−1 (PGR2), and a PGR0 treatment with no application (control). The second factor was the rates of fertilisation with nitrogen: 0, 20, 40, and 60 kg N ha−1, applied as ammonium nitrate. Nitrogen at rates of 20 and 40 kg ha−1 was applied once presowing, while the rate of 60 kg N ha−1 was divided into two equal parts, of which one part was applied presowing and the second part for top dressing at the end of the tillering stage/the beginning of the stem elongation stage (in mid-May). The experiment was established in the split-plot design (randomly selected sub-blocks), in four replicates, with plots measuring 22 m2.

2.2. Methods

2.2.1. Secondary Metabolites and Antioxidative Capacity in Plants

Freeze-Drying and the Preparation of Extract from the Above-Ground Part of Wheat

For the freeze-drying process, the above-ground part of wheat plants was designated. The wheat samples (200 g) were initially frozen in a Whirlpool AFG 6402 E-B freezer (Italy) to a temperature of −22 °C. Sublimation drying was conducted in a CHRIST ALPHA 1–4 LSC device (Germany) at the following freeze-dryer operating parameters: a condenser temperature of 55 °C, vacuum 4 kPA at 20 °C. The wheat samples were dried to a constant weight. The final moisture content in the material was less than 2%. Drying was continued for 24 h.
The extracts for the determination of total polyphenolic (TP) compounds and FRAP were prepared by weighing 1 g of comminuted freeze-dried plant material and carrying out extraction using 10 mL of MeOH. The obtained extracts were protected and stored in sealed glass containers at a temperature of −22 °C.

Determination of Total Polyphenolic Compounds

A 0.3 mL volume of the extract was placed in a glass test tube, and 0.7 mL distilled water was added. An amount of 5 mL of the Folin–Ciocâlteu reagent (0.2 N) (Chempur, Piekary Śląskie, Poland) was then added, and after 3 min, 4 mL of sodium carbonate (75 g mL) (POCH S.A., Gliwice, Poland) was added. The whole was thoroughly vortexed. The samples were incubated for 1.5 h at room temperature (21 °C) in the absence of light. Absorbance was measured at a wavelength of 735.8 nm using a Shimadzu UV-1800 Vis 25 spectrophotometer (Kyoto, Japan). The total phenol content was determined from the calibration curve prepared for gallic acid equivalents (Sigma-Aldrich, St. Louis, MO, USA). The above procedure was followed in accordance with the modified method as proposed by [45].

Determination of Antioxidant Capacity Using the FRAP (Ferring Reducing Ability of Plasma) Method

The determination of antioxidant capacity by the FRAP method was conducted by the method developed by [46]. Absorbance was measured using a SHIMADZU UV-1800, UV-Vis Spectral Photometer System. Immediately before the test, a ‘FRAP’ working solution was prepared by mixing 250 mL of acetate buffer (POCH) with a pH of 3.6 with 25 mL of the TPTZ (2,4,6-Tris(2-pyridyl)-s-triazine) solution (Sigma Aldrich) and 25 mL of iron(III) chloride hexahydrate solution (Chempur). The solution obtained was incubated at a temperature of 37 °C. Then, 6 mL of the ‘FRAP’ solution was drawn, and 200 μL of the (extract) sample and 600 μL of H2O were added to it. Four minutes after adding the sample, absorbance was measured at a wavelength of 593 nm.

Determination of Chlorogenic Acid

The chlorogenic acid content was determined by the colorimetric method of [47], using sodium nitrate for the reaction. Freeze-dried powder from the above-ground part of wheat (200 mg) was placed into a centrifugal flask and vortexed with 2 mL of urea (0.17 M) and acetic acid (0.10 M). Subsequently, 1 mL of sodium nitrate (0.14 M) and 1 mL of sodium hydroxide (0.5 M) were added and vortexed again, and the solution was then incubated at room temperature for 2 min. The obtained suspension was centrifuged at 2250 rpm. for 10 min (Hettina Zentrifugen, Rotina 420 R, Westphalia, Germany). An aliquot of the supernatant was collected, and the absorbance of the red solution coloured complex formed was measured at 510 nm (SHIMADZU UV-1800, UV–Vis Spectral Photometer System).

2.2.2. Insect Experiments

The entomological part of this study involved trapping insects using an entomological net [26,48] during all four replicates of the experimental factors subjected to analysis. The operation was performed at the flag leaf stage of spring wheat (BBCH 39). The results are presented as the density of selected pest groups per plot area unit (22 m2)—11 entomological net strikes were always performed (1 strike = 2 m2 of experimental plots). The insects were identified using an insect identification key: Müller [49], Zawirska [50], Warchałowski [51].

2.2.3. Basic Soil Parameters

Soil pH and the Content of Clay, Carbon, and Nitrogen in the Soil

Samples were collected from each experimental treatment using Egner’s sampler from the topsoil layer of 0–20 cm. The samples were dried and sieved through a 2 mm mesh sieve. For air-dried soil samples, the following analyses were made:
The clay content using a Mastersizer MS 2000 (Malvern Panalytical, UK) laser particle size analyser;
The pH value in 1 M KCl—by the potentiometric method [52];
The content of total organic carbon (TOC) and total nitrogen (TN) expressed in g kg−1 of d.w. of soil was analysed with a Vario Max CN analyser supplied by Elementar (Langenselbold, Germany);
The content of dissolved organic carbon (DOC) and dissolved nitrogen (DN) were assayed in solutions from an extraction of soil sample using 0.004 mol dm−3 CaCl2, at a soil sample-to-extractant ratio of 1:10 (the extraction took 1 h). The contents of DOC and DTN were assayed using an Analityk Jena Muli N/C 3100 analyser and expressed in mg kg˗1 d.w. of soil sample and as a percentage proportion in the pool of TOC and TN, respectively.

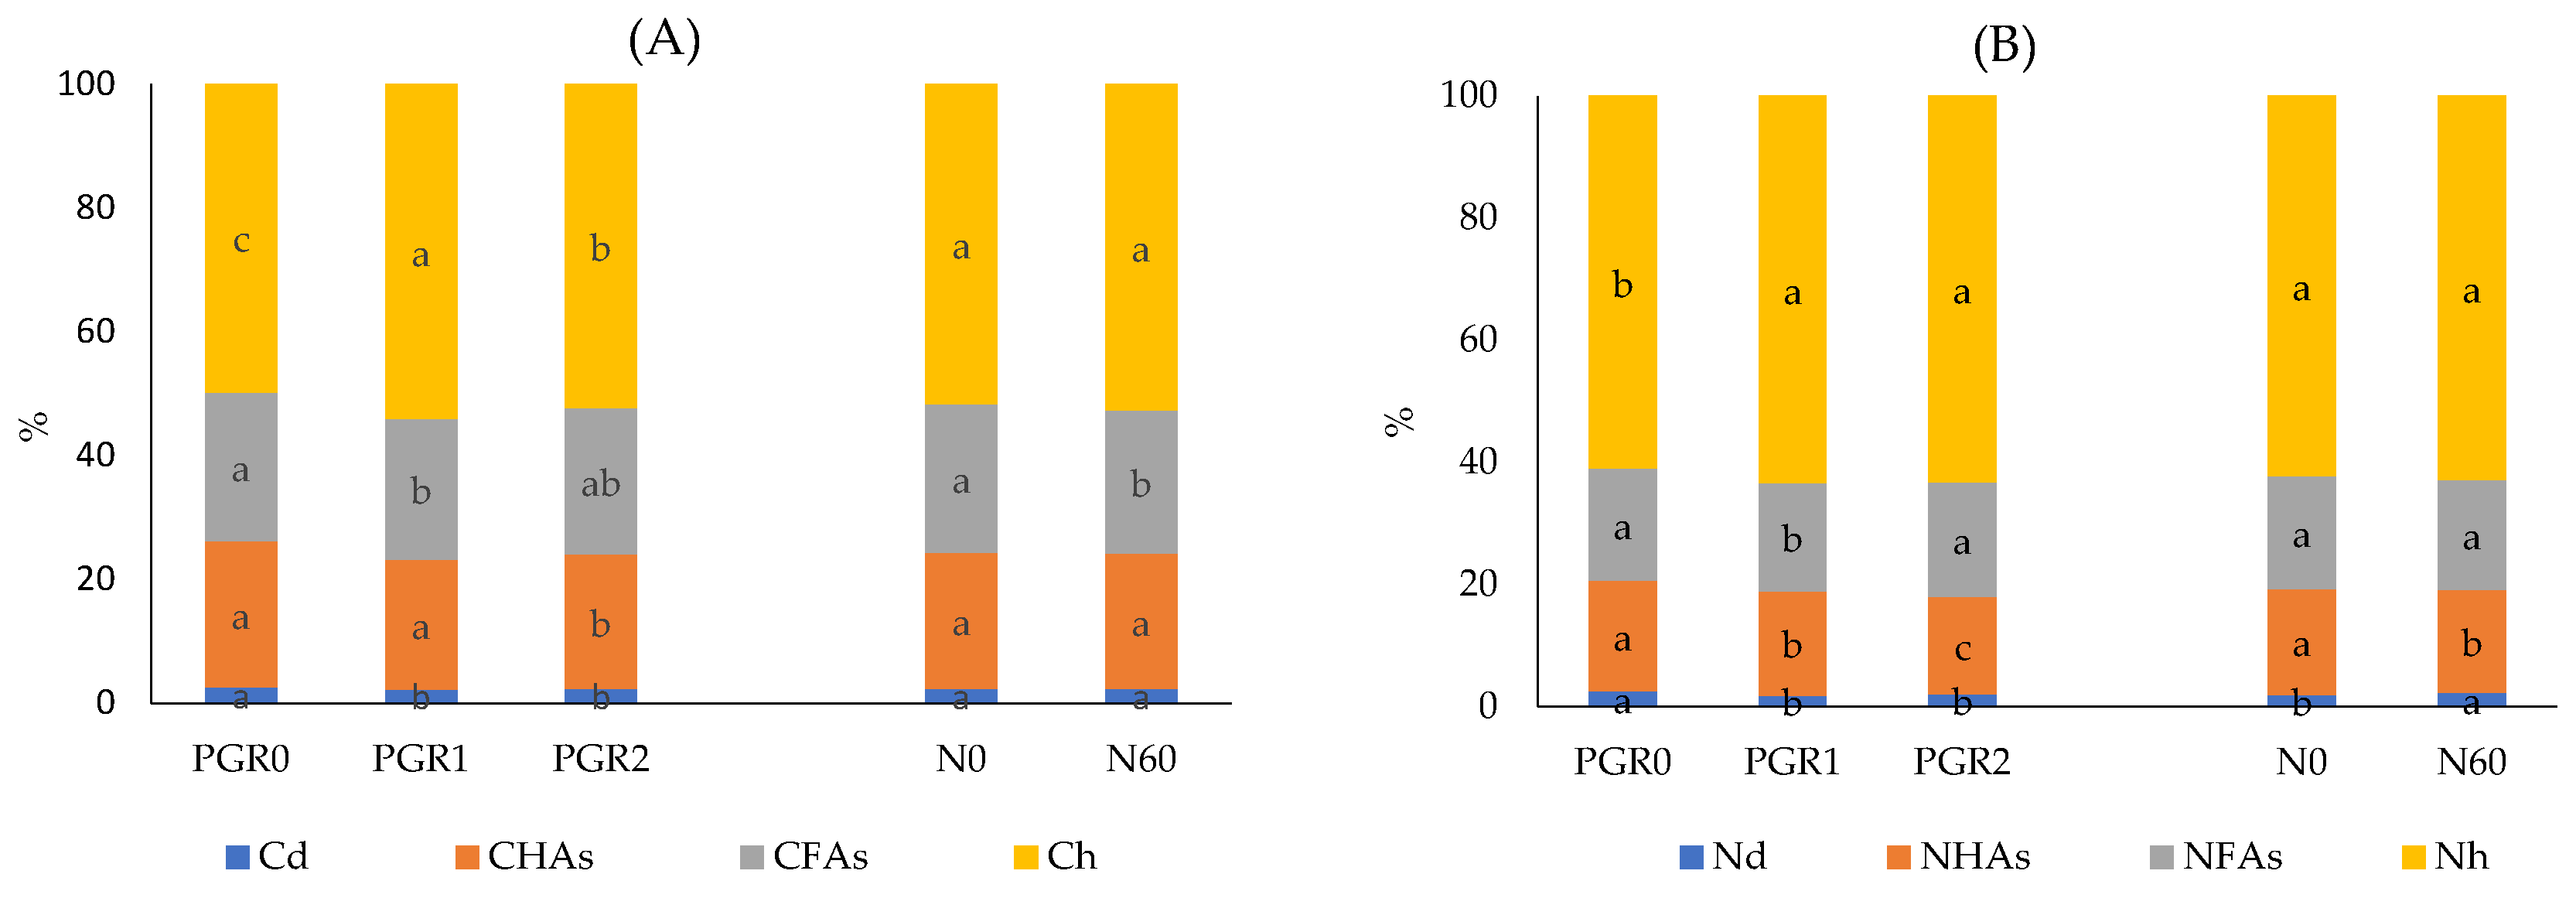
Fractional Composition of Humus and Isolation of Humic Acids

In the absence of significant differences in the TOC content between the treatments N0, N20, and N40, the fractional composition was determined by the soil samples collected from the treatments N0 and N60.
The fractional composition of humus was assayed based on the carbon (nitrogen) fractions determined in the extracts using a Multi N/C 3100 from Analityk Jena (Jena, Germany), according to the following procedure [53]:
Decalcification (24 h) with 0.05 M HCl (1:10 w/v), Cd, (Nd)—carbon (nitrogen) in solutions after decalcification;
Extraction (24 h) of the remaining solid with 0.5 M NaOH (1:10 w/v) with occasional mixing, followed by centrifugation; C(N)HAs + FAs—the sum of the carbon (nitrogen) of humic and fulvic acids.
The carbon (nitrogen) content of humic acids (C(N)HAs) and carbon (nitrogen) of humins (C(N)H) were calculated from the difference:
C(N)HAs = C(N)HAs + FAs − C(N)FAs
C(N)h = TOC(TN) − C(TN)HAs + FAs − C(N)d
The fractional composition was expressed in mg kg˗1 of dry matter of soil sample and as a % proportion of respective fractions in the TOC (TN) pool.

Extraction and Determination of Phenolic Compounds in Soils

An amount of 5 g of air-dry soil sample was poured over with 20 cm3 of 2 M NaOH and left for 24 h at room temperature. The extract was centrifuged, the solution was decanted off the precipitate, and 6 M HCl was then added to obtain the pH = 2.5, and it was then filtered through a 0.45 mm PVDF syringe filter.
The extract was assayed using a high-performance liquid chromatographer HPLC Series 200 by Perkin–Elmer (Shelton, CT, USA) equipped with an FL detector. An analytic column, Bionacom Velocity STR (Genore Chromatography, Warsaw, Poland), with 5 µm in particle diameter and 250 × 4.6 mm in size was used. The mobile phase consisted of eluent A: H2O:CH3CN:CH3COOH (88.5:10:1.5% V); and eluent B: CH3CN; the injection of the sample was 10 μL; gradient separation programme was used at the flow rate of 1.3 mL min−1; detection—at the excitation/emission wavelength (λex/λem) of 270/330 nm; analysis time—44 min.
The phenolic compounds were identified based on the chromatogram course for the phenolic compound standard solution. The quantitative analysis of the identified phenolic compounds was conducted using calibration curves of the relationship between the peak area and the phenolic compound concentration (mg mL−1). This study provides the chlorogenic acid content and the sum of the phenolic compounds identified [19,54,55].

Activity of Enzymes in the Soil

The enzymatic activity was determined in fresh, moist, and sieved (<2 mm) soil. The activity of selected enzymes belonging to the oxidoreductase class was investigated.
The catalase (CAT) activity was investigated by the amount of purpurogallin (PPG) formed by the oxidation of pyrogallol in the presence of H2O2. The absorbance of the solution was measured colorimetrically at λ = 460 nm using a spectrophotometer [56].
The activity of dehydrogenases (DEH) was investigated by the Thalmann method [57] after incubation of the sample with 2,3,5-triphenyltetrazolium chloride and measurement of triphenylformazan (TPF) absorbance at 546 nm and expressed in mg TPF kg−1 24 h−1.
The activity of peroxidases (PER) was determined according to Barth and Bordeleau [58] by measuring the amount of purpurogallin (PPG) produced by oxidation of pyrogallol in the presence of H2O2.

2.3. Statistical Analyses

The obtained results were analysed statistically using the STATISTICA 13 software (Stat Soft Polska). A two-way (ANOVA) analysis of variance for the split-plot design was performed to determine the effect of plant growth retardants (I factor) and nitrogen doses (II factor) as well as the interaction (plant growth retardants × nitrogen doses) on the variation in the studied parameters in plant and soil, and the abundance of insects. The results were expressed as the arithmetic mean ± standard deviation (SD). Tukey’s post hoc test was applied to identify significant differences between the mean values. In order to better understand the relationship between the parameters under study, this study applied multivariate statistical methods: principal component analysis (PCA) and the cluster analysis (CA) method. PCA enables a reduction in the number of variables describing a particular object and an indication of the effect of the primary variables on the principal components as well as mutual correlations between the primary variables. The results of the analysis are provided in the form of a figure showing the characteristics in the arrangement of three initial principal components (PC1, PC2, and PC3), which represent the mutually correlated variables in a synthetic manner. CA enabled the separation of groups of objects based on the variation of variables [59].

3. Results and Discussion

3.1. Secondary Metabolites and Antioxidative Capacity in Plants

The content of the plant secondary metabolites (PSM) under study increased significantly following the application of plant growth retardants (PGRs) (Table 1). This may be due to the fact that there was a significant increase in the synthesis of these chemical compounds as a result of the abiotic stress induced by the application of PGRs [60]. However, researchers’ opinions on this topic are inconclusive. Liao et al. [61] and Karimi et al. [4] concluded that the application of PGRs reduces the PSM content. According to those authors, the application of PGRs enhances other biochemical reactions in the plant, which are distant from secondary metabolism. The authors’ own study concluded that the content of phenolic compounds (TP and ACH) increased following the application of mineral nitrogen. A significant increase in the content of these phenolic compounds was achieved following the application of N at a rate of 60 kg ha−1. It should be noted that a dose of 20 kg N ha−1 was already sufficient to significantly increase the concentration of the phenolic compounds under study. This is in line with reports by the authors [62], who obtained an increase in the concentration of insoluble ferulic acid and vanillic acid under the influence of increased N doses (from 180 to 300 kg N ha−1). In contrast, a different opinion was expressed by Tian et al. [63], who concluded that increasing N doses decreased the concentration of soluble phenolic acids. This is due to the carbon and nutrient balance which assumes a reduction in the amount of carbon-rich PSM by increasing the availability of N [64]. In addition, according to [65], insoluble phenolic compounds appear to be less susceptible to the volume of N doses. According to [66], the phenolic compound content is genetically determined. This may explain the fact that in the test plant, they were susceptible to the volume of N doses. The ANOVA demonstrated that the TP and ACH content in wheat was significantly determined by the PGRs applied (Table 1). The highest content of the compounds under study was exhibited by wheat following the application of CCC + ET: 3.70 and 1344 µg g−1, respectively. Importantly, the application of these growth regulators contributed to a greater TP and ACH accumulation as compared to their content following the application of CCC + TE. This result is consistent with those of the previous studies by [64,67], which found an increase in soluble phenols with the development of wheat. The application of PGRs can increase biomass and alter the PSM distribution in the plant. In general, no clear effect of the application of PGRs on the PSM content in plants was demonstrated. Although PGRs inhibit plant growth, beneficial effects were observed in the plant, especially when exposed to abiotic stresses [4].
The FRAP parameter for wheat was significantly higher following the application of nitrogen at a rate of 40 and 60 kg ha−1 (7.902 and 8.076 mM Fe2+ kg−1) as compared to the control. It should be noted that the application of nitrogen at a rate of 40 kg ha−1 was sufficient to increase the oxidative potential. In a study by another author [64], the potential oxidative value in wheat did not increase following the application of higher N doses. According to [62,68], the total phenolic and total flavonoid content in wheat increased with an increase in nitrogen fertiliser application. It was found that each of the PGRs applied significantly increased the antioxidant potential in wheat plants, with the highest FRAP value noted for wheat following the application of CCC + ET (8.353 mM Fe2+ kg−1). This is due to the significant contribution of TP in the antioxidant action of cereals. Mikulajova et al. [69] and Pobereżny et al. [70] obtained a high correlation between the antioxidant activity and the total TP content in wheat. Wang et al. [71] and Karimi et al. [4] concluded that the application of CCC increased the antioxidant enzyme activity, although these studies concerned the potato. A similar effect was demonstrated in a study involving stevia [4].

3.2. The Density of Insects in Spring Wheat Plants

An analysis was conducted on the incidence of the insect pests of most importance to wheat. For Oulema spp. and Thripidae, an average of 5 insects were trapped on a 22 m2 plot; for Aphididae, 20 insects were trapped (Table 2).
On the plots on which CCC + ET were applied, the greatest numbers of Oulema spp. were trapped as compared to the control and the CCC + TE treatment. As for Aphididae, greater abundance was noted on the plots on which retardants (CCC + TE or CCC + ET) were applied, as compared to the control. On the other hand, Thripidae were trapped most abundantly in the control. Zhao et al. [9] report that PGRs did not affect the development but had a negative effect on fecundity and internal indicators of the natural growth of Sitobion avenae (Hemiptera, Aphididae) on winter wheat plants. On the other hand, Cottrell et al. [72] concluded that the application of PGRs to pecan leaves delayed development and had a negative effect on the increase in the aphid population.
The authors’ own study concluded that the harmful Oulema spp. were significantly most abundant on the plants fertilised with a nitrogen rate of 60 kg ha−1. On the other hand, aphids were most abundant in plants not fertilised with nitrogen. Similar to the cereal leaf beetles, Thripidae were also most abundant on the plants fertilised with the highest nitrogen dose. Studies by Schutz et al. [73], and Kang et al. [74] demonstrated that large amounts of nitrogen fertilisers could increase the abundance of aphids on wheat. Aqueel and Leather [75] and Long et al. [76] reported that the population size, fecundity, and longevity of aphids (Rhopalosiphum padi L. and Sitobion avenae F.) were greater at higher nitrogen fertiliser doses. Nitrogen fertiliser had a positive effect on weight, fecundity, and longevity, particularly for S. avenae.

3.3. Soil Properties

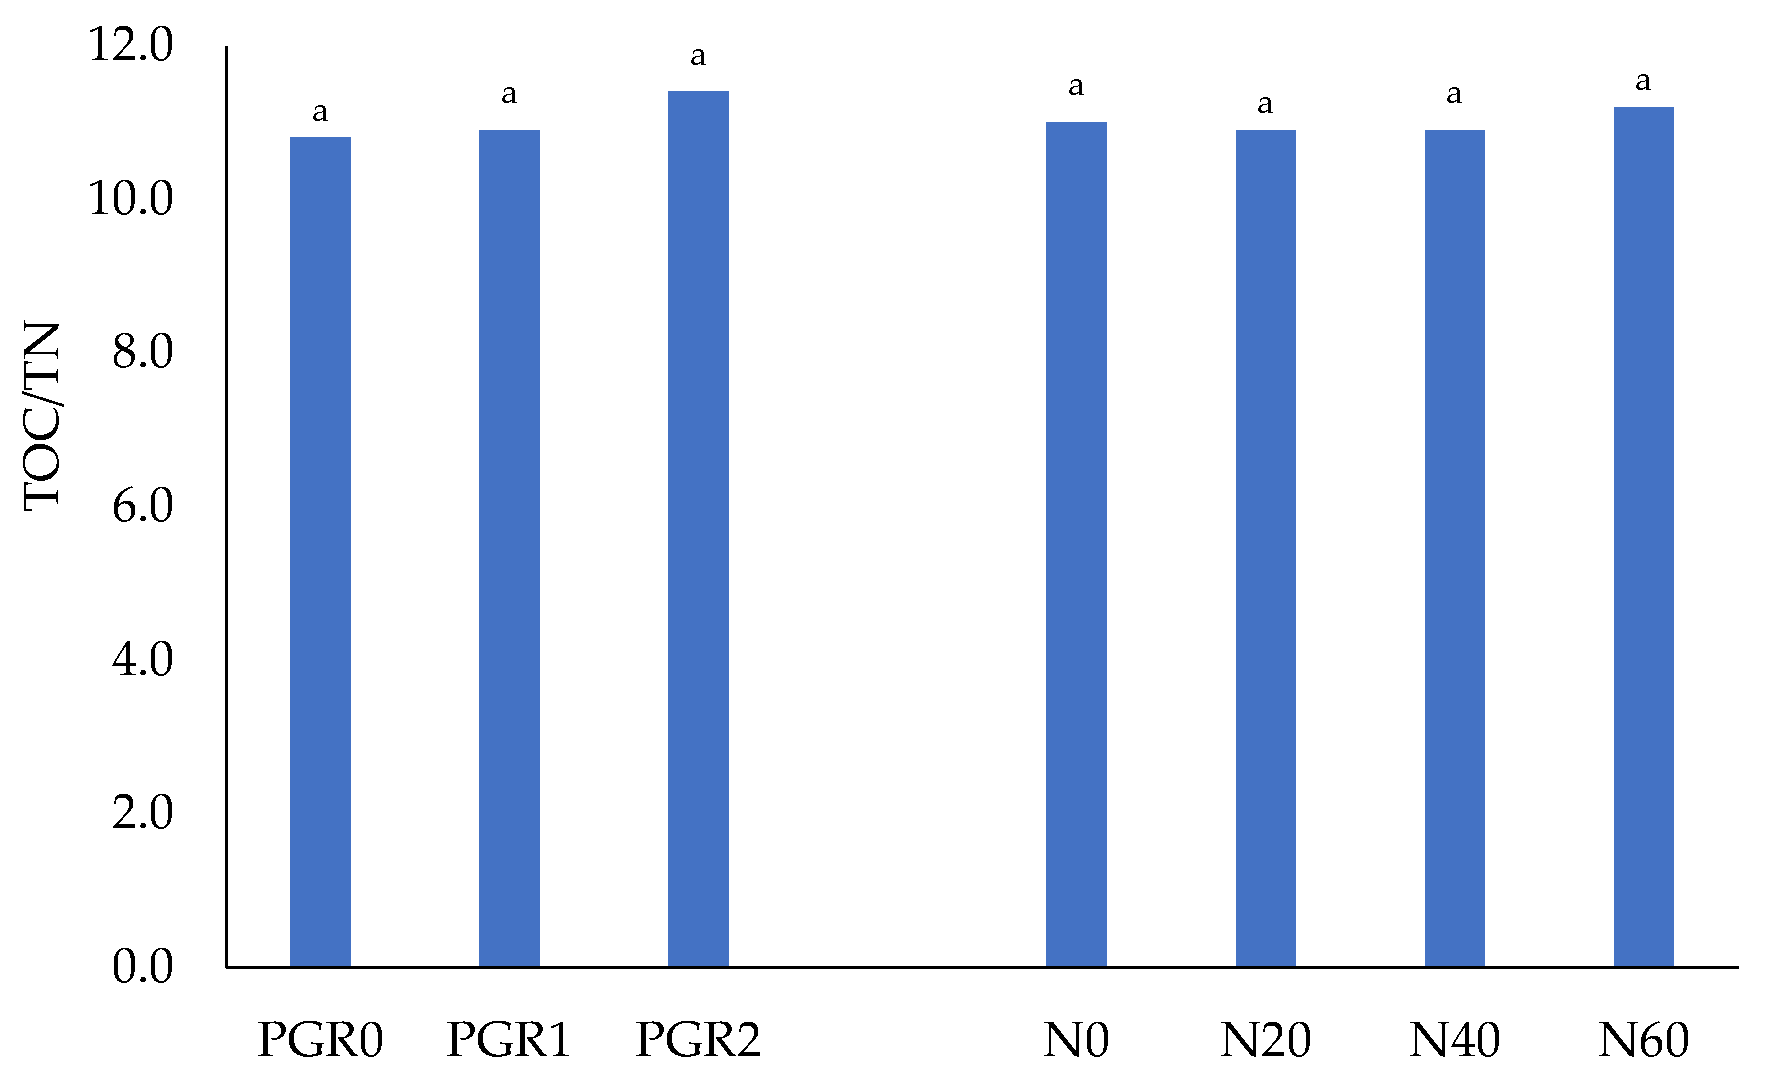
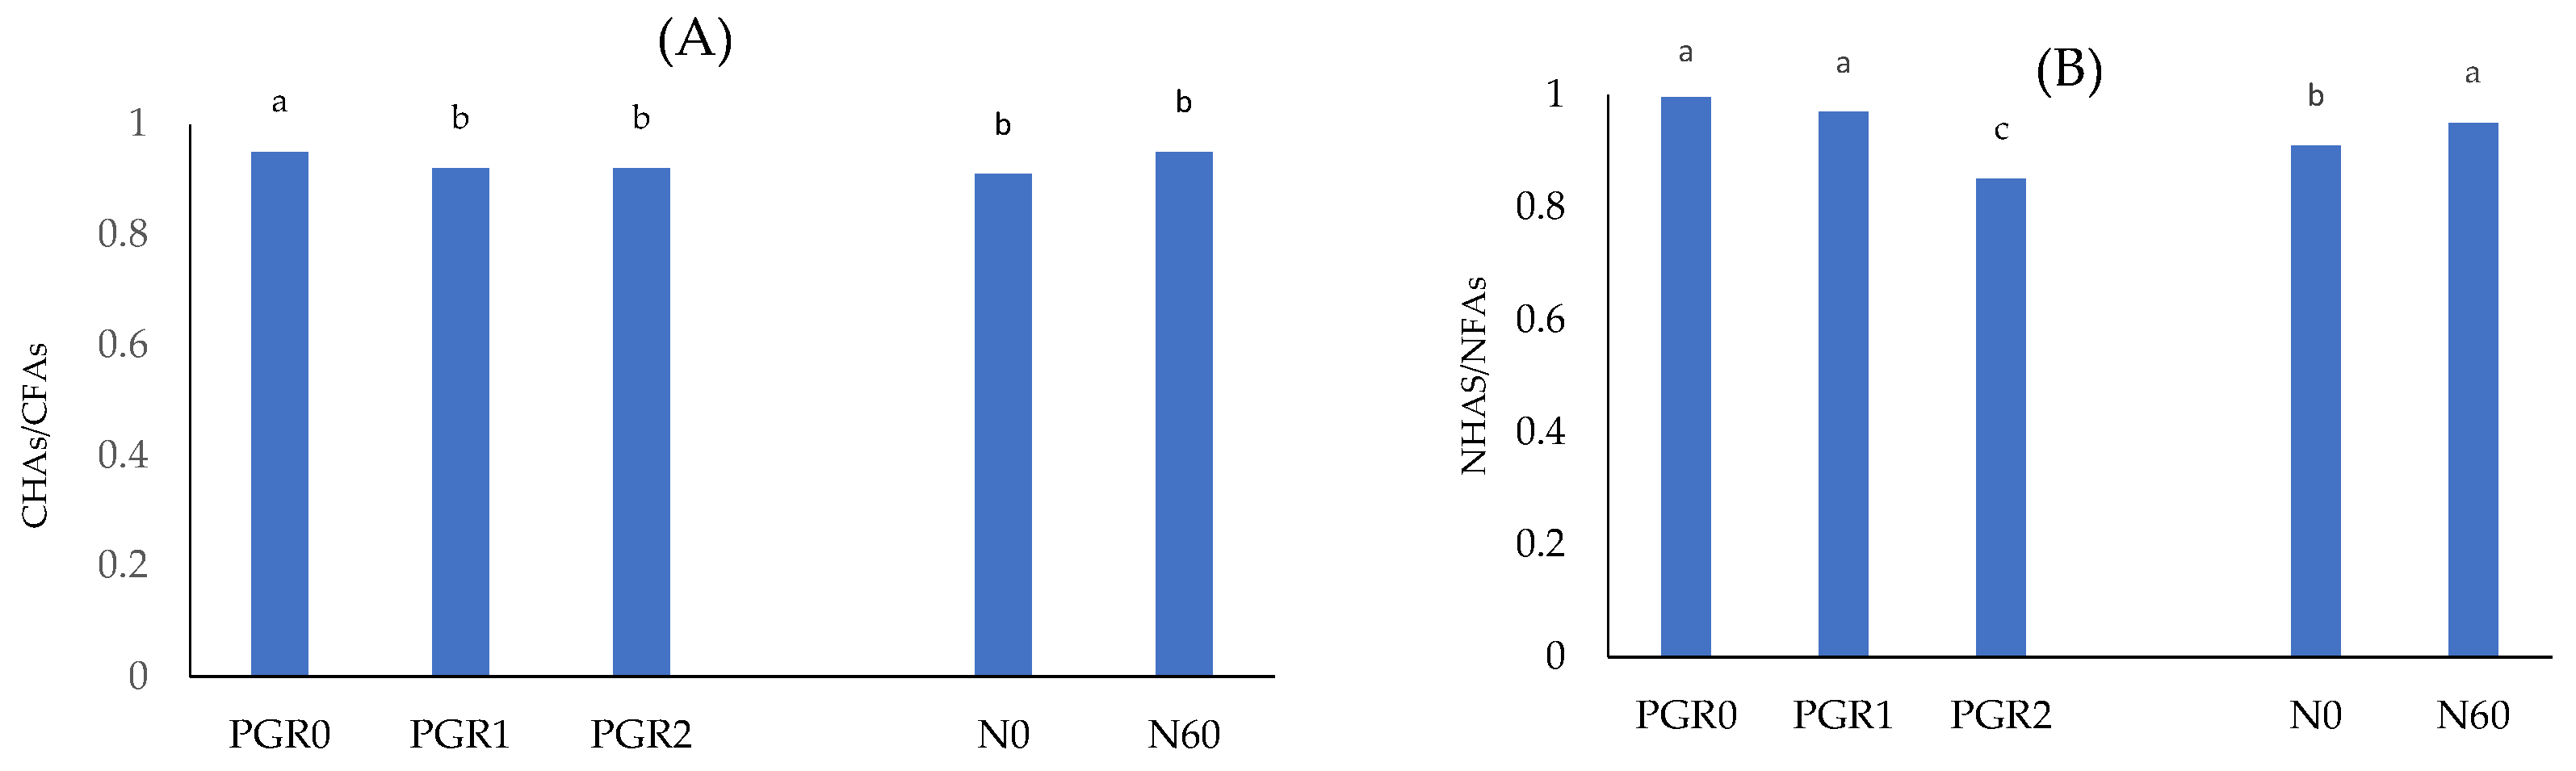
3.3.1. Properties of Soil and Organic Matter

An analysis of the granulometric composition showed that the soil samples under study were characterised by a similar content of the clay fraction (Table 3). Based on the USDA [43] classification, all the soil samples under study were classified into one granulometric group, i.e., sandy loam. The pH value of the samples under analysis was close to neutral and ranged from 7.14 to 7.35.
One of the basic indicators of soil fertility is the content of organic matter, which influences its chemical, physical, and biological properties. In the soil samples under analysis, the TOC content ranged from 7.46 to 9.12 g kg−1, and was, on average, higher on the plots on which nitrogen fertilisation was applied at the highest rate and on the plots following the application of retardants (Table 4). The TN content ranged from 0.70 to 0.81 g kg−1, and the factor determining its content was nitrogen fertilisation. The plots fertilised with nitrogen at a rate of 60 kg ha−1 were characterised by a significantly higher TN content as compared to the other ones (N0, N20, N40). No significant changes in the TOC/TN ratio were noted (Figure 1). The TOC/TN values ranged from 10.0 (the PGR1 N20 treatment) to 12.0 (the PGR2 N20 treatment). The obtained TOC/TN values confirm the relationship according to which the TOC/TN ratio in soils is a relatively constant quantity, and standard agrotechnical treatments do not affect its values. This is particularly important for maintaining the balance characteristics of a particular soil type.
One parameter that changes under the influence of the agrotechnical treatments applied is the so-called dissolved organic carbon (DOC). Based on a field study, Chantigny et al. [77] reported an increased DOC content following the application of a nitrogen fertiliser at a rate of 180 kg ha−1. Moreover, they observed instances of the DOC content decreasing with an increase in the nitrogen fertiliser application rate. On the other hand, Zsolnay and Gorlitz [78] concluded that the application of mineral nitrogen fertilisers for a longer time had no significant effect on the DOM content in soils in agricultural use. According to Liu et al. [79], nitrogen fertilisation only results in a temporary increase in the dissolved organic matter (DOM) content due to a change in the pH value of soils. Laboratory tests conducted by Homann and Grigal [80] revealed that the addition of nitrogen resulted in greater DOM release from soils. Embacher et al. [81] are of the opinion that nitrogen fertilisation stimulates an increase in crop biomass which, in turn, contributes to a greater amount of crop residues and, consequently, to an increase in the TOC and TN contents, which increases the DOC and DN contents in the soil.
The DOC content ranged from 91.9 (the PGR2, N60 treatment) to 129.8 mg kg−1 (the PGR1 N60 treatment, Table 2). In general, the influence of the experimental factors on the DOC content cannot be determined unequivocally. Considering the interaction, it can be suggested that an increase in the DOC content can occur following the application of PGR1 (a mixture of chlorocholine chloride at a rate of 720 g a.i. ha−1 with trinexapac-ethyl (TE) at a rate of 75 g a.i. ha−1), and its greatest content is obtained for the PGR1, N60 treatment. The determined DOC content ranged from 1.15 (the PGR2, N60 treatment) to 1.46% of the total TOC content. The interaction demonstrated that the application of PGR1 and nitrogen fertilisation increased the DOC proportion in the soil. The DN content was significantly higher on the plots with PGR1 and on the plots on which the highest nitrogen dose had been applied. The highest proportion of DN in the TN pool was also noted on the plots with the highest nitrogen dose applied. The results obtained suggest that the type of plant protection products applied should also be taken into account when considering the DOM content in soils.
The soil quality and, indirectly, its fertility is largely determined by the content of humic acids (HAs), fulvic acids (FAs), and humins (h). The content (proportion) of these organic matter fractions is modified by the type of fertilisation applied and the selection of plants in crop rotation [31,32]. This study evaluated the extent to which nitrogen fertilisation combined with PGRs affects the content and the proportion of carbon and nitrogen in the humic acid, fulvic acid, and humin fractions (Table 5, Figure 2A,B). Nitrogen fertilisation at a rate of 60 kg ha−1 with PGRs increased the content of the Cd, CHAs, and CFAs fractions as compared to the N0 treatment. No such relationship was noted for the nitrogen content in the fractions concerned. The values of the CHAs/CFAs ratio (Figure 3A) were similar and ranged from 0.89 (the PGR2 N0 treatment) to 0.96 (the R0 N60 treatment), and the values of the NHAs/NFAs ratio ranged from 0.85 (the PDR2 N0 treatment; the PGR2 N60 treatments) to 1.00 (treatments PGR0 N0, R0 N60) (Figure 3B). The CHAs/CFAs parameter is an indicator of both soil fertility and the degree of organic matter humification. Soils with higher values of this ratio are classified as more fertile soils with a higher degree of organic matter humification [82,83]. In addition to the CHAs/CFAs parameter, the humus quality is related to the proportion of particular organic matter fractions. Soil samples of the PGR0 N0 treatment were characterised by the greatest proportion of Cd, CHAs, and CFAs, and the smallest proportion of Ch. N fertilisation increases the proportion of carbon in the humin fraction on the plots on which no plant protection products were applied. The proportion of N in the humic acid fraction ranged from 16.05 (the PGR2 N60 treatment) to 19.32 (the PGR0 N0 treatment), while the proportion of N in the fulvic acid fraction ranged from 17.16 (the PGR0 N60 treatment) to 19.39% (the PGR0 N0 treatment) of the total nitrogen. The highest proportion of nitrogen, analogous to carbon, was noted for the humin fraction within a range from 58.79 to 64.08% TN. Both nitrogen fertilisation and the plant protection products applied increased the proportion of this nitrogen fraction.

3.3.2. The Content of Phenolic Compounds in Soils

The main role in the formation of humic substances in soils is served by phenolic compounds which are a component of lignins and plant flavonoid compounds and products of microbiological biosynthesis from aliphatic substrates [84]. As reported, e.g., by Ziółkowska et al. [19], the phenolic compound content decreases with an increase in the degree of organic matter humification. The phenolic compound content in the soil under study was low and ranged from 55.11 to 75.33 mg g−1 (Table 6). In comparison, Ziółkowska et al. [19] determined the phenolic compound content in meadow soils in the range from 470 to 854 mg g−1. This was related to the high soil abundance of organic matter and the degree of soil humification. The chlorogenic acid (ACH) content was lower following the application of PGRs (PGR1, PGR2) as compared to the soil with no PGRs (PGR0). Statistically significant nitrogen fertilisation increased the ACH content following the application of PGR2. It should be stressed that similar trends of change were noted for the content of phenolic compounds, including ACH, in the plant.

3.3.3. The Activity of Enzymes in the Soil

This study and the ANOVA results indicate significant changes in the activity of catalase, dehydrogenases, and peroxidases in the soil under the influence of the experimental factors applied (plant growth retardants and nitrogen doses) and their interaction (Table 7). The intensity and direction of the observed changes were dependent on the enzyme type, which is related to the individual resistance of enzymes to biotic and abiotic factors. Catalase is an important cellular antioxidant enzyme that protects against oxidative stress and catalyses the breakdown of hydrogen peroxide to H2O and O2 [42].
The significantly highest activity of DEH (0.509 mg TPF kg−1 24 h−1) and PER (1.727 mM PPG kg−1 h−1) was obtained in the soil in the PGR1 N60 treatment. However, the highest CAT activity (0.657 mg H2O2 kg−1 h−1) was noted in the PGR2 N60 treatment.
The application of PGRs significantly influenced the changes in the activity of oxidoreductive enzymes in the soil. A statistically significant higher activity of CAT, DEH, and PER was obtained in the soil following the application of PGR1 and PGR2 as compared to the control (PGR0). The impact of this factor, however, was smaller than that for N fertilisation. However, a study by Holik et al. [85] showed that ET (ethephon), CCC (chlorocholine chloride), and BAP cytokinin inhibited the proteolytic activity of the soil. Those authors, however, indicate the absence of similar studies in the scientific literature. Guo et al. [86] concluded that CCC in the soil exhibited moderate persistence, with a half-life of 13–34 days. A study by Cycoń et al. [3] showed that mineralisation resulted in rapid dispersion of CCC in soils, regardless of their texture. The relatively large number of bound CCC residues was probably linked to the strong affinity for soil components.
A statistically significant higher activity of the enzymes under study was noted for the application of N fertilisation as compared to the control soil. The statistically highest activity of CAT (0.641 mg H2O2 kg−1 h−1) and PER (1.669 mM PPG kg−1 h−1] in the soil was noted following the application of the highest N rate (60 kg N ha−1). Lower rates did not differentiate the PER activity significantly. Similar results were presented by Wang et al. [87]. As reported by Zhou et al. [88], an increase in peroxidase activity may be due to the addition of nitrogen, which promotes microbial genera with known pathogenic characteristics. The CAT activity was the lowest at N0 and N20. For these treatments, no significant differences between the CAT activity in the soil were noted. According to Dong et al. [89], the deposition of inorganic nitrogen has either an adverse or no effect on the activity of ligninolytic enzymes (phenol oxidase and peroxidase). As reported by Sawicka et al. [90], in the soils on the majority of plots fertilised with nitrogen (N), the activity of enzymes is significantly higher than that in the control soil (with no nitrogen fertilisation), except the rate of 150 kg ha−1 N, which is characterised by the greatest N-NO3 accumulation in the soil. Piotrowska and Wilczewski [91] demonstrated a lower activity of enzymes (-glucosidase, nitrate reductase, arginine deaminase, acid, and alkaline phosphatase) at a rate of 160 kg N ha−1 year−1. However, at a lower N application rate (40 and/or 80 kg N ha−1 year−1), the highest activity was noted. Extracellular enzymes (e.g., phenol oxidase and peroxidase) are widely used to assess the rates of phenol degradation and SOM decomposition with added nitrogen [18]. This study noted the highest significant DEH activity in the soil following the application of N at rates of 20 and 60 kg N. In a study by Rutkowski et al. [92], the highest DEH activity was induced by fertilisation at a rate of 60 kg N ha−1. Increasing the rate to 120 kg N ha−1 reduced the activity. It can be concluded that dehydrogenase activity, as affected by nitrogen fertilisation, was curvilinear and initially showed a significant increase followed by a marked decrease. Sawicka et al. [90] explain that the high DEH activity in the soil with a higher N fertilisation rate could have been due to the greater concentration of the root secretions of the test plant (the sweet potato).

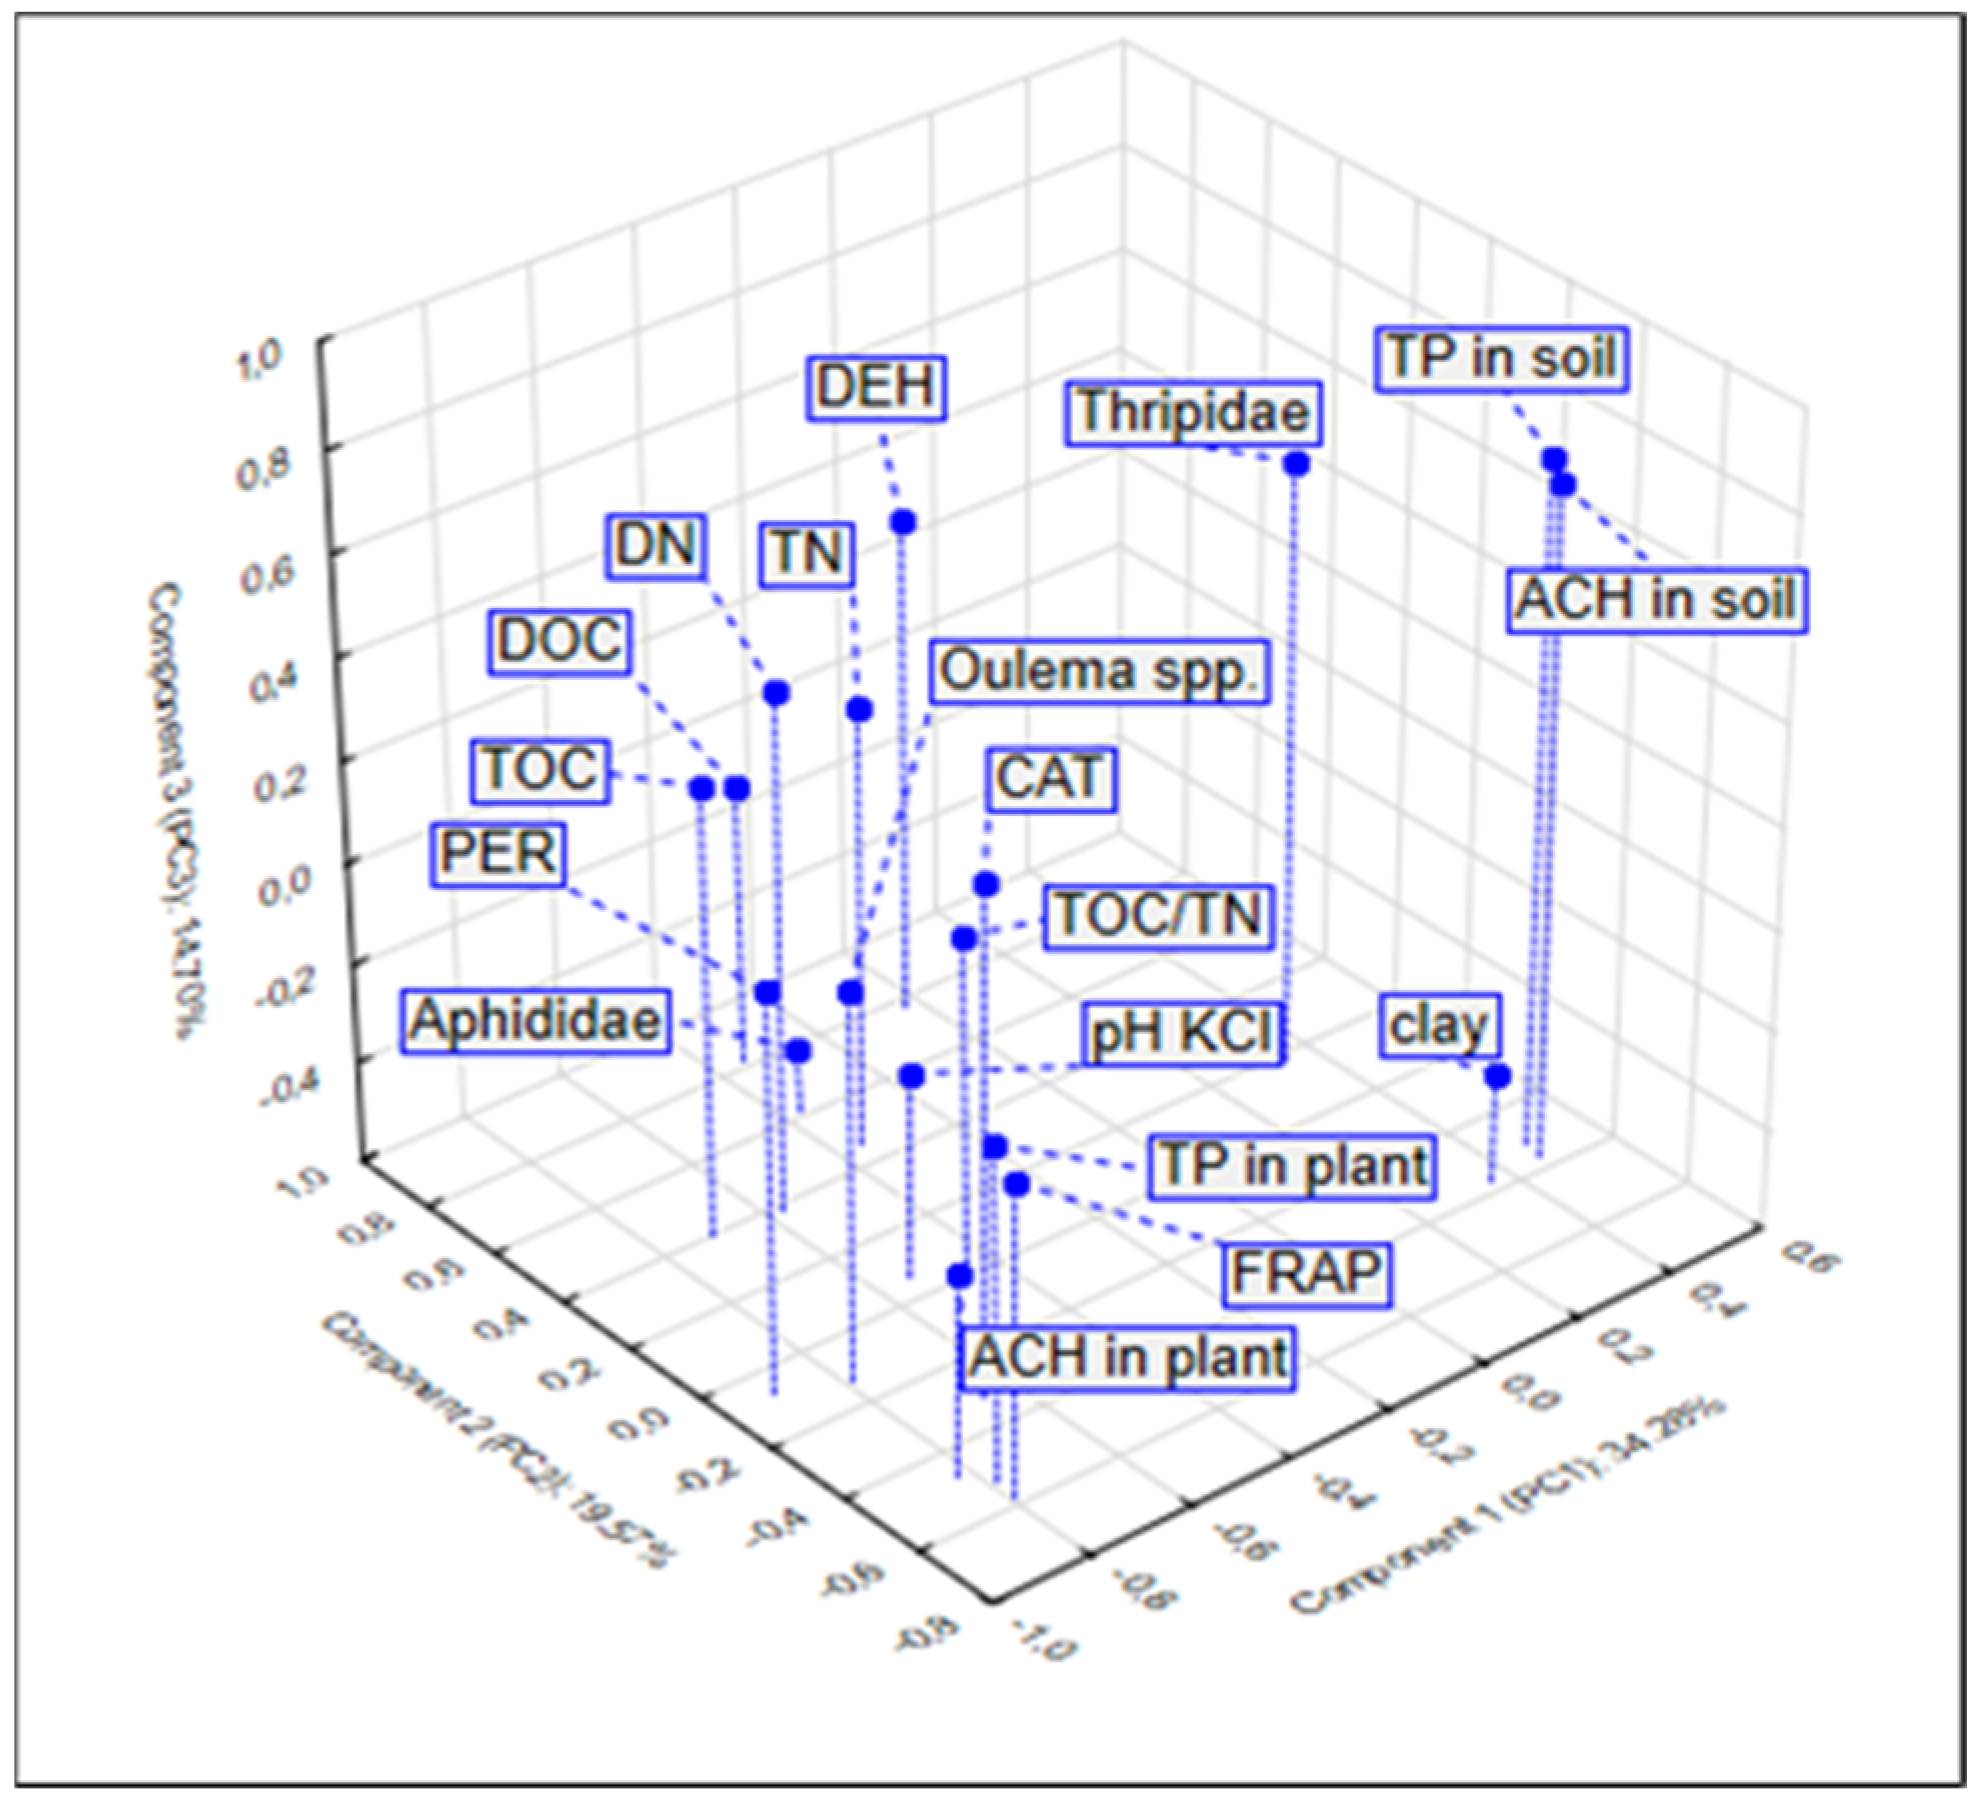
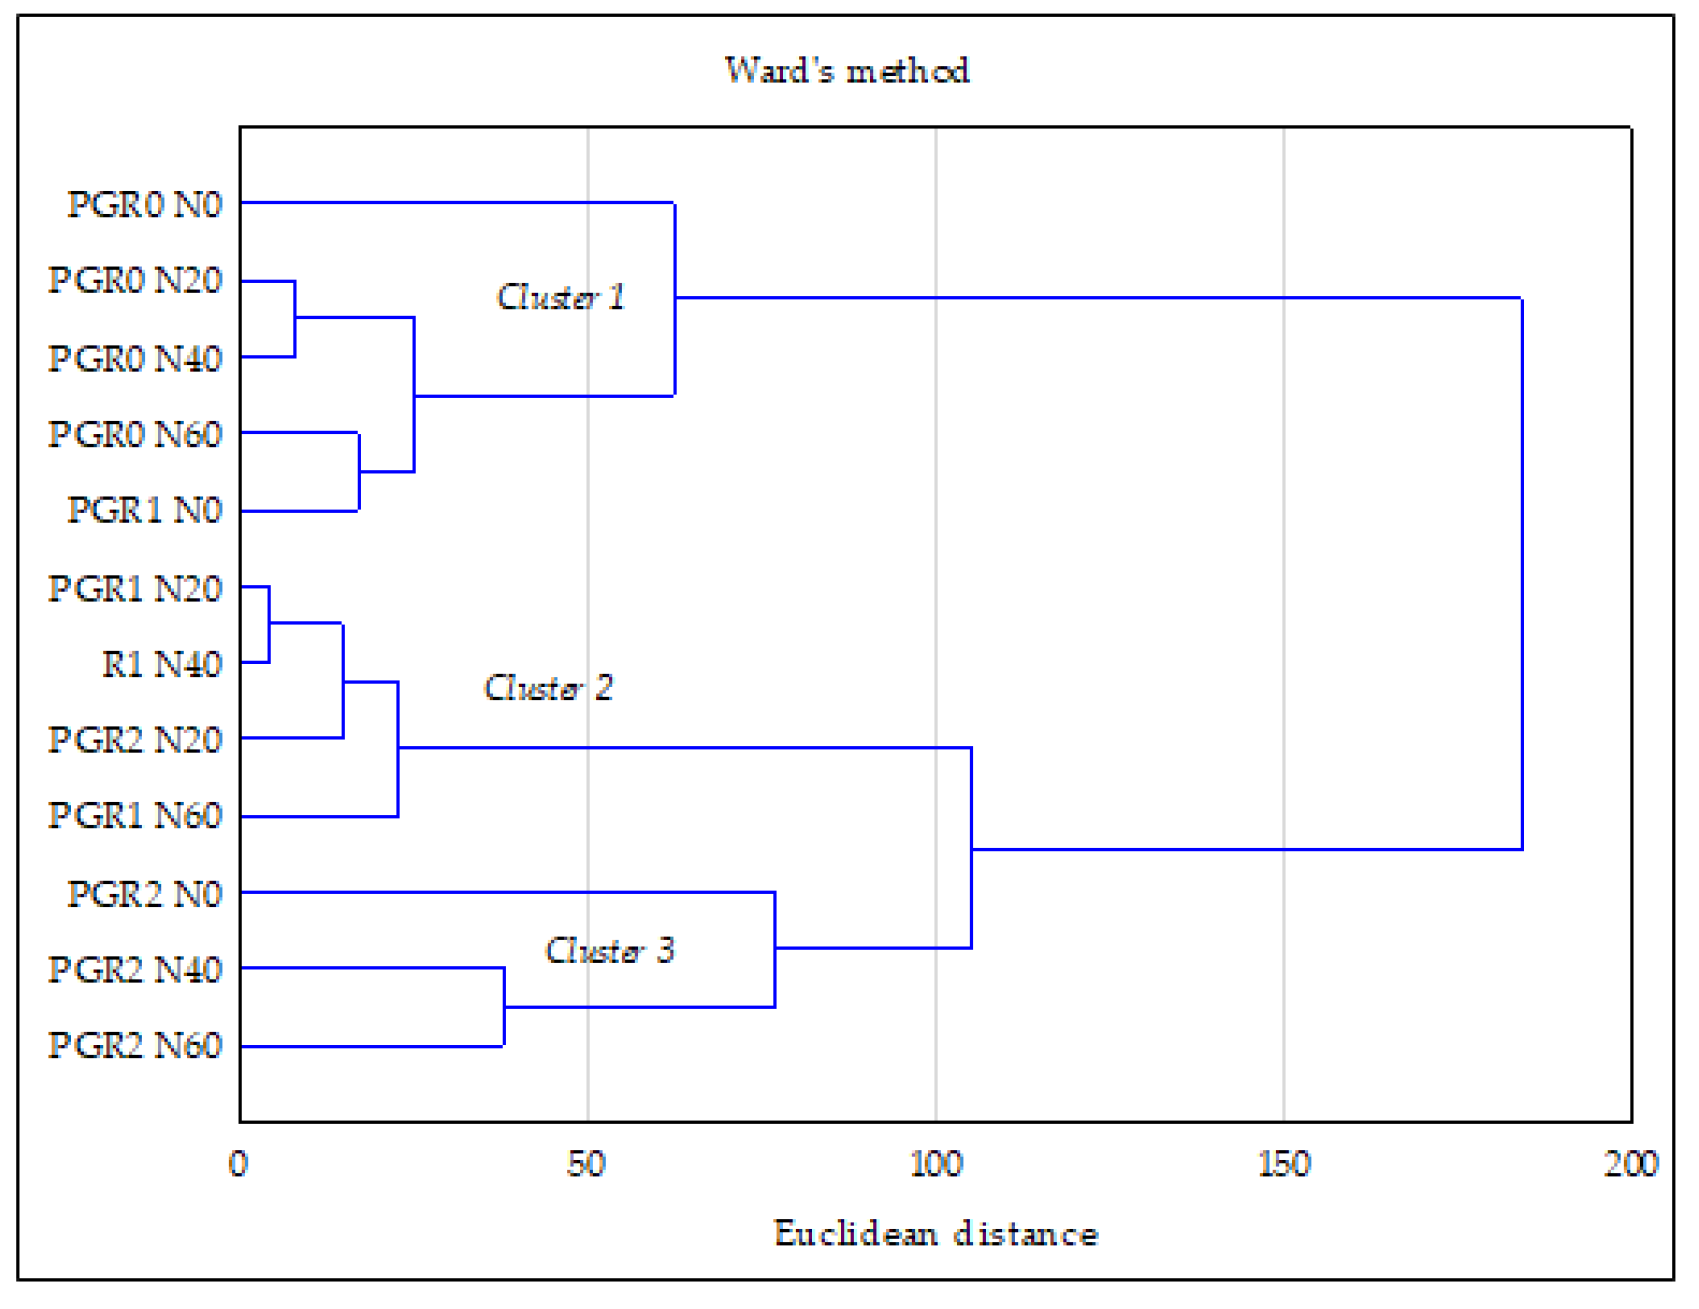
3.4. Relationship between the Studied Properties—PCA and CA Analysis

In order to explain the variation in Indian dwarf wheat, the soil, and the abundance of insects in terms of the parameters under study, the multivariate principal component analysis (PCA) technique was applied. This method allowed the cause-and-effect relationships between parameters to be investigated. PCA analysis identified three components that accounted for 68.61% of the total variance. Most of the variances were explained by PC1 (34.28%), PC2 (19.57%), and PC3 (14.70%). Therefore, the projections of the variables onto the factor plane for the first three components are presented graphically (Figure 4). PC1 was significantly negatively associated with the pH KCl, the activity of CAT (−0.657 and PER (−0.900), the content of TOC (0.702) and DN (−0.572), and the abundance of Oulema spp. (−0.787). A study conducted by Liu et al. [93] demonstrated that the load values of >0.75, 0.75–0.5, and 0.5–0.3, respectively, could be designated as “strong”, “moderate”, or “weak”. The second component (PC2) was significantly positively related to the DEH activity (0.778), the DOC content (0.816), and the abundance of Aphididae (0.619). The positive values of these loads imply that the greater the intensity of these characteristics, the greater the role they in PC2. The third component (PC3) was significantly negatively related to the ACH content in the soil (0.731) and the sum of phenols in the soil (0.763).
The PCA analysis, based on the investigated characteristics of Indian dwarf wheat, the soil, and the abundance of insects, demonstrated the existence of three clusters (Figure 4) presenting the projection of cases on the factor plane in PCA. The first cluster (cluster 1: PGR0 N60, PGR1 N60, and PGR2 N0) and the second cluster (cluster 2) showed the treatments N40, PGR1 N20, and PGR1 N40. Cluster 3 grouped the treatments PGR2 N20, PGR2 N40, and PGR2 N60, in the combination of nitrogen fertilisation with PGR2. The system of clusters obtained clearly indicates the significance of the chemical composition of PGRs in shaping the basic quality parameters of the soil.
The application of PCA also enabled the verification of the significance of the correlations between individual parameters. The abundance of Oulema spp. was significantly positively correlated with the total polyphenol content in the plants (r = 0.602), FRAP (r = 0.697), and ACH in the plants (r = 0.666). However, the abundance of Thripidae was negatively correlated with the total polyphenol content and ACH in the plants: r = −0.481 and r = −0.509, respectively. However, the effect of total polyphenols and ACH on the abundance of Thripidae was only 23% and 25%, respectively. As reported by Wang et al. [21], the soil application of nitrogen does not increase the concentration of total flavonoids and total phenols in wheat plants and has no effect on the changes in the abundance of aphids feeding on them.
The activity of the soil PER and CAT was positively correlated with TP in wheat: (r = 0.843) and (r = 0.570); with FRAP in wheat (r = 0.768) and (r = 0.647); and with ACH in wheat (r = 0.564) and (r = 0.564), respectively. The relationship between the phenolic content and the soil enzyme activity is not unambiguous. Determining this relationship depends on whether the phenolic compounds are a product or a substrate for soil enzymes. In this study, the obtained positive coefficients of correlation with the activity of DEH, CAT, and PER indicate that the phenolic compounds probably behaved as a product [18]. However, a study by Pobereżny et al. [70] noted significant negative correlations between TP in wheat in organic production systems and the oxidoreductive enzyme activity. Hoostal and Bouzat [94] demonstrated that the activity of extracellular enzymes of microorganisms was determined by the source and composition of phenolic compounds rather than by the absolute amounts of phenolic compounds. Joanisse et al. [95] demonstrated in their study that PSM is an extracellular enzyme inhibitor which reduces the ability of microorganisms to degrade substrates, thus reducing enzymatic activity. Irrespective of the literature data presented, the obtained study results indicate interactions between plants and pests and the enzymatic properties of soil.
The TOC content was significantly positively correlated with the activity of soil enzymes: CAT (r = 0.508), DEH (r = 0.649), and PER (r = 0.659). The activity of the enzymes under study was determined by TOC at the levels of 25.8%, 42.1%, and 32.4%, respectively. Similar results were presented by Xiao et al. [42]. Oxidative enzymes are responsible for the degradation of phenols. They can also alleviate the inhibitory effect of phenolic compounds on the activity of hydrolytic enzymes. Consequently, an increase in oxidative enzyme activity can accelerate the organic matter decomposition in the soil [96]. On the other hand, an increase in the activity gives rise to the start of the humification process, which may contribute to the stabilisation or even an increase in the carbon content in the soil. Dehydrogenases play a significant role in the biological oxidation of soil organic matter by transferring hydrogen from organic substrates to inorganic acceptors [97]. Their activity can be regarded as an index of oxidative metabolism in the soil. Peroxidases are involved in the biogeochemical processes of lignin degradation, oxidation of toxic substances, and carbon mineralisation and sequestration [98].
The pH of the soil is a parameter which affects, to a large extent, the activity and persistence of enzymes in the soil and the solubility of nutrients found in the soil solution. This study obtained a positive correlation between the pH in KCl and the PER activity (r = 0.541), and the DN content in the soil (r = 0.512). The literature reports that the enzymatic activity is mainly regulated by the pH of the soil, the content of soil microorganisms, soil use type, vegetation, organic matter resource, silty minerals, and soil moisture content [99]. A change in the H+ ion concentration can change the concentration of inhibitors or activators in the soil, as well as substrates that have a direct effect on enzyme activity. At the optimum pH, the enzymes are more stable. However, at an extremely higher or lower pH value, irreversible denaturation and degradation of enzyme proteins occur. Sinsabaugh [39] demonstrated that the activity of phenol oxidase and peroxidase generally increased with an increase in the pH of soils. On the other hand, Bollag et al. [100] demonstrated that peroxidases usually exhibited the maximum activity at pH = 5.0, which decreases with an increase in the pH. The activity of enzymes is regulated by the pH of the soil by means of the impact on its conformation and colloid adsorption [101].
The dendrogram of cluster analysis (Figure 5) illustrates the similarities among different interactions with experience factors (plant growth retardants (PGRs × nitrogen doses). Three main clusters are distinguished in the dendrogram. The first cluster includes the PGR0 N0, PGR0 N20, PGR0 N40, PGR0 N60, and PGR1 N20. Cluster 2 refers to the treatments PGR1 N20, PGR1 N40, PGR2 N20, and PGR1 N60. Cluster 3 refers to the treatments PGR2 N0, PGR2 N40, and PGR2 N60.

4. Conclusions

The effect of both factors (retardants and nitrogen fertilisation) on the polyphenolic compound content and the antioxidant potential of wheat plants proved to be significant. An increase in the content of secondary metabolites and FRAP in wheat was noted following the application of both retardants and increasing N rates. Both factors significantly affected the changes in the number of insect groups found on spring wheat. The application of retardants in the cultivation of Indian dwarf wheat increased the abundance of Aphididae and Oulema spp. The opposite situation was noted for Thripidae.
It was also demonstrated that the experimental factors applied, i.e., plant growth retardants and nitrogen fertilisation, could determine the content and quality of the organic matter. The application of retardants for the treatments not fertilised with nitrogen contributed to an increase in the organic carbon content and the proportion of the humin fraction in the TOC pool, which is particularly important in terms of carbon sequestration. Nitrogen fertilisation (with no retardant application) decreases the phenolic compound content but also increases the TOC and TN contents and the proportion of carbon in the humin fraction. This study demonstrated that the main factor determining the activity of oxidoreductive enzymes in the soil under wheat cultivation was the nitrogen fertilisation level. A rate of 60 kg N ha−1 resulted in the largest increase in the activity of catalase, dehydrogenases, and peroxidase. No oxidative activity inhibition by nitrogen fertilisation was noted. The application of plant growth retardants increased the enzyme activity as compared to the control soil.
Therefore, plant protection products cannot be approached uncritically in terms of their role in shaping soil properties.
The dynamic changes occurring in agroecosystems as a result of anthropogenic factors require a constant deepening and expansion of knowledge about changes in the soil. Further investigation should be conducted to determine the role of plant growth retardants and nitrogen doses in soil carbon sequestration, as well as to assess the impact of soil properties on the interactions between plants and pests and whether plant growth retardants have any effect on these interactions.

Author Contributions

Conceptualisation, J.L., M.S., R.L., B.D., J.P., E.W. and A.B.; methodology, M.S., J.L., A.B., R.L., B.D., J.P. and E.W.; validation, J.L., B.D., M.B.-S., A.M., R.L., J.P. and A.B.; formal analysis, J.L., A.M., J.P., R.L., A.B., E.W. and M.B.-S.; investigation, J.L., B.D., R.L., J.P., E.W., A.B., M.B-S., A.M., M.S. and T.K.; writing—original draft preparation, J.L., B.D., R.L., A.B., J.P., E.W. and M.S.; writing—review and editing, J.L., B.D., R.L., A.B., J.P., E.W., M.S., A.M., T.K. and M.B.-S.; visualisation, J.L.; project administration, J.L. and M.S. All authors have read and agreed to the published version of the manuscript.

Funding

“European Agricultural Fund for Rural Development: Europe investing in rural areas”. The publication was co-financed from the European Union funds under the COOPERATION of the Rural Development Programme for 2014–2020. The Managing Authority of the Rural Development Programme for 2014–2020—the Minister of Agriculture and Rural Development.

Institutional Review Board Statement

Not applicable.

Informed Consent Statement

Not applicable.

Data Availability Statement

Not applicable.

Acknowledgments

The authors would like to thank the Faculty of Agriculture and Biotechnology, Bydgoszcz University of Science and Technology for their support in this research work.

Conflicts of Interest

The authors declare no conflict of interest.

References

  1. Qin, R.; Noulas, C.; Wysocki, D.; Liang, X.; Wang, G.; Lukas, S. Application of plant growth regulators on soft white winter wheat under different nitrogen fertilizer scenarios in irrigated fields. Agriculture 2020, 10, 305. [Google Scholar] [CrossRef]
  2. Rademacher, W. Growth retardants: Effects of gibberellin biosynthesis and other metabolic pathways. Annu. Rev. Plant Physiol. Plant Mol. Biol. 2000, 51, 501–531. [Google Scholar] [CrossRef]
  3. Cycoń, M.; Lewandowska, A.; Piotrowska-Seget, Z. Mineralization dynamics of chlormequat chloride (CCC) in soils of different textures. Pol. J. Environ. Stud. 2012, 21, 595–602. [Google Scholar]
  4. Karimi, M.; Ahmadi, A.; Hashemi, J.; Abbasi, A.; Tavarini, S.; Pompeiano, A.; Guglielminetti, L.; Angelini, L.G. Plant growth retardants (PGRs) affect growth and secondary metabolite biosynthesis in Stevia rebaudiana Bertoni under drought stress. S. Afr. J. Bot. 2019, 121, 394–401. [Google Scholar] [CrossRef]
  5. Hancianu, M.; Aprotosoaie, A.C. The effects of pesticides on plant secondary metabolites. In Biotechnological Production of Plant Secondary Metabolites; Bentham Science Publishers: Sharjah, United Arab Emirates, 2012; pp. 176–186. [Google Scholar] [CrossRef]
  6. Altuntaş, H.; Gwokyalya, R.; Bayram, N. Immunotoxic effects of force-fed ethephon on model organism Galleria mellonella (Lepidoptera: Pyralidae). Drug Chem. Toxicol. 2022, 45, 1761–1768. [Google Scholar] [CrossRef] [PubMed]
  7. Giron, D.; Frago, E.; Glevarec, G.; Pieterse, C.M.; Dicke, M. Cytokinins as key regulators in plant–microbe–insect interactions: Connecting plant growth and defence. Funct. Ecol. 2013, 27, 599–609. [Google Scholar] [CrossRef]
  8. Gupta, G.; Bhattacharya, A.K. Assessing toxicity of post-emergence herbicides to the Spilarctia obliqua Walker (Lepidoptera: Arctiidae). J. Pest. Sci. 2008, 81, 9–15. [Google Scholar] [CrossRef]
  9. Zhao, H.; Cao, H.H.; Pan, M.Z.; Sun, Y.X.; Liu, T.X. The role of plant growth regulators in a plant–aphid–parasitoid tritrophic system. J. Plant Growth Regul. 2017, 36, 868–876. [Google Scholar] [CrossRef]
  10. Pérez-Ochoa, M.L.; Vera-Guzmán, A.M.; Mondragón-Chaparro, D.M.; Sandoval-Torres, S.; Carrillo-Rodríguez, J.C.; Chávez-Servia, J.L. Effects of growth conditions on phenolic composition and antioxidant activity in the medicinal plant Ageratina petiolaris (Asteraceae). Diversity 2022, 14, 595. [Google Scholar] [CrossRef]
  11. Sugier, D.; Sugier, P.; Jakubowicz-Gil, J.; Gawlik-Dziki, U.; Zając, A.; Król, B.; Chmiel, S.; Kończak, M.; Pięt, M.; Paduch, R. Nitrogen fertilization and solvents as factors modifying the antioxidant and anticancer potential of Arnica montana L. Flower Head Extracts. Plants 2023, 12, 142. [Google Scholar] [CrossRef]
  12. Prescott, C.E.; Grayston, S.J.; Helmisaari, H.S.; Kaštovská, E.; Körner, C.; Lambers, H.; Meier, I.C.; Millard, P.; Ostonen, I. Surplus carbon drives allocation and plant–soil interactions. Trends Ecol. Evol. 2020, 35, 1110–1118. [Google Scholar] [CrossRef] [PubMed]
  13. Hu, L.; Wu, Z.; Robert, C.A.M.; Ouyang, X.; Züst, T.; Mestrot, A.; Xu, J.; Erb, M. Soil chemistry determines whether defensive plant secondary metabolites promote or suppress herbivore growth. Proc. Natl. Acad. Sci. USA 2021, 118, e2109602118. [Google Scholar] [CrossRef] [PubMed]
  14. Mithöfer, A.; Boland, W. Plant defense against herbivores: Chemical aspects. Annu. Rev. Plant Biol. 2012, 63, 431–450. [Google Scholar] [CrossRef] [PubMed]
  15. Mur, L.A.; Simpson, C.; Kumari, A.; Gupta, A.K.; Gupta, K.J. Moving nitrogen to the centre of plant defence against pathogens. Ann. Bot. 2017, 119, 703–709. [Google Scholar] [CrossRef] [PubMed]
  16. Martínez-Medina, A.; Van Wees, S.C.; Pieterse, C.M. Airborne signals from Trichoderma fungi stimulate iron uptake responses in roots resulting in priming of jasmonic acid-dependent defences in shoots of Arabidopsis thaliana and Solanum lycopersicum. Plant. Cell Environ. 2017, 40, 2691–2705. [Google Scholar] [CrossRef] [PubMed]
  17. Kraus, T.E.C.; Dahlgren, R.A.; Zasoski, R.J. Tannins in nutrient dynamics of forest ecosystems—A review. Plant Soil 2003, 256, 41–66. [Google Scholar] [CrossRef]
  18. Min, K.; Freeman, C.; Kang, H.; Choi, S.U. The regulation by phenolic compounds of soil organic matter dynamics under a changing environment. BioMed Res. Int. 2015, 2015, 825098. [Google Scholar] [CrossRef]
  19. Ziółkowska, A.; Debska, B.; Banach-Szott, M. Transformations of phenolic compounds in meadow soils. Sci. Rep. 2020, 10, 19330. [Google Scholar] [CrossRef]
  20. Chen, Y.; Olson, D.M.; Ruberson, J.R. Effects of nitrogen fertilization on tritrophic interactions. Arthropod-Plant Interact. 2010, 4, 81–94. [Google Scholar] [CrossRef]
  21. Wang, C.; Tian, B.; Yu, Z.; Ding, J. Effect of different combinations of phosphorus and nitrogen fertilization on arbuscular mycorrhizal fungi and aphids in wheat. Insects 2020, 11, 365. [Google Scholar] [CrossRef]
  22. Kumar, S.; Abedin, M.M.; Singh, A.K.; Das, S. Role of phenolic compounds in plant-defensive mechanisms. Plant Phenolics Sustain. Agric. 2020, 1, 517–532. [Google Scholar] [CrossRef]
  23. Puri, S.; Singh, S.; Sohal, S.K. Oviposition behaviour and biochemical response of an insect pest, Zeugodacus cucurbitae (Coquillett) (Diptera: Tephritidae) to plant phenolic compound phloroglucinol. Comp. Biochem. Phys. C 2022, 255, 109291. [Google Scholar] [CrossRef] [PubMed]
  24. Rodríguez, A.; Beato, M.; Usseglio, V.L.; Camina, J.; Zygadlo, J.A.; Dambolena, J.S.; Zunino, M.P. Phenolic compounds as controllers of Sitophilus zeamais: A look at the structure-activity relationship. J. Stored Prod. Res. 2022, 99, 102038. [Google Scholar] [CrossRef]
  25. Cipollini, D.; Stevenson, R.; Enright, S.; Eyles, A.; Bonello, P. Phenolic metabolites in leaves of the invasive shrub, Lonicera maackii, and their potential phytotoxic and antiherbivore effects. J. Chem. Ecol. 2008, 34, 144–152. [Google Scholar] [CrossRef] [PubMed]
  26. Lamparski, R. Entomological and biochemical effects of the application of pro-ecological agrotechnical treatments in spring barley. Wyd. UTP Bydg. 2016, 1–106. [Google Scholar]
  27. Van Groenigen, J.W.; Van Kessel, C.; Hungate, B.A.; Oenema, O.; Powlson, D.S.; Van Groenigen, K.J. Response to the letter to the editor regarding our viewpoint “sequestering soil organic carbon: A nitrogen dilemma”. Environ. Sci. Technol. 2017, 51, 11503–11504. [Google Scholar] [CrossRef]
  28. Ouyang, Y.; Norton, J.M. Short-term nitrogen fertilization affects microbial community composition and nitrogen mineralization functions in an agricultural soil. Appl. Environ. Microbiol. 2020, 86, e02278-19. [Google Scholar] [CrossRef]
  29. Szczepanek, M.; Stypczyńska, Z.; Dziamski, A.; Wichrowska, D. Above- and below-ground part growth in chewings and strong creeping red fescue grown for seed resulting from retardants and N fertilization. Agronomy 2020, 10, 4. [Google Scholar] [CrossRef]
  30. Zhang, J.; An, T.; Chi, F.; Wei, D.; Zhou, B.; Hao, X.; Jin, L.; Wang, J. Evolution over years of structural characteristics of humic acids in Black Soil as a function of various fertilization treatments. J. Soils Sediments 2019, 19, 1959–1969. [Google Scholar] [CrossRef]
  31. Ventorino, V.; De Marco, A.; Pepe, O.; De Santo, A.V.; Moschetti, G. Impact of innovative agricultural practices of carbon sequestration on soil microbial community. In Carbon Sequestration in Agricultural Soils; Piccolo, A., Ed.; Springer: Berlin, Germany, 2012; pp. 145–178. [Google Scholar]
  32. Debska, B.; Kotwica, K.; Banach-Szott, M.; Spychaj-Fabisiak, E.; Tobiašová, E. Soil fertility improvement and carbon sequestration through exogenous organic matter and biostimulant application. Agriculture 2022, 2, 1478. [Google Scholar] [CrossRef]
  33. Kalbitz, K.; Solinger, S.; Park, J.H.; Michalzik, B.; Matzner, E. Controls on the dynamics of organic matter in soils: A review. Soil Sci. 2000, 165, 277–304. [Google Scholar] [CrossRef]
  34. Jokubauskaite, I.; Slepetiene, A.; Karcauskiene, D. Influence of different fertilization on the dissolved organic carbon, nitrogen and phosphorus accumulation in acid and limed soils. Eurasian J. Soil Sci. 2015, 4, 137–143. [Google Scholar] [CrossRef]
  35. Rosa, E.; Debska, B. Seasonal changes in the content of dissolved organic matter in arable soils. J. Soils Sediments 2018, 18, 2703–2714. [Google Scholar] [CrossRef]
  36. Chantigny, M.H. Dissolved and water-extractable organic matter in soils: A review on the influence of land use and management practice. Geoderma 2003, 113, 357–380. [Google Scholar] [CrossRef]
  37. Asare, M.O.; Száková, J.; Tlustoš, P. The fate of secondary metabolites in plants growing on Cd-, As-, and Pb-contaminated soils—A comprehensive review. Environ. Sci. Pollut. Res. 2023, 30, 11378–11398. [Google Scholar] [CrossRef] [PubMed]
  38. Jian, S.; Li, J.; Chen, J.; Wang, G.; Mayes, M.A.; Kudjo, E.M.; Dafeng, H.D.; Luo, Y. Soil extracellular enzyme activities, soil carbon and nitrogen storage under nitrogen fertilization: A meta-analysis. Soil Biol. Biochem. 2016, 101, 32–43. [Google Scholar] [CrossRef]
  39. Sinsabaugh, R.L. Phenol oxidase, peroxidase and organic matter dynamics of soil. Soil Biol. Biochem. 2010, 42, 391–404. [Google Scholar] [CrossRef]
  40. Sherene, T. Role of soil enzymes in nutrient transformation: A review. Bio Bull. 2017, 3, 109–131. [Google Scholar]
  41. Lemanowicz, J.; Bartkowiak, A.; Lamparski, R.; Wojewódzki, P.; Pobereżny, J.; Wszelaczyńska, E.; Szczepanek, M. Physicochemical and enzymatic soil properties influenced by cropping of primary wheat under organic and conventional farming systems. Agronomy 2020, 10, 1652. [Google Scholar] [CrossRef]
  42. Xiao, Q.; He, B.; Wang, S. Effect of the Different Fertilization Treatments Application on Paddy Soil Enzyme Activities and Bacterial Community Composition. Agronomy 2023, 13, 712. [Google Scholar] [CrossRef]
  43. USDA. Keys to Soil Taxonomy, 10th ed.; United States Department of Agriculture, Natural Resources Conservation Service: Washington, DC, USA, 2006; pp. 1–332. [Google Scholar]
  44. Szczepanek, M.; Lemańczyk, G.; Lamparski, R.; Wilczewski, E.; Graczyk, R.; Nowak, R.; Prus, P. Ancient wheat species (Triticum sphaerococcum Perc. and T. persicum Vav.) in organic farming: Influence of sowing density on agronomic traits, pests and diseases occurrence, and weed infestation. Agriculture 2020, 10, 556. [Google Scholar] [CrossRef]
  45. Keutgen, A.J.; Pawelzik, E. Modifications of strawberry fruit antioxidant pools and fruit quality under NaCl stress. J. Agric. Food Chem. 2007, 55, 4066–4072. [Google Scholar] [CrossRef]
  46. Benzie, I.F.F.; Strain, J.J. The ferric reducing ability of plasma (FRAP) as a measure of “antioxidant power”: The FRAP assay. Anal. Biochem. 1996, 239, 70–76. [Google Scholar] [CrossRef] [PubMed]
  47. Griffiths, D.W.; Bain, H.; Dale, M.F.B. Development of rapid colorimetric method for the determination of chlorogenic acid in freeze-dried potato tubers. J. Sci. Food Agric. 1992, 58, 41–48. [Google Scholar] [CrossRef]
  48. Tratwal, A.; Roik, K.; Horoszkiewicz-Janka, J.; Wielkopolan, B.; Bandyk, A.; Jakubowska, M. Monitorowanie i Prognozowanie Chorób i Szkodników w Uprawie Zbóż i Kukurydzy; Wyd. CDR W Brwinowie: Poznań, Poland, 2015; Volume 63. [Google Scholar]
  49. Müller, F.P. Mszyce—Szkodniki Roślin. Terenowy Klucz do Oznaczania. Klucze do Oznaczania Bezkręgowców Polski 2; Wyd. PWN: Warszawa, Poland, 1976; pp. 7–79. [Google Scholar]
  50. Zawirska, I. Wciornastki (Thysanoptera). Diagnostyka Szkodników Roślin i Ich Wrogów Naturalnych; Wyd. SGGW: Warszawa, Poland, 1994; pp. 145–174. [Google Scholar]
  51. Warchałowski, A. Chrysomelidae. The Leaf Beetles of Europe and the Mediterranean Area; Wyd. Natura Optima Dux Foundation: Warszawa, Poland, 2003; p. 656. [Google Scholar]
  52. PN-ISO 10390; Chemical and Agricultural Analysis: Determining Soil pH. Polish Standards Committee: Warszawa, Poland, 1997.
  53. Griffith, S.M.; Schnitzer, M. Analytical characteristics of humic and fulvic acids extracted from tropical volcanic soils. Soil Sci. Soc. Am. Proc. 1975, 39, 861–867. [Google Scholar] [CrossRef]
  54. Ross, K.A.; Beta, T.; Arntfield, S.D. A comparative study on the phenolic acids identified and quantified in dry beans using HPLC as affected by different extraction and hydrolysis methods. Food Chem. 2009, 113, 336–344. [Google Scholar] [CrossRef]
  55. Wang, Y.; Li, C.; Wang, Q.; Wang, H.; Duan, B.; Zhang, G. Environmental behaviors of phenolic acids dominated their rhizodeposition in boreal poplar plantation forest soils. J. Soils Sediments 2016, 16, 1858–1870. [Google Scholar] [CrossRef]
  56. Johnson, J.I.; Temple, K.I. Some variables affecting the measurements of catalase activity in soil. Soil Sci. Soc. Am. 1964, 28, 207–209. [Google Scholar] [CrossRef]
  57. Thalmann, A. Zur Methodik der Bestimung der Dehydrogenaseaktivität im Boden mittels Triphenyltetrazoliumchlorid (TTC). Landwirtsch. Forsch. 1968, 21, 249–258. [Google Scholar]
  58. Bartha, R.; Bordeleau, L. Cell-free peroxidases in soil. Soil Biol. Biochem. 1969, 1, 139–143. [Google Scholar] [CrossRef]
  59. Ward, J.H. Hierarchical grouping to optimize an objective function. J. Am. Stat. Assoc. 1963, 58, 236–244. [Google Scholar] [CrossRef]
  60. Upreti, K.K.; Sharma, M. Role of plant growth regulators in abiotic stress tolerance. In Abiotic Stress Physiology of Horticultural Crops; Rao, N., Shivashankara, K., Laxman, R., Eds.; Springer: New Delhi, India, 2016. [Google Scholar] [CrossRef]
  61. Liao, Y.; Zeng, L.; Li, P.; Sun, T.; Wang, C.; Li, F.; Chen, Y.; Du, B.; Yang, Z. Influence of plant growth retardants on quality of codonopsis Radix. Molecules 2017, 22, 1655. [Google Scholar] [CrossRef] [PubMed]
  62. Ma, D.; Sun, D.; Li, Y.; Wang, C.; Xie, Y.; Guo, T. effect of nitrogen fertilisation and irrigation on phenolic content, phenolic acid composition, and antioxida;t activity of winter wheat grain. J. Sci. Food Agric. 2015, 95, 1039–1046. [Google Scholar] [CrossRef] [PubMed]
  63. Tian, W.; Jaenisch, B.; Gui, Y.; Hu, R.; Chen, G.; Lollato, R.P.; Li, Y. Effect of environment and field management strategies on phenolic acid profiles of hard red winter wheat genotypes. J. Sci. Food Agric. 2021, 102, 2424–2431. [Google Scholar] [CrossRef] [PubMed]
  64. Stumpf, B.; Yan, F.; Honermeier, B. Influence of nitrogen fertilization on yield and phenolic compounds in wheat grains (Triticum aestivum L. ssp. aestivum). J. Plant. Nutr. Soil Sci. 2019, 182, 111–118. [Google Scholar] [CrossRef]
  65. Tian, W.; Wang, F.; Xu, K.; Zhang, Z.; Yan, J.; Yan, J.; Tian, Y.; Liu, J.; Zhang, Y.; Zhang, Y.; et al. Accumulation of wheat phenolic acids under different nitrogen rates and growing environments. Plants 2022, 11, 2237. [Google Scholar] [CrossRef] [PubMed]
  66. Fernandez-Orozco, R.; Li, L.; Harflett, C.; Shewry, P.R.; Ward, J.L. Effects of environment and genotype on phenolic acids in wheat in the HEALTHGRAIN diversity screen. J. Agric. Food Chem. 2010, 58, 9341–9352. [Google Scholar] [CrossRef]
  67. Ma, D.; Li, Y.; Zhang, J.; Wang, C.; Qin, H.; Ding, H.; Xie, Y.; Guo, T. accumulation of phenolic compounds and expression profiles of phenolic acid biosynthesis-related genes in developing grains of white, purple, and red wheat. Front. Plant Sci. 2016, 7, 528. [Google Scholar] [CrossRef]
  68. Engert, N.; John, A.; Henning, W.; Honermeier, B. Effect of sprouting on the concentration of phenolic acids and antioxidative capacity in wheat cultivars (Triticum aestivum ssp. aestivum L.) in dependency of nitrogen fertilization. J. Appl. Bot. Food Qual. 2011, 84, 111–118. [Google Scholar]
  69. Mikulajová, A.; Takacsova, M.; Alexy, P.; Brindzova, L. Optimization of extraction of phenolic compounds from buckwheat based on an experimental design method. Chemické Listy 2007, 101, 563–568. [Google Scholar]
  70. Pobereżny, J.; Wszelaczyńska, E.; Lamparski, R.; Lemanowicz, J.; Bartkowiak, A.; Szczepanek, M.; Gościnna, K. The impact of spring wheat species and sowing density on soil biochemical properties, content of secondary plant metabolites and the presence of Oulema ssp. PeerJ 2023, 11, e14916. [Google Scholar] [CrossRef] [PubMed]
  71. Wang, H.; Xiao, L.; Tong, J.; Liu, F. Foliar application of chlorocholine chloride improves leaf mineral nutrition, antioxidant enzyme activity, and tuber yield of potato (Solanum tuberosum L.). Sci. Hortic. 2010, 125, 521–523. [Google Scholar] [CrossRef]
  72. Cottrell, T.E.; Wood, B.W.; Ni, X. Application of plant growth regulators mitigates chlorotic foliar injury by the black pecan aphid (Hemiptera: Aphididae). Pest Manag. Sci. 2010, 66, 1236–1242. [Google Scholar] [CrossRef] [PubMed]
  73. Schutz, K.; Bonkowski, M.; Scheu, S. Effects of Collembola and fertilizers on plant performance (Triticum aestivum) and aphid reproduction (Rhopalosiphum padi). Basic Appl. Ecol. 2008, 9, 182–188. [Google Scholar] [CrossRef]
  74. Kang, Z.; Liu, F.; Tan, X.; Zhang, Z.; Zhu, J.; Tian, H.; Liu, T. Infection of powdery mildew reduces the fitness of grain aphids (Sitobion avenae) through restricted nutrition and induced defense response in wheat. Front. Plant Sci. 2018, 9, 778. [Google Scholar] [CrossRef]
  75. Aqueel, M.A.; Leather, S.R. Effect of nitrogen fertilizer on the growth and survival of Rhopalosiphum padi (L.) and Sitobion avenae (F.) (Homoptera: Aphididae) on different wheat cultivars. Crop Prot. 2011, 30, 216–221. [Google Scholar] [CrossRef]
  76. Long, W.; Xiao-Hui, W.; Tong, H.; Lei, Q.; Li-Kun, L.; Fa-Jun, C. The effect of fertilizer-N on the inter-specific competition among three wheat aphids under elevated CO2. J. Appl. Entomol. 2019, 143, 1032–1042. [Google Scholar] [CrossRef]
  77. Chantigny, M.H.; Angers, D.A.; Prévost, D.; Simard, R.R.; Chalifour, F.P. Dynamics of soluble organic C and C mineralization in cultivated soils with varying N fertilization. Soil Biol. Biochem. 1999, 31, 543–550. [Google Scholar] [CrossRef]
  78. Zsolnay, A.; Gorlitz, H. Water extractable organic matter in arable soils effects of drought and long-term fertilization. Soil Biol. Biochem. 1994, 26, 1257–1261. [Google Scholar] [CrossRef]
  79. Liu, Z.J.; Clay, S.A.; Clay, D.E.; Harper, S.S. Ammonia fertilizer influences atrazine adsorption–desorption characteristics. J. Agric. Food. Chem. 1995, 43, 815–819. [Google Scholar] [CrossRef]
  80. Homann, P.S.; Grigal, D.F. Molecular weight distribution of soluble organics from laboratory-manipulated soils. Soil Sci. Soc. Am. J. 1992, 56, 1305–1310. [Google Scholar] [CrossRef]
  81. Embacher, A.; Zsolnay, A.; Gattinger, A.; Munch, J.C. The dynamics of water extractable organic matter (WEOM) in common arable topsoils: II. Influence of mineral and combined mineral and manure fertilization in Haplic Chernozem. Geoderma 2008, 148, 63–69. [Google Scholar] [CrossRef]
  82. Cao, Z.; Wang, Y.; Li, J.; Zhang, J.; He, N. Soil organic carbon contents, aggregate stability, and humic acid composition in different alpine grasslands in Qinghai-Tibet Plateau. J. Mt. Sci. 2016, 13, 2015–2027. [Google Scholar] [CrossRef]
  83. Debska, B.; Jaskulska, I.; Jaskulski, D. Method of tillage with the factor determining the quality of organic matter. Agronomy 2020, 10, 1250. [Google Scholar] [CrossRef]
  84. Pastuszko, A. Soil organic matter. Environ. Prot. Nat. Res. 2007, 30, 83–98. [Google Scholar]
  85. Holik, L.; Volánek, J.; Vranová, V. Effect of plant growth regulators on protease activity in forest floor of norway spruce stand. Forests 2021, 12, 665. [Google Scholar] [CrossRef]
  86. Guo, X.; Xu, Y.; Zhang, F.; Yu, S.; Han, L.; Jiang, S. Chlormequat residues and dissipation rates in cotton crops and soil. Ecotoxicol. Environ. Saf. 2010, 73, 642–646. [Google Scholar] [CrossRef]
  87. Wang, Q.; Ma, M.; Jiang, X.; Guan, D.; Wei, D.; Zhao, B.; Chen, S.; Cao, F.; Li, L.; Yang, X.; et al. Impact of 36 years of nitrogen fertilization on microbial community composition and soil carbon cycling-related enzyme activities in rhizospheres and bulk soils in northeast China. Appl. Soil Ecol. 2019, 136, 148–157. [Google Scholar] [CrossRef]
  88. Zhou, Z.; Wang, C.; Zheng, M.; Jiang, L.; Luo, Y. Patterns and mechanisms of responses by soil microbial communities to nitrogen addition. Soil Biol. Biochem. 2017, 115, 433–441. [Google Scholar] [CrossRef]
  89. Dong, L.; Berg, B.; Gu, W.; Wang, Z.; Sun, T. Effects of different forms of nitrogen addition on microbial extracellular enzyme activity in temperate grassland soil. Ecol. Processes 2022, 11, 36. [Google Scholar] [CrossRef]
  90. Sawicka, B.; Krochmal-Marczak, B.; Pszczółkowski, P.; Bielińska, E.J.; Wójcikowska-Kapusta, A.; Barbaś, P.; Skiba, D. Effect of differentiated nitrogen fertilization on the enzymatic activity of the soil for sweet potato (Ipomoea batatas L. [Lam.]) cultivation. Agronomy 2020, 10, 1970. [Google Scholar] [CrossRef]
  91. Piotrowska, A.; Wilczewski, E. Effects of catch crops cultivated for green manure and mineral nitrogen fertilization on soil enzyme activities and chemical properties. Geoderma 2012, 189–190, 72–80. [Google Scholar] [CrossRef]
  92. Rutkowski, K.; Łysiak, G.P.; Zydlik, Z. Effect of nitrogen fertilization in the sour cherry orchard on soil enzymatic activities, microbial population, and fruit quality. Agriculture 2022, 12, 2069. [Google Scholar] [CrossRef]
  93. Liu, C.W.; Lin, K.H.; Kuo, Y.M. Application of factor analysis in the assessment of groundwater quality in a blackfoot disease area in Taiwan. Sci. Total Environ. 2003, 313, 77–89. [Google Scholar] [CrossRef]
  94. Hoostal, M.J.; Bouzat, J.L. The modulating role of dissolved organic matter on spatial patterns of microbial metabolism in Lake Erie sediments. Microb. Ecol. 2008, 55, 358–368. [Google Scholar] [CrossRef] [PubMed]
  95. Joanisse, G.D.; Bradley, R.L.; Preston, C.M.; Munson, A.D. Soil enzyme inhibition by condensed litter tannins may drive ecosystem structure and processes: The case of Kalmia angustifolia. New Phytol. 2007, 175, 535–546. [Google Scholar] [CrossRef] [PubMed]
  96. Tian, L.; Shi, W. Soil peroxidase regulates organic matter decomposition through improving the accessibility of reducing sugars and amino acids. Biol. Fertil. Soils 2014, 50, 785–794. [Google Scholar] [CrossRef]
  97. Zhang, N.; He, X.; Gao, Y.; Li, Y.; Wang, H.; Ma, D.; Zhang, R.; Yang, S. Pedogenic carbonate and soil dehydrogenase activity in response to soil organic matter in artemisia ordosica community. Pedosphere 2010, 20, 229235. [Google Scholar] [CrossRef]
  98. Bach, C.E.; Warnock, D.D.; Van Horn, D.J.; Weintraub, M.N.; Sinsabaugh, R.L.; Allison, S.D.; German, D.P. Measuring phenol oxidase and peroxidase activities with pyrogallol, l-DOPA, and ABTS: Effect of assay conditions and soil type. Soil Biol. Biochem. 2013, 67, 183–191. [Google Scholar] [CrossRef]
  99. Błońska, E.; Lasota, J.; Zwydak, M. The relationship between soil properties, enzyme activity and land use. For. Res. Pap. 2017, 78, 39–44. [Google Scholar] [CrossRef]
  100. Bollag, J.M.; Chen, C.M.; Sarkar, J.M.; Loll, M.J. Extraction and purification of a peroxidase from soil. Soil Biol. Biochem. 1987, 19, 61–67. [Google Scholar] [CrossRef]
  101. Turner, B.L. Variation in pH optima of hydrolytic enzyme activities in tropical rain forest soils. Appl. Environ. Microbiol. 2010, 76, 6485–6493. [Google Scholar] [CrossRef] [PubMed]
Figure 1. Mean values TOC/TN ratio for factors I (PGRs) and II (N dose). Plant growth retardant: PGR0—control; PGR1—chlormequat chloride (CCC) + trinexapac-ethyl (TE); PGRR2—chlormequat chloride (CCC) + ethephon (ET); N dose—nitrogen dose: N0, N20, N40, and N60 (0, 20, 40, and 60 kg N ha−1); a—significance of differences for factors.
Agriculture 13 01121 g001
Figure 2. Mean proportions of carbon fractions for factors I (PGRs) and II (N dose) (A). The mean proportion of nitrogen fractions for factors I (PGRs) and II (N dose) (B). Plant growth retardant: PGR0—control; PGR1—chlormequat chloride (CCC) + trinexapac-ethyl (TE); PGRR2—chlormequat chloride (CCC) + ethephon (ET); N dose—nitrogen dose: N0, N60 (0, 60 kg N ha−1); a–c—significance of differences for factors.
Agriculture 13 01121 g002
Figure 3. Mean values CHAs/CFAs (A) and NHAs/NFAs ratio (B) for factors I (PGRs) and II (N dose). Plant growth retardant: PGR0—control; PGR1—chlormequat chloride (CCC) + trinexapac-ethyl (TE); PGRR2—chlormequat chloride (CCC) + ethephon (ET); N dose—nitrogen dose: N0, N60 (0, 60 kg N ha−1); a–c—significance of differences for factors.
Agriculture 13 01121 g003
Figure 4. Configuration of variables in the system of the first three axes PC1, PC2, and PC3 of principal components. TP in plant—total polyphenols in plant; ACH in plant—chlorogenic acid in plant; FRAP—antioxidant potential; TOC—total organic carbon; TN—total nitrogen; DOC—dissolved organic carbon; DN—dissolved nitrogen; ACH in soil—chlorogenic acid in soil; TP in soil—the sum of phenols in soil; CAT—catalase; DEH—dehydrogenases; PER—peroxidases.
Agriculture 13 01121 g004
Figure 5. Dendrogram analysis of study parameters of pests, spring wheat, and soil. Plant growth retardant: PGR0—control; PGR1—chlormequat chloride (CCC) + trinexapac-ethyl (TE); PGRR2—chlormequat chloride (CCC) + ethephon (ET); N—nitrogen dose: N0, N20, N40, and N60 [0, 20, 40, and 60 kg N ha−1].
Agriculture 13 01121 g005
Table 1. The content of total polyphenols (TP), chlorogenic acid (ACH), and antioxidant potential (FRAP) in plants.
N Dose **
II Factor
Plant Growth Retardants (PGRs) * I Factor
PGR0PGR1PGR2MeanPGR0PGR1PGR2MeanPGR0PGR1PGR2Mean
TP (µg g−1 DM)ACH (µg g−1 DM)FRAP (mM Fe2+ kg−1)
N02.79 b^
±0.049
3.38 a
±0.048
3.38 a
±0.023
3.182 B
±0.394
1241 b
±26.0
1284 b
±22.1
1340 a
±11.1
1288 B
±38.5
6.68 b
±0.822
7.81 a
±1.056
7.82 a
±1.065
7.44 B
±0.799
N203.23 a
±0.435
3.48 a
±0.027
3.54 a
±0.018
3.44 B
±0.342
1264 b
±17.4
1310 a
±16.4
1309 a
±27.0
1294 AB
±39.6
7.10 b
±0.822
7.47 b
±0.600
8.19 a
±0.107
7.59 B
±0.807
N403.18 c
±0.097
3.52 b
±0.058
3.85 a
±0.027
3.52 B
±0.128
1278 b
±12.5
1314 ab
±38.5
1348 a
±11.5
1313 AB
±11.0
7.34 c
±0.355
7.78 b
±0.611
8.58 a
±0.289
7.90 A
±0.940
N603.24 c
±0.061
3.58 b
±0.036
3.98 a
±0.005
3.60 A
±0.191
1284 b
±30.9
1318 b
±51.5
1380 a
±10.1
1330 A
±30.5
7.53 b
±0.761
7.88 b
±0.412
8.82 a
±1.044
8.08 A
±1.235
Mean3.11 C
±0.280
3.49 B
±0.087
3.70 A
±0.237
3.43
±0.326
1269 B
±34.1
1306 A
±51.5
1344 C
±23.1
1307
±42.5
7.16 c
±1.097
7.73 B
±0.961
8.35 A
±1.244
7.75
±1.412
* PGRs—Plant growth retardant: PGR0—control; PGR1—chlormequat chloride (CCC) + trinexapac-ethyl (TE); PGR2—chlormequat chloride (CCC) + ethephon (ET); ** N dose—Nitrogen dose: N0, N20, N40, and N60 (0, 20, 40, and 60 kg N ha−1). ^ Different small letters (horizontally) indicate a comparison between interaction I/II. Different capital letters indicate a comparison among I (horizontally) and II (vertically) factors; Values followed by the same small letter within each column are not significantly different at p = 0.05; ±Standard Deviation; TP—total polyphenols (µg g−1 DM); ACH—chlorogenic acid (µg g−1 DM); FRAP—ferring reducing ability of plasma (mM Fe2+ kg−1 DM).
Table 2. The density of pests in spring wheat plants.
N Dose **
II Factor
Plant Growth Retardants (PGRs) * I Factor
PGR0PGR1PGR2MeanPGR0PGR1PGR2MeanPGR0PGR1PGR2Mean
Oulema spp. (ind. Per 22 m2)Aphididae (ind. Per 22 m2)Thripidae (ind. Per 22 m2)
N02.25 b^
±0.500
3.50 b
±0.577
6.25 a
±0.957
4.00 BC
±1.859
23.00 c
±0.816
25.75 b
±0.957
32.75 a
±0.957
27.17 A
±4.366
7.75 a
±0.500
4.50 b
±0.577
3.50 c
±0.577
5.25 B
±1.960
N202.50 b
±0.577
4.25 a
±1.500
5.00 a
±0.816
3.92 C
±1.443
12.75 c
±0.500
20.50 a
±1.000
16.75 b
±0.957
16.67 C
±3.393
5.75 a
±0.816
3.75 b
±0.500
5.50 a
±0.577
5.00 B
±1.044
N403.25 b
±0.500
4.50 b
±1.291
7.00 a
±0.816
4.92 B
±1.832
14.25 b
±0.577
21.75 a
±0.577
11.50 c
±0.577
15.83 C
±4.549
4.25 b
±0.500
5.75 a
±0.500
4.75 b
±0.500
4.92 B
±0.793
N608.25 a
±0.577
4.75 c
±0.957
6.25 b
±0.957
6.42 A
±1.676
22.75 a
±0.500
22.25 a
±0.957
20.50 b
±1.000
21.83 B
±1.267
8.00 a
±0.816
5.75 b
±0.957
4.75 c
±0.500
6.17 A
±1.530
Mean4.06 B
±2.568
4.25 B
±1.125
6.13 A
±1.088
4.81
±1.942
18.19 C
±4.902
22.56 A
±2.159
20.38 B
±8.123
20.38
±5.786
6.44 A
±1.672
4.94 B
±0.998
4.62 B
±0.885
5.33
±1.449
* PGRs—Plant growth retardant: PGR0—control; PGR1—chlormequat chloride (CCC) + trinexapac-ethyl (TE); PGR2—chlormequat chloride (CCC) + ethephon (ET); ** N dose—Nitrogen dose: N0, N20, N40, and N60 (0, 20, 40, and 60 kg N ha−1). ^ Different small letters (horizontally) indicate a comparison between interaction I/II. Different capital letters indicate a comparison among I (horizontally) and II (vertically) factors; Values followed by the same small letter within each column are not significantly different at p = 0.05; ±Standard Deviation.
Table 3. pH and clay fraction content of soil sample.
N
Dose **
II Factor
Plant Growth Retardants (PGRs) * I Factor
PGR0PGR1PGR2MeanPGR0PGR1PGR2Mean
pH in KClClay (%)
N07.24 c^7.30 a7.28 b7.28 A4.56 a4.28 b4.32 b4.38 B
±0.01±0.03±0.01±0.02±0.04±0.02±0.03±0.12
N207.14 c7.25 a7.21 b7.20 C4.58 ab4.49 b4.70 a4.59 A
±0.01±0.02±0.02±0.05±0.03±0.08±0.06±0.09
N407.22 a7.22 a7.18 b7.22 B4.30 a4.25 a4.19 a4.25 C
±0.02±0.03±0.02±0.02±0.11±0.05±0.03±0.04
N607.25 b7.25 b7.35 a7.29 A3.38 b4.32 c4.55 a4.22 C
±0.01±0.01±0.02±0.05±0.04±0.03±0.09±0.51
Mean7.22 B7.27 A7.26 A7.254.32 B4.33 AB4.43 A4.37
±0.04±0.04±0.04±0.04±0.49±0.09±0.20±0.14
* PGRs—Plant growth retardant: PGR0—control; PGR1—chlormequat chloride (CCC) + trinexapac-ethyl (TE); PGR2—chlormequat chloride (CCC) + ethephon (ET); ** N dose—Nitrogen dose: N0, N20, N40, and N60 (0, 20, 40, and 60 kg N ha−1). ^ Different small letters (horizontally) indicate a comparison between interaction I/II. Different capital letters indicate a comparison among I (horizontally) and II (vertically) factors; Values followed by the same small letter within each column are not significantly different at p = 0.05; ±Standard Deviation.
Table 4. Content of total organic carbon (TOC), total nitrogen (TN), and the proportion of dissolved organic carbon (DOC) and nitrogen (DN).
N Dose **
II Factor
Plant Growth Retardants (PGRs) * I Factor
PGR0PGR1PGR2MeanPGR0PGR1PGR2Mean
TOC (g g−1)TN (g g−1)
N07.46 b^
±0.10
8.50 a
±0.14
8.43 a
±0.10
8.13 B
±0.12
0.70 c
±0.02
0.78 b
±0.02
0.74 a
±0.02
0.74 B
±0.02
N207.86 b
±0.12
8.09 b
±0.21
8.67 a
±0.13
8.21 B
±0.18
0.73 c
±0.02
0.81 a
±0.02
0.72 b
±0.01
0.75 B
±0.01
N408.16 a
±0.05
7.99 a
±0.18
8.16 a
±0.17
8.10 B
±0.10
0.77 a
±0.02
0.73 b
±0.02
0.73 b
±0.02
0.74 B
±0.02
N608.58 b
±0.15
9.12 a
±0.27
8.00 c
±0.24
8.57 A
±0.20
0.78 a
±0.03
0.78 a
±0.03
0.74 b
±0.01
0.77 A
±0.02
Mean8.01 B
±0.08
8.42 A
±0.25
8.31 A
±0.18
8.25
±0.22
0.73 B
±0.02
0.78 A
±0.02
0.73 B
±0.01
0.75
±0.02
DOC (mg g−1)DN (mg g−1)
N0103.0 b
±5.3
109.6 b
±4.7
121.1 a
±7.4
111.2 AB
±6.1
7.40 c
±0.33
7.70 b
±0.42
8.10 a
±0.28
7.70 B
±0.38
N20103.4 b
±5.5
117.8 a
±5.7
106.6 a
±3.6
109.3 AB
±4.8
6.60 c
±0.43
8.50 a
±0.50
7.40 b
±0.65
7.50 B
±0.50
N40102.4 b
±5.4
115.8 a
±3.9
98.2 b
±7.1
105.5 B
±5.0
6.90 b
±0.28
9.10 a
±0.43
6.30 b
±0.29
7.40 B
±0.33
N60113.1 b
±4.1
129.8 a
±6.2
91.9 c
±3.5
111.6 A
±4.8
11.40 a
±0.530
10.40 a
±0.29
9.80 b
±0.50
10.6 A
±0.43
Mean105.5 B
±4.9
118.2 A
±5.0
104.4 B
±5.5
109.4
±4.9
8.10 B
±0.39
8.90 A
±0.45
7.90 B
±0.4
8.30
±0.50
DOC (%)DN (%)
N01.38 a
±0.07
1.29 b
±0.05
1.44 a
±0.08
1.37 A
±0.06
1.06 a
±0.05
0.99 b
±0.05
1.09 a
±0.04
1.05 B
±0.05
N201.32 a
±0.07
1.46 a
±0.70
1.23 b
±0.04
1.23 BC
±0.05
0.90 c
±0.06
1.09 a
±0.06
1.03 b
±0.09
0.99 C
±0.08
N401.25 b
±0.07
1.45 a
±0.05
1.20 b
±0.09
1.20 C
±0.06
0.90 b
±0.03
1.25 a
±0.06
0.86 c
±0.09
1.00 C
±0.05
N601.32 ab
±0.06
1.42 a
±0.09
1.15 b
±0.09
1.30 AB
±0.07
1.50 a
±0.07
1.33 a
±0.04
1.32 a
±0.07
1.38 A
±0.06
Mean1.32 B
±0.07
1.40 A
±0.08
1.26 B
±0.11
1.33
±0.06
1.09 B
±0.06
1.16 A
±0.07
1.08 B
±0.06
1.11
±0.05
* PGRs—Plant growth retardant: PGR0—control; PGR1—chlormequat chloride (CCC) + trinexapac-ethyl (TE); PGR2—chlormequat chloride (CCC) + ethephon (ET); ** N dose—Nitrogen dose: N0, N20, N40, and N60 (0, 20, 40, and 60 kg N ha−1). ^ Different small letters (horizontally) indicate a comparison between interaction I/II. Different capital letters indicate a comparison among I (horizontally) and II (vertically) factors; Values followed by the same small letter within each column are not significantly different at p = 0.05; ±Standard Deviation; TOC—total organic carbon; TN—total nitrogen; DOC—dissolved organic carbon; DN—dissolved nitrogen.
Table 5. Content of carbon and nitrogen in humus fraction.
N Dose **
II Factor
Plant Growth Retardants (PGRs) * I Factor
PGR0PGR1PGR2MeanPGR0PGR1PGR2MeanPGR0PGR1PGR2Mean
Cd (mg kg−1)CHAs (mg kg−1)CFAs (mg kg−1)
N0208 a^
±2.8
177 b
±8.7
186 b
±5.0
191 B
±8.8
1837 a
±50.1
1778 b
±37.9
1724 b
±39.6
1780 B
±40.8
1945 a
±18.8
1954 a
±23.9
1932 b
±23.6
1944 B
±20.2
N60203 b
±6.3
213 a
±6.0
188 c
±6.2
201 A
±6.1
1844 b
±28.6
1919 a
±36.5
1842 b
±40.8
1969 A
±30.4
1926 b
±17.4
2052 a
±32.1
1948 b
±23.2
1975 A
±19.1
Mean205 B
±4.8
196 A
±7.2
187 C
±5.8
196
±6.5
1840 A
±35.0
1848 A
±36.5
1783 B
±40.0
1824
±35.5
1935 B
±17.9
2003 A
±28.8
1940 B
±23.1
1960
±20.1
Nd (mg kg−1)NHAs (mg kg−1)NFAs (mg kg−1)
N017.5 a
±1.9
12.2 b
±2.2
12.7 b
±2.5
14.1 B
±2.3
135.2 a
±7.2
131.8 a
±7.7
117.2 b
±5.5
128.1 B
±6.6
135.8 a
±3.3
136.3 a
±4.5
137.8 a
±4.3
136.6
±3.9
N6020.1 a
±2.1
16.2 b
±2.8
17.1 b
±1.8
17.8 A
±2.8
132.1 a
±6.3
134.5 a
±5.4
188.8 b
±4.1
151.8 A
±5.2
133.9 b
3.7
140.5 a
±5.7
140.2 a
±5.0
138.2
±4.1
Mean18.8 A
±2.0
14.2 B
±2.6
14.9 B
±2.2
16.0
±2.7
133.7 B
±6.8
133.1 B
±6.5
153.0 A
±5.0
139.9
±5.6
134.8 B
±3.4
138.4 AB
±5.2
139.0 A
±4.8
137.4
±4.0
* PGRs—Plant growth retardant: PGR0—control; PGR1—chlormequat chloride (CCC) + trinexapac-ethyl (TE); PGR2—chlormequat chloride (CCC) + ethephon (ET); ** N dose—Nitrogen dose: N0, N20, N40, and N60 (0, 20, 40, and 60 kg N ha−1). ^ Different small letters (horizontally) indicate a comparison between interaction I/II. Different capital letters indicate a comparison among I (horizontally) and II (vertically) factors; Values followed by the same small letter within each column are not significantly different at p = 0.05; ±Standard Deviation; Cd—carbon in solutions after decalcification; CHAs—carbon of the fraction of humic acids; CFAs—carbon of the fraction of fulvic acids; Ch—carbon of the humin fraction; Nd—nitrogen in solutions after decalcification; NHAs—nitrogen of the fraction of humic acids; NFAs—nitrogen of the fraction of fulvic acids; Nh—nitrogen of the humin fraction.
Table 6. Content of chlorogenic acid and the sum of phenols in soil.
N Dose **
II Factor
Plant Growth Retardants (PGRs) * I Factor
PGR0PGR1PGR2MeanPGR0PGR1PGR2Mean
ACH (mg g−1)TP (mg g−1)
N06.62 a^
±0.38
5.60 a
±0.18
5.28 b
±0.04
5.82
±0.25
75.33 a
±2.72
65.73 b
±2.30
55.11 c
±2.59
65.39 B
±3.40
N205.92 a
±0.24
5.59 b
±0.16
5.59 b
±0.22
5.70
±0.20
71.76 a
±2.34
66.63 b
±2.32
68.49 b
±2.95
68.96 AB
±3.00
N405.73 b
±0.11
5.55 c
±0.12
5.90 a
±0.22
5.73
±0.18
72.94 a
±4.00
66.14 a
±2.70
69.00 a
±2.97
69.36 A
±2.87
N605.65 b
±0.12
5.54 c
±0.11
5.98 a
±0.26
5.75
±0.20
67.72 a
±2.00
67.12 a
±1.91
67.84 a
±1.82
67.56 AB
±1.99
Mean5.98 A
±0.23
5.54 B
±0.16
5.61 B
±0.11
5.72
±0020
71.94 A
±2.33
66.41 B
±2.55
65.11 B
±2.22
67.82
±2.77
* PGRs—Plant growth retardant: PGR0—control; PGR1—chlormequat chloride (CCC) + trinexapac-ethyl (TE); PGR2—chlormequat chloride (CCC) + ethephon (ET); ** N dose—Nitrogen dose: N0, N20, N40, and N60 (0, 20, 40, and 60 kg N ha−1). ^ Different small letters (horizontally) indicate a comparison between interaction I/II. Different capital letters indicate a comparison among I (horizontally) and II (vertically) factors; Values followed by the same small letter within each column are not significantly different at p = 0.05; ±Standard Deviation; ACH—chlorogenic acid; TP—the sum of phenols in soil.
Table 7. The activity of catalase (CAT), dehydrogenases (DEH), and peroxidases (PER) in soil.
N Dose II Factor **Plant Growth Retardants (PGRs) * I Factor
PGR0PGR1PGR2MeanPGR0PGR1PGR2MeanPGR0PGR1PGR2Mean
CAT (mg H2O2 kg−1 h−1)DEH (mg TPF kg−1 24 h−1)PER (mM PPG kg−1 h−1)
N00.520 b^
±0.002
0.542 b
±0.028
0.565 a
±0.014
0.542 C
±0.012
0.435 c
±0.009
0.482 a
±0.006
0.458 b
±0.012
0.458 B
±0.023
1.421 b
±0.002
1.599 a
±0.003
1.594 a
±0.009
1.538 B
±0.089
N200.536 b
±0.011
0.524 c
±0.009
0.580 a
±0.012
0.546 C
±0.024
0.470 b
±0.008
0.474 b
±0.008
0.485 a
±0.009
0.476 A
±0.002
1.434 b
±0.003
1.575 a
±0.006
1.580 a
±0.009
1.530 B
±0.070
N400.606 b
±0.012
0.510 c
±0.011
0.623 a
±0.009
0.580 B
±0.050
0.486 a
±0.011
0.469 b
±0.012
0.420 c
±0.009
0.458 B
±0.009
1.506 b
±0.002
1.570 ab
±0.005
1.608 a
±0.012
1.561 B
±0.032
N600.628 b
±0.009
0.639 b
±0.012
0.657 a
±0.008
0.641 A
±0.012
0.497 b
±0.013
0.509 a
±0.006
0.408 c
±0.011
0.471 A
±0.006
1.590 b
±0.002
1.727 a
±0.004
1.690 a
±0.003
1.669 A
±0.069
Mean0.572 B
±0.045
0.554 C
±0.050
0.606 A
±0.036
0.577
±0.014
0.472 B
±0.023
0.483 A
±0.015
0.443 C
±0.031
0.466
±0.003
1.488 B
±0.067
1.618 A
±0.064
1.618 A
±0.042
1.574
±0.001
* PGRs—Plant growth retardant: PGR0—control; PGR1—chlormequat chloride (CCC) + trinexapac-ethyl (TE); PGR2—chlormequat chloride (CCC) + ethephon (ET); ** N dose—Nitrogen dose: N0, N20, N40, and N60 (0, 20, 40, and 60 kg N ha−1). ^ Different small letters (horizontally) indicate a comparison between interaction I/II. Different capital letters indicate a comparison among I (horizontally) and II (vertically) factors; Values followed by the same small letter within each column are not significantly different at p = 0.05; ±Standard Deviation; CAT—catalase; DEH—dehydrogenases; PER—peroxidases.
Disclaimer/Publisher’s Note: The statements, opinions and data contained in all publications are solely those of the individual author(s) and contributor(s) and not of MDPI and/or the editor(s). MDPI and/or the editor(s) disclaim responsibility for any injury to people or property resulting from any ideas, methods, instructions or products referred to in the content.

