
Growth of Lettuce in Hydroponics Fed with Aerobic- and Anaerobic–Aerobic-Treated Domestic Wastewater

1
Hans-Ruthenberg-Institute for Tropical Agricultural Sciences, Universität Hohenheim, Garbenstrasse 13, 70593 Stuttgart, Germany
2
Institute of Sanitary and Environmental Engineering, Technische Universität Braunschweig, Universitätsplatz 2, 38106 Braunschweig, Germany
3
Wasserwirtschaftsamt Ingolstadt, Auf d. Schanz 26, 85049 Ingolstadt, Germany
*
Author to whom correspondence should be addressed.
Agriculture 2023, 13(8), 1529; https://doi.org/10.3390/agriculture13081529
Submission received: 13 June 2023
/
Revised: 24 July 2023
/
Accepted: 25 July 2023
/
Published: 1 August 2023
(This article belongs to the Special Issue Innovative Hydroponic Systems for Sustainable Agriculture)
Abstract
:Reusing water and nutrients from municipal wastewater can conserve resources and reduce wastewater treatment costs. In this study, the suitability of different qualities of treated wastewater for plant production in a hydroponic flow-through system was investigated. Lettuce (Lactuca sativa L.) was grown in hydroponic lines fed with treated wastewater, i.e., conventional effluent from aerobic wastewater treatment by the activated sludge process (CE), ozonised CE (CEO), anaerobically pre-treated and nitrified wastewater (AN) and biological activated carbon filtered AN (ANC) in comparison with a modified Hoagland nutrient solution. In CEO, AN and ANC, the lettuce reached a similar weight and elemental composition as that in HS. The low N and P concentrations in CE and CEO were quickly depleted, resulting in limited plant development at the ends of these lines. The lower water content in the CE shoots was probably related to hypoxia that occurred at higher temperatures. In the CEO line, this condition did not arise due to the constant decay of O3. At lower temperatures, the CEO shoot dry weight was 90% higher than that in CE. This was possibly an effect of residual ozone and/or oxygen supersaturation. AN produced the highest yield, while carbon filtration lowered the content of cations in ANC, inducing deficiency of Fe > Mn > Cu > Zn > K. Coupling wastewater treatment with hydroponics allows for efficient nutrient recovery, and thus could reduce the energy and reactor volume needed for N and P elimination.
1. Introduction
In view of phosphorus depletion, water stress and land-use conversion, agricultural production capacity and water use efficiency must be improved to meet the needs of the growing global population. Agricultural water consumption, which, today, accounts for 70% of global surface and groundwater withdrawal, is projected to increase by 20–30% above the current levels by 2050 [1].
The use of domestic wastewater in hydroponic crop production systems offers a solution to address water scarcity, increase nutrient use efficiency, limit overhead irrigation as a serious health hazard and improve treatment performance, as current wastewater treatment does not remove N and P sufficiently to ensure safe discharge to natural waters. Given the potential applications, it is surprising that little research effort has been devoted to developing combined strategies for domestic wastewater treatment and hydroponic reuse in crop production. The research focus so far has been either on the water treatment capability of hydroponic systems or on the potential to use wastewater for crop production.
A frequently observed challenge in the use of conventionally treated wastewater in crop production is the insufficient concentration of one or more essential nutrients. Adrover et al. [2], comparing the effect of treated wastewater and nutrient solution on barley seedling development in hydroponic systems, observed a yield reduction of up to 50% and concluded that the N and Fe supply from the wastewater was insufficient. Boyden and Rababah [3] found that lettuce efficiently eliminated N and P from wastewater, but also that the addition of K was required for high yields. Vaillant et al. [4] treated domestic wastewater with hydroponically grown Datura innoxia (Mill.). While the treatment reduced suspended solids, both the chemical and biological oxygen demand, and especially P elimination, remained inadequate. An excessive nutrient load, due to the volume and concentration in the water to be treated, in relation to the receiving plants may also result in their inability to adequately remove N and P. For instance, the experimental integration of hydroponically grown Pistia stratiotes (L.) into the third stage of conventional wastewater treatment [5] and the combined use of conventional biological wastewater treatment processes, hydroponics and microalgae in a decentralised plant could not meet current wastewater standards [6].
In order to increase crop production and, at the same time, improve N and P elimination from pre-treated wastewater, it is important to understand the possible causes of lower productivity of crops grown in treated wastewater. Both the quality of the domestic wastewater and the rate of plant uptake, which depends on the development stage and abiotic growth conditions, are important in this context as nutrient depletion progresses.
Maruo et al. [7] reported efficient nutrient uptake and vigorous growth of vegetables cultivated in low-concentration nutrient solutions as long as the concentrations of all elements were kept above their proportional minimum. This minimum depends on species and variety, temperature, light intensity and composition of the nutrient solution. Therefore, nutrient uptake by a plant can change significantly depending on a single factor or a combination of factors when using treated wastewater as a nutrient solution. The effects of individual factors can reinforce or neutralise each other. For example, Hartz et al. [8] observed significant changes in the nutrient composition of lettuce with increasing age and decreasing relative growth rate, and attributed this to increasing respiration losses. In contrast, Sosa et al. [9] found that the accumulation of N, P and K correlated linearly with biomass development over the entire cultivation period.
Assuming that all essential nutrients are present in domestic wastewater, we assume that, if there is a sufficient supply of aerobically (low concentration of N and P relative to the other essential nutrients) and anaerobically–aerobically (high concentration of N and P) treated domestic wastewater, lettuce can be grown without the provision of additional nutrients. We further hypothesise that anaerobic–aerobic treatment with nitrification provides higher N and P concentrations and, therefore, offers a more balanced nutrient solution than conventional biological treatment.
2. Methods
2.1. Experimental Hydroponic Set-Up
Lettuce (Lactuca sativa L.) was grown in a hydroponic system using four different treated domestic wastewater qualities (TWW) [10] compared with modified Hoagland nutrient solution, in approximation with commercial hydroponic lettuce production as a control. A simple tunnel greenhouse without active climate control housed the experiments at the wastewater treatment plant in Hattorf, Germany (52°21′08.9″ N 10°45′14.4″ E). The first trial was conducted from 14 August to 21 September, and the second from 27 September to 6 November 2017.
The hydroponic setup consisted of 5 independent 8 m long pipes composed of interconnected 2 m long PVC pipe sections with an inner diameter of 100 mm. Each pipe formed a hydroponic system, hereafter referred to as a ‘line’. Holes with a diameter of 30 mm were drilled into the pipes at 100 mm intervals to support the plants. After deducting one access hole at the beginning and one at the end of the line and the pipe connections, the hydroponic system had a capacity of 68 lettuce plants per line.
The lettuce variety Salanova® (Rijk Zwaan, De Lier, The Netherlands), with a recommended harvest weight of 250 g, was selected for the trials. For seedling cultivation, individual seeds were sown in rockwool seed cubes and placed in seed trays 21 days before the start of the trial. The cubes were kept moist with 25% concentrated modified Hoagland solution [11].
2.2. Treatments
2.2.1. Hoagland Solution (HS)
Half-strength Hoagland solution was used, based on the modified formula by Epstein and Bloom [11], and adapted to chemical compounds available from Carl Roth GmbH, Germany. We substituted NH4H2PO4 with (NH4)2HPO4 and KH2PO4, which increased K by 17%. Further, NaFeDTPA was replaced with C10H12FeN2NaO8*3H2O and H2MoO4 with Na2MoO4*2H2O. Impurities in the service water from the treatment plant’s grid increased the concentrations of sulphur (S), calcium (Ca), magnesium (Mg), zinc (Zn), boron (B) and, most particularly, copper (Cu) (compare Figure 2, Cu—irrigation water). The pH value of the solution was adjusted to 5.8 after the addition of the nutrients. In both experiments, HS was filled and renewed once by completely draining and refilling the line. In the second experiment, full-strength HS was used by accident for the second filling.
2.2.2. Conventional Aerobic-Treated Wastewater (CE)
The plant in Hattorf exclusively treats household wastewater. Its biological stage is operated as an intermittent activated sludge process for the degradation of organic compounds and N removal. P is incorporated into the microbial biomass and removed with the sludge and, if necessary, further eliminated by precipitation with ferric chloride. The CE consisted of the effluent from the secondary sedimentation tank.
2.2.3. Ozonised CE (CEO)
For CEO, the CE was subjected to ozonation. The ozone produced in a pilot reactor (Xylem Services GmbH, Herford, Germany) was added to the hourly water flow of 1.0–1.5 m3 at a rate of 0.5 g O3 per g dissolved organic carbon, or 8 g O3 per m3.
2.2.4. Anaerobically Pre-Treated and Nitrified Wastewater (AN)
The raw sewage was taken from the inlet to the biological stage of the treatment plant, which was already mechanically pre-treated via screens and a grit chamber. To reduce the load of carbon compounds, the raw sewage was fed into an expanded granular sludge bed reactor (ACS-Umwelttechnik GmbH & Co. KG, Rielasingen-Worblingen, Germany). Biogas was produced as a by-product of the anaerobic process. To convert ammonium (NH4+) to nitrate (NO3−), an aerated sequencing batch reactor (TU Braunschweig, Braunschweig, Germany) was installed downstream of the bed reactor.
2.2.5. Biological Activated Carbon-Filtered AN Water (ANC)
To remove micropollutants, the effluent of the sequencing batch reactor was further treated with an aerated biological activated carbon filter (TU Braunschweig, Germany). This filter was based on the synergistic effect of adsorption and biological degradation. The upstream biological processes in the reactors mainly degraded easily degradable carbon compounds, while carbon compounds that were difficult to degrade, e.g., micropollutants, were reduced by the biological activated carbon filter. The residence time of these compounds in the system was increased by their adsorption to the activated carbon. As a result, slow-growing microorganisms colonising the activated carbon adapted and broke down the chemical bonds of the micropollutants [12,13].
2.3. Experimental Operation
Initially, a water level of approx. 75 mm was maintained in the pipes, which allowed the rockwool plugs with the seedlings to be partially immersed in the water. As soon as the roots protruded well into the nutrient solution, the water level was lowered so that an air gap of 10 mm remained between the rockwool plug and the water surface. At this level, each of the pipes contained 45 L of water.
The HS line was operated as a recirculating system, with a pump in a water barrel intermittently feeding nutrient solution into the front part of the pipe. At the end, a hose connected to the pipe returned the nutrient solution to the barrel.
Immediately after filling, the HS line, including a pipe, barrel and hose, contained a total volume of 185 L. The HS line was completely emptied and replaced with fresh solution on 9 September and 20 October 2017 for the first and second trials, respectively.
For each TWW line, the water from the various treatment units was pumped in batches into a feed barrel, from where it flowed intermittently into the lines controlled by solenoid valves.
The pump of the HS line and the solenoid valves of the TWW lines were operated every 3 min for a variable time in order to dynamically orient the flow volume to the expected transpiration curve. The volume to be emitted each time was calculated by the following formula, resulting in a total volume of 565 L that flowed per day through each line:
The water levels in the pipes were kept as those in the HS line. At the end of the TWW lines, the water flowed into another barrel, from where it was discharged from the greenhouse in batches.
2.4. Sampling
Water was sampled every third day from the barrel of the HS line and the feeding and receiving barrels of the TWW lines. The samples were analysed for all essential nutrients, except for chlorine (Cl) and molybdenum (Mo). Mo was analysed only from one sample of each front and end section at the end of the first experiment.
From each line, 21 plants, numbered 5 to 11, 33 to 39 and 60 to 66 counting from the inlet to the outlet, were harvested and used for fresh and dry matter determination. The shoots of plants 6 to 11 and 60 to 65 underwent individual elementary analysis. Mixed samples of the roots of 6 to 8, 9 to 11, 60 to 62 and 63 to 65 were also analysed. The roots were only rinsed so that the analysis results recorded the elemental content of the root and any deposits on the outside.
2.5. Climate Measurements
The air parameters inside the greenhouse were measured with an Si7021 Humidity and Temperature Sensor (Silicon Laboratories, Inc., Austin, TX, USA) and a BMP280 Pressure Sensor (Bosch, Gerlingen, Germany). The illumination was assessed with a TSL2561 Light-to-Digital Converter by Texas Advanced Optoelectronic Solutions Inc. (ams AG, Premstätten, Austria). To allow for comparison with the photosynthetic photon flux density from the literature, the sensor′s lux values were divided by 51.2 as an approximation [14]. The water temperature in the lines was measured with DS18B20 Digital Thermometers (Maxim Integrated, San Jose, CA, USA). A Raspberry Pi 3 B+ (Raspberry Pi Foundation, Cambridge, UK) was used for data acquisition.
2.6. Determination of Leaf Chlorophyll
Single-photon avalanche diode (SPAD) measurements were taken to determine leaf greenness and, therefore, the relative chlorophyll concentration using a SPAD 502 Chlorophyll Meter (Konica Minolta, Inc., Tokyo, Japan). One representative young and old leaf were selected from five of the sample plants from each line section. For each sample leaf, 3 SPAD measurements were taken near the centre, avoiding the midrib, and averaged.
2.7. Water and Plant Analytics
The nutrient solutions were analysed for total P, Ca, sodium (Na), Mg, K, S, B, Fe, manganese (Mn), Cu and Zn using ICP-OES (DIN EN ISO 11885 E22:2009-09), NO3-N and NO2-N by cuvette tests (Hach Lange GmbH, Berlin, Germany) and NH4-N with an ISE-Sensor NH 500/2 (Xylem Analytics Germany Sales GmbH & Co. KG., Weilheim in Oberbayern, Germany). Ntot was calculated as the sum of NO3-N, NO2-N and NH4-N. The relevant limits of detection were K 1 mg L−1, Fe 0.1 μg L−1, Mn 2 μg L−1, and Cu 5 μg L−1. The EC, pH and O2 were measured using an HI991301 Portable pH/EC/TDS/Temperature Meter and HI9147 Portable Galvanic Dissolved Oxygen Meter (Hanna Instruments Deutschland GmbH, Vöhringen, Germany).
Microwave pressure digestion with HNO3 and HNO3/HF was used to prepare the plant samples. The B, Ca, Cu, Fe, K, Mg, Mn, Na, P, Si and Zn concentrations were determined by ICP-OES (vol. II.1 cap. 8.10 VDLUFA (2019)), Mo by ICP-MS (vol. VII cap. 2.2.3.1) and N and S by the combustion method (vol. II.1 cap. 3.5.2.7).
A stepwise approach was employed to reduce biases associated with fixed substitutions of non-detects, values below the limit of detection. First, non-detects were replaced with the limit of detection value, assuming closeness to the detection limit. Further non-detects were replaced with decreasing percentages of the limit of detection (80%, 60%, 40%, 20%, then 0%), presuming that their true values were increasingly minimal. If all data points were non-detects, the mean was set to 0. This imputation method aims to strike a balance between inflated means and underestimated variance due to replacing non-detects with the limit of detection, and deflated means and exaggerated variance when replacing non-detects with 0.
2.8. Data Analysis
Average values, standard deviations and significance of differences between means by Student′s t-test were calculated using LibreOffice Calc 6.3.4 (The Document Foundation, Berlin, Germany) and curve fitting was performed using “SciDAVIS”—Scientific Data Analysis and Visualization (Version 1.22, http://scidavis.sourceforge.net/, accessed on 31 May 2018).
3. Results
3.1. First Experiment
3.1.1. Greenhouse Climate and Water Temperatures
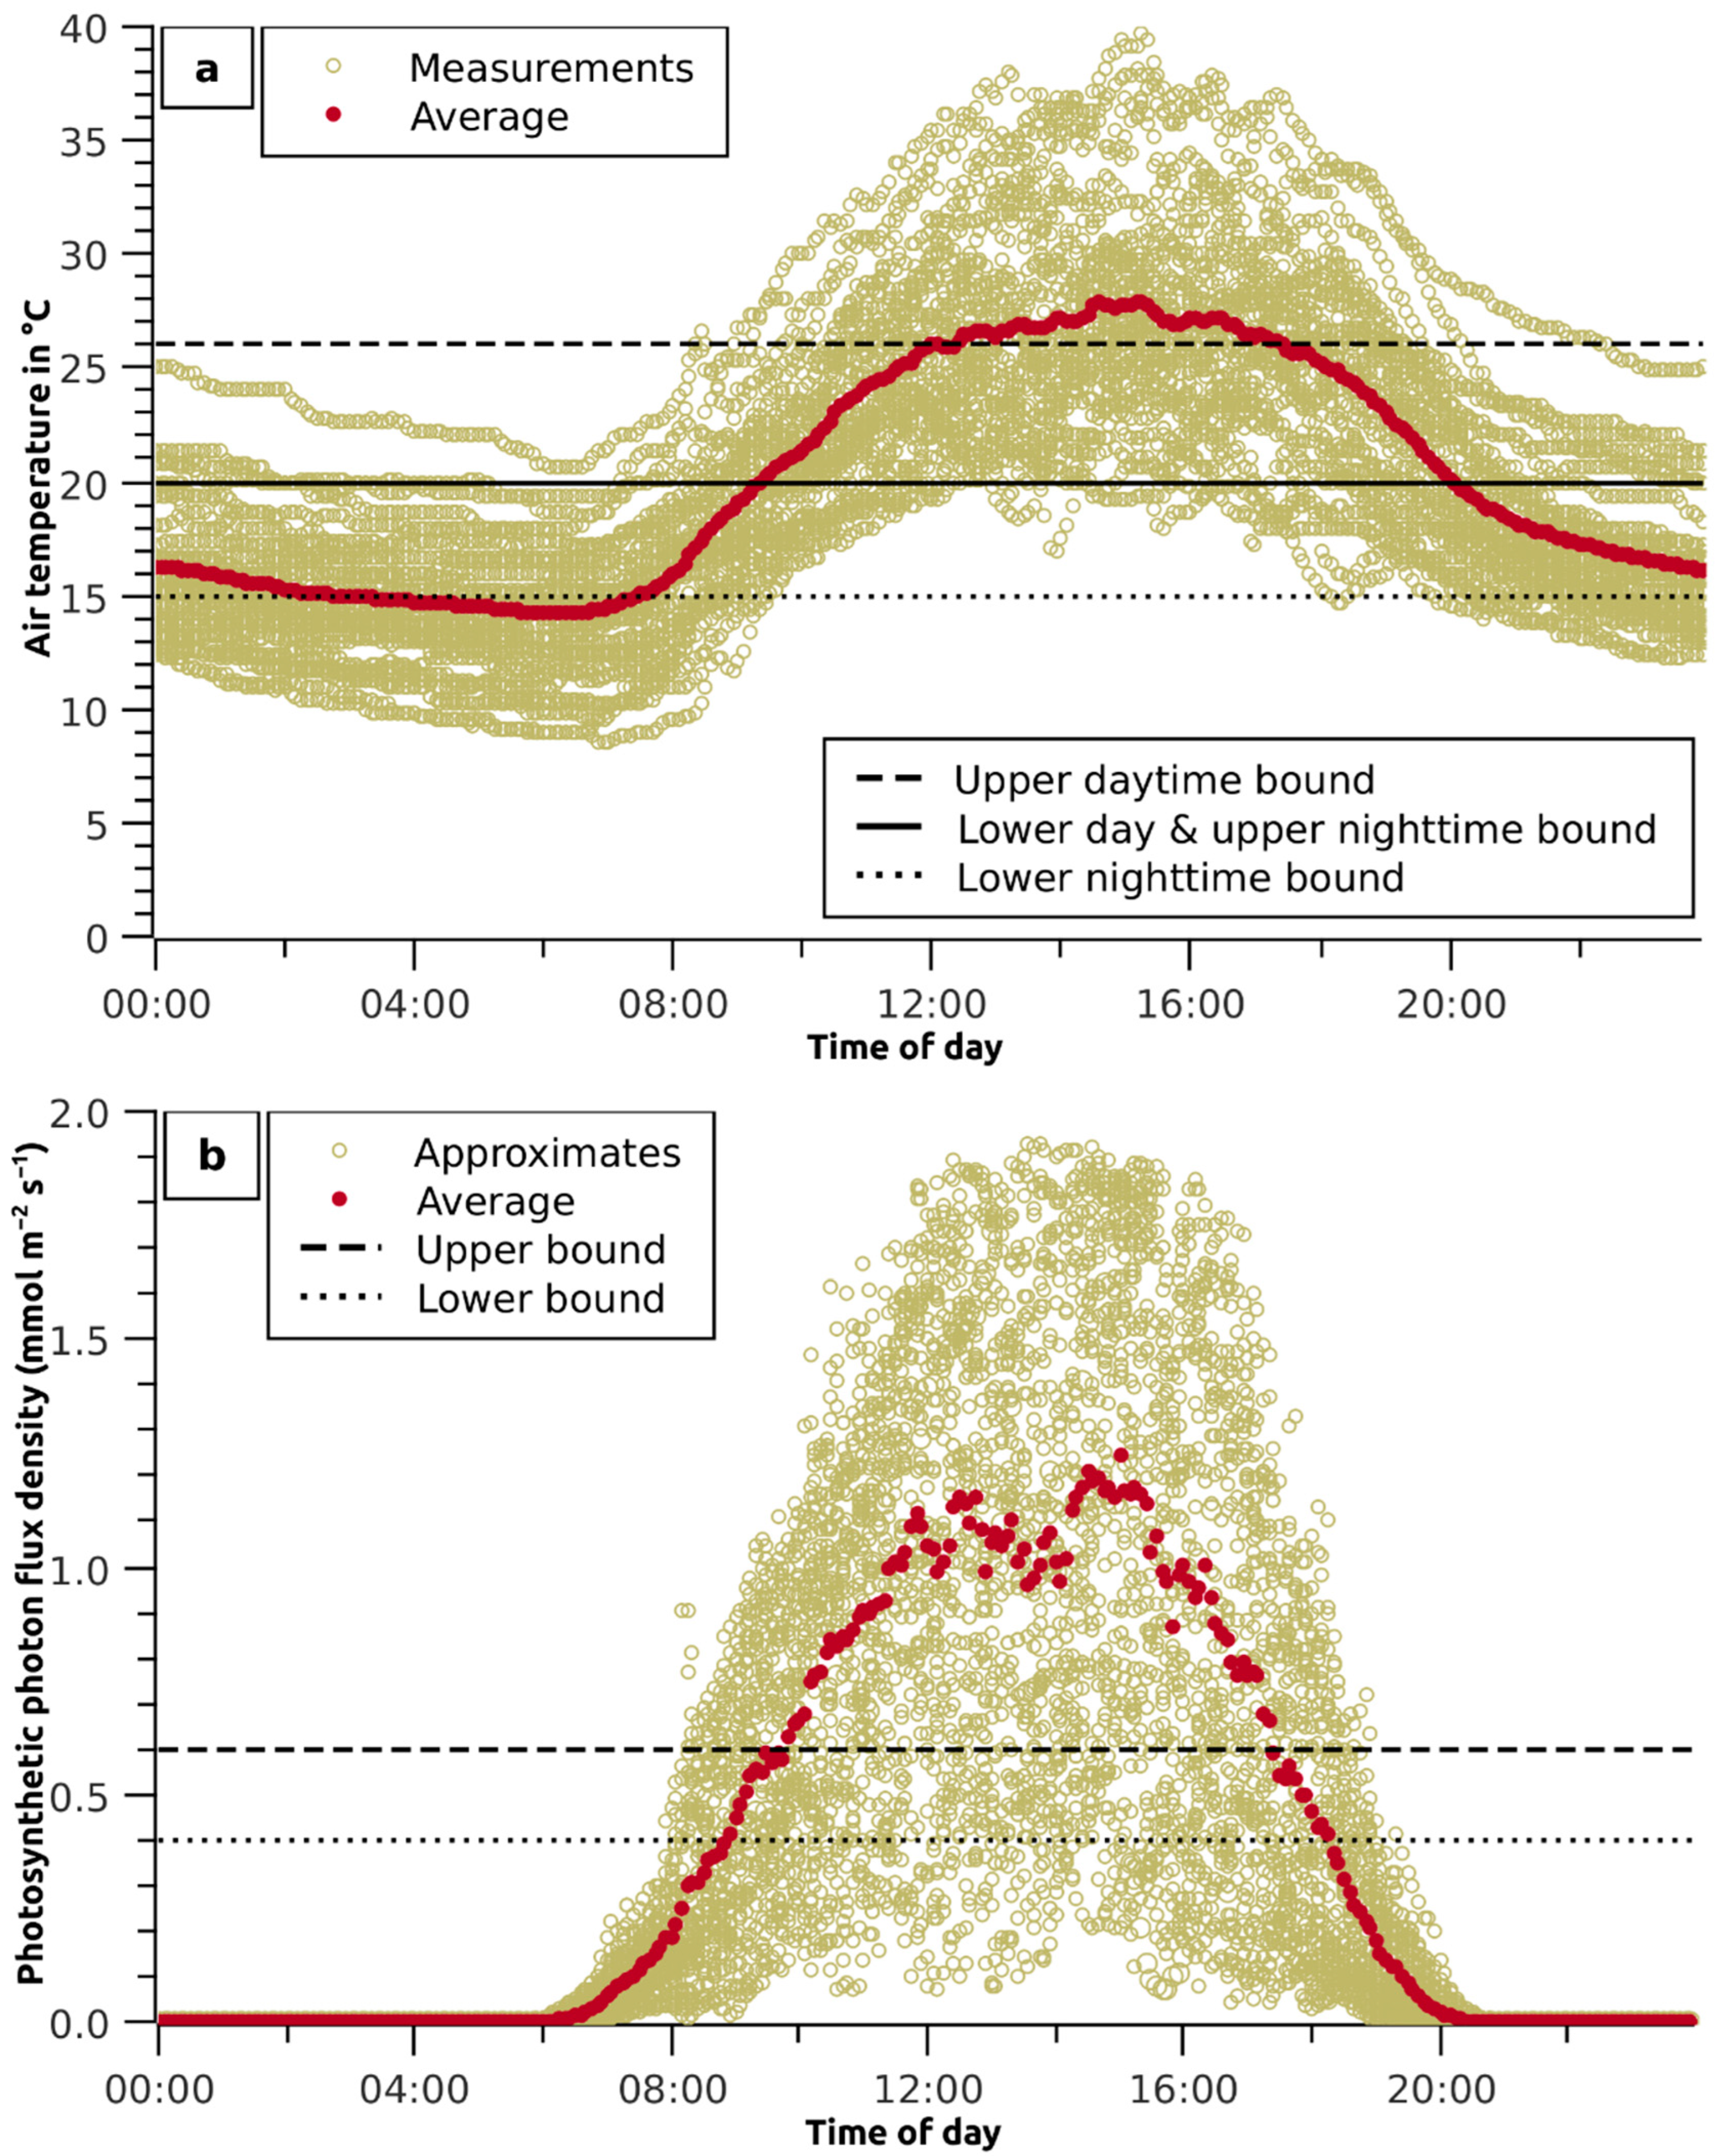
The average temperature in the greenhouse was 20.1 °C, with average night temperatures of 16.5 °C (7:00 p.m. to 7:00 a.m.) and daytime temperatures of 23.7 °C (7:00 a.m. to 7:00 p.m.). Occasional extreme temperatures of 8.6 °C and 39.7 °C were recorded (Figure 1a). The water temperature in the lines was in the range of 8 °C to 35 °C, with a total average of 18.5 °C. No difference in water temperatures between the lines and the sections was noted. The air and water temperatures were even at the lower range, while the water temperature was about 5 °C lower than the air temperature at noon. The relative humidity was, on average, 73%, with only 1.5% of the measurements above 85% and 0.6% of the measurements below 50%.
The peak photosynthetic photon flux density occurred with average values from 1.0 to 1.2 mmol s−1 m−2 between 12 pm and 4 pm, as indicated by approximation from the lux values (Figure 1b).
3.1.2. Treatment Solutions
Nutrient Contents
The initial concentrations of N, P, K, Zn and Fe in the treated wastewater were lower, those of S, Mg, Mn and B were similar, and those of Ca and Na were higher than those in HS (Figure 2, irrigation water). The Cu concentration should have been similar to that of HS, if not for impurities in the service water used in the preparation of the HS.
The concentrations of N and P in CE and CEO were only about 3% and 40% of those of the AN and ANC lines, respectively, while the S concentration was 29% higher than that in AN and ANC. ANC achieved outstanding lower concentrations of B and micronutrient cations (Cu, Fe, Mn and Zn). In the 12 AN samples, Fe was thrice below the detection limit. For ANC, Fe was below detection the limit in all, Cu in 9, and Mn in 4 samples. Fe and Cu were below the detection limit in three CE samples.
The relative standard deviation of the element concentrations was above 25% for Cu, Fe (always below the detection limit for ANC), Mn (except for CE) and Zn. In general, the relative standard deviation of the element concentrations in AN and ANC was higher than that in CE and CEO, reflecting the homogenisation of a large influent volume in the biological treatment tank.
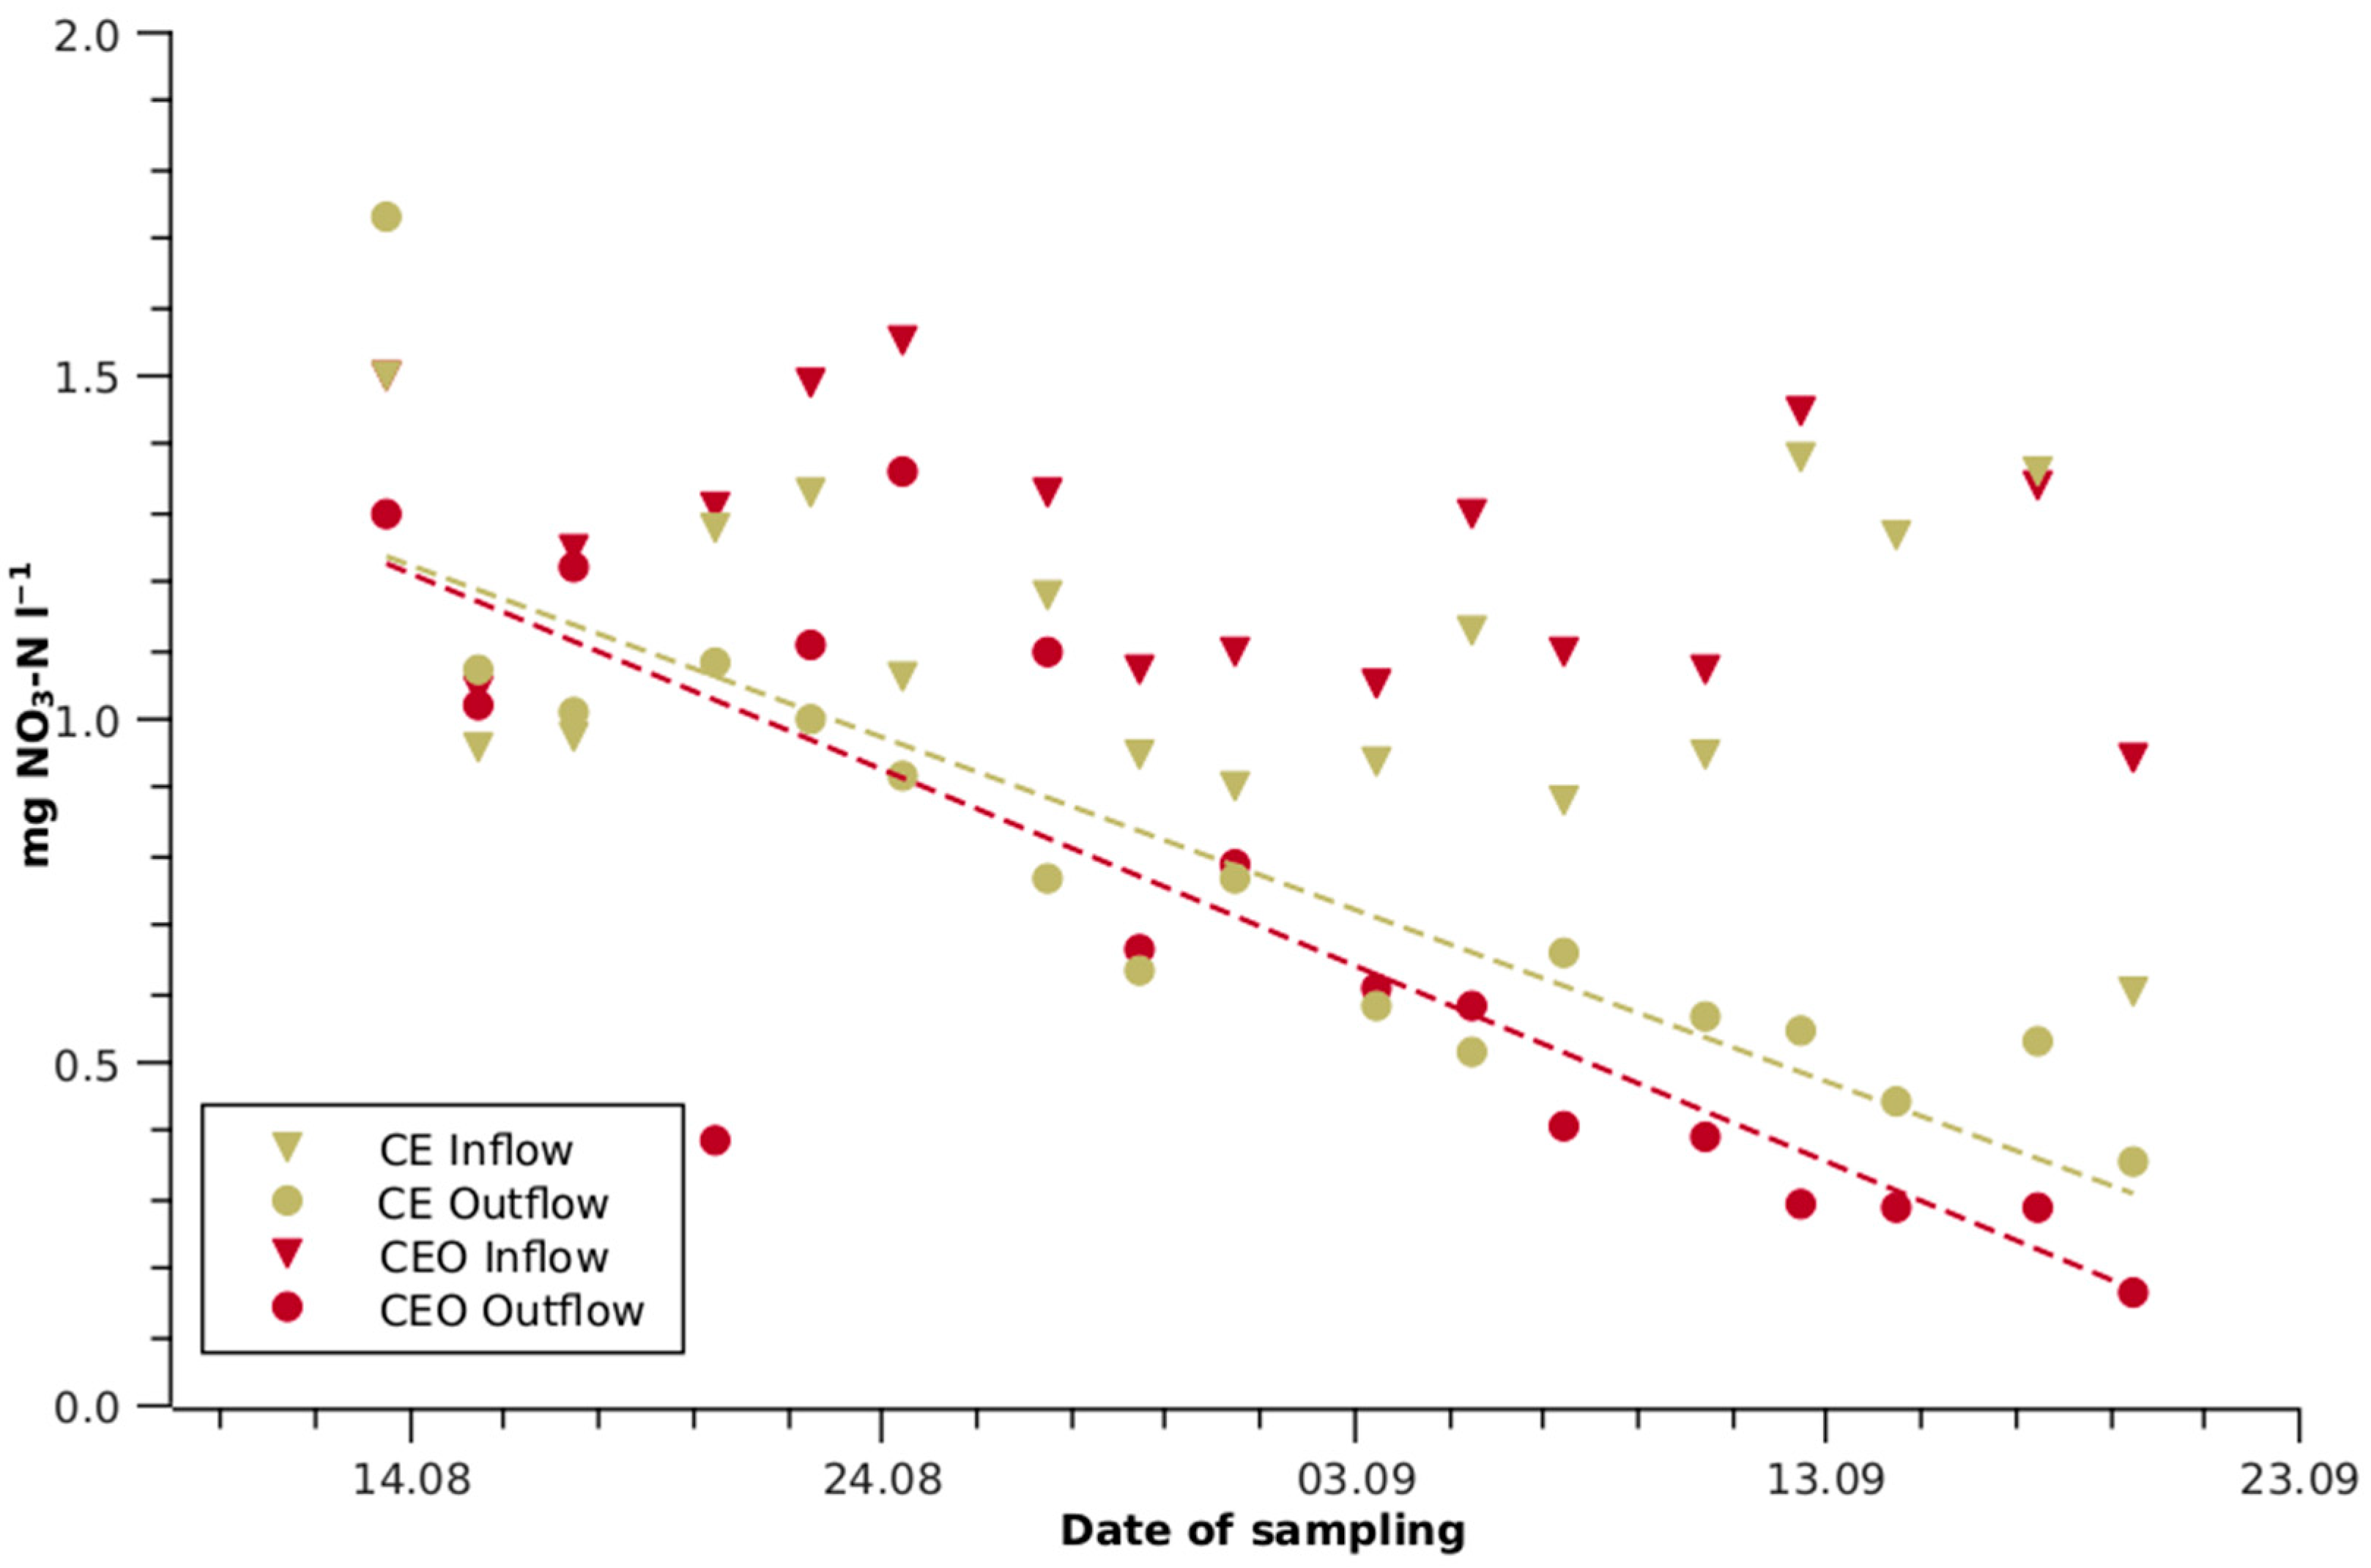
Towards the end of the experiment, the Mn, Zn and Fe concentrations of all TWWs were reduced from 25 to 99% during passage from the front to the end section. In AN, the Cu concentration was also reduced by 51%. The N concentration was lowered by 33% in CE and by 50% in CEO, while no significant changes were observed in AN and ANC. The N reduction in the CE and CEO outflows became increasingly prominent towards the end of the experiment (Figure 3). During the last two weeks, the outflow concentration of CEO remained consistently 20 to 50% below that of CE.
Sodium was omnipresent in all TWW line sections with concentrations in a narrow range between 65 and 70 mg L−1. In HS, the Na concentration was, on average, 30 mg L−1.
pH
The HS pH, initially adjusted to 5.8, increased over time to 6.8 and, after the refilling of the line, to 7.0. There was no pH difference between the sections and the average of all measurements was 6.5. The average pH of the front and end sections of the four TWW lines remained stable at about 7.4 throughout the experiment.
Electrical Conductivity (EC)
The EC of HS decreased from 1.6 to 1.1 in the first and to 0.7 mS cm−1 in the second filling and was, on average, 1.2 mS cm−1. In CE and CEO, the EC was 0.8, and in AN and ANC, it was 0.9 mS cm−1. The EC remained stable in all TWW lines throughout the experiment.
Dissolved Oxygen (DO)
DO in the HS control was, on average, 5.1 mg L−1. In all TWW treatments, DO decreased along the lines and towards the end of the experiment, slightly higher DO concentrations were recorded (Table 1). The DO concentration fell below the recommended practical minimum of 4 mg L−1 [17] thrice for HS, once for AN, and twice for ANC.
3.1.3. Plant Development
Biomass
The highest fresh shoot weight was obtained in the AN treatment (Figure 4a). With an average over the whole line of 183 g, the shoots weighed 22 g, 34 g, 81 g and 103 g more than those in the HS, ANC, CEO and CE treatments, respectively. Based on dry matter, the weight advantage of AN over ANC, CE and CEO remained significant (Figure 4b). Accordingly, the fresh shoot weight advantage of AN over HS plants was primarily due to the higher water content. The weight advantage of HS over CE and CEO was significant, but the differences were much smaller when comparing only the front section and not significant for fresh matter between HS and CEO. Along the CE and CEO lines, the shoot fresh and dry matter weights decreased, while the dry matter content increased. An increase in the dry weight content was also observed in the roots (Figure 4c). The shoot fresh weight advantages of CEO over CE and AN over ANC were outstanding, but not significant on a dry weight basis, except for the AN/ANC end section. The lowest ratio of dry to fresh shoot matter was found in the front sections of the CEO and AN lines. While the ratio remained at the same level in AN, it increased distinctly towards the end of the CEO line. This trend was even more pronounced for CE.
The fresh matter root-to-shoot ratio in HS, AN and ANC was about 0.12 independently of the section in all lines. In CE, the ratio increased from 0.23 in the front section to 0.64 in the end section; that in CEO increased accordingly from 0.19 to 0.62.
Shoot and Root Nutrient Content
The nutrient contents in shoots and roots were frequently higher in the front sections than those in the end sections (Figure 2). This difference was particularly striking for N and P (CE and CEO), K (CE), Ca and Mg (CEO), Mn and Zn (CEO, AN), Mo (HS and CEO) and Cu (CEO).
The shoot N was about 4 mg kg−1 in HS (Figure 2), with no significant difference between line sections, while the shoots from the end of the CE and CEO lines had exceptionally low N contents of 2 mg kg−1. P showed a similar pattern to N, with the lowest shoot content of 3.6 g kg−1 in the end section of CE. The S content in the shoots from the fronts and ends of all lines differed comparably little, but there was still a significant decrease along the CE and CEO lines. The N, P and S in roots showed largely similar contents and trends.
The Mn content in the shoots from the front section of the CEO line was 17 times higher than that in the corresponding section of the ANC line. In the end section of the ANC line, the Mn content was, with less than 10 mg kg−1, even lower. In the other TWW lines, the Mn contents of the shoots and roots were significantly higher than those in the HS line. Also, for Zn, the shoot contents were higher in the TWW lines than in the HS control, except for CE. The Mo content in all TWW sections and Cu content, except for the CEO front section, were significantly lower than those in HS. As with Mn, the ANC Cu contents were the lowest.
The contents of main plant nutrients and B in the roots were of the same order of magnitude as those in the shoots. In contrast, the root content of Fe was up to 100, those of Mn, Mo and Zn were about 10 and those of Zn were 4 times higher than those in the shoots. Especially for Fe, the difference in root content between the CEO sections was remarkable.
Relative Chlorophyll Concentration
One day after transplanting the seedlings, the average SPAD value was about 25 in all lines. Within two weeks, the SPAD values of the HS leaves increased to 36 and decreased again to 29 until harvest. The SPAD values of the TWW leaves followed this trend, but were, at two and three weeks after transplanting, about 8 SPAD values lower than those of HS (p < 0.05). An exception was the CEO SPAD value in the second week that was 3 points lower than that in the other TWW; this difference was, however, only significant between CEO and AN. At harvest, the HS SPAD value was 3 points higher than those of AN and ANC (p < 0.05) and 2 and 1 points higher than those of CE and CEO (p < 0.05, CEO only).
While the older leaves reached their darkest green colouration towards harvest, the highest SPAD values of the younger leaves were measured in the second and third weeks after transplanting. A decline in the SPAD values from the second week to harvest was prominent for HS (38 to 23, p < 0.01), AN (31 to 19, p < 0.05) and ANC (29 to 21, p < 0.01), which were the lines with the highest N supply. In contrast, the SPAD values of the young CE and CE leaves fell only by less than 5 points and remained near 27 at harvest (ns).
3.1.4. Second Experiment
The average air temperature inside the greenhouse dropped from transplanting to harvest from almost 19 °C to below 10 °C. Accordingly, the minimum, maximum and average water temperatures were 4 °C, 32 °C and 13 °C lower than those in the previous experiment (p < 0.05). The air had 85% relative humidity on average; for 65.6% of all measurements, the values were above 85%. Less than 0.5% of all measured values showed relative humidity below 50%.
The TWW qualities differed from the first experiment, with the 54% (p < 0.001) higher N concentration in CE (2.02 mg L−1) and 63% (p < 0.05, excluding one outlier >10 mg L−1) higher N concentration in CEO (2.6 mg L−1, 2.2 mg L−1 excluding one outlier >10 mg L−1), while the AN and ANC N concentrations remained at the same level as those in the first experiment. The CEO outflow N was reduced by 38% in comparison with the inflow, while no significant reduction was observed in the other lines.
In HS, the pH dropped after the second filling below 4 and the EC was 25% higher than that in the first experiment. Both the pH and EC of the TTWs remained at the levels in the first experiment. In none of the DO measurements of the second experiment were values below 4 mg L−1 found. The CEO outflow DO underestimated the actual average concentration, as three measurements were above the detection range (Table 1). Integrating the data from both experiments, excluding CEO, the DO concentration decreased by 0.2 mg with every 1 °C temperature increase of the nutrient solution (r2 = 0.65).
The HS fresh shoot biomass yield was 78 g and those of CE, CEO, AN and ANC were 10 g, 23 g, 26 g and 23 g, respectively, without any difference between the line sections. The root-to-shoot ratio was, at 0.16, the lowest for HS, followed by ANC and AN, with values of 0.22 and 0.25, respectively. These ratios were stable along the lines and in the same magnitude as those in the first experiment. In the CE line, the ratio decreased from 0.46 at the front to 0.31 at the end (p < 0.005), while in CEO, the ratio was 0.33, without any clear trend. The first three plants in the CEO line had, however, remarkably low ratios of 0.10, 0.22 and 0.27.
The shoot contents of most nutrients were in the same magnitude as those in the first experiment, but no difference between the sections was observed. The average Mn contents of 160, 190 and 210 mg kg−1 in the CE, AN and CEO shoots, respectively, were higher than those in the first experiment. In ANC, Mn remained, with a value of 21 mg kg−1, at a critical level. Also, in the second experiment, the contents of Cu and Zn were higher in the CEO samples than those in the other treatments.
4. Discussion
As expected, lettuce of similar quantities and nutrient contents can be produced with unmodified AN, ANC and CEO, instead of the conventional nutrient solution. The yield advantage of AN over ANC suggests a micronutrient deficiency caused by charcoal filtration. The second hypothesis, that the nutrient compositions of AN and ANC are more suitable for lettuce production than those of CE and CEO, was also confirmed by the nitrogen depletion and decreasing yields along the CE and CEO lines. This observation was even more pronounced in the CEO line due to the higher nutrient uptake. Furthermore, when comparing the two trials, it was found that the lower solar radiation and the lower ambient temperature had a stronger influence on biomass development at low nutrient concentrations. The following discussion refers primarily to the first trial—references to the second trial are marked accordingly.
4.1. Suitability of Unamended Aerobic- and Anaerobic–Aerobic-Treated Domestic Wastewater for Lettuce Production
AN and ANC are more suitable than CE and CEO as nutrient solutions for lettuce due to their higher N and P contents (Table 2). However, as these elements are too highly concentrated in relation to K and some micronutrients, either nutrients present in relative deficiency must be added or the hydroponic system must be followed by residual N and P elimination. Otherwise, the N and P concentrations in the effluent remain too high for legally compliant discharge into natural waters.
The N concentration calculated from NO3−, NO2− and NH4+ underestimated the actual concentration by dissolved organic N. The latter was degraded by ozonation, producing nitrogen oxides [26], resulting in a 24% higher average CEO-N concentration compared with CE in the first experiment and 31% higher in the second experiment (Table 2). This difference was, however, not statistically significant, probably due to the large variation in the influent quality and the further homogenisation during the ozonation process. The higher N concentrations in CE and CEO during the second experiment are attributed to the lower efficiency of the biological stage of the wastewater treatment plant during the colder season [27].
For complete P uptake by plants, CE and CEO lacked not only N, but also K and Zn (Table 2). In the AN and ANC lines, the ratio between N and P was more balanced, but here, there was also a relative lack of N. Furthermore, K, Mn and Zn were deficient in the AN line, and in ANC, also Fe and Cu. It is possible that the deficits were actually somewhat higher, because the total nutrients (except N) were analysed. However, the deviation should be small, as the nutrients were largely plant-available in treated wastewater [28]. The comparatively high Mo concentration in HS was reflected in the shoot and root contents, which were clearly above those of the TWWs (Figure 2).
To find the reason for the high HS Cu concentrations measured (cf. 2.2.1), the service water used was sampled 21 times in 2018 and 2019. The Cu and Zn concentrations varied strongly between the measurements, but were correlated closely with each other (r2 = 0.87). Therefore, it is likely that bronze pipes that were part of the water network released Cu and Zn [29]. The lower Cu concentrations in CE and CEO compared with those in AN can be explained by the fact that conventional aerobic wastewater treatment removes about 40% of the Cu with the sludge [30].
The gaseous S losses occurring during anaerobic treatment led to reduced S concentrations in AN and ANC (Figure 2). However, due to the comparatively high S concentrations (Table 2), these losses are not a concern from a plant nutrition perspective.
In all TWWs, the EC values were below 1 mS cm−1 and were thus lower than the maximum values recommended for hydroponic tomato cultivation. Shannon and Grieve [31] determined 1.3 mS cm−1 to be the threshold above which the yield of leaf lettuce decreases. Under certain conditions and for certain varieties, higher EC values may be acceptable. Andriolo et al. [32] observed the highest fresh mass production of lettuce at 2 mS cm−1. Cramer and Spurr [33] found that 2.3 g L−1 of NaCl reduced lettuce biomass production by only 10%. Therefore, it can be assumed that, in our experiments, the NaCl concentrations in the order of 180 mg L−1 had no negative effects on plant development.
The decay of O3 always kept the DO in CEO well above saturation, which rules out hypoxic effects. In the HS and the other TWW lines, DO concentrations below the minimum of 4 mg DO L−1 recommended for lettuce were measured only a few times. Goto et al. [34] concluded that the actual physiological threshold for lettuce is below 2.1 mg DO L−1, i.e., much lower than our measurements. However, oxygen solubility decreases with increasing temperature, while root respiration increases [35]. As our sampling took place in the morning hours, the decreased DO values during the hottest part of the day in HS, CE, AN and ANC might have been overlooked. Hypoxic conditions in the root zone reduce plant water uptake [36] and could, therefore, be a reason for the higher dry matter content relative to that of fresh matter observed in the CE compared with the CEO line. In the second experiment, a lack of oxygen in the nutrient solutions can be ruled out due to the higher DO values measured and lower temperatures.
Nutrient Uptake of Lettuce from Aerobically and Anaerobically–Aerobically Treated Domestic Wastewater
The range of the literature data on the nutrient contents of lettuce (Table 2) reflects varietal effects, growth stages and climatic influences on nutrient assimilation. Nevertheless, the mean value provides a solid indication of a balanced nutrient composition of lettuce and corresponds well with the nutrient content of the HS shoots (Figure 2). Towards the end of the first trial, when the daily fresh mass gain of the well-supplied plants in the front sections reached about 10 g, the N demand in relation to the whole line clearly exceeded the N supply in CE and CEO (Table 2), which led to a strong decrease in the N concentrations along these lines (Figure 3).
The N content of the shoots in the CEO front section was higher, but similar to CE in the end section (Figure 2). The higher N uptake by the CEO plants was probably not only related to the higher N availability due to ozone degradation of dissolved organic N, but also because nitrate uptake was stimulated by the high cation content. Broadley et al. [37] concluded, from indirect evidence, that the cell expansion rate is the most important growth component affected by N deficiency. This is reflected in the lower shoot water content in the CE front section and the decreasing water content along the CE and CEO lines. Towards the end of the experiment, N limitation became more pronounced in the CE and CEO lines, as reflected both in the minimised N concentrations in the effluent (Figure 3) and in the decreasing SPAD values.
The high shoot and root N contents in AN and ANC, and root N content in the CEO front section were striking compared with HS (Figure 2). The increased N content indicates NO3− accumulation, suggesting impaired NO3− reductase activity due to Mo deficiency [38]. Particularly strong accumulation of N, as in the roots (Figure 2), was also observed by Kovács et al. [39] with reduced Mo availability in maize.
While earlier studies indicated that the Mo content in the leaf should not fall below 1 mg kg−1 [40,41], more recent studies showed a higher Mo requirement. The data from Moncada et al. [38] and Steiner et al. [42] are consistent with an optimum in the order of 2 mg Mo kg−1. Although Mo deficiency probably led to the N accumulation mentioned above, the effects on biomass accumulation cannot be directly attributed to Mo deficiency. For example, the biomass production of ANC plants was lower, but the Mo content was higher than that in AN. Thus, Mo deficiency might have limited the development of AN plants, but this effect was probably overridden by the acute Mn and/or Cu deficiency in ANC.
As with N, the P contents of the CE line and at the end of the CEO line were clearly below the target value (Figure 2, Table 2). However, in contrast with N, the P concentrations at the end of the CE and CEO lines were not strongly reduced, indicating limited P uptake. Root respiration decreases under N deprivation [43], limiting the energy available for P uptake [44]. This explains the decrease in the biomass P content at stable DO and P concentrations along the CEO line. The promotion of P uptake by DO supersaturation observed by Tanaka et al. [45], therefore, requires adequate N supply and assimilate production to match the increased root respiration. In addition to the above effects of N, induced P deficiency may have further increased the dry matter content, as also observed by Pacumbaba and Beyl [46]. The narrowing of the root–shoot ratio (Figure 4a) reflects combined N and P deficiency [47], as plants adapt to N and P deficiency by allocating new biomass to the organs involved in acquiring the most limiting resources.
Similar to N and P, the S content of the shoots also decreased along the CE and CEO lines. The S contents of the AN and ANC roots and leaves in the end sections of these lines were relatively high, despite the gaseous losses during the anaerobic wastewater treatment (Figure 2). This could have been due to S becoming more plant-available during anaerobic treatment. However, no studies have yet been published on the effects of anaerobic treatment on the plant availability of S [48].
In the front section of the HS line, the cation content in the shoot was higher than that in the end section, with the exception of Ca, while the root contents were similar in both sections. The decreasing contents were, therefore, not due to cation undersupply, but probably a consequence of the decreasing N content in the shoots along the line. For Mg, the shoot contents were low in CE and in the end sections of HS and ANC. Given the good Mg supply in all lines, the stable shoot contents of HS, AN and ANC at 3 g kg−1 indicated that the optimum Mg content for the lettuce cultivar used was of the order of the lower literature values (Table 2). The correlation between the shoot N and Mg contents (Figure 2) in the CE and CEO lines was apparently an effect of cation uptake stimulated by anion uptake.
Wallace et al. [49] found that Fe availability limited plant growth when using conventionally treated wastewater. An Fe concentration of 0.1 g L−1 in the treated water resulted in only 25 mg Fe kg−1 lettuce dry matter. The acidification of the water to pH 6 alleviated the deficiency by mobilising the Fe accumulated at the root surface. The high Fe content in the roots and the reduced Fe concentration in the effluent (Figure 2) thus indicate that, in our experiment, oxidised Fe was also deposited on the roots in the front section of the CE and especially in the CEO line.
The roots of broad-leaved plants exude protons into the rhizosphere to reduce Fe3+ to Fe2+ for uptake into the root epidermis. It appears that, in the CEO line, either the protons reacted with residual ozone or its degradation products, hydroxyl radicals and DO, instead of Fe3+, or the reduced Fe2+ was immediately re-oxidised. To compensate for the continuous loss of protons, the roots took up other oxidised metals, probably via the same transporter for divalent metals as for Fe2+ [50]. This explains the strikingly high content of divalent cations in the shoots in the front section of the CEO line, while the K contents did not show any particularity. The high accumulation of divalent cations in the shoots was more evident in the first experiment, where, for example, the Zn content in the shoots of the CEO front was 4.5 times higher than that in CE, while in the second experiment, the Zn content in the CEO shoots was only 1.8 times higher than that in CE.
The Cu contents of the TWW shoots were below those of HS and below the target value, except for those in the front section of the CEO line (Table 2, Figure 2). In this section, the shoot Cu content was comparable to that of the HS line, although the HS Cu concentration was 27 times higher than that in the CEO line. Gharbi et al. [51] observed that lettuce tolerates relatively high Cu levels in the rooting medium and postulated that the plants achieve this by accumulating Cu in the roots and preventing its transfer to the shoots.
This explains the increased root Cu content in the HS line, while the much higher root Cu contents in the CEO and AN lines were more likely to be due to deposition on the root surface. Above concentrations of 310 µg L−1, Cu toxicity in lettuce sets in and reduces root development [52]. As the Cu concentration in HS hardly exceeded this value and no effects on root biomass were evident (Figure 4), it was assumed that plant development was not affected by the high HS Cu concentration. In ANC, the shoot Cu was limited by Cu availability, resulting in shoot contents below 3 mg kg−1.
No effects of the different pH values between the HS and the TWW line on the nutrient uptake and, thus, the content in the biomass were discernible (Figure 2).
4.2. Greenhouse Climate and Water Temperatures
The air temperature in the greenhouse frequently deviated from the optimal daytime and nighttime temperature in the ranges of 20 to 26 °C and 15 to 20 °C, respectively [15]. In 37% of all records, the daytime temperatures were above the upper range limits and, in 35% of all cases, they were below the lower range limits (Figure 1). The root zone temperature correlated strongly with air temperature and deviated with its amplitude from the optimal root zone temperature of 24 °C [53]. Most plants are sensitive to unstable root zone temperatures. Hydroponic strawberries respond with a 30% drop in production when their roots are exposed to a daily root zone temperature variation of ±15 °C compared with stable temperatures [54].
Tibbitts and Bottenberg [55] found that lettuce grows faster and forms larger heads with a higher water content at 85% relative humidity than at 50%. Higher humidity favours phytopathogenic infections, and at lower humidity, the plant closes its stomata to control transpiration, which also limits gas exchange and assimilation. In the first trial, the relative humidity was mostly within the above range, while in the second trial, the air was mostly too humid.
The comparison of the approximate values of the photosynthetic photon flux density with the optimal range given by Weiguo et al. [56] shows that the flux intensity was mostly supersaturated and, to a lesser extent, mainly in the early morning and late evening hours, undersaturated. He et al. [57], working under similar light conditions as those in our first experiment, confirmed that lettuce suffers from light stress at flux densities above 800 µmol s−1 m−2. The lower biomass development in the second experiment was primarily due to restricted photosynthesis as a result of the low light conditions. Zhou et al. [58] showed that a decrease in photosynthetic photon flux density from 350 to 100 µmol s−1 m−2 at low day and night temperatures of 10/15 °C decreased biomass production by 85%, while an increase in temperature to 18/23 °C at 350 µmol s−1 m−2 increased production by 56%. The nutrient content of the shoots was comparable to or higher than that in the first experiment, underlining light-limited assimilation.
The deviation from the optimal temperature range, the strong diurnal temperature fluctuations in the root zone, the light undersaturation and supersaturation, as well as the reduced leaf area index due to narrow plant spacing in both trials and, in addition, the too-high relative humidity in the second trial are likely to have restricted plant development.
4.3. Effect of Ozonation at Low Temperatures
The higher biomass production in the CEO line than that in the CE line at lower temperatures in the second experiment raises the question of which condition improved the growth of the CEO lettuce. Throughout the experiment, the DO levels in both lines were close to saturation, which rules out a hypoxic effect. It is also unlikely that the higher N availability was the main cause of the CEO advantage. On the one hand, the proportion of dissolved organic N was comparatively low, and on the other hand, the lowest N concentrations in the effluent of the lines were about ten times higher than those in the first experiment. Therefore, supersaturated DO or residual ozone may be possible causes: (i) Tanaka et al. [45] observed that supersaturated DO improved water uptake and plant growth of tomato at low N and P concentrations. In contrast, when lettuce was grown at higher nutrient concentrations, there was no positive effect of DO supersaturation [34,59]. In a full-strength nutrient solution, excessive aeration even limits the root activity, nutrient concentration in sap and, eventually, shoot growth of cucumber [60]. (ii) Decreased ozone decay in water at low temperatures [61] may have increased the amount of residual ozone entering the hydroponic line. At low nutrient concentrations, traces of reactive oxygen in the nutrient solution have been shown to promote plant development [62]. Positive effects of the ozonation of nutrient solutions have also been observed in tomato, chard and cucumber grown in full-strength nutrient solutions [63,64,65]. Nonetheless, greenhouse operators using ozonation to control microbial contamination usually remove ozone residues before distribution to avoid any damage to their crops [63]. However, Ohashi-Kaneko et al. [66] detected no reduction in tomato shoot and root development upon weekly exchange of nutrient solution prepared with ozonised water. The low shoot-to-root ratios of the first plants in the CEO line in the second experiment suggest that damage to roots occurs only at high and constant levels of residual ozone.
5. Conclusions and Prospects
The experiments showed that aerobic and anaerobically–aerobically treated domestic wastewater is suitable for growing lettuce in flow-through hydroponic systems under climatic conditions that allow high transpiration rates. To overcome the yield limitations associated with the nutrient imbalance of N- and P-poor water, such as CE and CEO, the water throughput must be increased. For AN and ANC, which were cation deficient, a higher water throughput would result in N- and P-rich effluent that needs to be further treated before discharge into surface water. Using “feed and deplete” instead of a flow-through mode could improve the nutrient use efficiency and effluent quality. In this mode, the system would be filled with treated wastewater, enriched with nutrients that are in deficiency and cycled until the N and P content is depleted by the plants before being refilled.
Prospects for coupling wastewater treatment with subsequent hydroponics are seen in three areas: (i) to enable low-tech wastewater treatment plants to comply with high effluent standards regarding nutrients, (ii) to achieve highly efficient nutrient recovery from a resource hardly used and (iii) for further polishing after secondary treatment. Owing to the increased root absorption of metals and uptake of nutrients from CEO, hydroponics for TWW polishing could be especially advantageous where ozonation is already implemented for effluent hygienisation.
Our results have to be viewed in consideration of a few limitations in the study design and implementation. The study was conducted in a pilot-type greenhouse to validate the combined wastewater treatment and hydroponic plant production system. Therefore, it did not allow for the repetition of the lines and only sample groups could be used for comparison. This probably disguised relevant differences between the treatments. However, the major effects discussed were prominent and unlikely to have suffered distortion due to the lack of real repetitions. The HS line was not managed close enough to commercial practice. Consequently, the depletion of the nutrient solution progressed too far before exchange. While this could have resulted in a disadvantage in biomass development in comparison with the TWW treatment lines, no deficiency symptoms were observed. The second experiment was conducted later in the year. Owing to lower temperatures and less solar radiation, which resulted in lower growth and nutrient uptake, it was not possible to use the results of the second experiment to validate the results of the first experiment.
Questions that remain to be investigated are: (i) to what level can nutrient solutions be depleted before the uptake is too low for optimal plant growth, (ii) what caused higher biomass production in CEO compared with the CE line in the second experiment and (iii) what caused the high S uptake of the AN and ANC plants despite the S concentrations being lower than those in CE and CEO? Further, the hypotheses that (iv) lacking Mo in wastewater-based nutrient solutions limits the NO3− reductase activity and (v) root exudate protons reacted with residual ozone in the CEO line require validation.
Author Contributions
Conceptualisation, J.G. and T.D.; methodology, J.G.; formal analysis, J.G.; investigation, J.G., A.B. and C.B.; writing—original draft preparation, J.G.; writing—review and editing, F.R., C.B., T.D. and A.B.; supervision, F.R.; project administration, T.D.; funding acquisition, T.D. and J.G. All authors have read and agreed to the published version of the manuscript.
Funding
This project was carried out within the measure ‘Future-Oriented Technologies and Concepts to Increase Water Availability by Water Reuse and Desalination’ funded by the German Federal Ministry of Education and Research (grant number: 02WAV1402).
Acknowledgments
We express our appreciation to Paul Miehe for his support in conducting the experiments. We would like to thank the Wolfsburger Entwässerungsbetriebe for providing infrastructure, support for research and laboratory analyses, and the Braunschweig Wastewater Association and the Core Facility Hohenheim also for conducting analyses.
Conflicts of Interest
The authors declare no conflict of interest.
References
- Burek, P.; Satoh, Y.; Fischer, G.; Kahil, M.T.; Scherzer, A.; Tramberend, S.; Nava, L.F.; Wada, Y.; Eisner, S.; Flörke, M. Water Futures and Solution—Fast Track Initiative (Final Report); International Institute for Applied Systems Analysis: Laxenburg, Austria, 2016. [Google Scholar]
- Adrover, M.; Moyà, G.; Vadell, J. Use of Hydroponics Culture to Assess Nutrient Supply by Treated Wastewater. J. Environ. Manag. 2013, 127, 162–165. [Google Scholar] [CrossRef] [PubMed]
- Boyden, B.H.; Rababah, A.A. Recycling Nutrients from Municipal Wastewater. Desalination 1996, 106, 241–246. [Google Scholar] [CrossRef]
- Vaillant, N.; Monnet, F.; Sallanon, H.; Coudret, A.; Hitmi, A. Treatment of Domestic Wastewater by an Hydroponic NFT System. Chemosphere 2003, 50, 121–129. [Google Scholar] [CrossRef] [PubMed]
- Bawiec, A. Efficiency of Nitrogen and Phosphorus Compounds Removal in Hydroponic Wastewater Treatment Plant. Environ. Technol. 2019, 40, 2062–2072. [Google Scholar] [CrossRef]
- Norström, A. Treatment of Domestic Wastewater Using Microbiological Processes and Hydroponics in Sweden; KTH Royal Institute of Technology in Stockholm: Stockholm, Sweden, 2005. [Google Scholar]
- Maruo, T.; Takagaki, M.; Shinohara, Y. Critical Nutrient Concentrations for Absorption of Some Vegetables. Acta Hortic. 2004, 644, 493–499. [Google Scholar] [CrossRef]
- Hartz, T.K.; Johnstone, P.R.; Williams, E.; Smith, R.F. Establishing Lettuce Leaf Nutrient Optimum Ranges Through DRIS Analysis. HortScience 2007, 42, 143–146. [Google Scholar] [CrossRef] [Green Version]
- Sosa, A.; Padilla, J.; Ortiz, J.; Etchevers, J.D. Biomass Accumulation and Its Relationship with the Demand and Concentration of Nitrogen, Phosphorus, and Potassium in Lettuce. Commun. Soil Sci. Plant Anal. 2012, 43, 121–133. [Google Scholar] [CrossRef]
- Bliedung, A.; Dockhorn, T.; Germer, J.; Mayerl, C.; Mohr, M. Experiences of Running a Hydroponic System in a Pilot Scale for Resource-Efficient Water Reuse. J. Water Reuse Desalination 2020, 10, 347–362. [Google Scholar] [CrossRef]
- Epstein, E.; Bloom, A.J. Mineral Nutrition of Plants: Principles and Perspectives, 2nd ed.; Sinauer Associates: Sunderland, MA, USA, 2005; ISBN 978-0-87893-172-9. [Google Scholar]
- Altmann, J.; Rehfeld, D.; Träder, K.; Sperlich, A.; Jekel, M. Combination of Granular Activated Carbon Adsorption and Deep-Bed Filtration as a Single Advanced Wastewater Treatment Step for Organic Micropollutant and Phosphorus Removal. Water Res. 2016, 92, 131–139. [Google Scholar] [CrossRef]
- Mailler, R.; Gasperi, J.; Coquet, Y.; Derome, C.; Buleté, A.; Vulliet, E.; Bressy, A.; Varrault, G.; Chebbo, G.; Rocher, V. Removal of Emerging Micropollutants from Wastewater by Activated Carbon Adsorption: Experimental Study of Different Activated Carbons and Factors Influencing the Adsorption of Micropollutants in Wastewater. J. Environ. Chem. Eng. 2016, 4, 1102–1109. [Google Scholar] [CrossRef] [Green Version]
- Carruthers, T.J.B.; Longstaff, B.J.; Dennison, W.C.; Abal, E.G.; Aioi, K. Chapter 19—Measurement of Light Penetration in Relation to Seagrass. In Global Seagrass Research Methods; Short, F.T., Coles, R.G., Eds.; Elsevier Science: Amsterdam, The Netherlands, 2001; pp. 369–392. ISBN 978-0-444-50891-1. [Google Scholar]
- Choi, K.Y.; Paek, K.Y.; Lee, Y.B. Effect of Air Temperature on Tipburn Incidence of Butterhead and Leaf Lettuce in a Plant Factory. In Transplant Production in the 21st Century: Proceedings of the International Symposium on Transplant Production in Closed System for Solving the Global Issues on Environmental Conservation, Food, Resources and Energy; Kubota, C., Chun, C., Eds.; Springer: Dordrecht, The Netherlands, 2000; pp. 166–171. ISBN 978-94-015-9371-7. [Google Scholar]
- Zhang, X.; He, D.; Niu, G.; Yan, Z.; Song, J. Effects of Environment Lighting on the Growth, Photosynthesis, and Quality of Hydroponic Lettuce in a Plant Factory. Int. J. Agric. Biol. Eng. 2018, 11, 33–40. [Google Scholar] [CrossRef]
- Brechner, M.; Both, A.J.; CEA Staff. Hydroponic Lettuce Handbook; Cornell Controlled Environment Agriculture: Ithaca, NY, USA, 1996; pp. 504–509. [Google Scholar]
- Bergmann, W. Nutritional Disorders of Plants: Development, Visual and Analytical Diagnosis; Gustav Fischer: Jena, Germany, 1992; ISBN 978-1-56081-357-6. [Google Scholar]
- Eysinga, J.P.N.L.R.V.; Smilde, K.W. Nutritional Disorders in Glasshouse Lettuce; Centre for Agricultural Publishing and Documentation: Wageningen, The Netherlands, 1971; ISBN 978-90-220-0349-7. [Google Scholar]
- Kelly, S.D.; Bateman, A.S. Comparison of Mineral Concentrations in Commercially Grown Organic and Conventional Crops—Tomatoes (Lycopersicon esculentum) and Lettuces (Lactuca sativa). Food Chem. 2010, 119, 738–745. [Google Scholar] [CrossRef]
- Baslam, M.; Morales, F.; Garmendia, I.; Goicoechea, N. Nutritional Quality of Outer and Inner Leaves of Green and Red Pigmented Lettuces (Lactuca sativa L.) Consumed as Salads. Sci. Hortic. 2013, 151, 103–111. [Google Scholar] [CrossRef]
- Urbano, V.R.; Mendonça, T.G.; Bastos, R.G.; Souza, C.F. Effects of Treated Wastewater Irrigation on Soil Properties and Lettuce Yield. Agric. Water Manag. 2017, 181, 108–115. [Google Scholar] [CrossRef]
- Riga, P.; Benedicto, L. Effects of Light-Diffusing Plastic Film on Lettuce Production and Quality Attributes. Span. J. Agric. Res. 2017, 15, 0801. [Google Scholar] [CrossRef] [Green Version]
- Msilini, N.; Attia, H.; Rabhi, M.; Karray, N.; Lachaâl, M.; Ouerghi, Z. Responses of Two Lettuce Cultivars to Iron Deficiency. Exp. Agric. 2012, 48, 523–535. [Google Scholar] [CrossRef]
- El-Nakhel, C.; Pannico, A.; Kyriacou, M.C.; Giordano, M.; De Pascale, S.; Rouphael, Y. Macronutrient Deprivation Eustress Elicits Differential Secondary Metabolites in Red and Green-Pigmented Butterhead Lettuce Grown in a Closed Soilless System. J. Sci. Food Agric. 2019, 99, 6962–6972. [Google Scholar] [CrossRef]
- Van Geluwe, S.; Braeken, L.; Van der Bruggen, B. Ozone Oxidation for the Alleviation of Membrane Fouling by Natural Organic Matter: A Review. Water Res. 2011, 45, 3551–3570. [Google Scholar] [CrossRef] [Green Version]
- Li, L.; Qian, G.; Ye, L.; Hu, X.; Yu, X.; Lyu, W. Research on the Enhancement of Biological Nitrogen Removal at Low Temperatures from Ammonium-Rich Wastewater by the Bio-Electrocoagulation Technology in Lab-Scale Systems, Pilot-Scale Systems and a Full-Scale Industrial Wastewater Treatment Plant. Water Res. 2018, 140, 77–89. [Google Scholar] [CrossRef]
- Ofori, S.; Puškáčová, A.; Růžičková, I.; Wanner, J. Treated Wastewater Reuse for Irrigation: Pros and Cons. Sci. Total Environ. 2021, 760, 144026. [Google Scholar] [CrossRef]
- Turner, E.; Gian, R. Corrosion Control Techniques. In Internal Corrosion Control in Water Distribution Systems; Manual of Water Supply Practices; American Water Works Association: Denver, CO, USA, 2011; ISBN 978-1-58321-790-0. [Google Scholar]
- da Silva Oliveira, A.; Bocio, A.; Trevilato, T.M.B.; Takayanagui, A.M.M.; Domingo, J.L.; Segura-Muñoz, S.I. Heavy Metals in Untreated/Treated Urban Effluent and Sludge from a Biological Wastewater Treatment Plant. Environ. Sci. Pollut. Res. Int. 2007, 14, 483. [Google Scholar] [CrossRef] [PubMed]
- Shannon, M.C.; Grieve, C.M. Tolerance of Vegetable Crops to Salinity. Sci. Hortic. 1998, 78, 5–38. [Google Scholar] [CrossRef]
- Andriolo, J.L.; da Luz, G.L.; Witter, M.H.; Godoi, R.d.S.; Barros, G.T.; Bortolotto, O.C. Growth and Yield of Lettuce Plants under Salinity. Hortic. Bras. 2005, 23, 931–934. [Google Scholar] [CrossRef] [Green Version]
- Cramer, G.R.; Spurr, A.R. Responses of Lettuce to Salinity. I. Effects of NaCl and Na2SO4 on Growth. J. Plant Nutr. 1986, 9, 115–130. [Google Scholar] [CrossRef]
- Goto, E.; Both, A.J.; Albright, L.D.; Langhans, R.W.; Leed, A.R. Effect of Dissolved Oxygen Concentration on Lettuce Growth in Floating Hydroponics. Acta Hortic. 1996, 440, 205–210. [Google Scholar] [CrossRef]
- Atkin, O.K.; Edwards, E.J.; Loveys, B.R. Response of Root Respiration to Changes in Temperature and Its Relevance to Global Warming. New Phytol. 2000, 147, 141–154. [Google Scholar] [CrossRef]
- Goto, K.; Yabuta, S.; Tamaru, S.; Ssenyonga, P.; Emanuel, B.; Katsuhama, N.; Sakagami, J.-I. Root Hypoxia Causes Oxidative Damage on Photosynthetic Apparatus and Interacts with Light Stress to Trigger Abscission of Lower Position Leaves in Capsicum. Sci. Hortic. 2022, 305, 111337. [Google Scholar] [CrossRef]
- Broadley, M.R.; Escobar-Gutiérrez, A.J.; Burns, A.; Burns, I.G. Nitrogen-Limited Growth of Lettuce Is Associated with Lower Stomatal Conductance. New Phytol. 2001, 152, 97–106. [Google Scholar] [CrossRef]
- Moncada, A.; Miceli, A.; Sabatino, L.; Iapichino, G.; D’Anna, F.; Vetrano, F. Effect of Molybdenum Rate on Yield and Quality of Lettuce, Escarole, and Curly Endive Grown in a Floating System. Agronomy 2018, 8, 171. [Google Scholar] [CrossRef] [Green Version]
- Kovács, B.; Puskás-Preszner, A.; Huzsvai, L.; Lévai, L.; Bódi, É. Effect of Molybdenum Treatment on Molybdenum Concentration and Nitrate Reduction in Maize Seedlings. Plant Physiol. Biochem. 2015, 96, 38–44. [Google Scholar] [CrossRef] [Green Version]
- van den Ende, J.; Boertje, G.A. Molybdenum Deficiency in Young Lettuce and Tomato Plants. Acta Hortic. 1972, 26, 61–67. [Google Scholar] [CrossRef] [Green Version]
- Plant, W. Molybdenum Deficiency in Lettuce. Nature 1952, 169, 803. [Google Scholar] [CrossRef]
- Steiner, F.; Zoz, T.; Zuffo, A.M.; Machado, P.P.; Zoz, J.; Zoz, A. Foliar Application of Molybdenum Enhanced Quality and Yield of Crispleaf Lettuce (Lactuca Sativa L., Cv. Grand Rapids). Acta Agronómica 2018, 67, 73–78. [Google Scholar] [CrossRef]
- Bloom, A.J.; Sukrapanna, S.S.; Warner, R.L. Root Respiration Associated with Ammonium and Nitrate Absorption and Assimilation by Barley. Plant Physiol. 1992, 99, 1294–1301. [Google Scholar] [CrossRef] [Green Version]
- Schachtman, D.P.; Reid, R.J.; Ayling, S.M. Phosphorus Uptake by Plants: From Soil to Cell. Plant Physiol. 1998, 116, 447–453. [Google Scholar] [CrossRef] [Green Version]
- Tanaka, G.; Yamashita, Y.; Nakabayashi, K. Effect of Supersaturation of Dissolved Oxygen on the Growth of Tomato Plants and Nutrient Uptake in Hydroponic Culture. Shokubutsu Kojo Gakkaishi 2001, 13, 21–28. [Google Scholar] [CrossRef] [Green Version]
- Pacumbaba, R.O.; Beyl, C.A. Changes in Hyperspectral Reflectance Signatures of Lettuce Leaves in Response to Macronutrient Deficiencies. Adv. Space Res. 2011, 48, 32–42. [Google Scholar] [CrossRef]
- Marschner, H.; Kirkby, E.A.; Cakmak, I. Effect of Mineral Nutritional Status on Shoot-Root Partitioning of Photoassimilates and Cycling of Mineral Nutrients. J. Exp. Bot. 1996, 47, 1255–1263. [Google Scholar] [CrossRef]
- Möller, K.; Müller, T. Effects of Anaerobic Digestion on Digestate Nutrient Availability and Crop Growth: A Review. Eng. Life Sci. 2012, 12, 242–257. [Google Scholar] [CrossRef]
- Wallace, A.; Patel, P.M.; Berry, W.L.; Lunt, O.R. Reclaimed Sewage Water: A Hydroponic Growth Medium for Plants. Resour. Recover. Conserv. 1978, 3, 191–199. [Google Scholar] [CrossRef]
- Morrissey, J.; Guerinot, M.L. Iron Uptake and Transport in Plants: The Good, the Bad, and the Ionome. Chem. Rev. 2009, 109, 4553–4567. [Google Scholar] [CrossRef] [PubMed] [Green Version]
- Gharbi, F.; Rejeb, S.; Ghorbal, M.H.; Morel, J.L. Plant Response to Copper Toxicity as Affected by Plant Species and Soil Type. J. Plant Nutr. 2005, 28, 379–392. [Google Scholar] [CrossRef]
- Liu, R.; Zhang, H.; Lal, R. Effects of Stabilized Nanoparticles of Copper, Zinc, Manganese, and Iron Oxides in Low Concentrations on Lettuce (Lactuca sativa) Seed Germination: Nanotoxicants or Nanonutrients? Water Air Soil Pollut. 2016, 227, 42. [Google Scholar] [CrossRef]
- Thompson, H.C.; Langhans, R.W.; Both, A.-J.; Albright, L.D. Shoot and Root Temperature Effects on Lettuce Growth in a Floating Hydroponic System. J. Am. Soc. Hortic. Sci. 1998, 123, 361–364. [Google Scholar] [CrossRef] [Green Version]
- Gonzalez-Fuentes, J.A.; Shackel, K.; Heinrich Lieth, J.; Albornoz, F.; Benavides-Mendoza, A.; Evans, R.Y. Diurnal Root Zone Temperature Variations Affect Strawberry Water Relations, Growth, and Fruit Quality. Sci. Hortic. 2016, 203, 169–177. [Google Scholar] [CrossRef]
- Tibbitts, T.W.; Bottenberg, G. Growth of Lettuce under Controlled Humidity Levels. J. Am. Soc. Hortic. Sci. 1976, 101, 70–73. [Google Scholar] [CrossRef]
- Weiguo, F.; Pingping, L.; Yanyou, W.; Jianjian, T. Effects of Different Light Intensities on Anti-Oxidative Enzyme Activity, Quality and Biomass in Lettuce. Hortic. Sci. 2012, 39, 129–134. [Google Scholar] [CrossRef] [Green Version]
- He, J.; Lee, S.K.; Dodd, I.C. Limitations to Photosynthesis of Lettuce Grown under Tropical Conditions: Alleviation by Root-zone Cooling. J. Exp. Bot. 2001, 52, 1323–1330. [Google Scholar] [CrossRef]
- Zhou, J.; Li, P.; Wang, J.; Fu, W. Growth, Photosynthesis, and Nutrient Uptake at Different Light Intensities and Temperatures in Lettuce. HortScience 2019, 54, 1925–1933. [Google Scholar] [CrossRef] [Green Version]
- Yoshida, S.; Kitano, M.; Eguchi, H. Growth of Lettuce Plants (Lactuca sativa L.) under Control of Dissolved O2 Concentration in Hydroponics. BioTronics 1997, 26, 39–45. [Google Scholar]
- Lee, J.W.; Lee, B.S.; Kang, J.G.; Bae, J.H.; Ku, Y.G.; Gorinstein, S.; Lee, J.H. Effect of Root Zone Aeration on the Growth and Bioactivity of Cucumber Plants Cultured in Perlite Substrate. Biologia 2014, 69, 610–617. [Google Scholar] [CrossRef]
- Gardoni, D.; Vailati, A.; Canziani, R. Decay of Ozone in Water: A Review. Ozone Sci. Eng. 2012, 34, 233–242. [Google Scholar] [CrossRef]
- Mori, N.; Watanabe, H. Effects of Oxidative Stress on the Growth of Leaf Lettuce upon H2O2 Treatment. Eco-Eng. 2017, 29, 31–38. [Google Scholar] [CrossRef]
- Graham, T.; Zhang, P.; Woyzbun, E.; Dixon, M. Response of Hydroponic Tomato to Daily Applications of Aqueous Ozone via Drip Irrigation. Sci. Hortic. 2011, 129, 464–471. [Google Scholar] [CrossRef]
- Machuca, A.; Odio, A.; Tapia, M.L.; Silveira, A.C.; Escalona, V. Ozone Applied to the Nutrient Solution and Its Impact on Red Chard Baby Leaves Yield. In Proceedings of the VIII International Postharvest Symposium: Enhancing Supply Chain and Consumer Benefits-Ethical and Technological Issues 1194, Cartagena Murcia, Spain, 21–24 June 2016; pp. 173–180. [Google Scholar]
- Najarian, M.; Mohammadi-Ghehsareh, A.; Fallahzade, J. Interactive Effects of Drought Stress and Ozonated Water on Growth and Yield of Cucumber (Cucumis sativus L.). J. Environ. Sci. Technol. 2015, 8, 330. [Google Scholar] [CrossRef] [Green Version]
- Ohashi-Kaneko, K.; Yoshii, M.; Isobe, T.; Park, J.-S.; Kurata, K.; Fujiwara, K. Nutrient Solution Prepared with Ozonated Water Does Not Damage Early Growth of Hydroponically Grown Tomatoes. Ozone Sci. Eng. 2009, 31, 21–27. [Google Scholar] [CrossRef]
Figure 1.
In-greenhouse climate data. (a) Range and 5 min average of greenhouse ambient temperature measurements, upper and lower bounds of optimal daytime temperature range and upper and lower boundaries for night-time temperatures [15]; (b) approximate photosynthetic photon flux density from lux measurements in comparison with the upper and lower bounds of optimal flux intensity for greenhouse lettuce production as elaborated by [16].

Figure 2.
(a) Macronutrient concentrations and (b) micronutrient concentrations for different irrigation water qualities and nutrient contents in the biomass of hydroponically grown lettuce. Initial nutrient concentrations of Hoagland solution (HS) are shown by a red circle and the average during the experiment by an olive bar (n = 12). The nutrient concentrations in conventional aerobic-treated wastewater (EC), ozonised CE (CEO), anaerobically pre-treated and nitrified wastewater (AN) and biological activated carbon-filtered AN water (ANC) and the nutrient contents in the shoot dry matter at the front (n = 6) of the hydroponic line are represented by a red bar and those at the end (n = 6) by an olive bar. Error bars indicate one standard deviation and stars indicate significant differences between the line sections (p < 0.05). In the right column, each circle (n = 1, mixed sample of three plants) stands for the root nutrient content in the front and end sections.

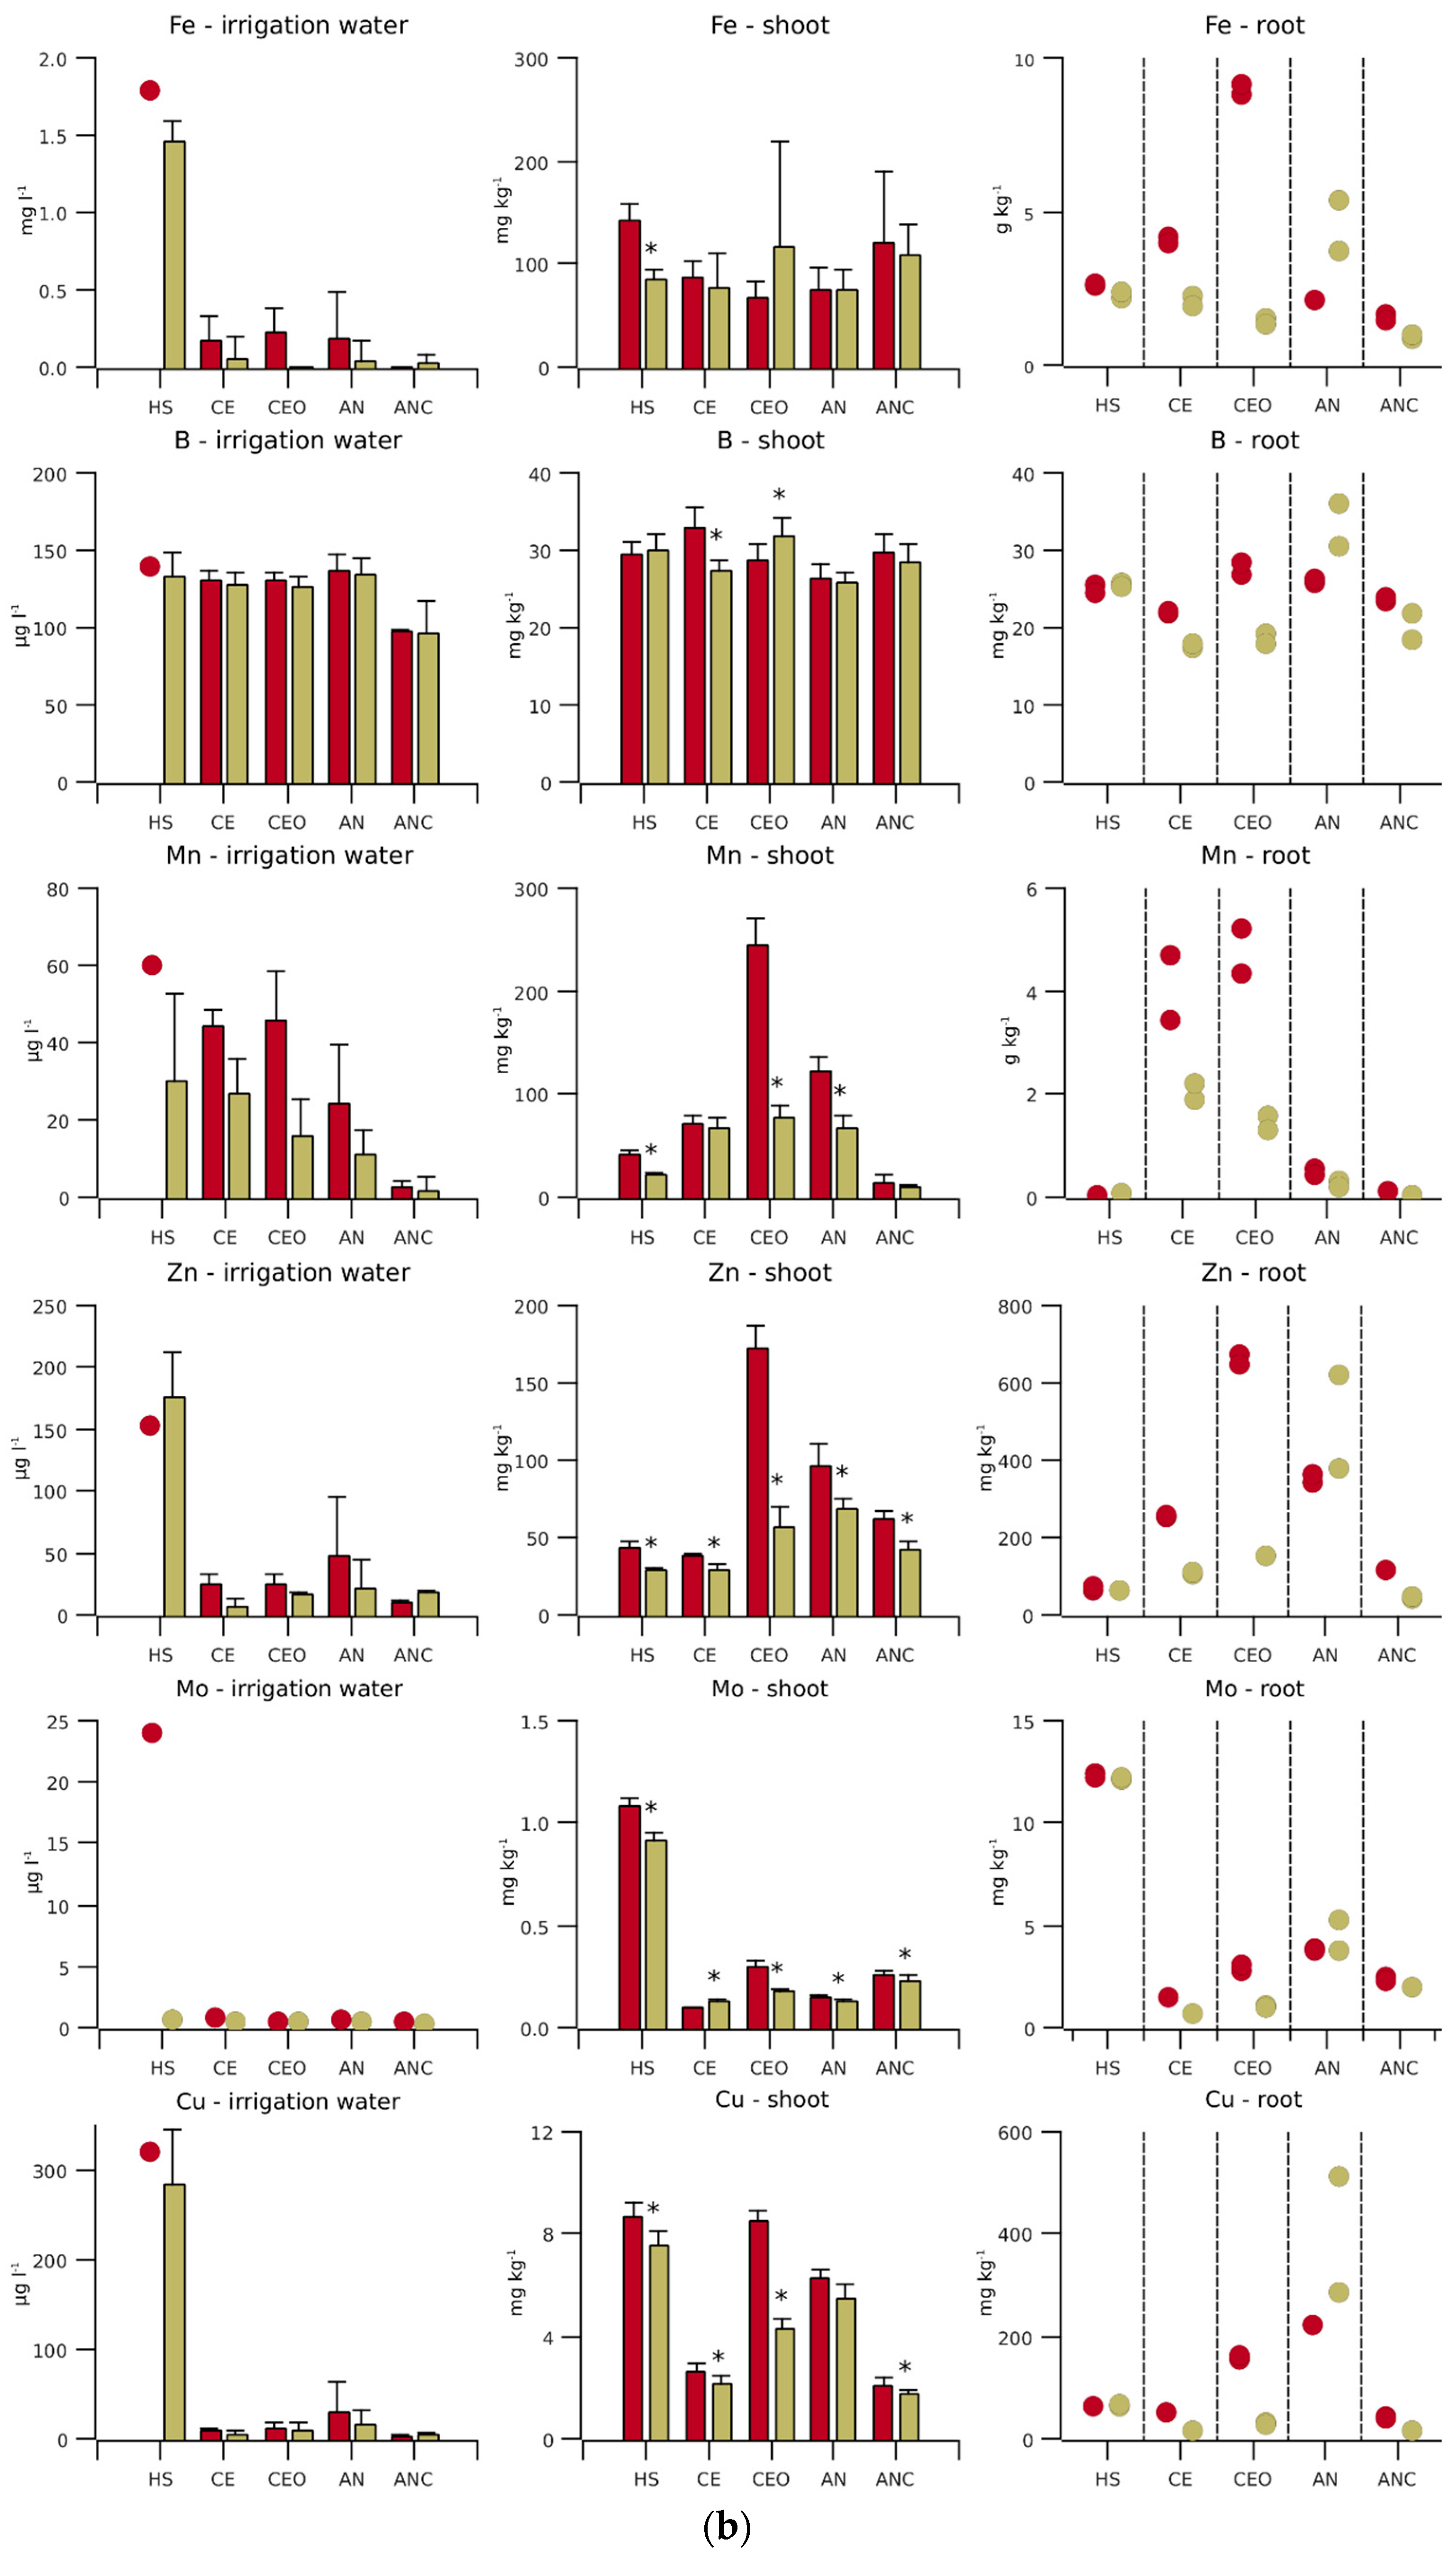
Figure 3.
Nitrate-N depletion of conventional aerobic-treated wastewater (CE) and ozonised CE (CEO) by growing lettuce in a hydroponic system. One outlier at 3.81 mg L−1 for CEO inflow is not shown. The dashed olive line represents the linear regression of the CE outflow (r2 = 0.77) and the dashed red line represents the CEO outflow (r2 = 0.70), respectively.

Figure 4.
Shoot and root (a) fresh and (b) dry matter and (c) dry matter contents of hydroponic lettuce irrigated with nutrient solution (HS) and conventional aerobic-treated wastewater (EC), ozonised CE (CEO), anaerobically pre-treated and nitrified wastewater (AN) and biological activated carbon-filtered AN water (ANC) (n = 7). Bars not stacked, root values in the foreground. Error bars indicate one standard deviation. Average values significantly different (p < 0.05) from the pipe front section are marked with * and from the middle section with ♦. Capital A indicates where there is no significant difference with the shoot data of HS in the same pipe section, B for Hs, C for CEO and D for AN. Small letters indicate accordingly where no significant differences between the root data were detected.


Table 1.
Dissolved oxygen in conventional-aerobic treated wastewater (EC), ozonised CE (CEO), anaerobically pre-treated and nitrified wastewater (AN) and biological activated carbon-filtered AN water (ANC) passing through hydroponic lines planted with lettuce (n = 17, significance level between in- and outflow as a = p < 0.05, b = p < 0.01, c = p < 0.001, ns = not significant, # excludes three results above detection range).
| Dissolved Oxygen (mg L−1) | ||||
|---|---|---|---|---|
| 1st Experiment | 2nd Experiment | |||
| Inflow | Outflow | Inflow | Outflow | |
| CE | 6.2 | 5.4 a | 8.7 | 8.1 a |
| CEO | 16.1 | 12.6 c | 19.5 | 11.0 c,# |
| AN | 6.8 | 5.5 b | 9.8 | 7.5 ns |
| ANC | 8.3 | 6.9 c | 9.9 | 9.1 b |
Table 2.
Literature values on the nutrient contents of lettuce, estimated optimal shoot nutrient contents (Target) and arithmetic deviation of the actual nutrient supply by conventional aerobic-treated wastewater (CE), ozonised CE (CEO), anaerobically pre-treated and nitrified wastewater (AN) and biological activated carbon-filtered AN water (ANC) from the theoretical daily demand.
| Dry Matter | N | P | K | Ca | Mg | S | B | Fe | Mn | Zn | Cu |
|---|---|---|---|---|---|---|---|---|---|---|---|
| Nutrient Content | mg kg−1 | ||||||||||
| 1 Min | 45,000 | 7855 | 49,805 | 10,721 | 3619 | 2000 | 24 | 100 | 20 | 30 | 7 |
| 1 Max | 60,000 | 13,092 | 99,610 | 21,441 | 9048 | 4000 | 40 | 600 | 200 | 330 | 17 |
| 2 Min | 45,000 | 4500 | 42,000 | 12,000 | 3500 | 25 | 30 | 30 | 7 | ||
| 2 Max | 55,000 | 7000 | 60,000 | 21,000 | 6000 | 60 | 100 | 80 | 15 | ||
| 3 | 40,000 | 50,000 | 2800 | 220 | 50 | 55 | 8 | ||||
| 4 | 35,417 | 1733 | 67,933 | 12,400 | 3786 | 2133 | 81 | 120 | 48 | 2 | |
| 5 | 41,300 | 4530 | 48,600 | 9710 | 2730 | 2730 | 20 | 485 | 83 | 10 | 10 |
| 6 | 44,340 | 5203 | 79,820 | 18,020 | 4728 | 3300 | 95 | 22 | 49 | 10 | |
| Target | 45,000 | 6300 | 62,000 | 15,000 | 3500 | 2700 | 35 | 120 | 80 | 80 | 10 |
| Nutrient supply with 565 l treated wastewater in % of the demand for the production of 680 g biomass | |||||||||||
| CE | −55 | 762 | 420 | 6926 | 4235 | 16,577 | 5314 | 1941 | 816 | 600 | 1119 |
| CEO | −45 | 756 | 420 | 6945 | 4227 | 16,593 | 5314 | 2621 | 870 | 643 | 1407 |
| AN | 1468 | 2087 | 466 | 6926 | 4480 | 13,087 | 5314 | 2117 | 400 | 1308 | 4334 |
| ANC | 1456 | 1919 | 447 | 6473 | 4461 | 13,413 | 3940 | −100 | −50 | 169 | 126 |
1: min and max: optimal range according to Bergmann [18]; 2: min and max: range for lettuce grown under glass according to Eysinga and Smilde [19]; 3: average of 28 conventional, presumably soil-grown, samples from different produces [20]; 4: average of outer and inner leaves of one vermiculite–sand–peat substrate-grown crops in three different sites [21]; 5: average of 4 soil-grown crops under conventional fertilisation and irrigation with treated wastewater [22]; 6: average of 5 soil grown crops under clear and light-diffusing plastic film greenhouses [23]; ‘Target’ is an estimated optimal content under consideration of references [18,19,20,21,22,23], the value for Fe was set to less than half of the reference average, as the Fe content measured in the same lettuce variety by Msilini et al. [24] was much lower (<100 mg kg−1) and the Mg value was set, accordingly, 1000 mg lower [25]; the calculation of the deviation between the nutrient supply and demand was based on the ‘Target’ nutrient contents, the nutrient concentrations in the front sections (Figure 2), a daily biomass accumulation of 10 g per plant, 68 plants and a dry matter content of 5.7% (compare Figure 4).
Disclaimer/Publisher’s Note: The statements, opinions and data contained in all publications are solely those of the individual author(s) and contributor(s) and not of MDPI and/or the editor(s). MDPI and/or the editor(s) disclaim responsibility for any injury to people or property resulting from any ideas, methods, instructions or products referred to in the content. |
© 2023 by the authors. Licensee MDPI, Basel, Switzerland. This article is an open access article distributed under the terms and conditions of the Creative Commons Attribution (CC BY) license (https://creativecommons.org/licenses/by/4.0/).
Share and Cite
MDPI and ACS Style
Germer, J.; Brandt, C.; Rasche, F.; Dockhorn, T.; Bliedung, A. Growth of Lettuce in Hydroponics Fed with Aerobic- and Anaerobic–Aerobic-Treated Domestic Wastewater. Agriculture 2023, 13, 1529. https://doi.org/10.3390/agriculture13081529
AMA Style
Germer J, Brandt C, Rasche F, Dockhorn T, Bliedung A. Growth of Lettuce in Hydroponics Fed with Aerobic- and Anaerobic–Aerobic-Treated Domestic Wastewater. Agriculture. 2023; 13(8):1529. https://doi.org/10.3390/agriculture13081529
Chicago/Turabian StyleGermer, Jörn, Christian Brandt, Frank Rasche, Thomas Dockhorn, and Alexa Bliedung. 2023. "Growth of Lettuce in Hydroponics Fed with Aerobic- and Anaerobic–Aerobic-Treated Domestic Wastewater" Agriculture 13, no. 8: 1529. https://doi.org/10.3390/agriculture13081529
Note that from the first issue of 2016, this journal uses article numbers instead of page numbers. See further details here.