Article

Evaluation of Biochar Addition to Digestate, Slurry, and Manure for Mitigating Carbon Emissions

1
Department of Agriculture, Food, Environment and Forestry (DAGRI), University of Florence, Piazzale delle Cascine, 18, 50144 Florence, Italy
2
Institute of BioEconomy (IBE), National Research Council (CNR), Via Madonna del Piano 10, Sesto Fiorentino, 50019 Florence, Italy
*
Author to whom correspondence should be addressed.
Agriculture 2024, 14(1), 162; https://doi.org/10.3390/agriculture14010162
Submission received: 6 December 2023 / Revised: 17 January 2024 / Accepted: 19 January 2024 / Published: 22 January 2024

Abstract

:
The contribution of animal waste storage on GHG emissions and climate change is a serious issue for agriculture. The carbon emissions that are generated from barns represent a relevant source of emissions that negatively affect the environmental performance measures of livestock production. In this experiment, CO2 and CH4 emissions from different animal wastes, namely, digestate, slurry, and manure, were evaluated both in their original form and with a biochar addition. The emissions were monitored using the static camber methodology and a portable gas analyzer for a 21-day period. The addition of biochar (at a ratio of 2:1 between the substrates and biochar) significantly reduced the emissions of both gases compared to the untreated substrates. Slurry exhibited higher emissions due to its elevated gas emission tendency. The biochar addition reduced CO2 and CH4 emissions by 26% and 21%, respectively, from the slurry. The main effect of the biochar addition was on the digestate, where the emissions decreased by 45% for CO2 and 78% for CH4. Despite a lower tendency to emit carbon-based gases of manure, biochar addition still caused relevant decreases in CO2 (40%) and CH4 (81%) emissions. Biochar reduced the environmental impacts of all treatments, with a GWP reduction of 55% for the digestate, 22% for the slurry, and 44% for the manure.

1. Introduction

Recent studies have shown that barns are some of the main sources of methane (CH4) production, accounting for approximately 75% of global emissions from agriculture [1]. Furthermore, the contribution of the rates of CH4 and nitrous oxide (N2O) produced by animal manure to the total global emissions are, respectively, 5–10% and 7%, which should not be ignored [2,3]. Livestock production systems therefore generate sewage and manure. Storage is necessary to allow distribution in fields at the right time to provide nutrients to crops. Storage facilities have been identified as important sources of greenhouse gas (GHG) emissions, including N2O, CH4, and carbon dioxide (CO2) from the manufacture of livestock. Therefore, improving carbon storage in agricultural land and reducing CH4 and N2O emissions from agricultural land are important as climate change mitigation measures in agriculture. Atmospheric CH4 is a very important and long-lived GHG that contributes to global warming [4], with a relative global warming potential (GWP) of 27 [1]. In addition to this, livestock contributes approximately 40% of the total global value of agricultural products, ensuring livelihoods and food security for nearly 1.3 billion people worldwide [5]. This has led to a greater proportion of livestock waste needing to be recycled and used sustainably. Many factors influence manure emissions, including management, the composition of the manure, the quality of the animals’ diets, different storage and handling techniques, and the climate in which the manure is stored. One such researched and supported method of agricultural waste utilization is biogas production and digestate fertilization practices. Digestates are the products obtained from the anaerobic digestion of waste, including animal waste. Thus, waste that is treated or recycled produces digestates which increase every year, and hence, there is a need to identify sustainable methods for the use of digestates. Improvements in crop yields have encouraged the use of recycled organic waste such as sewage, manure, and digestates as alternatives to chemical fertilizers [6], but it is necessary to identify techniques and methodologies for reducing GHG emissions from the soils that are derived from them. Biochar is a porous, carbon-rich residue generated from the pyrolysis of a biomass and has attracted much attention due to its proven benefits in environmental and agricultural management. Biochar applications are rapidly emerging as they have the potential to reduce both nitrate (NO3) leaching and N2O emissions, as well as to enhance C- sequestration [7,8]. The use of biochar at very high doses is impractical in large-scale extensive agriculture practices due to its limited availability, dusty nature, and associated high costs [9]. Alternatives to improve the effectiveness of biochar include low-demand application approaches, such as the use of biochar as a filler agent for manure composting, a compound within manure mixes, and an additive to animal diets [10,11,12]. However, the precise effects of biochar application on soil GHG emissions remain controversial and have appeared to be highly variable in many case studies [13,14]. In the literature, there is a lack of studies addressing the effect of biochar on the mitigation of emissions from animal by-products during the storage phase in barns. Indeed, particular attention is given to different types of pretreatments (e.g., acidification, solid-liquid separation, etc.) or both synthetic and biological coverings [15]. Currently, there is a lack of assessments of the actual mitigation potential of biochar during storage by blending it with slurries, manure, digestates, etc. The only available studies have evaluated the use of biochar as a covering material to create a physical barrier for emissions without considering an actual blending that would result in a new homogeneous substrate consisting of animal by-products and biochar. On the other hand, there is extensive literature on emissions dynamics from soil following the application of biochar as an amendment product. Soil GHG fluxes from the use of biochar in agriculture have increased significantly, as shown in some studies [8,16,17,18,19], but they have substantially decreased or remained unchanged according to others [20,21,22,23,24]. A meta-analysis study (105 studies with 303 paired comparisons) by the authors of [25] showed that, on average, the application of biochar could reduce NH3, N2O, and CH4 emissions by 37.8%, 59.8%, and 67.5%, respectively, during composting, mainly due to the adsorption effect, increases in manure porosity, improvements in aeration, and adjustments to manure pH [26,27,28]. Biochar is a very heterogeneous material, and its effectiveness in reducing N2O and CH4 emissions depends on the application amount, the feedstock used for production (which influences its porosity), and the pyrolysis conditions during production [10]. To understand biochar’s effectiveness on GHG emissions, it is necessary to investigate its emissions in a lab-scale incubation experiment.
In this study, we evaluated the effect of one type of biochar addition on three organic fertilizers (manure, slurry, and digestate) from two different management types (conventional vs. organic) and two origins (pig and cow) in a pot incubation experiment. We evaluated the biochar’s impact on the emissions of CO2 and CH4 from the animal excreta, considering the cumulative emissions over three weeks.

2. Materials and Methods

The experiment was conducted in the experimental field at the National Research Council (CNR) within the Florence University scientific area (43.818086° N, 11.201975° E). The experiment was set up using pots with volumes of 10 L, replicating the storage conditions on farms. The matrices (i.e., digestate, manure, and slurry) were collected from three different farms as follows: digestate from a conventional pig breeding farm, slurries from an organic pig breeding farm, and manure from an organic cow breeding farm. The digestate was obtained from the anaerobic fermentation of a mixture of pig slurry and agricultural by-product, including straw, olive cake, and silage sorghum. The digestion temperature was 35 °C, with a hydraulic residence time of approximately 30 days. The digestate was collected from the storage cistern at the end of the anaerobic digestion process, which lasted approximately 4 weeks. The slurry and the manure were collected directly from the storage systems in the farms within 1 day of their production. The matrices were placed inside the containers, and each matrix was supplemented with a portion of biochar for a total of 6 treatments (Table 1). The biochar was obtained from an orchard (i.e., an olive tree, vines, and apricot and apple trees) pruning biomass through a slow pyrolysis process at a temperature of 500 °C in a transportable ring kiln with a 2.2 m diameter, as provided by Romagna Carbone s.r.l., Bagnacavallo, Ravenna, Italy. The biochar at the end of the pyrolysis was crushed into particles smaller than 5 cm in diameter. Each treatment had three replicates. The ratio between the matrices and biochar was 2:1 in order to maintain a suitable headspace inside the chambers and prevent gas saturation conditions. The experiment was set up under an open shelter to protect the pots from rain while allowing for air circulation.
In order to obtain data that were comparable with the available literature, the moisture levels, volumes, and densities of the treatments were determined. The density of the biochar was 300 kg m−3. Using this information, it was possible to upscale the results from the pots to 1 m−3 of matrix mass. Moreover, the initial total carbon (C) contents of each matrix, biochar, and all mixes were characterized in laboratory (Table 2).
The CO2 and CH4 fluxes were monitored using a portable gas analyzer (XCGM-400, Madur Polska Sp. z o.o., Zgierz, Poland) and polyvinyl chloride (PVC) closed chambers [29]. The closed opaque chambers were 30 cm in diameter and had a chamber volume of 10 L. Before sampling, each chamber was covered with a lid with reflective insulation and equipped with an outlet tube with a gas sampling valve and an internal fan to mix the headspace air. To secure the chamber lid to the pot, a 7 cm long piece of tire tube was employed. The strip was wrapped around the lid and fixed in place using a silicone adhesive. The excess portion of the strip, approximately 5 cm, was folded back over the chamber lid and then folded down to establish a connection between the lid and the pot during the sampling process. Simultaneously with each GHG flux measurement, the air temperatures inside the pots were measured using a type J thermocouple. An electrically powered fan was installed inside the chamber to ensure homogenization of the gas sample within the chamber. Figure 1 shows the static chamber model that was used for the experiment.
The gas analyzer (XCGM 400 Madur Sensonic) used nondispersive infrared (NDIR) sensors for the analysis of both the CO2 and CH4 concentrations (ppm) in the samples. The measurement sensitivity was ±1 ppm for both CO2 and CH4. Measurements were carried out by inserting the sensor into the chambers for 1 min immediately after closing the chamber (T0) and by repeating this after 60 min of gas accumulation into the chamber (T1). The difference between the two measurements was the gas concentration used for the gas flux calculations. The gas flux calculations were carried out using the gas concentration, chamber area and volume, closing time, molecular weight of each gas, and temperature, using the following formula:
[ ( C × V × t / M W g M V a × M M g ) / t   ×   A ]   ×   0.00764 ,
where C corresponds to the gas concentration inside the chamber obtained by subtracting the concentration measured at T1 from that measured at T0, V and A are the chamber volume and area, respectively, t is the closing time, MWg is the molar weight of the gas, MWa is the molar volume of the air at the standard atmospheric pressure, MMg is the molar mass of the considered gas, and 0.00764 is a mathematical coefficient used to convert µg-C h−1 m−2 to kg-C day−1 ha−1. As we knew the volumes of the substrates and the chambers, the emissions results were standardized to the same unit of measurement, namely, cubic meters of substrate.
The measurements of the CO2 and CH4 emissions lasted for three weeks, when the emissions became negligible. During the first week, samplings were carried out for four days after setting up the experiment, and starting from the second week, two measurements per week were conducted. The sampling events were indicated as D1, D2, etc., up to D8, in sequential order from the beginning to the end of measurements. Since the temperatures exhibited consistent patterns within each chamber, the entire experiment was considered to be under standard temperature and pressure conditions, with the molar volume of the air assumed to be 22.4 L. The collected data were upscaled from ppm per pot, as obtained by the gas analyzer, to kg per m−3 of matrix. An automatic weather station was located in the vicinity of the field trial for atmospheric temperature and pressure monitoring (Figure 2). To uniquely assess the impacts of using biochar to mitigate emissions from the different substrates, the GWP was calculated for each treatment, as detailed in Equation (1):
GWP = kg CO2 + (kg CH4 × 27).
The statistical analyses were completed using CoStat 6.400 software (Co Hort, Monterey, CA, USA; CoStat 2008). Analysis of Variance (ANOVA) was used for the analysis of the CO2 and CH4 emissions from the different treatments. To compare the means at a significance level of p ≤ 0.05, Tukey’s HSD test was utilized. The relationships between the emissions and treatments were explored using Pearson’s correlation coefficient (r).

3. Results and Discussion

The fluxes of CO2 and CH4 were assessed through an analysis of the cumulative emissions for a 21-day period (Table 3).

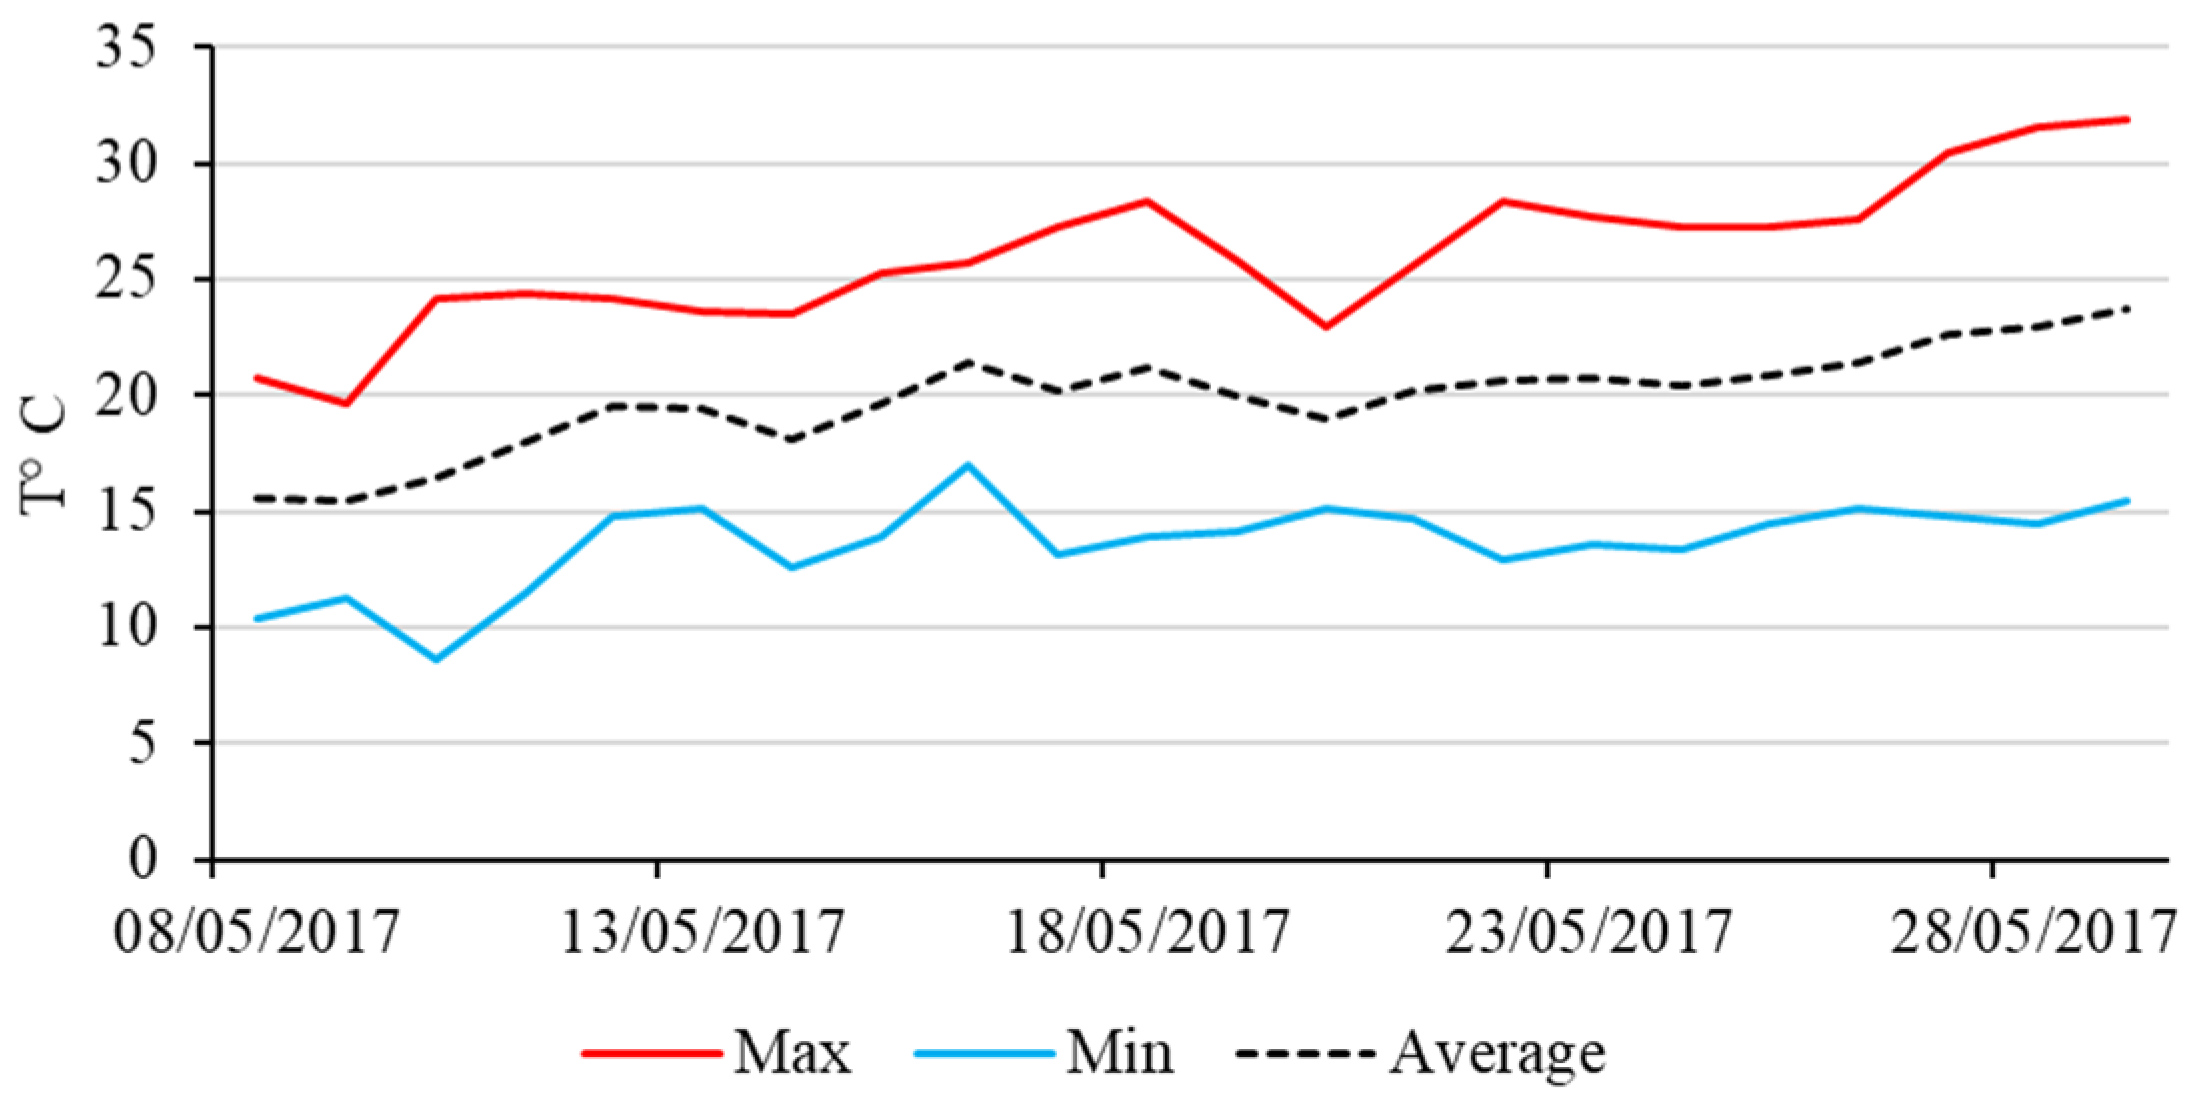
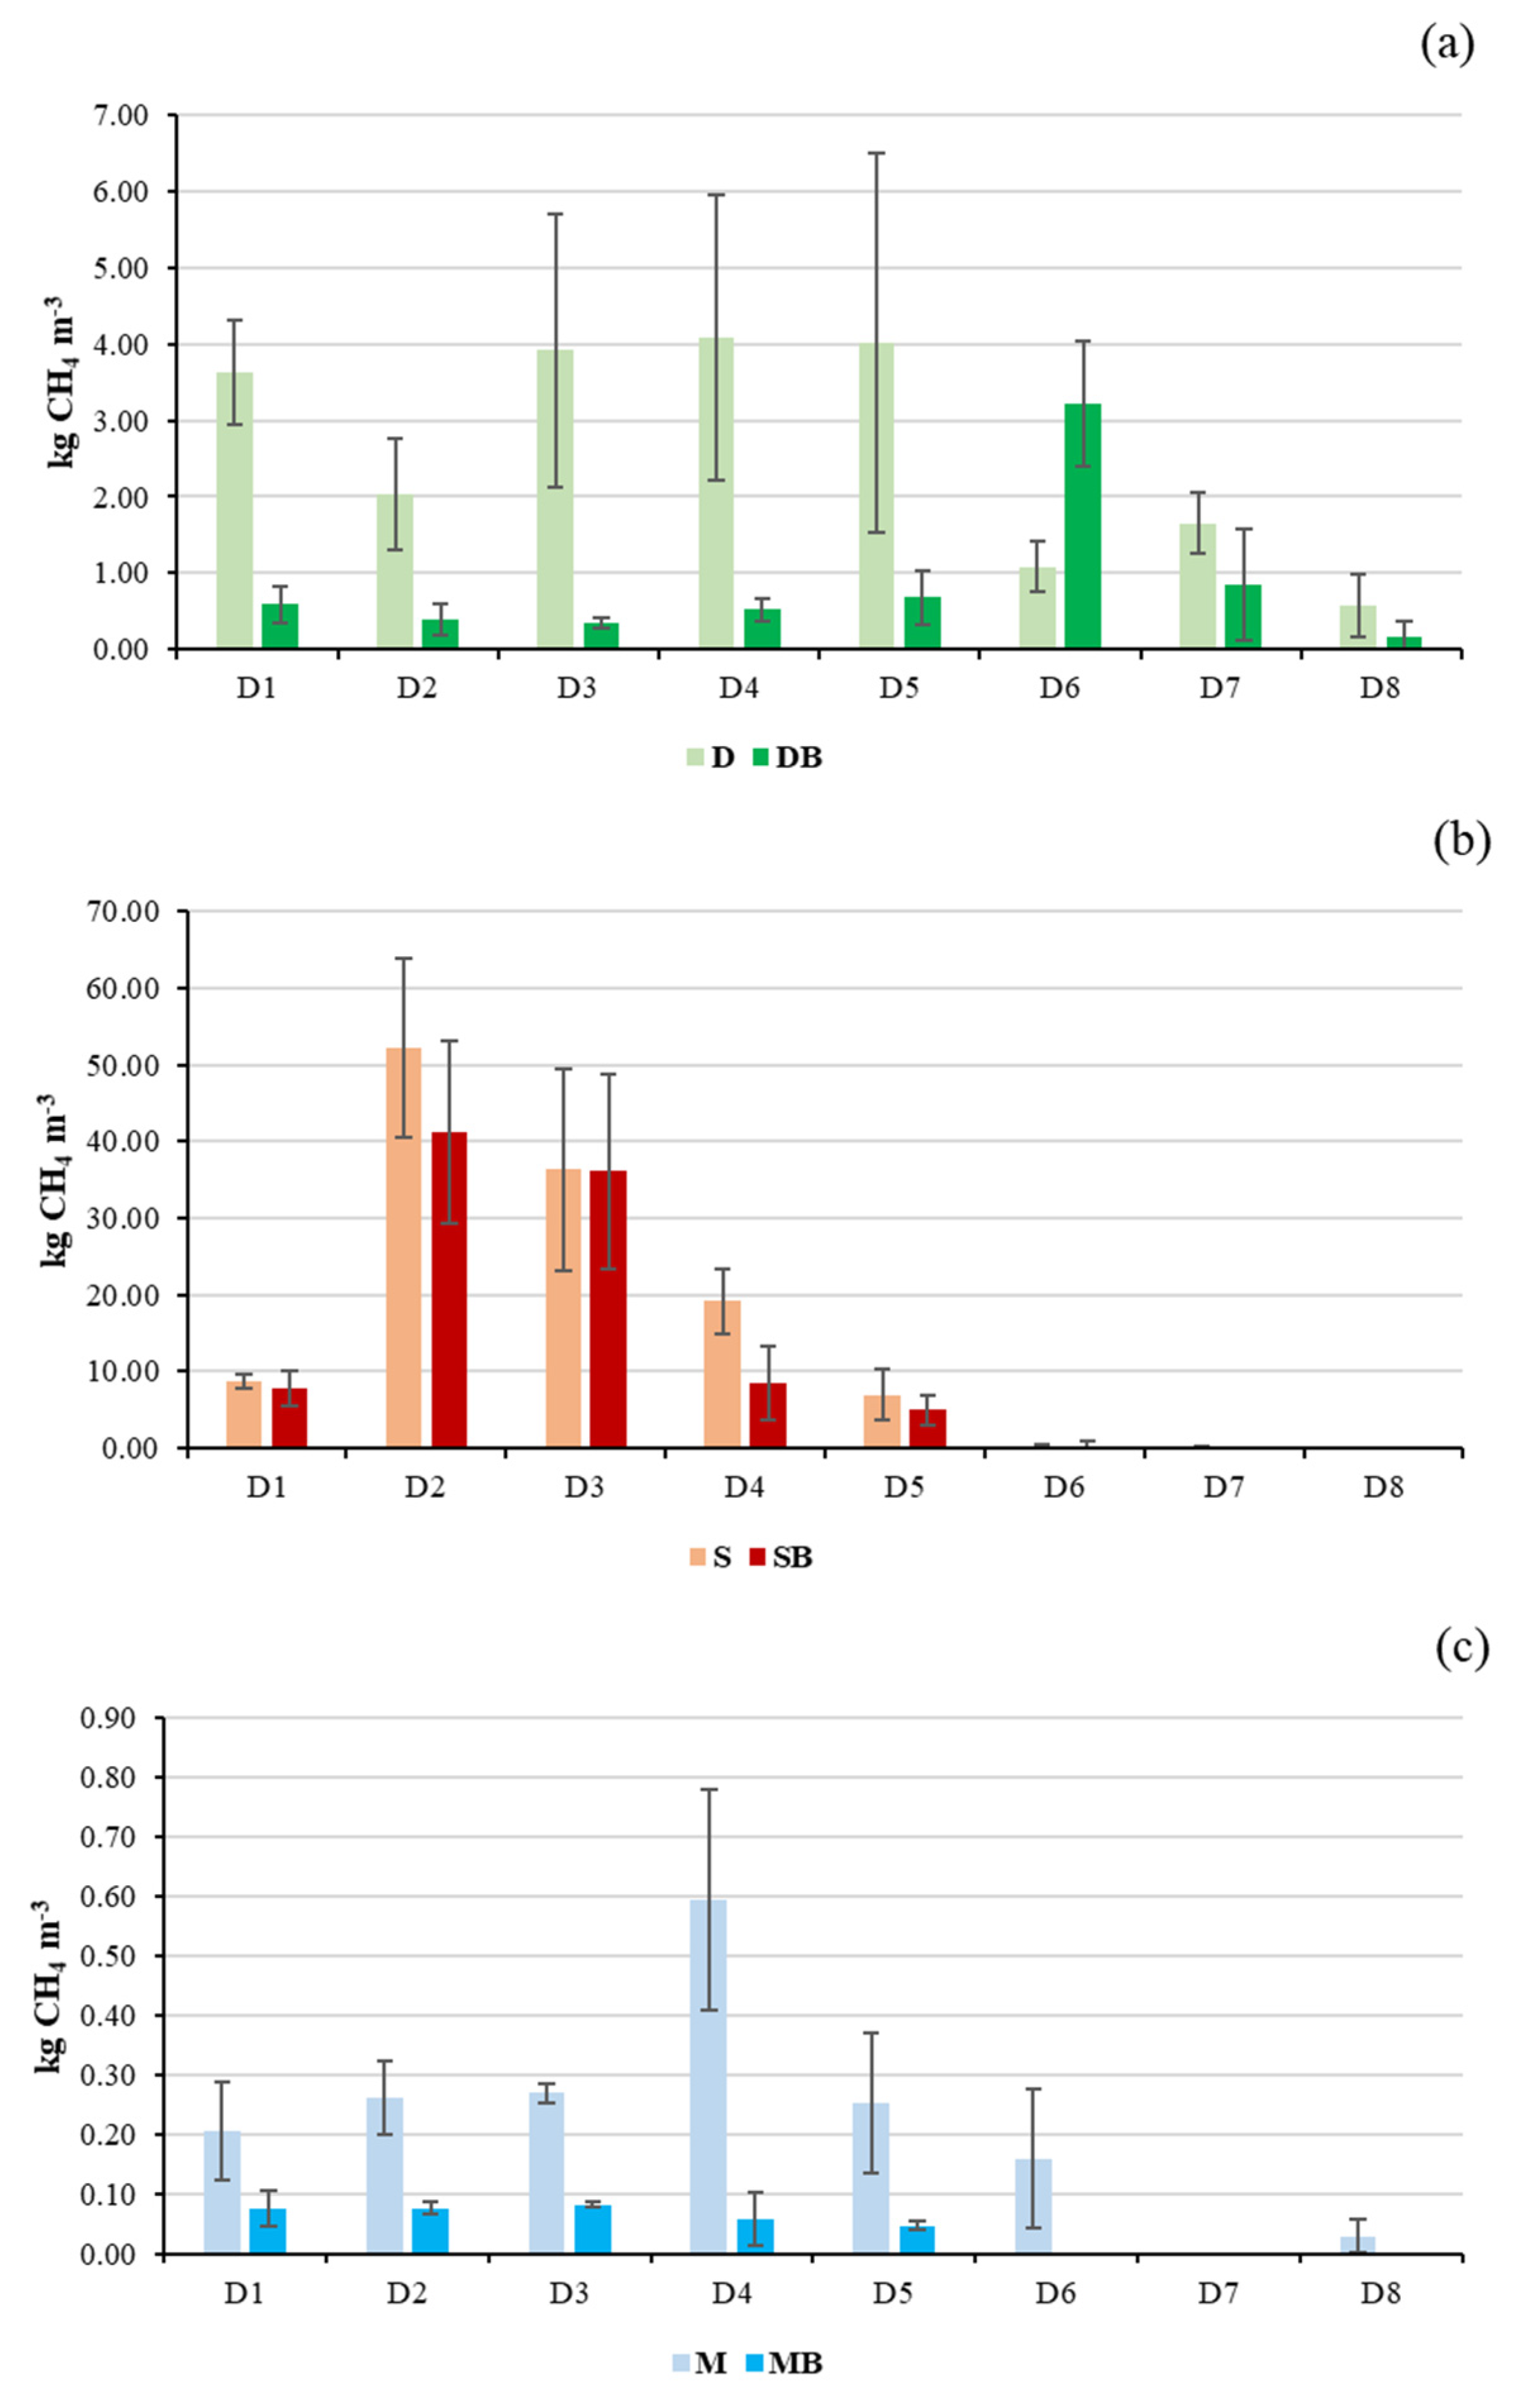
3.1. Emission Trends over Time

The daily emission flows of CO2 are reported in Figure 3. Overall, throughout all monitoring events, the CO2 emissions from D were higher than those from DB. Despite an increase in air temperature during the experiment (Figure 2), both treatments exhibited higher emissions at the beginning of the trial, and they decreased over time during the experimentation period. During the first two weeks of experimentation, D showed significantly higher emissions than DB, displaying a clear effect of the biochar on reducing the CO2 emissions from the digestate. As previously observed in [30], this was due to the reduced presence of readily available reactive material within the mixtures of the digestate and biochar. The authors of [30] suggested that even with the addition of 1% (w/w) biochar to a digestate mass, the observed effect was evident. This suggested that the biochar significantly altered the physicochemical properties of the system. Further experiments on dissolved organic C (DOC) sorption highlighted the substantial sorption capabilities of the DOC by the biochar, consequently diminishing the microbial access to the DOC in the liquid phase and, subsequently, reducing CO2 production and emissions. Different to D, the effect of the biochar on S was less evident during the emission monitoring events. In fact, during the initial measurements, the CO2 emissions were significantly higher for SB. This could have been due to the intrinsic characteristics of the biochar. A recent study [31] reported that several factors could affect CO2 emissions dynamics from the use of biochar with organic fertilizers/soil amendments. High initial CO2 emissions from biochar use can result in labile C remaining in incompletely pyrolyzed biochar, which is preferentially used by microorganisms over other organic C sources in substrates. From the second measurement onward, S showed higher emissions than SB, although the trend was not consistently decreasing, as was observed for D and DB. Overall, the effect of the biochar was evident even for S, which saw a reduction in CO2 emissions. The explanation may reside in the results of a study on Pyrogenic Carbon Capture and Storage [31], where the authors observed significantly higher soil CO2 emissions after adding slurry to open field conditions. Despite the field application of the biochar increasing the soil’s C contents, they were found in recalcitrant forms. Biochar enhances soil aggregation while decreasing microbial and enzymatic activities associated with C degradation, and thus, it reduces C volatilization losses. Regarding the manure, we observed significantly lower CO2 emission values compared to the other treatments. In fact, the maximum peak of emissions observed for the manure was approximately one-third that of the digestate and slurry. The effect of the biochar on reducing CO2 emissions was evident even for the manure, although the magnitude of emissions observed for this substrate was significantly lower than the other treatments. Indeed, from the second monitoring event onward, the CO2 emissions of both M and MB were limited and, at times, nearly negligible. This was in accordance with the observations of the authors of [32], where they observed a decreasing effect on CO2 emissions from a manure–biochar mixture after field application due to the fact that biochar has the capacity to reduce the availability of organic compounds, such as enzymes and substrates, through physical absorption. In this sense, the use of a mixture of manure and biochar in a field can significantly affect soil’s CO2 emission dynamics. Reference [32] discussed this aspect, considering the effect of biochar on root respiration processes. CO2 emissions from root respiration play a pivotal role in total soil respiration. The biochar introduction led to hampered root growth, which was attributed to nutrient and water adsorption onto the biochar’s surface, potentially restricting root respiration. The significant reduction in cumulative CO2 fluxes following the biochar application compared to only manure was, thus, in accordance with our observations.
In Figure 4, the CH4 emission trends for the tested substrates are reported. Similar to CO2, the effect of the biochar was apparent even for the digestate. During the first two weeks of experimentation, D produced higher emissions than BD, despite its higher variability. During the third week, DB showed peak CH4 emissions that were higher than D, although they were not statistically significant. From this moment onward, D was higher than DB. The methane emissions from the slurry were significantly higher than those from the digestate. In particular, between the first and the second week of measurements, CH4 emissions from the slurry were nearly ten times higher than those of the digestate. This was also true for the treatments that included the biochar. From the third week of experimentation, the CH4 emissions decreased, following a regular trend. Still, the effect of the biochar was apparent for reducing CH4 emissions, as S produced higher, or similar, emissions than SB. During the third week, the CH4 emissions from S and SB were strongly reduced and nearly negligible. Similar to CO2, the manure produced the lowest emissions out of all the treatments. Again, the effect of the biochar was apparent in reducing the emissions, with higher CH4 fluxes from M during all the monitoring events. Likewise, for the slurry, the biochar completely brought down the emissions during the third week when only CH4 emissions were detected from M. As previously reported, this could have been due to the effect of the biochar in modifying the physicochemical properties of the mass (the biochar plus the organic substrate). The main apparent evidence was the reduction in the fraction of available organic C for degradation processes carried out by bacteria, resulting in a decrease in CH4 emissions [30].

3.2. Cumulative CO2 and CH4 Emissions

The analysis of the cumulative emission flows confirmed the effect of the biochar in reducing both CO2 and CH4 emissions in all the tested substrates (Table 3). Due to its higher tendency to emit gases compared to the other substrates, S showed higher emission values. The high biodegradability of the substrates with high water and organic C contents (i.e., the slurry) and the limited tendency to form superficial crusts supported C-based emissions from S [33]. The addition of the biochar to S resulted in a decrease in CO2 emissions of 26% and a decrease of 21% for CH4. Despite the clear effect of the biochar on S, the greater effect was observed for D, where the CO2 and CH4 emissions were reduced by 45% and 78%, respectively. Even though the microbial populations in slurries might be less effective at generating CH4 compared to the microbes found in digestates, the increased quantity of decomposable organic C present in untreated slurry could offset this tendency. Consequently, it could be hypothesized that untreated slurries have greater potential for CH4 emissions than an anaerobically processed slurry. On the other hand, the lower emissions from the digestate were due to the effect of the anaerobic digestion process that reduced the CH4 emissions during the digestate’s storage after the anaerobic fermentation process [34]. In this, the effect of the biochar in reducing the availability of organic carbon sources for degradation processes carried out by bacterial populations played a key role in the CO2 and CH4 emissions dynamics [30,31,32]. A recent review [15] highlighted a 33% reduction potential in CH4 emissions from a digestate during the storage phase, confirming our observations. This effect of biochar on a digestate is likely primarily due to a significant portion of CH4 being removed during anaerobic digestion phases within the biogas plant, substantially reducing the available organic C for subsequent oxidation during storage [34]. In contrast, reference [15] reported a reduction in the potential mitigation of CH4 emissions following the addition of a biochar to a slurry. This was because the experimental conditions mentioned in the article involved the surface distribution of the biochar to serve as a slurry cover. In our experiment, the slurry and biochar were homogeneously mixed, which could have created an interaction between the two substrates, reducing the available organic C for microbial degradation and, consequently, CH4 generation. Both gases were emitted less from M compared to the other substrates. Similar to D, the biochar displayed a clear effect on M, with net decreases in emissions of 40% and 81% for CO2 and CH4, respectively. The tendency of M to form natural crusts hampered the production of high C-based emissions by creating a barrier to the gas molecules between the substrate and the air. In this sense, the separation of solids from liquids resulted in decreased emissions in the solid substrates of both the CO2 and CH4 [34]. Moreover, since CH4 production normally occur in anaerobic conditions, the low water content of M represented the least favorable conditions for the production of this gas [35]. This also explained the lower CH4 emission fluxes from the manure compared to the digestate and slurry in this experiment. From the analysis of differences between the initial C contents of substrates (Table 2) and the cumulative emission losses (CO2 plus CH4) shown in Table 3, the effect of the biochar on improving C stabilization while hampering volatilization processes was apparent. In particular, we observed that the addition of the biochar caused a reduction in C losses by 100 times for the digestate and approximately 5 times for the slurry and manure, respectively. These observations require further assessments of the biochar’s mitigation potential in combination with various types of animal by-products. In particular, the effect of a biochar in reducing emissions from such substrates could be achieved by modifying the paradigm of the biochar’s use. Instead of focusing on using a biochar as slurry/manure/digestate cover, further studies should concentrate on the homogeneous blending of a biochar and an animal by-product to create a new substrate. The evaluation should consider the appropriate biochar: substrate ratio to maximize positive outcomes while minimizing the environmental and economic impacts on farms. However, further investigations should include the application of such substrates (especially the mixes between the digestate, slurry, and manure with the biochar) in fields to understand the magnitude of C sequestration and availability for plants and soil microbial communities.

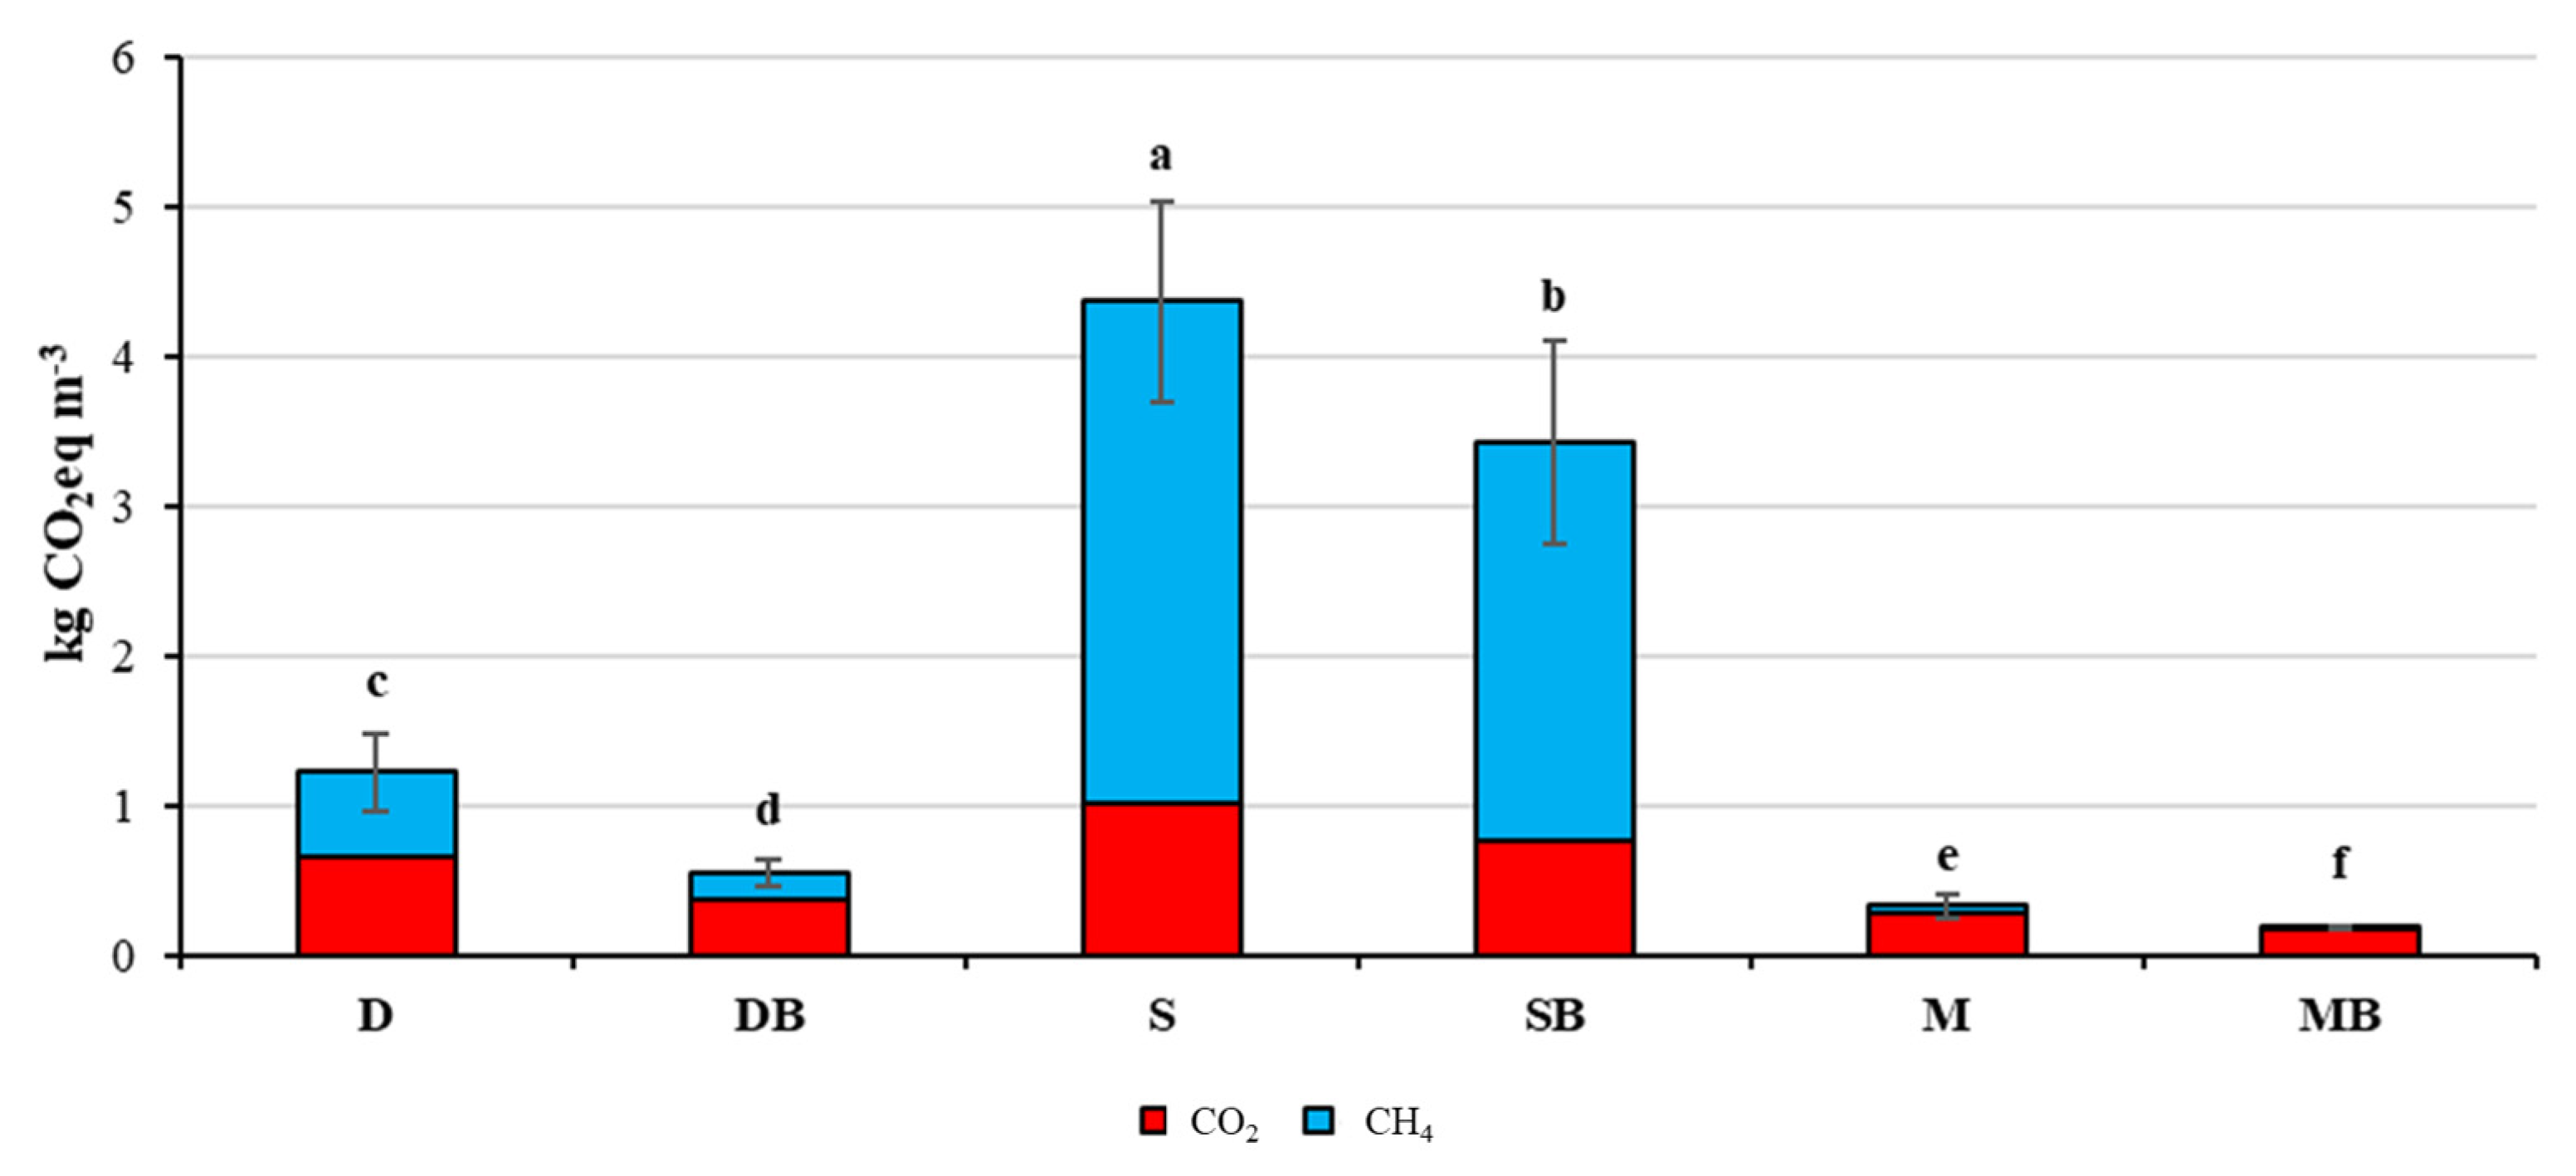
3.3. Global Warming Potential

Emissions data for CO2 and CH4 were used to calculate the GWP for each treatment. As for D, the gas contributions to the GWP were 54% for CO2 and 46% for CH4. Differently, in DB, the main contributor was CO2 (77% of the total), and it had a lower tendency to emit CH4 following the biochar application (Figure 5). The GWP impacts of D and DB were 1.2 and 0.54 kg CO2 eq m−3, respectively. As previously reported, this could be attributed to the low tendency of the digestate to emit CH4. In fact, most of the organic C in the substrate was collected as CH4 within the biogas plant, leaving the digestate with a low content of degradable organic C during storage. Moreover, the high biodegradability of such substrates characterized by abundant water and organic C content, along with their tendency to resist the formation of surface crusts, contributed to the emissions of carbon from S [33,34]. The effect on reducing emissions, and thus reducing the GWP, from the organic substrates was also confirmed for S. Figure 5 shows that SB had a lower GWP impact than S concerning both CO2 and CH4 emissions. In particular, the CO2 emissions were 34% and 32% for S and SB, respectively. Methane made the largest contribution to GWP, accounting for 76% in the case of S and 78% in the case of SB. The net GWP for these two substrates were 4.36 (S) and 3.42 (SB) kg CO2 eq m−3. The GWPs for M and MB were significantly lower than those of the other substrates, accordingly to the CO2 and CH4 flux observations (Figure 3 and Figure 4). In particular, the GWP impacts were 0.32 and 0.18 kg CO2 eq m−3 for M and MB, respectively. The main contribution was due to CO2 representing 85% of the GWP for M and 95% for MB. A specific consideration must be made regarding the contribution of CO2 to the GWP and, thus, to climate change. Despite CO2 being a greenhouse gas, it is sequestered within a biomass, and through biogeochemical cycles, it is also found in agricultural byproducts, such as digestate, slurry, and manure. In this regard, further studies focused on evaluating the net balance of CO2, considering both emissions and storage, are of particular interest. Information of this kind can provide relevant data for defining low-impact development and agricultural management strategies in support of a sustainable food production system.

4. Conclusions

Adding biochar agricultural by-products from animal sources represents an interesting solution for stabilizing their organic C contents and reducing C-based emissions. The best results can be achieved by adding biochar to substrates with high water contents and easily biodegradable compounds (i.e., slurry and digestate), which are naturally more prone to phenomena such as volatilization losses. On one hand, this has an interesting effect in terms of increasing the soil’s C content following the field application of such mixtures of biochar with digestate, slurry, and manure. On the other hand, it represents a valid strategy for reducing GHG emissions in the agricultural sector and mitigating climate change. In fact, the opportunity to decrease the GWP of managing these by-products, either in barns or within storage tanks, can contribute to reducing the carbon footprints of agricultural activities, particularly, livestock farming. This opportunity plays a more significant role in the case of a digestate, contributing to maintaining low impacts related to the production process of a renewable energy source such as a biogas. However, the present study pertains to the storage phase of some agricultural by-products, and further research should focus on the dynamics triggered after applying such mixes in fields.

Author Contributions

Conceptualization, L.V. and F.P.V.; methodology, L.V., S.B. and A.M.; formal analysis, L.V. and A.M.; investigation, S.B.; resources, S.O.; data curation, L.V.; writing—original draft preparation, L.V., S.B., A.M. and F.P.V.; supervision, A.D.M.; project administration, S.O., F.P.V. and A.D.M. All authors have read and agreed to the published version of the manuscript.

Funding

This research received no external funding.

Institutional Review Board Statement

Not applicable.

Data Availability Statement

Data available on request.

Conflicts of Interest

The authors declare no conflicts of interest.

References

  1. IPCC. Climate Change 2022: Mitigation of Climate Change Contribution of Working Group III to the Sixth Assessment Report of the Intergovernmental Panel on Climate Change; Shukla, P.R., Skea, J., Slade, R., Al Khourdajie, A., van Diemen, R., McCollum, D., Pathak, M., Some, S., Vyas, P., Fradera, R., et al., Eds.; Cambridge University Press: Cambridge, UK; New York, NY, USA, 2022. [Google Scholar] [CrossRef]
  2. Ussiri, D.A.; Lal, R. Carbon Sequestration for Climate Change Mitigation and Adaptation; Springer: Cham, Switzerland, 2017; pp. 287–325. [Google Scholar]
  3. Awasthi, S.K.; Sarsaiya, S.; Awasthi, M.K.; Liu, T.; Zhao, J.; Kumar, S.; Zhang, Z. Changes in global trends in food waste composting: Research challenges and opportunities. Bioresour. Technol. 2020, 299, 122555. [Google Scholar] [CrossRef] [PubMed]
  4. Wang, G.; Liang, Y.; Zhang, Q.; Jha, S.K.; Gao, Y.; Shen, X.; Sun, J.; Duan, A. Mitigated CH4 and N2O emissions and improved irrigation water use efficiency in winter wheat field with surface drip irrigation in the North China Plain. Agric. Water Manag. 2016, 163, 403–407. [Google Scholar] [CrossRef]
  5. Różyło, K.; Bohacz, J. Microbial and enzyme analysis of soil after the agricultural utilization of biogas digestate and mineral mining waste. Int. J. Environ. Sci. 2020, 17, 1051–1062. [Google Scholar] [CrossRef]
  6. Alburquerque, J.A.; De la Fuente, C.; Campoy, M.; Carrasco, L.; Nájera, I.; Baixauli, C.; Caravaca, F.; Roldán, A.; Cegarra, J.; Bernal, M.P. Agricultural use of digestate for horticultural crop production and improvement of soil properties. Eur. J. Agron. 2012, 43, 119–128. [Google Scholar] [CrossRef]
  7. Schmidt, H.P.; Kammann, C.; Hagemann, N.; Leifeld, J.; Bucheli, T.D.; Sánchez Monedero, M.A.; Cayuela, M.L. Biochar in agriculture–A systematic review of 26 global meta-analyses. GCB Bioenergy 2021, 13, 1708–1730. [Google Scholar] [CrossRef]
  8. Efosa, N.; Krause, H.M.; Hüppi, R.; Krauss, M.; Vaucher, N.; Zourek, F.; Mayer, J.; Six, J.; Bünemann, E.K. Emissions of nitrous oxide and methane after field application of liquid organic fertilizers and biochar. Agric. Ecosyst. Environ. 2023, 356, 108642. [Google Scholar] [CrossRef]
  9. Jirka, S.; Tomlinson, T. State of the Biochar Industry 2014; International Biochar Initiative Report; 2015; Available online: https://biochar-international.org/wp-content/uploads/2018/11/ibi_state_of_the_industry_2014_final.pdf (accessed on 5 December 2023).
  10. Kammann, C.; Ippolito, J.; Hagemann, N.; Borchard, N.; Cayuela, M.L.; Estavillo, J.M.; Fuertes-Mendizabal, T.; Jeffery, S.; Kern, J.; Novak, J.; et al. Biochar as a tool to reduce the agricultural greenhouse-gas burden—Knowns, unknowns and future research needs. J. Environ. Eng. Landsc. Manag. 2017, 25, 114–139. [Google Scholar] [CrossRef]
  11. Saleem, A.M.; Ribeiro, G.O., Jr.; Yang, W.Z.; Ran, T.; Beauchemin, K.A.; McGeough, E.J.; Ominski, K.H.; Okine, E.K.; McAllister, T.A. Effect of engineered biocarbon on rumen fermentation, microbial protein synthesis, and methane production in an artificial rumen (RUSITEC) fed a high forage diet. J. Anim. Sci. 2018, 96, 3121–3130. [Google Scholar] [CrossRef]
  12. El-Naggar, A.; Lee, S.S.; Rinklebe, J.; Farooq, M.; Song, H.; Sarmah, A.K.; Zimmerman, A.R.; Ahmad, M.; Shaheen, S.M.; Ok, Y.S. Biochar application to low fertility soils: A review of current status and future prospects. Geoderma 2019, 337, 536–554. [Google Scholar] [CrossRef]
  13. Cayuela, M.L.; Van Zwieten, L.; Singh, B.P.; Jeffery, S.; Roig, A.; Sánchez-Monedero, M.A. Biochar’s role in mitigating soil nitrous oxide emissions: A review and meta-analysis. Agr. Ecosyst. Environ. 2014, 191, 5–16. [Google Scholar] [CrossRef]
  14. Lorenz, K.; Lal, R. Biochar application to soil for climate change mitigation by soil organic carbon sequestration. J. Plant Nutr. Soil Sci. 2014, 177, 651–670. [Google Scholar] [CrossRef]
  15. Ambrose, H.W.; Dalby, F.R.; Feilberg, A.; Kofoed, M.V. Additives and methods for the mitigation of methane emission from stored liquid manure. Biosyst. Eng. 2023, 229, 209–245. [Google Scholar] [CrossRef]
  16. Yanai, Y.; Toyota, K.; Okazaki, M. Effects of charcoal addition on N2O emissions from soil resulting from rewetting air-dried soil in short-term laboratory experiments. Soil Sci. Plant Nutr. 2007, 53, 181–188. [Google Scholar] [CrossRef]
  17. Van Zwieten, L.; Kimber, S.; Morris, S.; Downie, A.; Berger, E.; Rust, J.; Scheer, C. Influence of biochars on flux of N2O and CO2 from Ferrosol. Soil Res. 2010, 48, 555–568. [Google Scholar] [CrossRef]
  18. Jones, D.L.; Murphy, D.V.; Khalid, M.; Ahmad, W.; Edwards-Jones, G.; DeLuca, T.H. Short-term biochar-induced increase in soil CO2 release is both biotically and abiotically mediated. Soil Biol. Biochem. 2011, 43, 1723–1731. [Google Scholar] [CrossRef]
  19. Wang, J.; Pan, X.; Liu, Y.; Zhang, X.; Xiong, Z. Effects of biochar amendment in two soils on greenhouse gas emissions and crop production. Plant Soil 2012, 360, 287–298. [Google Scholar] [CrossRef]
  20. Rogovska, N.; Laird, D.; Cruse, R.; Fleming, P.; Parkin, T.; Meek, D. Impact of biochar on manure carbon stabilization and greenhouse gas emissions. Soil Sci. Soc. Am. J. 2011, 75, 871–879. [Google Scholar] [CrossRef]
  21. Feng, Y.Z.; Xu, Y.P.; Yu, Y.C.; Xie, Z.B.; Lin, X.G. Mechanisms of biochar decreasing methane emission from Chinese paddy soils. Soil Biol. Biochem. 2012, 46, 80–88. [Google Scholar] [CrossRef]
  22. Zheng, H.; Wang, Z.; Deng, X.; Herbert, S.; Xing, B. Impacts of adding biochar on nitrogen retention and bioavailability in agricultural soil. Geoderma 2013, 206, 32–39. [Google Scholar] [CrossRef]
  23. Case, S.D.; McNamara, N.P.; Reay, D.S.; Whitaker, J. Can biochar reduce soil greenhouse gas emissions from a M iscanthus bioenergy crop? GCB Bioenergy 2014, 6, 76–89. [Google Scholar] [CrossRef]
  24. Quin, P.; Joseph, S.; Husson, O.; Donne, S.; Mitchell, D.; Munroe, P.; Phelan, D.; Cowie, A.; Van Zwieten, L. Lowering N2O emissions from soils using eucalypt biochar: The importance of redox reactions. Sci. Rep. 2015, 5, 16773. [Google Scholar] [CrossRef]
  25. Cao, Y.; Wang, X.; Bai, Z.; Chadwick, D.; Misselbrook, T.; Sommer, S.G.; Qin, W.; Ma, L. Mitigation of ammonia, nitrous oxide and methane emissions during solid waste composting with different additives: A meta-analysis. J. Clean. Prod. 2019, 235, 626–635. [Google Scholar] [CrossRef]
  26. Xiao, Z.; Rasmann, S.; Yue, L.; Lian, F.; Zou, H.; Wang, Z. The effect of biochar amendment on N-cycling genes in soils: A meta-analysis. Sci. Total Environ. 2019, 696, 133984. [Google Scholar] [CrossRef] [PubMed]
  27. Al-Wabel, M.I.; Hussain, Q.; Usman, A.R.; Ahmad, M.; Abduljabbar, A.; Sallam, A.S.; Ok, Y.S. Impact of biochar properties on soil conditions and agricultural sustainability: A review. Land Degrad. Dev. 2018, 29, 2124–2161. [Google Scholar] [CrossRef]
  28. Mao, H.; Lv, Z.; Sun, H.; Li, R.; Zhai, B.; Wang, Z.; Awasthia, M.K.; Wang, Q.; Zhou, L. Improvement of biochar and bacterial powder addition on gaseous emission and bacterial community in pig manure compost. Bioresour. Technol. 2018, 258, 195–202. [Google Scholar] [CrossRef] [PubMed]
  29. Adviento-Borbe, M.A.; Pittelkow, C.M.; Anders, M.; van Kessel, C.; Hill, J.E.; McClung, A.M.; Six, J.; Linquist, B.A. Optimal fertilizer nitrogen rates and yield-scaled global warming potential in drill seeded rice. J. Environ. Qual. 2013, 42, 1623–1634. [Google Scholar] [CrossRef] [PubMed]
  30. Mukherjee, S.; Weihermueller, L.; Tappe, W.; Vereecken, H.; Burauel, P. Microbial respiration of biochar-and digestate-based mixtures. Biol. Fert. Soils 2016, 52, 151–164. [Google Scholar] [CrossRef]
  31. Hu, Y.; Thomsen, T.P.; Fenton, O.; Sommer, S.G.; Shi, W.; Cui, W. Effects of dairy processing sludge and derived biochar on greenhouse gas emissions from Danish and Irish soils. Environ. Res. 2013, 216, 114543. [Google Scholar] [CrossRef]
  32. Abagandura, G.O.; Chintala, R.; Sandhu, S.S.; Kumar, S.; Schumacher, T.E. Effects of biochar and manure applications on soil carbon dioxide, methane, and nitrous oxide fluxes from two different soils. J. Environ. Qual. 2019, 48, 1664–1674. [Google Scholar] [CrossRef]
  33. Baldé, H.; VanderZaag, A.C.; Burtt, S.; Evans, L.; Wagner-Riddle, C.; Desjardins, R.L.; MacDonald, J.D. Measured versus modeled methane emissions from separated liquid dairy manure show large model underestimates. Agric. Ecosyst. Environ. 2016, 230, 261–270. [Google Scholar] [CrossRef]
  34. Kupper, T.; Häni, C.; Neftel, A.; Kincaid, C.; Bühler, M.; Amon, B.; VanderZaag, A. Ammonia and greenhouse gas emissions from slurry storage—A review. Agr. Ecosyst. Environ. 2020, 300, 106963. [Google Scholar] [CrossRef]
  35. Oertel, C.; Matschullat, J.; Zurba, K.; Zimmermann, F.; Erasmi, S. Greenhouse gas emissions from soils—A review. Geochemistry 2016, 76, 327–352. [Google Scholar] [CrossRef]
Figure 1. Example of the static chamber used in the experiment, with details about the fan used for homogenizing the gas sample.
Agriculture 14 00162 g001
Figure 2. Maximum, minimum, and average air temperature trends during the experimental period.
Agriculture 14 00162 g002
Figure 3. Trend of daily CO2-C emissions from D and DB (a), S and SB (b), and M and MB (c). The error bars represent the daily standard deviations for each treatment.
Agriculture 14 00162 g003
Figure 4. Trend of daily CH4-C emissions from D and DB (a), S and SB (b), and M and MB (c). The error bars represent the daily standard deviations for each treatment.
Agriculture 14 00162 g004
Figure 5. Global warming potential for the digestate (D), digestate plus biochar (DB), slurry (S), slurry plus biochar (SB), manure (M), and manure plus biochar (MB). The error bars represent the standard deviations for each treatment. The bars that do not share a letter were significantly different at a 5% probability level.
Agriculture 14 00162 g005
Table 1. Summary of the combinations of the different matrices (in kg) used for the experiment. D, digestate; DB, digestate plus biochar; S, slurry; SB, slurry plus biochar; M, manure; MB, manure plus biochar.
TreatmentDigestateSlurryManureBiochar
D3---
DB3--1.5
S-2--
SB-2-1
M--3-
MB--31.5
Table 2. Initial C contents (both in % and kg m−3), volumes, and densities of the treatments.
TreatmentC Content
(%)
C Content
(kg m−3)
Moisture
(%)
Volume
(m−3)
Density
(kg m−3)
D3.042.0083.200.004239707.7
DB12.69101.0068.800.005652796.2
S4.0322.8488.120.0035325566.2
SB15.2096.8372.000.00471636.9
M9.1237.9074.230.007222415.4
MB18.58108.6962.670.007693584.9
Biochar62.57112.6340.00-300.00
Table 3. Cumulative CO2 and CH4 emissions during the experimental period (21 days) for the digestate (D), digestate plus biochar (DB), slurry (S), slurry plus biochar (SB), manure (M), and manure plus biochar (MB).
TreatmentCO2 (kg C m−3)CH4 (g C m−3)GWP (kg CO2 eq)
D0.65 (±0.06) c20.99 (±7.10) c1.24 (±0.26) c
DB0.36 (±0.04) d6.77 (±1.87) d0.55 (±0.09) d
S1.02 (±0.10) a123.77 (±24.56) a4.48 (±0.69) a
SB0.76 (±0.03) b98.78 (±24.62) b3.52 (±0.70) b
M0.28 (±0.07) d1.77 (±0.34) e0.33 (±0.07) e
MB0.17 (±0.02) e0.34 (±0.08) f0.18 (±0.01) f
The means that do not share a letter were determined to be significantly different at a 5% probability level using Tukey HSD post hoc test.
Disclaimer/Publisher’s Note: The statements, opinions and data contained in all publications are solely those of the individual author(s) and contributor(s) and not of MDPI and/or the editor(s). MDPI and/or the editor(s) disclaim responsibility for any injury to people or property resulting from any ideas, methods, instructions or products referred to in the content.

