Multi-Crop Navigation Line Extraction Based on Improved YOLO-v8 and Threshold-DBSCAN under Complex Agricultural Environments


1
College of Engineering, Nanjing Agricultural University, Nanjing 210095, China
2
College of Artificial Intelligence, Nanjing Agricultural University, Nanjing 210095, China
*
Author to whom correspondence should be addressed.
Agriculture 2024, 14(1), 45; https://doi.org/10.3390/agriculture14010045
Submission received: 27 November 2023
/
Revised: 20 December 2023
/
Accepted: 25 December 2023
/
Published: 26 December 2023
(This article belongs to the Section Digital Agriculture)
Abstract
:Field crops are usually planted in rows, and accurate identification and extraction of crop row centerline is the key to realize autonomous navigation and safe operation of agricultural machinery. However, the diversity of crop species and morphology, as well as field noise such as weeds and light, often lead to poor crop detection in complex farming environments. In addition, the curvature of crop rows also poses a challenge to the safety of farm machinery during travel. In this study, a combined multi-crop row centerline extraction algorithm is proposed based on improved YOLOv8 (You Only Look Once-v8) model, threshold DBSCAN (Density-Based Spatial Clustering of Applications with Noise) clustering, least squares method, and B-spline curves. For the detection of multiple crops, a DCGA-YOLOv8 model is developed by introducing deformable convolution and global attention mechanism (GAM) on the original YOLOv8 model. The introduction of deformable convolution can obtain more fine-grained spatial information and adapt to crops of different sizes and shapes, while the combination of GAM can pay more attention to the important feature areas of crops. The experimental results shown that the F1-score and mAP value of the DCGA-YOLOv8 model for Cabbage, Kohlrabi, and Rice are 96.4%, 97.1%, 95.9% and 98.9%, 99.2%, 99.1%, respectively, which has good generalization and robustness. A threshold-DBSCAN algorithm was proposed to implement clustering for each row of crops. The correct clustering rate for Cabbage, Kohlrabi and Rice reaches 98.9%, 97.9%, and 100%, respectively. And LSM and cubic B-spline curve methods were applied to fit straight and curved crop rows, respectively. In addition, this study constructed a risk optimization function for the wheel model to further improve the safety of agricultural machines operating between crop rows. This indicates that the proposed method can effectively realize the accurate recognition and extraction of navigation lines of different crops in complex farmland environment, and improve the safety and stability of visual navigation and field operation of agricultural machines.
1. Introduction
In recent years, with population growth and environmental degradation, the efficient and safe production of food has become a topical issue in international agricultural development [1]. Despite the technological advances in agriculture over the past decades, there are still many tasks that depend on hard labor. The development of intelligent farm equipment and agricultural robots can effectively alleviate labor demand and improve production efficiency [2,3]. Safe and autonomous navigation of agricultural robots during field operations is a key technology for realizing precision agriculture [4]. The navigation system can safely guide the agricultural machinery along the desired path of its low price, complete information acquisition, and wide detection information [5,6]. Since most field crops are generally planted or cultivated in rows, the path of agricultural machines in the field follows an s-shaped curve along the crop rows, so the accurate identification and extraction of the centerline of the crop rows is crucial for realizing the visual navigation of agricultural machinery [7]. Accurate crop row detection and agricultural machinery trajectory planning can reduce the fuel consumption and production cost of agricultural machinery and improve the utilization rate and operation efficiency of farm machinery. In addition, the optimized track of agricultural machinery can reduce crop losses during agricultural operations and improve the sustainability of agricultural production.
At present, traditional methods and deep-learning-based methods are the two main research directions in the field of crop row centerline recognition [8]. However, the traditional crop line detection scheme is vulnerable to various environmental factors such as light and shadow [9]. The application of deep learning algorithms can effectively overcome some of the limitations of the traditional methods and can detect crop rows in the presence of changing illumination, object size and position, weed shading, and background [10,11]. In recent years, the combination of deep learning algorithms and vision sensors has received widespread attention in the field of crop row detection. Crop row detection work based on deep learning is mainly implemented by predicting crop row masks as binary images through image segmentation methods [12]. UNet is a relatively common and simple semantic segmentation network in the field of crop row detection [13]. Li et al. [14], Yang et al. [15], De Silva et al. [12], and Diao et al. [16] respectively enhanced and optimized the traditional UNet network in different aspects, to improve the segmentation accuracy of crop rows and backgrounds, and reduce the training time. Aiming at the problem of inhomogeneous contours of strawberry crop rows, Ponnambalam et al. [17] implemented the identification of strawberry crop rows and the fitting of traversable area trajectories based on an improved SegNet network and an adaptive multi-ROI algorithm. Considering the existence of sparse and dense regions in crop rows, Pang et al. [18] developed an innovative instance segmentation algorithm, MaxArea Mask Scoring RCNN, which specifically improve the mask scoring of the traditional Mask RCNN network and could effectively segment crop rows in different regions regardless of the topographic conditions. However, crop row detection methods based on semantic segmentation are not obvious to crop boundary information, and most of the studies converted the crop rows into a rough long rectangular bar for mask prediction, ignoring the edge information of each crop [19]. On the other hand, semantic segmentation-based crop row detection models have higher computational complexity and require larger training datasets due to the need for pixel-level annotation [20]. In addition to semantic segmentation-based approaches, the application of object detection techniques emerges as a viable alternative for effectively detecting crop rows. The precise location of crops in the image is the basis of accurate extraction of navigation lines. Khan et al. [21] introduced the ResNet-101 network into the Faster RCNN model and optimized the anchor point (pre-selected box) and feature extraction modules to achieve accurate detection of pea and strawberry crops in a real agricultural environment. To address the effect of random weed distribution on rice seedling row identification, Wang et al. [22] proposed an improved PosiFocalLoss-Yolov5 (PFL-Yolov5) network to automatically identify rice seedling locations, and then the sub-region growing and outlier removal algorithms were used to fit the seedling row centerlines. Aiming at different growth periods and growing environments of maize crops, Diao et al. [23] proposed a new spatial pyramid pooling structure to improve the YOLOv8s network, which improves the detection accuracy of maize plant cores, and enhances the adaptability of navigational line extraction in the complex farmland environment.
Existing deep-learning-based crop row detection methods mainly localize a single crop or crop row individually, and do not consider a variety of crops in the field environment, which has poor generalization ability. In addition, crops grow differently in the farmland, and crops of the same type also differ in shape and size. Traditional target detection networks have limitations in extracting features of crops with different morphologies, which will affect the accuracy of crop detection. On the other hand, most of the current research on crop row detection only focuses on straight crop rows, with little research on curved crop rows. Curved crop rows usually have irregular shapes, uncertain dimensional variations, and crop rows may obscure and overlap each other, which affect the accuracy and fitness of object detection [8,24].
In allusion to the above problems, this paper proposes a multi-crop navigation line extraction method based on improved YOLO-v8 and threshold-DBSCAN algorithm under complex agricultural environments. The detailed process and goals are as follows: (1) develop an improved YOLOv8 model DCGA-YOLOv8 combined with deformable convolution and global attention mechanism (GAM) to realize automatic and efficient detection of different crop rows in complex environments; (2) apply a combined crop line fitting method based on DBSCAN cluster analysis, LSM, and B-spline curve method to generate straight and curved crop lines; (3) construct a risk optimization function of the wheel model on the basis of the attitude of the agricultural machinery relative to the crop or the crop row.
2. Materials and Methods
2.1. Multi-Crop Data Collection and Annotation
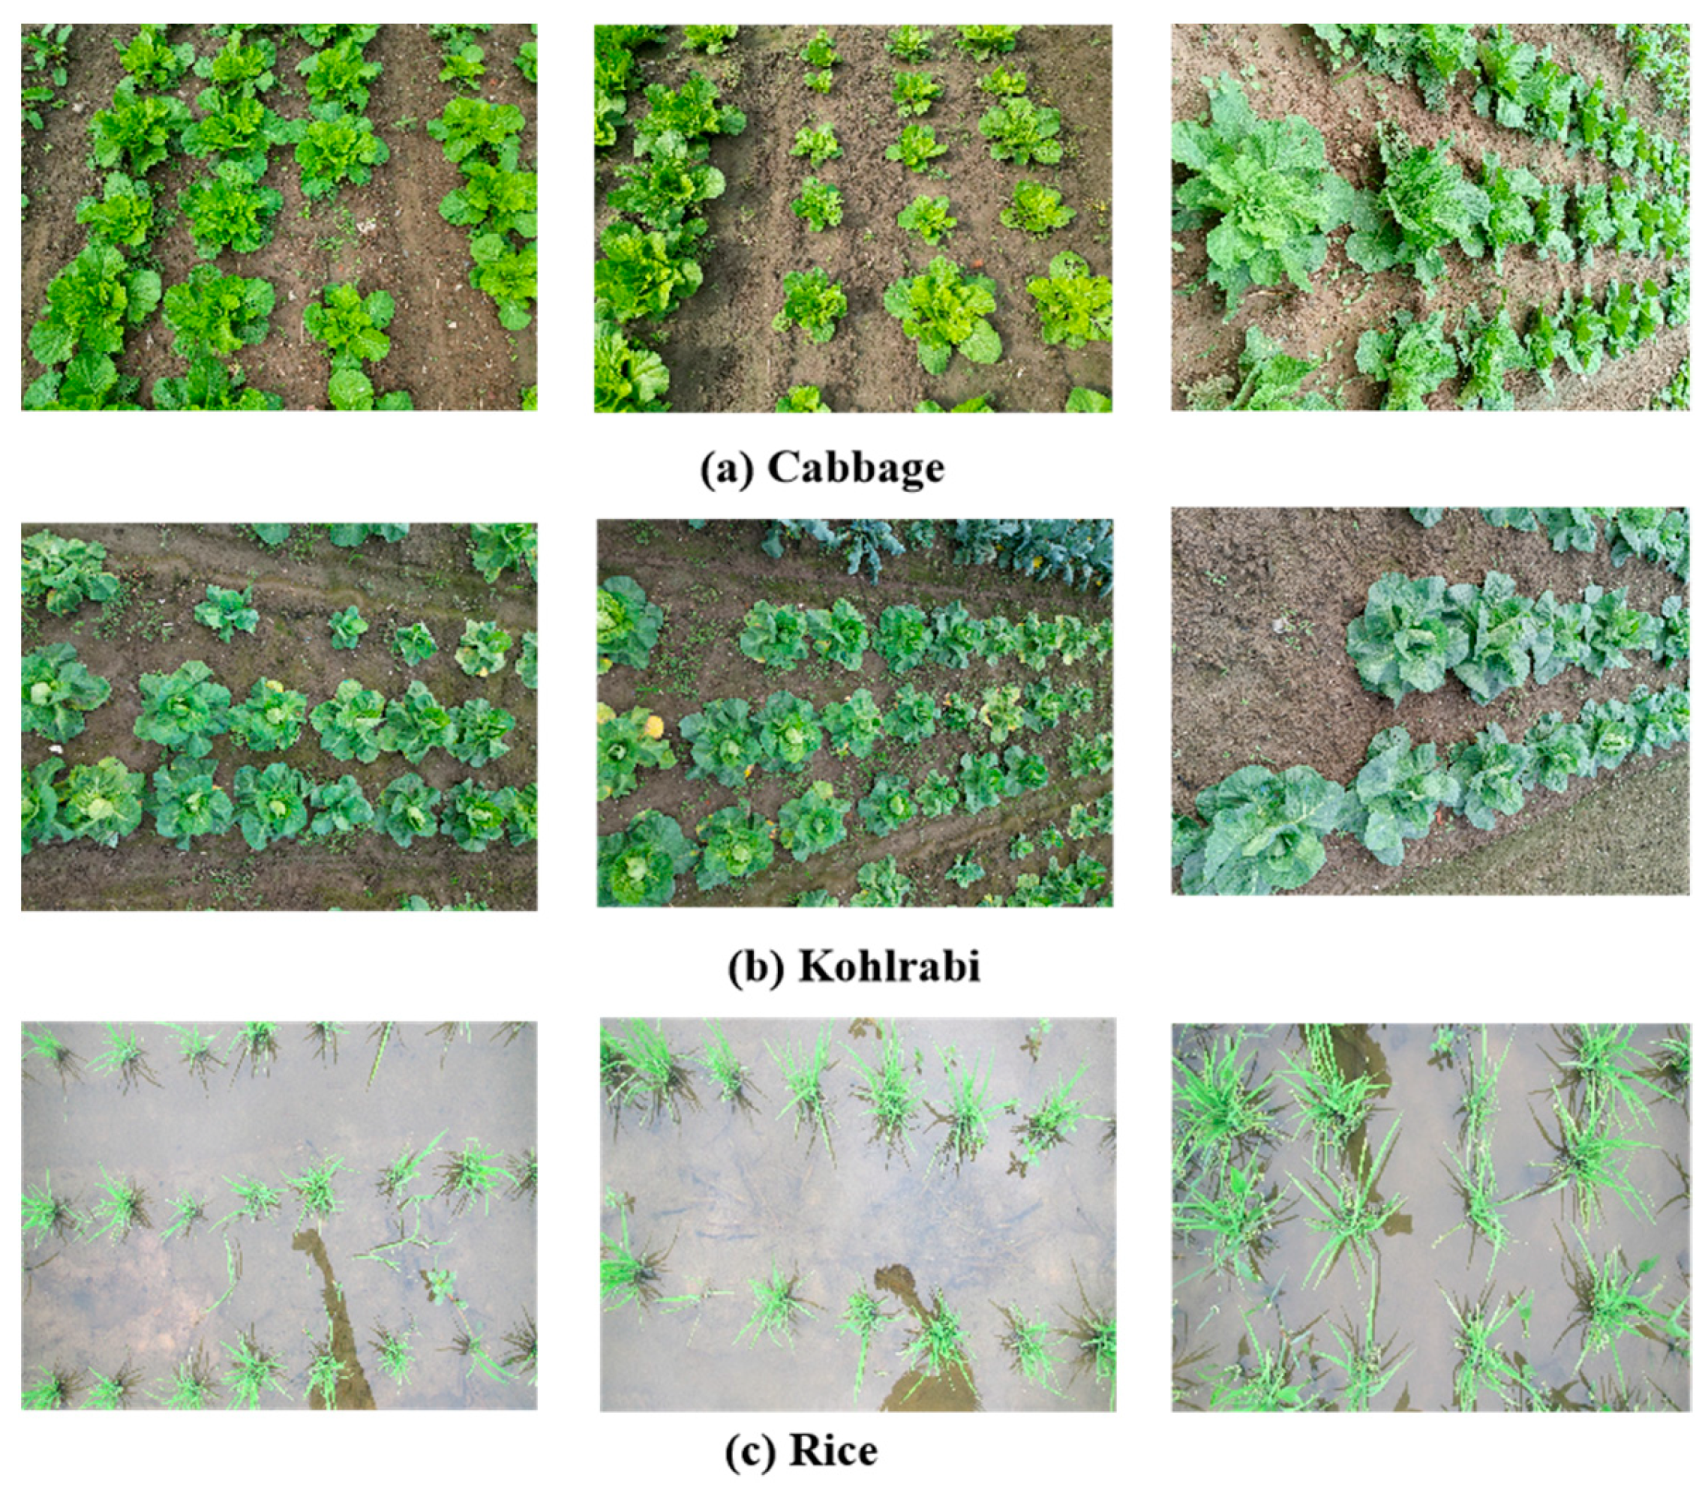
In this study, the cabbage dataset and the kohlrabi dataset were collected in Nanjing, Jiangsu Province, and each crop dataset contained 400 images. In each dataset, 200 images were acquired from different angles using a handheld Sony IMX386 camera (Atsugi-shi, Japan) and a DJI drone (Beijing, China), respectively. The angle view of cameras was set between 30 and 45 degrees to provide crop images from multiple angles. In order to further study the problem of multi-crop detection under complex field conditions, a seeding dataset containing 400 seedling images was acquired from the Internet, collected by [25]. Crops are grown in environments with varying weed densities, and the same crops are also inconsistent in shape and size. The collected images were all saved in JPG format with a resolution of 4032 × 3024 pixels, as shown in Figure 1.
In order to avoid model overfitting, data augmentation methods such as cropping, flipping, and translation were applied to various crop images, expanding the number of datasets to three times the original number. The dataset is divided into a training set and a test set with a 3:1 ratio, where there are 2700 images in the training set (cabbage, kohlrabi, seedling: 900) and 900 images in the test set (cabbage, kohlrabi, seedling: 300). Each image contains more than ten crops, so the number of crops used for training is more than 10,000. LabelImg-v1.8.6 image annotation software was used to manually label the rectangular area of the crop image. The annotation files are saved in XML format and then converted to TXT format.
2.2. YOLOv8 Detection Model
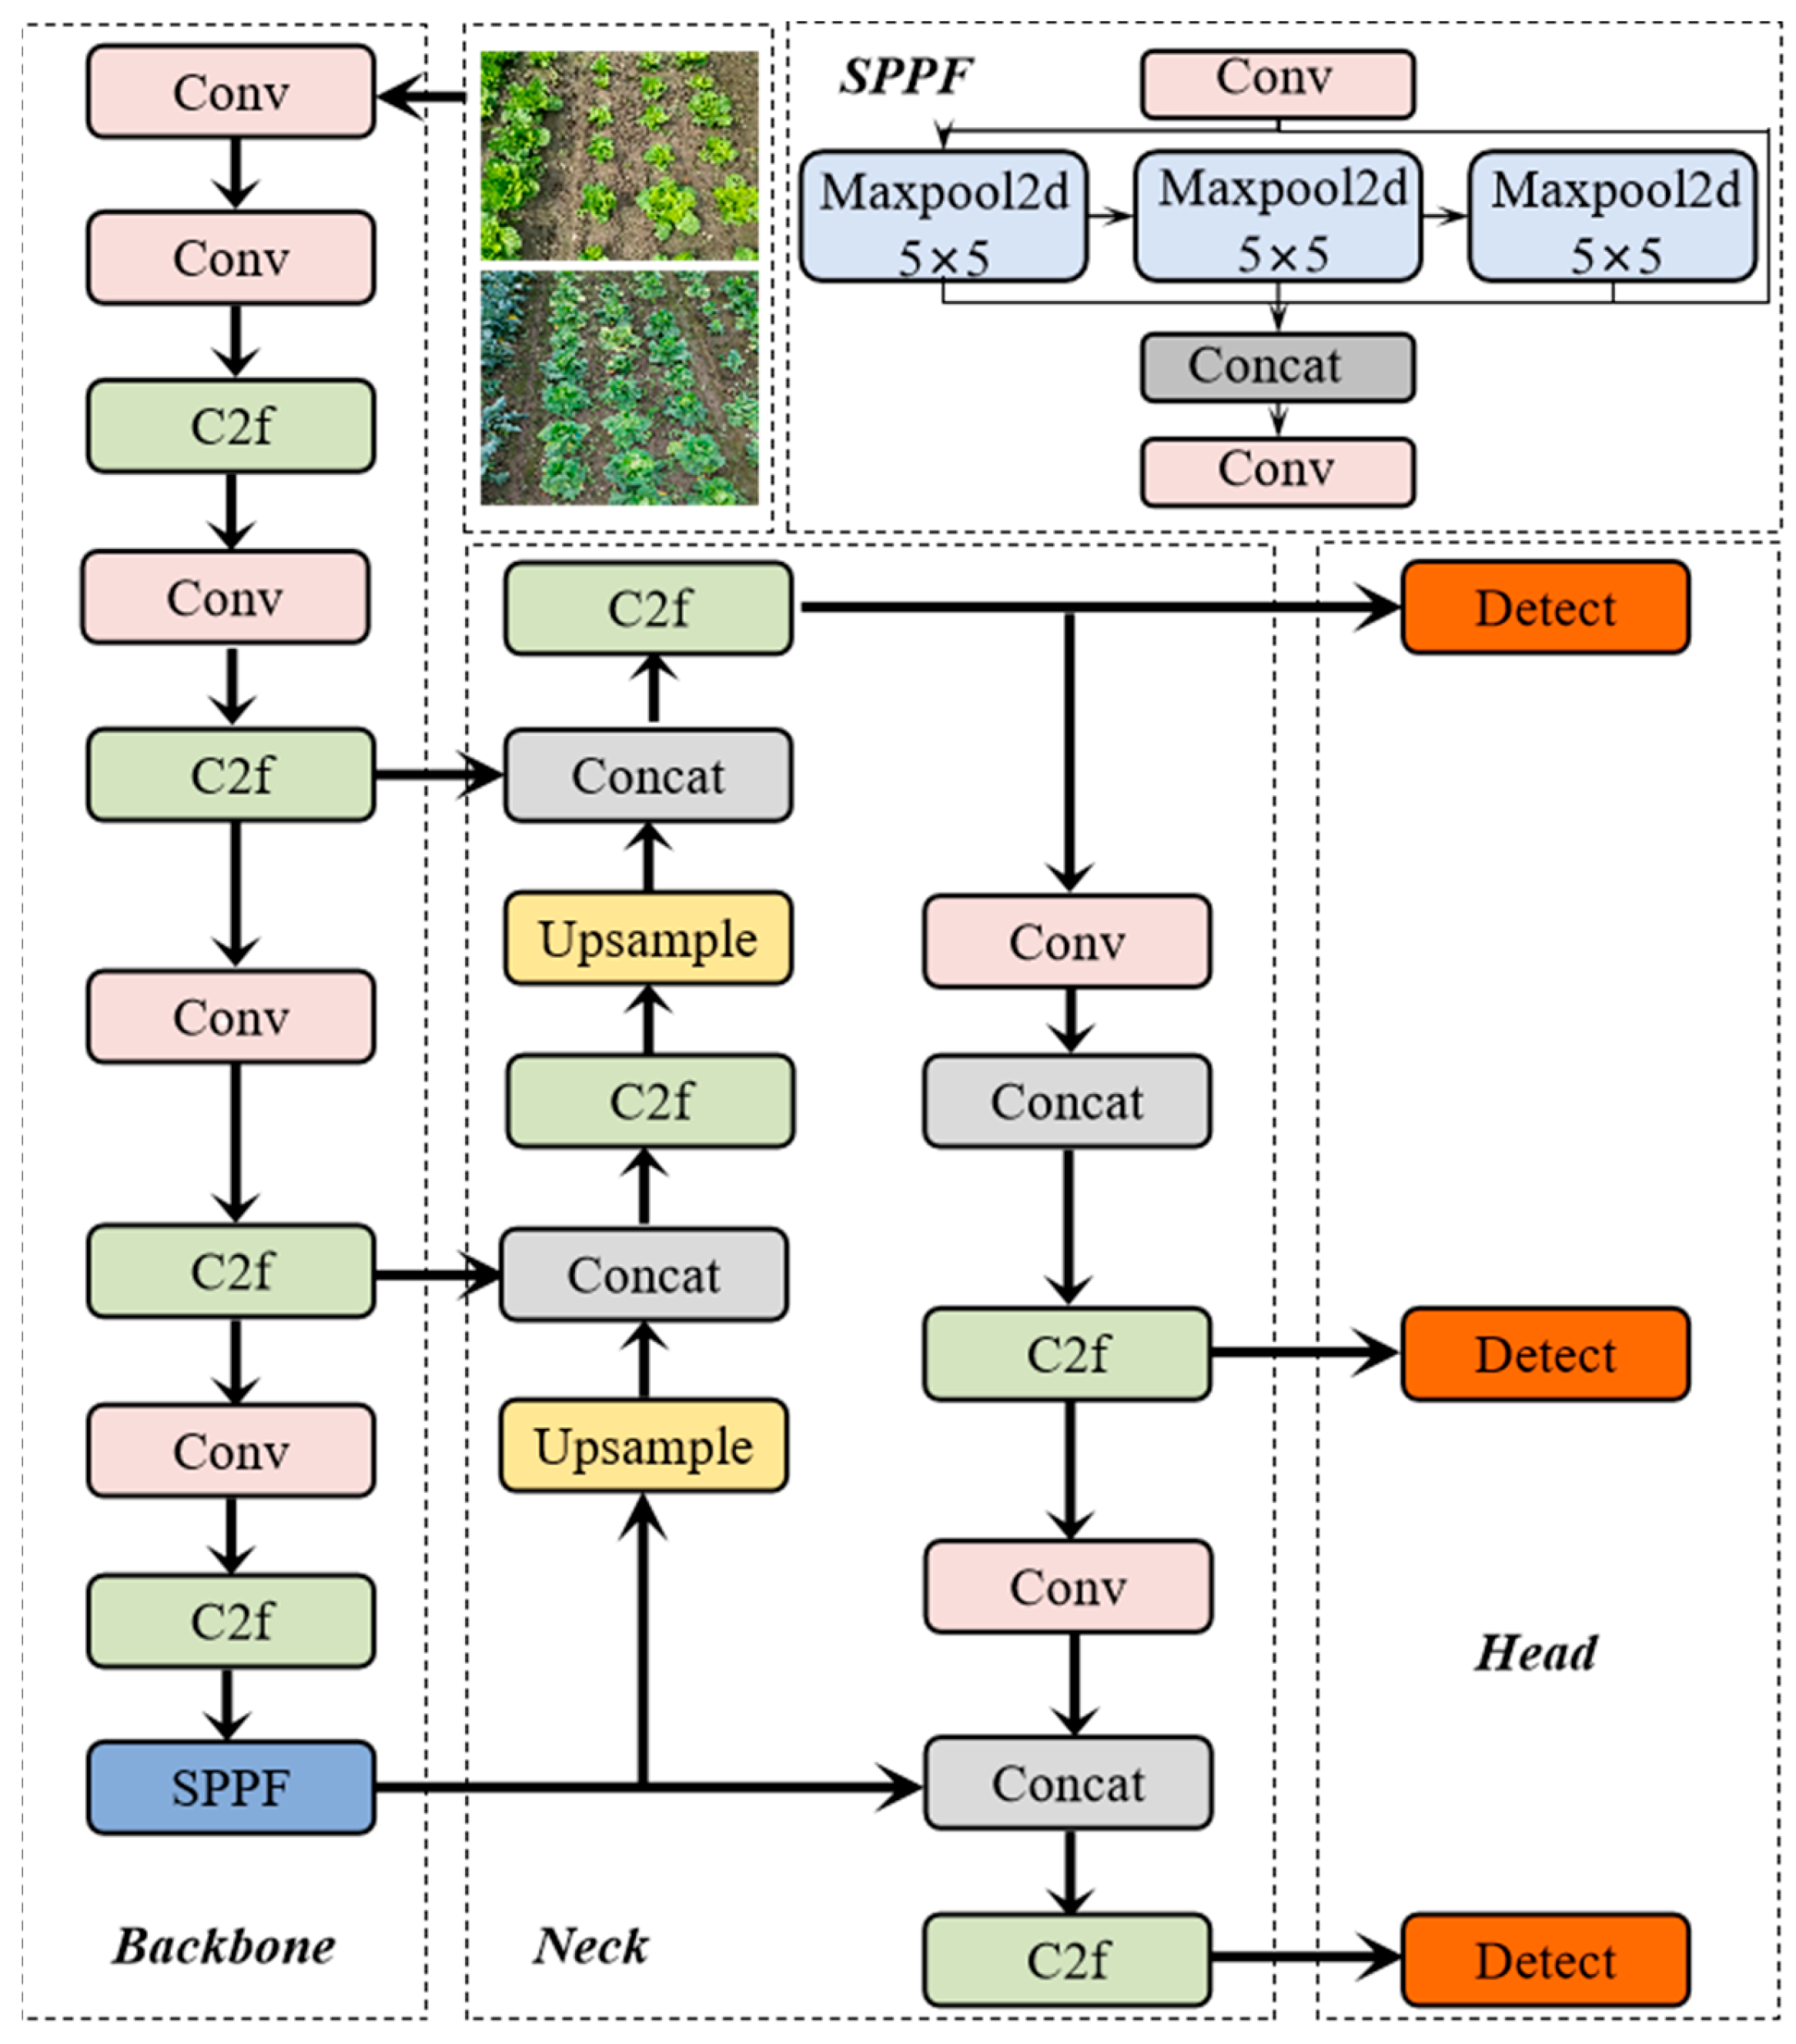
YOLO (You Only Look Once) series is a one-stage, real-time object detection model based on convolutional neural Network (CNN) [26]. The popularity of YOLO is due to the fact that it can fuse features more efficiently and output highly accurate detection results while maintaining a lightweight network architecture. YOLOv8 is the latest version of the YOLO detection model, which introduces new features and improvements over the previous YOLO versions to further enhance detection performance and flexibility. The YOLOv8 model is anchor-free, which reduces the number of box predictions, speeds up non-maxima suppression, and improves detection efficiency. To meet the requirements of various research, YOLOv8 provides five different scale models (n, s, m, l, x) based on scale factors similar to those of YOLOv5. The YOLOv8 network mainly includes Backbone, Neck, and Head modules, which are used for feature extraction, multi-feature fusion and prediction output, respectively. The network structure is shown in Figure 2.
Backbone module: Same as the YOLOv5 architecture, YOLOv8 also uses the Spatial Pyramid Pooling Fusion (SPPF) module, which effectively avoids problems such as image distortion caused by cropping and scaling operations on the image regions and significantly enhances the generalization ability of the model [27]. Referring to the design concept of ELAN (Efficient Layer Aggregation Network), YOLOv8 replaces the C3 structure in the backbone network of YOLOv5 with a C2f structure [28]. The C2f module integrates two parallel gradient flow branches and reduces a convolutional layer on the basis of the original C3 module, enabling the YOLOv8 model to extract richer and more robust gradient flow information while maintaining its lightweight characteristics.
Neck module: This module adopts the feature fusion model of PAN (Path Aggregation Network) [29] and FPN (Feature Pyramid Network) principle [30]. By bi-directional fusion of high-level features and low-level features, low-level features with smaller receptive fields can be enhanced to improve the detection performance of objects at different scales. Compared with its predecessor YOLOv5 network, YOLOv8 removes the convolutional structure in the up-sampling stage of FPN, and strategically replaces the C3 module with the C2f module.
Head module: YOLOv8 introduces a mainstream Decoupled Head structure to reduce the coupling between different tasks related to target detection and separates the classification and detection heads to extract target location and category information respectively. The fusion is carried out after learning by different network branches, which alleviates the additional delay overhead associated with convolution in the decoupling head and enhances the generalization ability and robustness of the model.
2.3. The DCGA-YOLOv8 Detection Model
In a complex field environment, crops are diverse, and crops of the same type also differ in shape and size. The traditional YOLOv8 network has limited feature extraction capability for variable crops. In this study, an improved model of YOLOv8, called DCGA-YOLOv8, is proposed based on deformable convolution and global attention mechanism (GAM). The improved model improves the detection accuracy of crops by adding the global attention to capture important features and introducing deformable convolution in the detection process to obtain more fine-grained spatial information. The network structure of DCGA-YOLOv8 is illustrated in Figure 3.
2.3.1. C2f-DCN2 Module
In the original YOLOv8 model, the convolution operation of the traditional convolutional layer is performed using a fixed size and shape convolution kernel, which has poor generalization ability and cannot capture the complex spatial variations of objects in the image [31,32]. In a complex farmland environment, crops of the same type also differ in shape and size. The fixed-size convolution kernel will have an impact on the ability to extract crop features. To address the limitations of traditional convolutional neural networks, the DC (deformable convolution) module is introduced [33]. The detailed structure of DC is presented in Figure 4. In DC module, a learnable sampling grid is utilized instead of the conventional sampling grid, and position-offset and shape-change parameters are introduced. Compared with ordinary convolutional networks, DC allows the position and shape of the convolution kernel to be dynamically adjusted to some extent to better accommodate irregular target shapes and locations. The introduction of DC enables the model to capture more fine-grained spatial features and improve the image recognition accuracy.
DCNv2 is an improved version of the deformable convolution technique, which introduces a more concise and efficient transform branch of DC, reducing computational complexity and irrelevant information [34,35]. Compared with the first generation of deformable convolutional networks (DCNv1), DCNv2 is optimized in terms of offset learning, multi-channel expansion, pooling, and convolutional kernel sampling strategy, which further improves the adaptability and computational efficiency of the model to different geometric transformations. The calculation formula of DCNv2 is expressed as Equation (1).
where, x and y are the input feature map and the output feature mapping map, respectively, p is the actual position of the pixel in the feature map, and Pk is the sampling point of the convolution kernel; denotes the weight of the kth position; and respectively denote the learnable offset and modulation parameter at the kth position, can be an arbitrary value, . Since the offset Δ is generated by convolving the input feature map with another convolutional layer, it is usually expressed as a decimal.
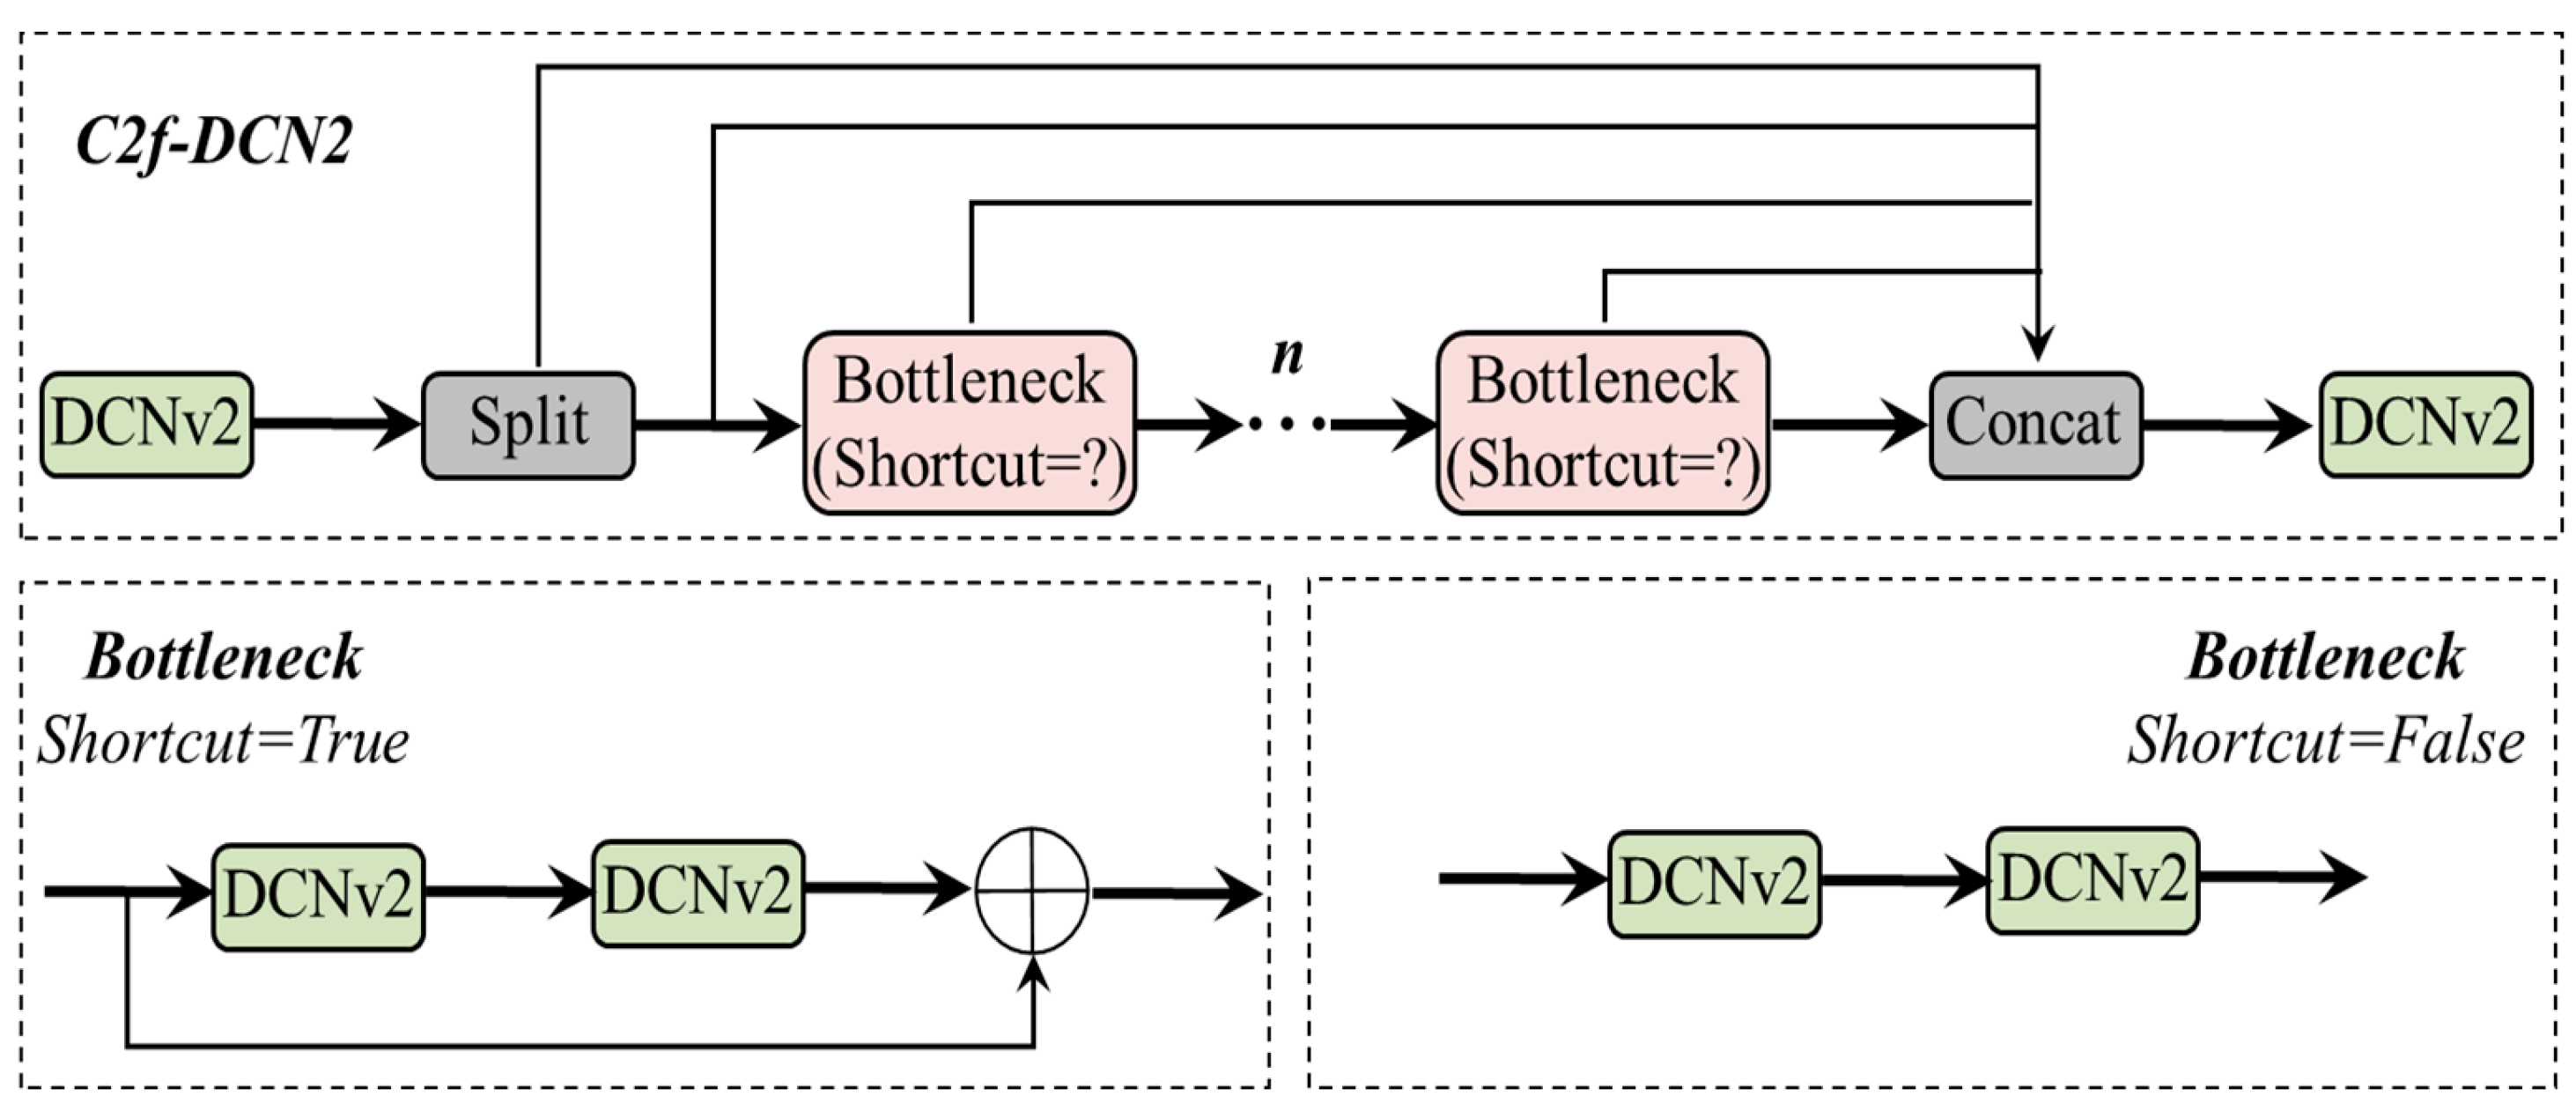
In order to fully extract the edge features of different crops and improve the computational efficiency of the original C2f module, this study designed a C2f-DCN2 module through combining the C2f module and the DCNv2 module, as shown in Figure 5. Each C2f-DCN2 module consists of two DCNv2 and n Bottleneck modules. In the network structure of YOLOv8, some nodes in the network structure are adjusted, and C2f modules in layers 6 and 8 of the backbone network structure and C2f modules in layers 15, 18, and 21 of the Neck network were replaced with C2f-DCN2 modules.
2.3.2. GAM Module
Recently, attention mechanism has become a research hotspot for network design in NLP and CV and has been widely applied [36,37,38]. The attention mechanism allows the network to dynamically focus on the target region of the image, highlighting useful information and suppressing attention to other information, which enhances the feature extraction ability and improves the target localization performance. At present, the attention mechanisms in the visual domain mainly include two categories: channel attention and spatial attention mechanisms [39]. The channel attention mechanism generally adds weights to feature channels that contain semantic information of components, while the spatial attention mechanism assigns more weights to feature points in a single-channel feature map that contain target features [40].
In complex agricultural environments, understanding the global contextual information of the entire farmland or vegetation area is crucial for accurate crop detection. In this study, a global attention mechanism (GAM) that combines the advantages of spatial and channel attention mechanisms is used to improve the detection accuracy and adaptability of the YOLOv8 network [41]. The overall structure of GAM is shown in Figure 6.
In the spatial attention sub-module, GAM uses two 7 × 7 convolutional layers for spatial feature information fusion, which enhances the global information interaction ability. Moreover, GAM eliminates the pooling operation and adopts the grouped convolution with channel shuffling to reduce information dispersion and the number of parameters, improving the relevance of the model to the target region. In the channel attention sub-module, a 3D alignment is used to preserve the three-dimensional information, and then a two-layer multi-layer perceptron (MLP) is exploited to magnify the channel-spatial dependencies across dimensions. The expression of GAM is followed by Equations (2) and (3). Given the input feature map , the intermediate state and the output state can be defined as follows:
where MC and MS respectively denote the channel attention and spatial attention feature maps; denotes the pixel-wise multiplication operation.
In order to make the YOLOv8 model better understand the farmland environment in the global scope of the image, including the relationship between cabbage, kohlrabi, seedlings, weeds, soil, and other elements, the GAM module was added to the Backbone network in this study. By adding GAM at appropriate locations in the Backbone network, the YOLOv8 can retain spatial and channel information, better capture global context information, and improve the detection accuracy of crops. The Backbone network of the improved YOLOv8 is shown in Figure 3. First, channel number augmentation and feature extraction are achieved by convolving the feature map in the first layer. Next, the fusion operation is accomplished by the convolutional normalized activation function, where the C2f and C2f-DCN2 modules learn the residual features. Finally, multiple pooling kernels of various sizes in the SPPF module are cascaded to merge the feature maps of each perceptual region, and GAM modules extract the weighted features.
2.3.3. Model Performance Evaluation
In this study, five quantitative metrics including Precision, Recall, F1-score, and mean average precision (mAP) are used to evaluate the detection performance and robustness of different models. The higher the F1-score and mAP, the more robust the model. The expressions of the evaluation metrics are as follows (Equations (4)–(8)).
where, n is the number of sample categories in the dataset, TP is the number of targets correctly identified using the model, FP is the number of targets incorrectly labeled by the model as background regions or other non-target regions, and FN is the number of targets that the model failed to detect.
2.4. Extraction of the Center Lines of the Crop Rows
2.4.1. Crop Position Calculation
After accurately detecting the crop objects using the DCGA-YOLOv8 network, further calculations are required to obtain the crop center position coordinates. Considering that the annotation object in this study is a single crop rather than a crop row segment, the crop can be simplified into a single point by calculating the coordinates of the center point of the bounding box to represent its position. The coordinates of the top-left and bottom-right corner points of the bounding box are PL (xl, yl) and PR (xr, yr), respectively. The crop location (x, y) is defined as follows:
The positioning of the center point of crops are shown in Figure 7a.
2.4.2. Crop Position Cluster Analysis
After obtaining the crop location points, the next step is to group them into different crop rows. Cluster analysis is a common method to determine the true crop rows based on the distance relationship between coordinate points and estimated crop rows [42,43]. Given that the crop rows extend in the positive x-direction, computing clustering using only the y-values allows the points to be grouped into different rows. DBSCAN (Density-Based Spatial Clustering of Applications with Noise) algorithm is an efficient density-based clustering algorithm for finding sets of data points with high density in the data and classifying them into different clusters [44]. The DBSCAN algorithm is insensitive to the order of the initial points and does not require the number of clusters to be pre-specified, making it robust to noise and outliers. In this study, the number of crop rows in various crop images is uncertain, so the use of DBSCAN clustering algorithm can effectively cope with crop clusters of different shapes, sizes, and densities. The principle of DBSCAN is to classify the data points into core points, boundary points, and noise points according to the selected key parameters: Eps (neighborhood radius) and Min_pts (minimum number of points). In the process of crop row clustering, DBSCAN recursively expands and merges the neighborhood of the core point starting from a core point and assigns core points with common neighbors to the same crop row. Boundary points will be assigned to the same crop row as their core points. The clustering process stops when there are no more core points to connect. Figure 7b shows the clustering process of different crop rows.
2.4.3. Crop Rows Fitting
In the last step, the corresponding crop rows are fitted by different crop positions. In the field environment, due to the irregularity of crop growth, in addition to straight crop rows, curved crop rows may also sometimes appear. To cope with irregular crop rows, a combined crop line fitting method based on LSM and B-spline curve method was proposed to generate relatively smooth visual navigation lines for agricultural machines. Straight crop rows were fitted using LSM while curved crop rows were fitted using cubic B-spline curve.
- Fitting of straight crop rows
Currently, most methods for identifying crop rows apply the least squares method, Hough transform, and variants of straight-line fitting for linear fitting [45,46]. LSM has good accuracy and small calculation and can be well adapted to crop rows in complex environments [25]. In this study, LSM was used to fit the crop straight line. Since the set of crop coordinate points exists approximately near a vertical straight line, this study exchanges the coordinate system and establishes the equation of the straight line as f(y) = a1y + b1. The sum of squared distances between the coordinate points and the fitting line is E(x), which is defined as follows:
where n is the number of points on the line.
The principle of LSM is to find a1, b1 such that the value of the objective function E(x) is minimized. The partial derivatives of the parameters a1 and b1 are calculated as follows:
Which, when solved, gives
It is worth noting that the absence of crops has little effect on the fitting of the straight line. When there are broken rows in some of the crop rows, a straight line can still be fitted based on the relationship between the neighbors of the other centroids. The results of the straight-line fitting are shown in Figure 7c.
- Fitting of curved crop rows
Traditional methods can only detect straight crop rows and are not applicable to curved crop rows in field environments. If the linear fitting method is still applied, a larger fitting error or fitting failure may occur. B-spline curves can be flexibly adapted to these irregular shapes by using different numbers of control points on different curve segments. Moreover, it is important to maintain the smoothness of the operation path in agricultural machinery operations. Overly abrupt bends or discontinuous operation paths may lead to vibration or instability of mechanical equipment, thus affecting the operation efficiency and quality. The smoothness feature of the B-spline curve can ensure that the farm machinery maintains smooth motion during operation and reduces unnecessary vibration and impact [47]. In this study, a cubic b-spline curve was used to fit the crop rows that were not arranged neatly. A cubic B-spline curve can be obtained from four adjacent control vertices. For cubic B-spline interpolation, the cubic spline basis function Ni,4(t) at each node is as follows:
where i is the index of the basis function or the node, and t denotes the curve parameter.
Based on the basis function Ni,4(t) and the four known vertices Pi (i = 1, 2, 3, 4), the interpolation curve C(t) can be expressed as:
Based on the above equations, the curved crop rows can be generated by fitting multiple segments of cubic B-spline curves. In addition, in order to avoid large turning of agricultural machinery, the deflection angle of the fitted curve line should be as small as possible. The results of the curved-line fitting are shown in Figure 7d.
2.5. Wheel Optimal Position Calculation
In practical applications, accurate crop detection and navigation line fitting cannot fully guarantee the safe movement of agricultural machinery in row-crop fields. The tilt of the crop and the unsafe distance between the crop rows may cause damage to the crop caused by farm machinery. A combination of factors such as crop row shape, corner control, and crushing risk are often necessary to be considered in order to maximize the safety of machinery operations. This can be regarded as an optimization problem, which minimize the risk of crushing the crop by finding the safe distance and other parameters. The risk optimization function of the wheel is expressed as follows in Equation (16).
where, D is the vertical distance between the two crop rows, D1 and D2 respectively represent the distance between the vehicle and the two crop rows, W is the width of the crop row, x is the lateral position coordinate of the wheel, θ and respectively represent the steering angle and lateral offset of the agricultural machinery. The schematic diagram of the relationship between the crop row and the motion wheel of the farm machine is shown in Figure 8.
The main idea of the objective function is to ensure that the distance between the wheel and the crop line is always not less than the safe distance. The lateral position x of the wheel is used to determine whether the safety conditions are met to ensure that the farm machinery does not intrude into the crop row space while traveling. If the lateral position x of the wheel is close to the crop rows on either side or the radius of the wheel is too large, then the risk will be greater than zero, indicating that the agricultural machinery may run over the crop row, and the position or angle of the wheel needs to be adjusted in time to ensure safety.
2.6. The Overall Multi-Crop Row Detection Framework
In this paper, a multi-crop row detection strategy in complex environment was studied by combining improved YOLOV8 model, threshold DBSCAN clustering, least square method and B-spline curve methods. The framework of the proposed multi-crop row detection method is shown in Figure 9.
3. Results
3.1. Experimental Configuration and Model Deployment
The hardware environment used for image processing and model training in this study included Intel (R) Core (TM) i7-13400KF CPU@ 3.2 GHZ, NVIDIA RTX 3090 GPU, and 24 GB RAM. This experiment was conducted in a system environment consisting of Ubuntu 20.04, Python 3.8.18, CUDA-11.8, cuDNN-8.6.2, and PyTorch 1.20.2.
The resolution of input crop image is set to 640 × 640 by cropping the original image. For different object detection networks, the training number is uniformly set to 100 epochs, the optimizer is SGD, the batch size is set to 32, and the initial and end learning rates are 1 × 10⁻³ and 1 × 10⁻⁴, respectively. In the training process, the optimal parameters of different networks are continuously adjusted and determined according to the pre-training results.
3.2. Multi-Crop Detection Using DCGA-YOLOv8
In this study, an improved Yolov8 model DCGA-YOLOv8 was utilized to detect a variety of crops in the agricultural environment. In order to verify the superiority of DCGA-YOLOv8, comparative experiments are conducted on different crop datasets using current mainstream target detection models, including the original YOLO-v8, YOLO-v5, Faster R-CNN, and SSD models. The changes in loss and performance metrics during training are shown in Figure 10. For a network model with better performance, the loss function values and performance metrics converge faster. It can be seen that the DCGA-YOLOv8 model reaches stability in the training loss and map values at around the 8th epoch, while other models have intermittent oscillations during the training process.
The overall detection results of the different models on the test set are shown in Table 1. The precision, F1-score, and [email protected] of DCGA-YOLOv8 model are 97.1%, 96.5%, and 99.1%, respectively, which are 2.9%, 1.6%, and 1.3% higher than those of the original YOLOv8 model. In addition, it can be seen that the overall performance of the YOLO series network is better than the that of the other three models, which may be that the anchor size in the YOLO network is obtained by clustering the training data, while the size and shape of the anchor box in SSD, Faster and R-CNN model are fixed, which affects the generalization ability of the model.
In order to further analyze the effectiveness of the DCGA-YOLOv8 model in multi-crop detection under the different agricultural environments, the detection accuracy of DCGA-YOLOv8 and YOLOv8 models in Cabbage, Kohlrabi, and Rice were tested and compared respectively, and the results are shown in Table 2 and Figure 11. As presented in Table 2 and Figure 11, the detection performance of the DCGA-YOLOv8 model is superior to that of the original YOLOv8 model on different crops. Especially for the detection of Kohlrabi, the F1-score value and mAP of DCGA-YOLOv8 are 97.1% and 99.2%, which are improved by 2.9% and 1.7%, respectively, compared with the original YOLOv8 model. This may be due to the fact that the collected Kohlrabi crops are too inconsistent in morphology and size, and Kohlrabi and Cabbage also have a certain similarity in shape, which causes great interference to the detection performance of the model.
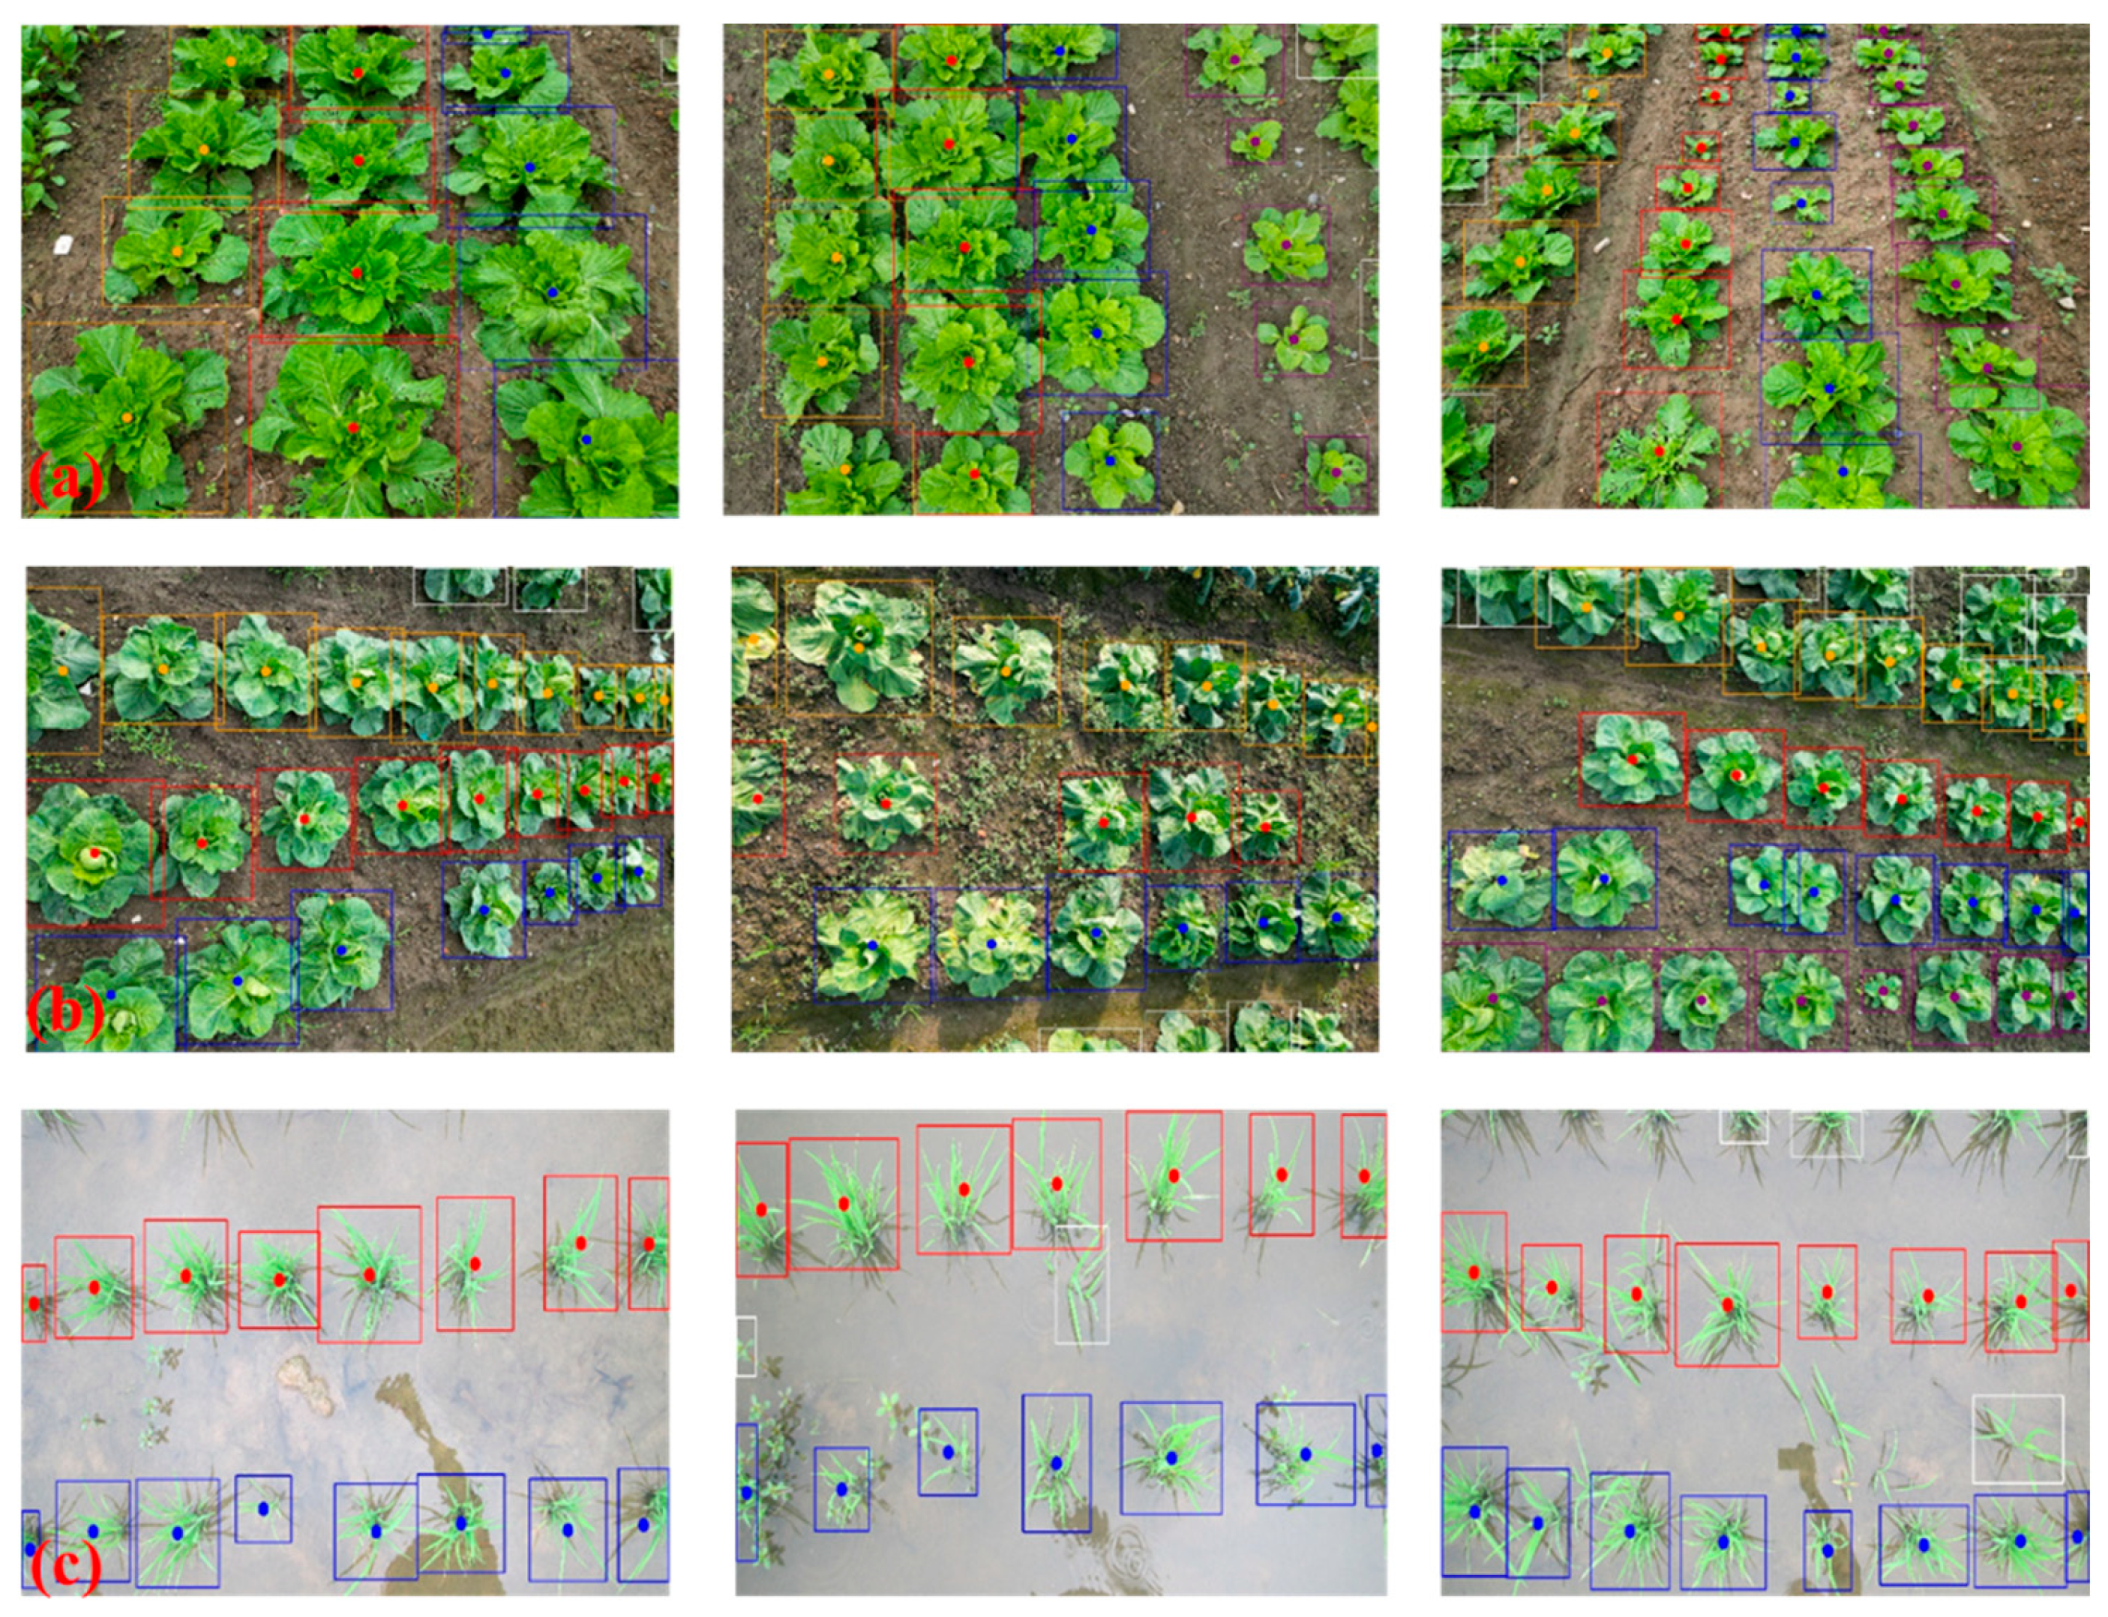
Figure 12 and Figure 13 respectively depict a visual comparison of the detection heatmaps and results of YOLOV8 and DCGA-YOLOv8. It can be seen from figures that both YOLOv8 and DCGA-YOLOv8 models can identify crops in the image, but the original YOLOv8 algorithm still has partial omissions, while the DCGA-YOLOv8 model can indicate the position of crops more clearly and effectively identify crops with unobvious features. This further indicates that the DCGA-YOLOv8 model has good robustness and generalization for multi-crop detection.
3.3. Crop Clustering Using Threshold-DBSCAN Algorithm
Based on the bounding box detected using the DAGA-YOLOv8 model, the center coordinates of crops are obtained and clustered into groups. As shown in Figure 13, the number of crop rows in each image is uncertain, with two, three, and multiple rows, due to the inconsistent density of crop distribution in farmland and the camera angle. The DBSCAN method can be well utilized to automatically identify and group crop rows in complex farmland environments without predetermining the number or shape of crop rows. According to the characteristics of farmland environment, the main parameters of DBSCAN algorithm were selected, the neighborhood distance threshold is set to 0.01 m, and the minimum number of points in the core point domain was set to 8. It is worth noting that there will be some interfering crops or edge crops in the image that cannot form separate rows and may be clustered into adjacent crop rows, which will affect the accurate clustering of crop rows. Therefore, this study introduces a distance threshold detection before DBSCAN clustering, and the detected points that exceed this threshold are considered as interference points and excluded from clustering.
In order to evaluate the clustering effect of DBSCAN algorithm on multiple crops in the complex farmland environment, ten images of each crop are selected in the DCGA-YOLOv8 test set, which contain different numbers of rows. A total of 538 crops were detected using DCGA-YOLOv8 (Cabbage: 205, Klohrabi: 214, Rice: 119), including 67 interfering crops and 471 effective crops. The clustering results are shown in Figure 14 and Table 3, where the correct grouping rate for Cabbage, Kohlrabi, and Rice reaches 98.9%, 97.9%, and 100%, respectively. As shown in Figure 13, all interfering crops and weeds are marked with white boxes and do not participate in the subsequent clustering. The results indicated that the DBSCAN clustering algorithm combined with threshold detection proposed in this study is able to effectively recognize the spatial relationship between crops in different rows, which provided strong support for the subsequent shape fitting of different crop rows.
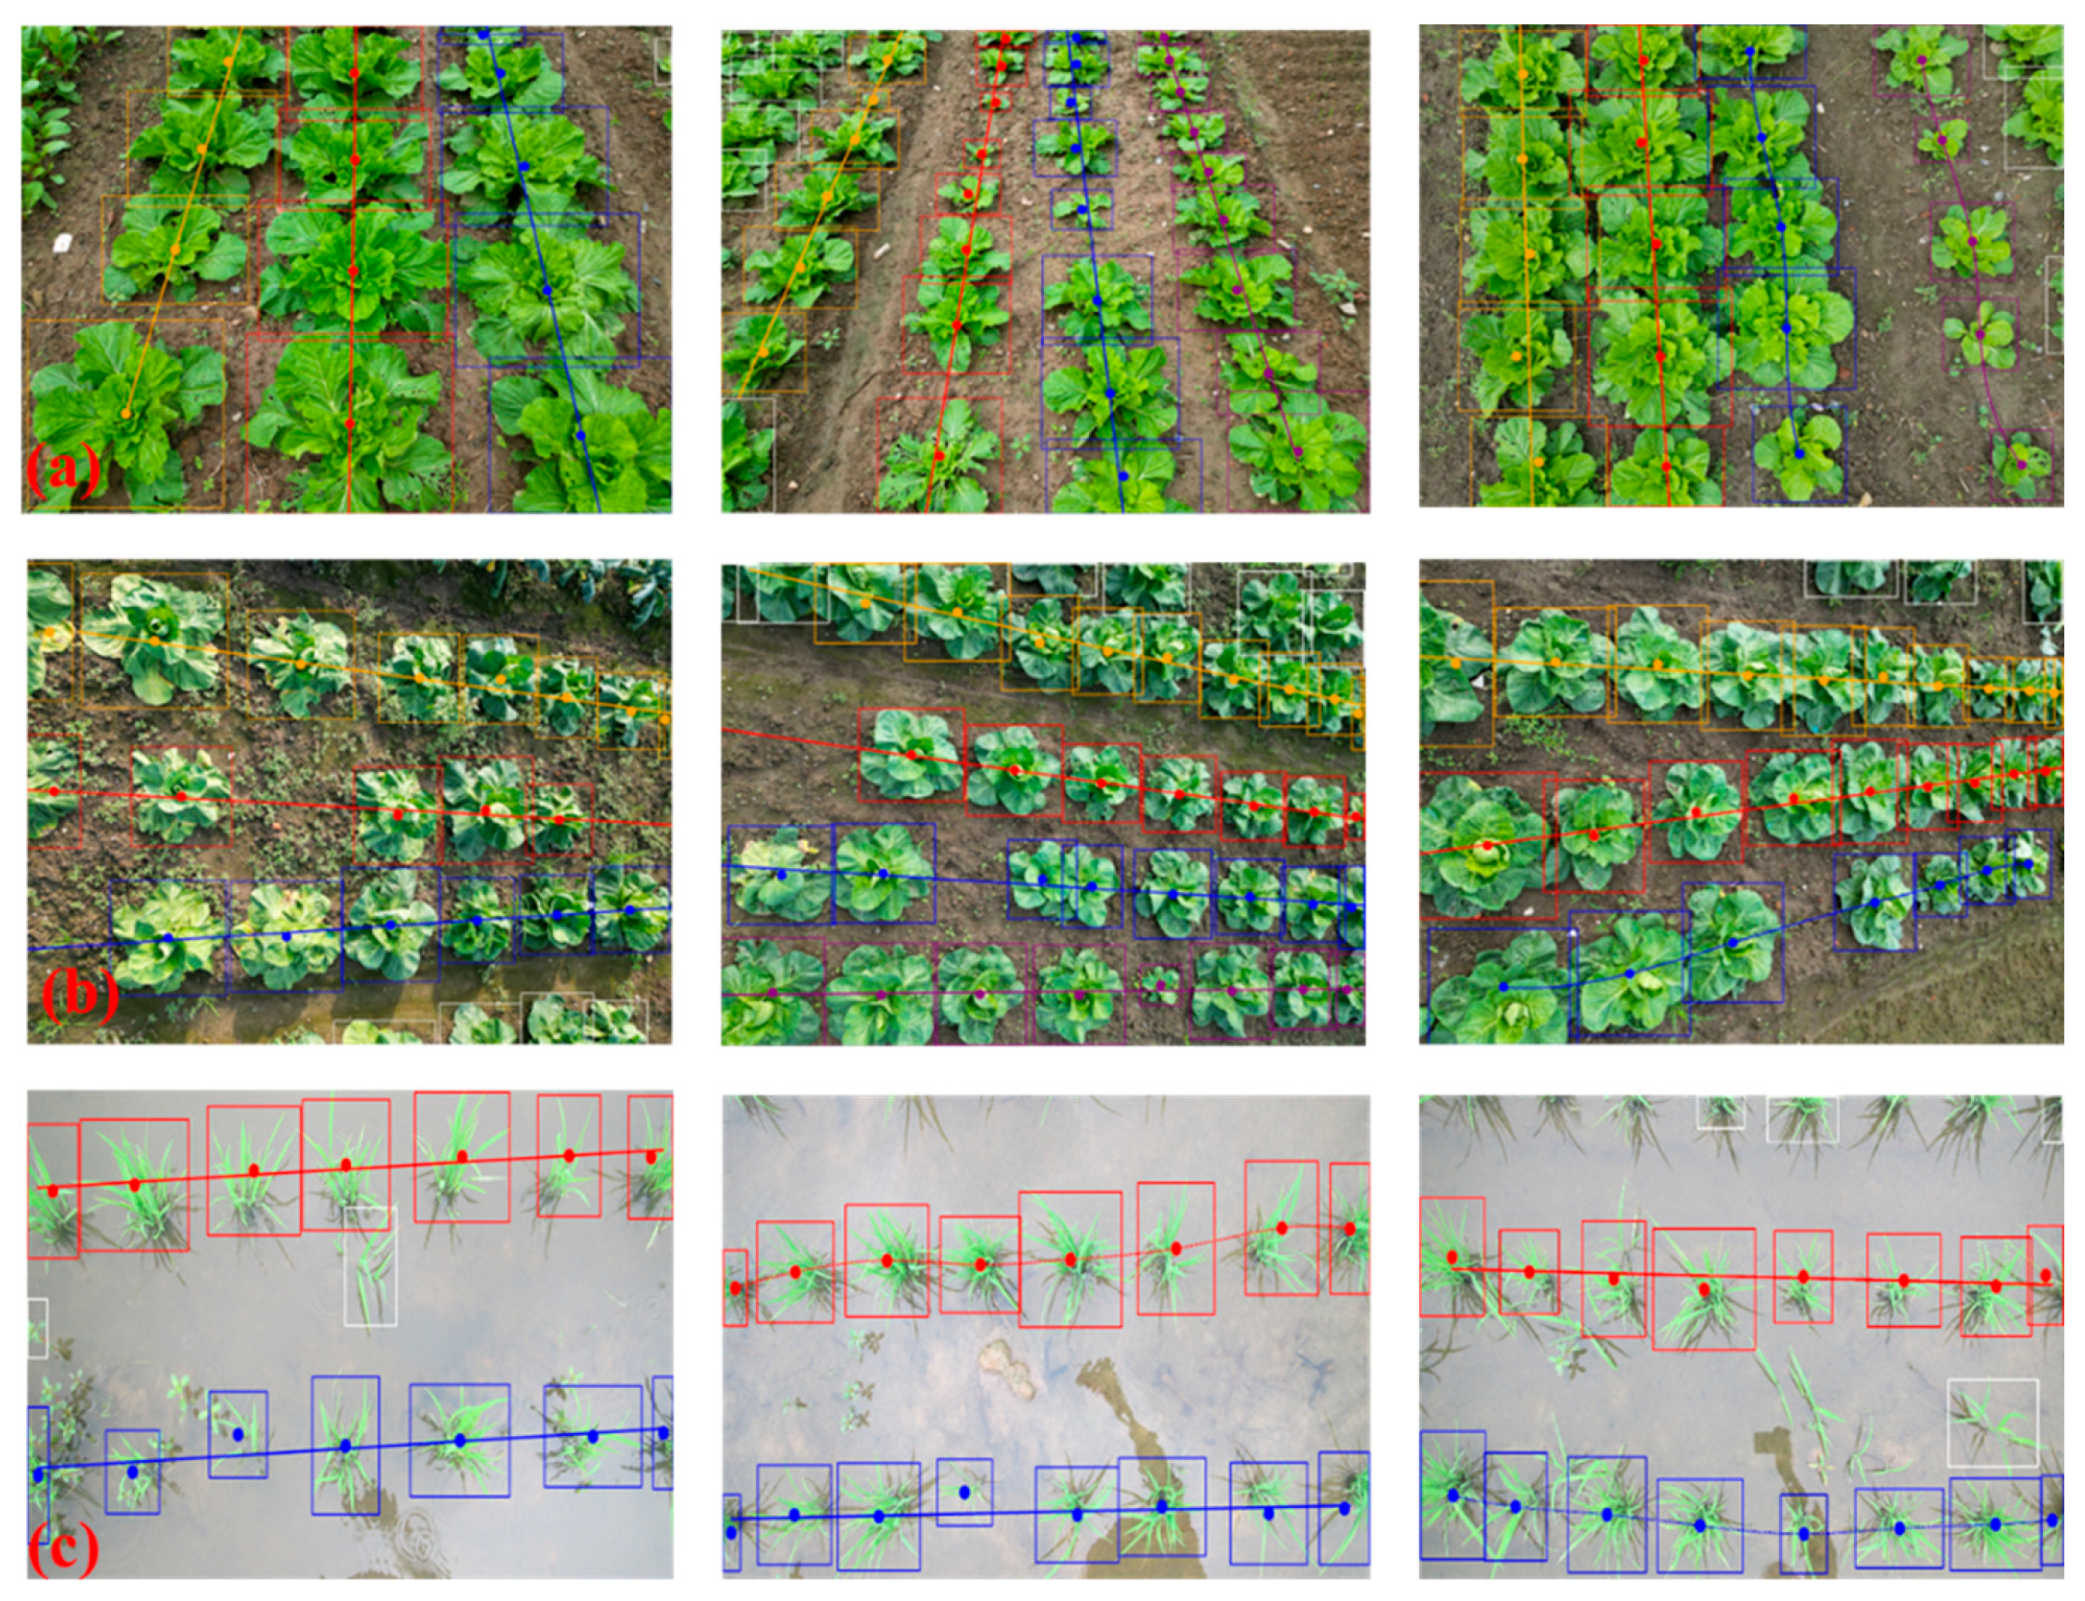
3.4. Linear and Curve Fitting for Different Crops
Finally, based on the clustering results of the threshold DBSCAN algorithm, LSM and cubic B-spline curves were used to fit straight lines and curve crop rows, respectively. In this study, straight crop rows and curved crop rows were distinguished by calculating the average angle change between crop center points. Considering that there are more crops in straight rows in the dataset, a small angle (12°) was used as the initial threshold. It was adjusted continuously according to the experimental results, and finally 17° was selected as the threshold value. The average angle between crop centers is less than 17 degrees as straight crop rows, otherwise as curved crop rows. In order to evaluate the fitting effect of the proposed combined fitting method on different crop rows in a complex field environment, 10 images of each crop are also selected, where Cabbage, Kohlrabi, and Rice crop rows have 32 rows, 34 rows, and 23 rows, respectively. Figure 15 illustrates the fitting results of LSM and cubic B-spline curves for different crop rows. According to mechanized sowing, most of the planted crop rows are straight lines, and LSM uses the square of the offset distance to fit the center of the straight crop row. As can be seen from Figure 15, all crops in each row basically fall on the line generated by the algorithm. As shown in the Kohlrabi crop in Figure 14, the row with broken crops can also be well fitted to the crop line through the adjacent crop points. This shows that the LSM algorithm has a better fitting effect on straight crop rows.
In the field environment, due to the irregularity of crop growth, in addition to straight crop rows, sometimes curved crop rows may appear. Considering that the data points used to fit the B-spline curve in the image are relatively small, 3–4 control points were added during the fitting process to obtain a more accurate and smoother curve. As shown in the third column of Figure 14, the arrangement of crops appears to be not neat enough, and the fitting effect using LSM is not good. In contrast, the use of B-splines was able to better keep all crops on the curve with much better effects. This also further demonstrates that the grouped crop row fitting method proposed in this study can be well adapted to the complex agricultural environment.
4. Discussion
The detection of multiple crops in agricultural environments often suffers from robustness and generalization problems due to differences in the type, shape, and size of crops. In this study, an improved YOLO-v8 and threshold-DBSCAN algorithm was proposed to improve the performance of multi-crop detection and crop row fitting.
In terms of multi-crop detection, the DCGA-YOLOv8 model proposed in this study shown superior detection accuracy and robustness, compared to other mainstream recognition models. The DCGA-YOLOv8 model pays more attention to the important feature areas of crops by adding global attention to suppress useless or invalid features and introduces deformable convolution in the detection process to obtain more fine-grained spatial information between crops, thereby improving the accuracy of crop detection. However, the DCGA-YOLOv8 model still has some difficulties in crop detection at image boundaries. The unclear boundaries of crops and the partial overlap between crops make it difficult to accurately label the complete area of a single crop when performing manual labeling. Therefore, the intersection ratio between the prediction box and the ground truth will be relatively small in the detection process, which will lead to detection failure. Nevertheless, DCGA-YOLOv8 has a very high recognition accuracy, and the centroid of the adjacent crop prediction box can still reflect the trend between crops, without affecting the fitting of the subsequent crop row centerline.
For clustering of crops, the distance threshold detection was introduced to exclude interfering crops before DBSCAN clustering. A high clustering accuracy was achieved for each crop, especially for Rice, where the clustering accuracy was 100%. It is worth noting that Cabbage and Kohlrabi still have crop clustering errors. This may be due to the fact that there are fuzzy boundaries or overlaps between crops in some images, and it may be difficult for the DBSCAN algorithm to accurately distinguish them. To solve this problem, the change in angle between crop centroids is taken into account in the subsequent crop row fitting. When the angle between the line connecting the crop and the previous crop center point and the vertical plane is greater than 30 degrees, the crop point is also taken as an interference point and is not involved in the crop row fitting.
It is worth noting that the datasets collected in this experiment are under low weed pressure. In agricultural environments, weeds may obscure crops, especially in the early stages of crop growth, and weeds may be very similar to crops, making it difficult for the model to accurately discriminate between them. Follow-up research will further apply the crop detection model proposed in this study to more complex environmental situations such as different weed densities and early stages of crop growth. In general, the DCGA-YOLOv8 model and threshold-DBSCAN proposed in this study can be well applied to multi-crop detection and crop row fitting in agricultural environments.
5. Conclusions
Aiming at the poor generalization and robustness of the existing navigation line extraction algorithm for multiple crops in complex farmland environment, this study proposes a new method based on improved YOLOV8 model, threshold DBSCAN clustering, least square method and B-spline curve was proposed to accurately detect multi-crops and crop rows. The specific implementations of the paper were as follows:
(1) a DCGA-YOLOv8 model was developed by introducing deformable convolution and GAM on the original YOLOv8 model for the detection of multiple crops. The F1-score and mAP value of the DCGA-YOLOv8 model for Cabbage, Kohlrabi, and Rice were 96.4%, 97.1%, 95.9% and 98.9%, 99.2%, 99.1%, respectively. The comparative test results shown that the DCGA-YOLOv8 model is superior to the original YOLOv8, YOLOv5, Faster R-CNN, and SSD methods in multi-crop detection.
(2) a distance threshold detection method was introduced to the DBSCAN algorithm to exclude some image edge points and interfering points in terms of accurate clustering and grouping of crops in different rows. The correct clustering rate for Cabbage, Kohlrabi, and Rice reached 98.9%, 97.9%, and 100%, respectively. LSM and cubic B-spline curve method successfully fit straight and curvilinear crop rows in the farmland environment.
(3) a risk optimization function of the wheel model was constructed to further improve the safety of the operation of the agricultural machinery between the crop rows.
In summary, the proposed method in this study effectively improves the safety and stability of visual navigation and field operation of agricultural machinery and provides an effective way for the accurate identification and extraction of navigation lines of various crops in the complex farmland environment. Future research will focus on extending the model to more crops to further improve the generalization ability and robustness of the model to a variety of crops. On the other hand, data augmentation techniques, transfer learning, model tuning, or other improvement strategies are applied to further improve the adaptability of the model to complex agricultural scenarios.
Author Contributions
Conceptualization, J.S.; Methodology, J.S. and B.Z.; Software, J.S. and Y.B.; Validation, J.S. and J.Z.; Formal Analysis, J.S., Y.B. and J.Z.; Investigation, J.S., J.Z. and Y.B.; Writing—Original Draft Preparation, J.S and Y.B.; Writing-Review & Editing, J.S., Y.B. and J.Z.; Project Administration, B.Z.; Funding Acquisition, B.Z. All authors have read and agreed to the published version of the manuscript.
Funding
This work was supported by the Natural Science Foundation of Jiangsu Province (Grant No. BK20231478), the Jiangsu Modern Agricultural Equipment and Technology Demonstration & Promotion Project (project No. NJ2021-60), the Jiangsu Agricultural Science and Technology Innovation Fund (JASTIF) (Grant No. CX (21) 3146), and the Fundamental Research Funds for the Central Universities (Grant No. KYLH2023002).
Institutional Review Board Statement
Not applicable.
Data Availability Statement
The data presented in this study are available on request from the corresponding author. The data are not publicly available due to the data also forms part of an ongoing study.
Acknowledgments
The author would like to thank the editors and reviewers for their comments on how to improve the quality of this work.
Conflicts of Interest
The authors declare no conflicts of interest.
References
- Carvalho, F.P. Pesticides, environment, and food safety. Food Energy Secur. 2017, 6, 48–60. [Google Scholar] [CrossRef]
- Plessen, M.G. Freeform path fitting for the minimisation of the number of transitions between headland path and interior lanes within agricultural fields. Artif. Intell. Agric. 2021, 5, 233–239. [Google Scholar] [CrossRef]
- Bai, Y.; Zhang, B.; Xu, N.; Zhou, J.; Shi, J.; Diao, Z. Vision-based navigation and guidance for agricultural autonomous vehicles and robots: A review. Comput. Electron. Agric. 2023, 205, 107584. [Google Scholar] [CrossRef]
- Xie, B.; Jin, Y.; Faheem, M.; Gao, W.; Liu, J.; Jiang, H.; Cai, L.; Li, Y. Research progress of autonomous navigation technology for multi-agricultural scenes. Comput. Electron. Agric. 2023, 211, 107963. [Google Scholar] [CrossRef]
- Jiang, W.; Quan, L.; Wei, G.; Chang, C.; Geng, T. A conceptual evaluation of a weed control method with post-damage application of herbicides: A composite intelligent intra-row weeding robot. Soil Tillage Res. 2023, 234, 105837. [Google Scholar] [CrossRef]
- Ryo, M. Explainable artificial intelligence and interpretable machine learning for agricultural data analysis. Artif. Intell. Agric. 2022, 6, 257–265. [Google Scholar] [CrossRef]
- Yang, Y.; Zhou, Y.; Yue, X.; Zhang, G.; Wen, X.; Ma, B.; Xu, L.; Chen, L. Real-time detection of crop rows in maize fields based on autonomous extraction of ROI. Expert Syst. Appl. 2023, 213, 118826. [Google Scholar] [CrossRef]
- Shi, J.; Bai, Y.; Diao, Z.; Zhou, J.; Yao, X.; Zhang, B. Row Detection BASED Navigation and Guidance for Agricultural Robots and Autonomous Vehicles in Row-Crop Fields: Methods and Applications. Agronomy 2023, 13, 1780. [Google Scholar] [CrossRef]
- Pajares, G.; García-Santillán, I.; Campos, Y.; Montalvo, M.; Guerrero, J.M.; Emmi, L.; Romeo, J.; Guijarro, M.; Gonzalez-De-Santos, P. Machine-vision systems selection for agricultural vehicles: A guide. J. Imaging 2016, 2, 34. [Google Scholar] [CrossRef]
- Dhanya, V.; Subeesh, A.; Kushwaha, N.; Vishwakarma, D.K.; Kumar, T.N.; Ritika, G.; Singh, A. Deep learning based computer vision approaches for smart agricultural applications. Artif. Intell. Agric. 2022, 6, 211–229. [Google Scholar] [CrossRef]
- Subeesh, A.; Bhole, S.; Singh, K.; Chandel, N.; Rajwade, Y.; Rao, K.; Kumar, S.; Jat, D. Deep convolutional neural network models for weed detection in polyhouse grown bell peppers. Artif. Intell. Agric. 2022, 6, 47–54. [Google Scholar] [CrossRef]
- De Silva, R.; Cielniak, G.; Wang, G.; Gao, J. Deep learning-based crop row detection for infield navigation of agri-robots. J. Field Robot. 2023, 32, 162–175. [Google Scholar] [CrossRef]
- Ronneberger, O.; Fischer, P.; Brox, T. U-net: Convolutional networks for biomedical image segmentation. In Medical Image Computing and Computer-Assisted Intervention–MICCAI 2015: 18th International Conference, Munich, Germany, 5–9 October 2015, Proceedings, Part III 18; Springer International Publishing: Cham, Switzerland, 2015; pp. 234–241. [Google Scholar]
- Li, X.; Su, J.; Yue, Z.; Duan, F. Adaptive multi-ROI agricultural robot navigation line extraction based on image semantic segmentation. Sensors 2022, 22, 7707. [Google Scholar] [CrossRef] [PubMed]
- Yang, R.; Zhai, Y.; Zhang, J.; Zhang, H.; Tian, G.; Zhang, J.; Huang, P.; Li, L. Potato visual navigation line detection based on deep learning and feature midpoint adaptation. Agriculture 2022, 12, 1363. [Google Scholar] [CrossRef]
- Diao, Z.; Guo, P.; Zhang, B.; Zhang, D.; Yan, J.; He, Z.; Zhao, S.; Zhao, C. Maize crop row recognition algorithm based on improved UNet network. Comput. Electron. Agric. 2023, 210, 107940. [Google Scholar] [CrossRef]
- Ponnambalam, V.R.; Bakken, M.; Moore, R.J.D.; Gjevestad, J.G.O.; From, P.J. Autonomous crop row guidance using adaptive multi-roi in strawberry fields. Sensors 2020, 20, 5249. [Google Scholar] [CrossRef]
- Pang, Y.; Shi, Y.; Gao, S.; Jiang, F.; Veeranampalayam-Sivakumar, A.-N.; Thompson, L.; Luck, J.; Liu, C. Improved crop row detection with deep neural network for early-season maize stand count in UAV imagery. Comput. Electron. Agric. 2020, 178, 105766. [Google Scholar] [CrossRef]
- You, J.; Liu, W.; Lee, J. A DNN-based semantic segmentation for detecting weed and crop. Comput. Electron. Agric. 2020, 178, 105750. [Google Scholar] [CrossRef]
- Cao, M.; Tang, F.; Ji, P.; Ma, F. Improved real-time semantic segmentation network model for crop vision navigation line detection. Front. Plant Sci. 2022, 13, 898131. [Google Scholar] [CrossRef]
- Khan, S.; Tufail, M.; Khan, M.T.; Khan, Z.A.; Anwar, S. Deep learning-based identification system of weeds and crops in strawberry and pea fields for a precision agriculture sprayer. Precis. Agric. 2021, 22, 1711–1727. [Google Scholar] [CrossRef]
- Wang, S.; Yu, S.; Zhang, W.; Wang, X.; Li, J. The seedling line extraction of automatic weeding machinery in paddy field. Comput. Electron. Agric. 2023, 205, 107648. [Google Scholar] [CrossRef]
- Diao, Z.; Guo, P.; Zhang, B.; Zhang, D.; Yan, J.; He, Z.; Zhao, S.; Zhao, C.; Zhang, J. Navigation line extraction algorithm for corn spraying robot based on improved YOLOv8s network. Comput. Electron. Agric. 2023, 212, 108049. [Google Scholar] [CrossRef]
- García-Santillán, I.; Guerrero, J.M.; Montalvo, M.; Pajares, G. Curved and straight crop row detection by accumulation of green pixels from images in maize fields. Precis. Agric. 2018, 19, 18–41. [Google Scholar] [CrossRef]
- Liu, F.; Yang, Y.; Zeng, Y.; Liu, Z. Bending diagnosis of rice seedling lines and guidance line extraction of automatic weeding equipment in paddy field. Mech. Syst. Signal Process. 2020, 142, 106791. [Google Scholar] [CrossRef]
- Yadav, P.K.; Thomasson, J.A.; Searcy, S.W.; Hardin, R.G.; Braga-Neto, U.; Popescu, S.C.; Martin, D.E.; Rodriguez, R.; Meza, K.; Enciso, J.; et al. Assessing the performance of YOLOv5 algorithm for detecting volunteer cotton plants in corn fields at three different growth stages. Artif. Intell. Agric. 2022, 6, 292–303. [Google Scholar] [CrossRef]
- He, K.; Zhang, X.; Ren, S.; Sun, J. Spatial pyramid pooling in deep convolutional networks for visual recognition. IEEE Trans. Pattern Anal. Mach. Intell. 2015, 37, 1904–1916. [Google Scholar] [CrossRef] [PubMed]
- Wang, C.Y.; Bochkovskiy, A.; Liao, H.Y.M. YOLOv7: Trainable bag-of-freebies sets new state-of-the-art for real-time object detectors. In Proceedings of the IEEE/CVF Conference on Computer Vision and Pattern Recognition, Vancouver, BC, Canada, 18–22 June 2023; pp. 7464–7475. [Google Scholar]
- Liu, S.; Qi, L.; Qin, H.; Shi, J.; Jia, J. Path aggregation network for instance segmentation. In Proceedings of the IEEE Conference on Computer Vision and Pattern Recognition, Salt Lake City, UT, USA, 18–23 June 2018; pp. 8759–8768. [Google Scholar]
- Lin, T.Y.; Dollár, P.; Girshick, R.; He, K.; Hariharan, B.; Belongie, S. Feature pyramid networks for object detection. In Proceedings of the IEEE Conference on Computer Vision and Pattern Recognition, Honolulu, HI, USA, 21–26 July 2017; pp. 2117–2125. [Google Scholar]
- Wen, C.; Guo, H.; Li, J.; Hou, B.; Huang, Y.; Li, K.; Nong, H.; Long, X.; Lu, Y. Application of improved YOLOv7-based sugarcane stem node recognition algorithm in complex environments. Front. Plant Sci. 2023, 14, 1230517. [Google Scholar] [CrossRef]
- Sun, Q.; Zhang, X.; Li, Y.; Wang, J. YOLOv5-OCDS: An Improved Garbage Detection Model Based on YOLOv5. Electronics 2023, 12, 3403. [Google Scholar] [CrossRef]
- Dai, J.; Qi, H.; Xiong, Y.; Li, Y.; Zhang, G.; Hu, H.; Wei, Y. Deformable convolutional networks. In Proceedings of the IEEE International Conference on Computer Vision, Venice, Italy, 22–29 October 2017; pp. 764–773. [Google Scholar]
- Zhu, X.; Hu, H.; Lin, S.; Dai, J. Deformable convnets v2: More deformable, better results. In Proceedings of the IEEE/CVF Conference on Computer Vision and Pattern Recognition, Long Beach, CA, USA, 15–20 June 2019; pp. 9308–9316. [Google Scholar]
- Wang, T.; Xu, X.; Wang, C.; Li, Z.; Li, D. From smart farming towards unmanned farms: A new mode of agricultural production. Agriculture 2021, 11, 145. [Google Scholar] [CrossRef]
- Guo, X.; Zhou, H.; Su, J.; Hao, X.; Tang, Z.; Diao, L.; Li, L. Chinese agricultural diseases and pests named entity recognition with multi-scale local context features and self-attention mechanism. Comput. Electron. Agric. 2020, 179, 105830. [Google Scholar] [CrossRef]
- Wu, L.; Wang, H.; Zhang, T. A multiscale 3D convolution with context attention network for hyperspectral image classification. Earth Sci. Informatics 2022, 15, 2553–2569. [Google Scholar] [CrossRef]
- Cheng, W.; Ma, T.; Wang, X.; Wang, G. Anomaly detection for internet of things time series data using generative adversarial networks with attention mechanism in smart agriculture. Front. Plant Sci. 2022, 13, 890563. [Google Scholar] [CrossRef] [PubMed]
- Zhao, S.; Liu, J.; Bai, Z.; Hu, C.; Jin, Y. Crop pest recognition in real agricultural environment using convolutional neural networks by a parallel attention mechanism. Front. Plant Sci. 2022, 13, 839572. [Google Scholar] [CrossRef] [PubMed]
- Qi, J.; Liu, X.; Liu, K.; Xu, F.; Guo, H.; Tian, X.; Li, M.; Bao, Z.; Li, Y. An improved YOLOv5 model based on visual attention mechanism: Application to recognition of tomato virus disease. Comput. Electron. Agric. 2022, 194, 106780. [Google Scholar] [CrossRef]
- Liu, Y.; Shao, Z.; Hoffmann, N. Global attention mechanism: Retain information to enhance channel-spatial interactions. arXiv 2021, arXiv:2112.05561. [Google Scholar]
- Zhang, X.; Li, X.; Zhang, B.; Zhou, J.; Tian, G.; Xiong, Y.; Gu, B. Automated robust crop-row detection in maize fields based on position clustering algorithm and shortest path method. Comput. Electron. Agric. 2018, 154, 165–175. [Google Scholar] [CrossRef]
- Li, D.; Li, B.; Long, S.; Feng, H.; Xi, T.; Kang, S.; Wang, J. Rice seedling row detection based on morphological anchor points of rice stems. Biosyst. Eng. 2023, 226, 71–85. [Google Scholar] [CrossRef]
- Ester, M.; Kriegel, H.P.; Sander, J.; Xu, X. A density-based algorithm for discovering clusters in large spatial databases with noise. In Proceedings of the Second International Conference on Knowledge Discovery and Data Mining (KDD-96), Portland, OR, USA, 2–4 August 1996; pp. 226–231. [Google Scholar]
- Winterhalter, W.; Fleckenstein, F.V.; Dornhege, C.; Burgard, W. Crop row detection on tiny plants with the pattern hough transform. IEEE Robot. Autom. Lett. 2018, 3, 3394–3401. [Google Scholar] [CrossRef]
- Liu, X.; Qi, J.; Zhang, W.; Bao, Z.; Wang, K.; Li, N. Recognition method of maize crop rows at the seedling stage based on MS-ERFNet model. Comput. Electron. Agric. 2023, 211, 107964. [Google Scholar] [CrossRef]
- Gordon, W.J.; Riesenfeld, R.F. B-spline curves and surfaces. In Computer Aided Geometric Design; Academic Press: Cambridge, MA, USA, 1974; pp. 95–126. [Google Scholar]
Figure 1.
Representative multi-crop rows.

Figure 2.
The network structure of YOLOv8.

Figure 3.
The network structure of DCGA-YOLOv8.

Figure 4.
The detailed structure of DC.

Figure 5.
The structure of the C2f-DCN network.

Figure 6.
The overall structure of GAM module.

Figure 7.
Extraction of the center lines of the crop rows: (a) crop position calculation; (b) crop position cluster analysis; (c) fitting of straight crop rows; (d) fitting of curved crop rows.
Figure 7.
Extraction of the center lines of the crop rows: (a) crop position calculation; (b) crop position cluster analysis; (c) fitting of straight crop rows; (d) fitting of curved crop rows.

Figure 8.
The schematic diagram of the relationship between the crop row and the motion wheel of the farm machine.
Figure 8.
The schematic diagram of the relationship between the crop row and the motion wheel of the farm machine.

Figure 9.
Framework of the proposed multi-crop row detection method.

Figure 10.
The performance of different models during training process: (a) the changes of loss during training process; (b) the changes of [email protected] values during training process.
Figure 10.
The performance of different models during training process: (a) the changes of loss during training process; (b) the changes of [email protected] values during training process.

Figure 11.
Comparative performance of YOLO-V8 and DCGA-YOLOv8 Networks for Multi-Crop Detection.

Figure 12.
Heatmaps visualizations of YOLOV8 and DCGA-YOLOv8. (a) Cabbage; (b) Kohlrabi; (c) Rice.

Figure 13.
Detection results visualizations of YOLOV8 and DCGA-YOLOv8: (a) Cabbage; (b) Kohlrabi; (c) Rice.
Figure 13.
Detection results visualizations of YOLOV8 and DCGA-YOLOv8: (a) Cabbage; (b) Kohlrabi; (c) Rice.

Figure 14.
Clustering results of different crop rows based on threshold-DBSCAN algorithm: (a) Cabbage; (b) Kohlrabi; (c) Rice.
Figure 14.
Clustering results of different crop rows based on threshold-DBSCAN algorithm: (a) Cabbage; (b) Kohlrabi; (c) Rice.

Figure 15.
Fitting results of LSM and cubic B-spline curves for different crop rows: (a) Cabbage; (b) Kohlrabi; (c) Rice.
Figure 15.
Fitting results of LSM and cubic B-spline curves for different crop rows: (a) Cabbage; (b) Kohlrabi; (c) Rice.


Table 1.
The overall crop detection results of different models.
| Network | Precision (%) | Recall (%) | F1-Score (%) | [email protected] (%) |
|---|---|---|---|---|
| DCGA-YOLOv8 | 97.1 | 95.9 | 96.5 | 99.1 |
| YOLO-v8 | 94.2 | 95.7 | 94.9 | 97.8 |
| YOLO-v5 | 94.0 | 95.4 | 94.7 | 97.6 |
| SSD | 82.9 | 90.4 | 87.0 | 93.1 |
| Faster R-CNN | 73.1 | 98.5 | 84.0 | 93.6 |
Table 2.
Detection results of models on different crops.
| Model | Index | Cabbage | Kohlrabi | Rice |
|---|---|---|---|---|
| YOLO-v8 | Precision (%) | 96.1 | 91.6 | 95.0 |
| Recall (%) | 94.6 | 97.0 | 95.4 | |
| F1-score (%) | 95.3 | 94.2 | 95.2 | |
| [email protected] (%) | 97.9 | 97.5 | 98 | |
| DCGA-YOLOv8 | Precision (%) | 98.2 | 97.6 | 95.3 |
| Recall (%) | 94.6 | 96.5 | 96.5 | |
| F1-score (%) | 96.4 | 97.1 | 95.9 | |
| [email protected] (%) | 98.9 | 99.2 | 99.1 |
Table 3.
Clustering results of different crop rows based on threshold-DBSCAN algorithm.
| Crops | Number | Interference Points | Number of Correct Clusters | Accuracy |
|---|---|---|---|---|
| Cabbage | 205 | 21 | 182 | 98.9% |
| kohlrabi | 214 | 23 | 187 | 97.9% |
| Rice | 119 | 13 | 106 | 100% |
Disclaimer/Publisher’s Note: The statements, opinions and data contained in all publications are solely those of the individual author(s) and contributor(s) and not of MDPI and/or the editor(s). MDPI and/or the editor(s) disclaim responsibility for any injury to people or property resulting from any ideas, methods, instructions or products referred to in the content. |
© 2023 by the authors. Licensee MDPI, Basel, Switzerland. This article is an open access article distributed under the terms and conditions of the Creative Commons Attribution (CC BY) license (https://creativecommons.org/licenses/by/4.0/).
Share and Cite
MDPI and ACS Style
Shi, J.; Bai, Y.; Zhou, J.; Zhang, B. Multi-Crop Navigation Line Extraction Based on Improved YOLO-v8 and Threshold-DBSCAN under Complex Agricultural Environments. Agriculture 2024, 14, 45. https://doi.org/10.3390/agriculture14010045
AMA Style
Shi J, Bai Y, Zhou J, Zhang B. Multi-Crop Navigation Line Extraction Based on Improved YOLO-v8 and Threshold-DBSCAN under Complex Agricultural Environments. Agriculture. 2024; 14(1):45. https://doi.org/10.3390/agriculture14010045
Chicago/Turabian StyleShi, Jiayou, Yuhao Bai, Jun Zhou, and Baohua Zhang. 2024. "Multi-Crop Navigation Line Extraction Based on Improved YOLO-v8 and Threshold-DBSCAN under Complex Agricultural Environments" Agriculture 14, no. 1: 45. https://doi.org/10.3390/agriculture14010045
Note that from the first issue of 2016, this journal uses article numbers instead of page numbers. See further details here.