Article

Analysis of the Interaction Mechanism between Preharvest Threshing Device and Rice at Harvesting Period Based on DEM Simulations and Bench Tests

College of Engineering, Northeast Agricultural University, Harbin 150030, China
*
Author to whom correspondence should be addressed.
Agriculture 2024, 14(2), 183; https://doi.org/10.3390/agriculture14020183
Submission received: 22 December 2023 / Revised: 19 January 2024 / Accepted: 23 January 2024 / Published: 25 January 2024

Abstract

:
Preharvest threshing is a harvesting method that focuses on collecting rice grains while leaving the rice straw unharvested. Investigating the interaction mechanism between the machine and rice during the operation process and its correlation with harvest losses is crucial for enhancing harvest quality. In this study, structural design and operational mechanism analysis of the combs was conducted through theoretical analysis. By extracting the relevant parameters of rice plants, a model of entire-plant rice during the harvesting period was established based on the discrete element method (DEM). Numerical simulation studies were conducted to clarify the interaction mechanism between the machinery and rice at different operating stages and under various operating parameters, as well as the impact of this interaction on operational quality. The simulation results revealed that various operating parameters had a significant impact on the sliding-cut effect between the combs and rice. A higher cylinder rotation speed enhanced the effect, whereas increased forward velocity hampered it. Additionally, the effect initially improved and then decreased with a higher threshing height. In the bench test, high-speed cameras were used to verify and further analyze the comb–rice interaction mechanism and explore the optimal working parameter combination. The results showed that at a rotation speed of 616 r/min, a forward velocity of 0.91 m/s, and a threshing height of 792 mm, the grain loss rate was 1.997%, and the impurity rate was 4.073%. The harvesting losses were effectively reduced, validating the effectiveness of the study on the interaction between the machinery and rice.

Graphical Abstract

1. Introduction

Rice serves as the predominant source of sustenance for almost half of the global population, and Asia contributes 90% of both global rice production and consumption [1,2,3,4]. China holds the top position in rice production and yield per unit area, with rice accounting for more than 65% of the total food grain consumption [5]. The mechanized harvesting of rice is extensively utilized in China’s rice producing regions and serves as the primary method for rice harvesting [6,7]. However, the significant amount of rice losses incurred during the mechanized harvesting process each year has a negative impact on the further improvement of rice yields [8]. Therefore, reducing losses during mechanized harvesting is of critical significance for maintaining food security and promoting sustainable economic development [9].
The mechanical harvesting method for rice can be categorized as full-feeding combined harvesting, semi-feeding combined harvesting, and preharvest threshing combined harvesting. Compared to traditional harvesting methods, preharvest threshing combined harvesting exhibits several advantages: (a) it has a high operating efficiency and low power consumption [10]; (b) it effectively reduces entrainment losses and separation losses during harvesting [11]; and (c) the intact rice straw can be kept standing upright in the field, increasing the straw yield for subsequent utilization and enhancing economic efficiency [12].
Many scholars have conducted substantial research analyzing the mechanism, enhancing the design of the structure, and optimizing the preharvest threshing harvesting device. Wilkins et al. [13] conducted a field test using a trial preharvest threshing device to examine the influence of operational parameters, such as the forward velocity, on harvesting losses. In [14], Siemens et al. optimized the design of the structural variables of threshing combs without altering the overall structure of the preharvest threshing device, which led to a measurable reduction in harvesting losses. Tang et al. [15] conducted bench tests on a preharvest threshing device, utilizing a high-speed imaging device to observe and investigate the process and mechanism of rice grain throwing and its distribution characteristics. Wang et al. [16] designed a new comb based on bionic and 3D printing technology and optimized the design of the structural parameters through bench tests. However, there were issues such as inadequate strength and a complicated structure. These studies primarily revolved around the analysis of the operational mechanisms and loss patterns during the operation of preharvest threshing harvesting devices. However, the combs with improved design still face the issue of significant residual losses, which hinders the implementation and promotion of the preharvest threshing device. There is a pressing need to devise and optimize a novel comb. At present, there is no research on the interaction mechanism between rice and combs, mainly due to factors such as machinery and equipment obstruction.
In recent years, to address the challenge of the short rice harvesting period and the inability to conduct tests during the non-harvesting period, bonded particle modeling based on the discrete element method has been increasingly applied to numerical simulations within the domain of agricultural machinery [17]. In [18], Wang and Mao et al. utilized the discrete element method (DEM) to construct a flexible model of the rice stem and conducted vibration response simulation experiments to verify its feasibility. In [19], Wang, Mao and Li et al. utilized the bonded particle model (BPM) to construct a model of a flexible entire-plant rice. However, there are still variations in the posture and planting density compared to actual field conditions. In [20], Jia et al. established discrete element models for rice grains and stem stalks, and then proceeded to calibrate and validate the contact parameters of the models. In [21], Liu et al. used the constructed discrete element flexible stalk model to investigate the impact of different threshing gaps on rice straw damage and conducted bench tests to validate the results. Xu et al. [22] conducted measurements and calibrations of the key mechanical parameters, which they then used to construct an entire rice plant model using the discrete element method. The studies mentioned above highlight that the discrete element method can successfully simulate and reproduce the interactive mechanisms between agricultural machinery and crops, yielding reliable experimental data. However, the discrete element models of rice constructed in the aforementioned studies have not accurately simulated the actual posture and planting density of rice during the harvesting period, indicating the need for further improvements.
In this study, the combs of the preharvest threshing device were optimized to address the issue of excessive residual losses. Plane combs were optimized into three-dimensional combs, and a theoretical analysis and adaptive design of the comb’s curvature were conducted based on the sliding-cut principle. A discrete element model was constructed to accurately represent the entire-plant rice plant during the harvesting period. On this basis, numerical simulation and analysis were conducted to clarify and validate the interaction mechanisms between the components and rice. Bench tests were undertaken to investigate the impact of the various working parameters of the preharvest threshing device on the quality of the harvest. Through optimization tests, the optimal working parameter combination for the preharvest threshing device was identified.

2. Materials and Methods

2.1. Structure and Working Principle of the Preharvest Threshing Device

2.1.1. Overall Structure and Working Principles

The preharvest threshing device predominantly consists of a crop gathering nose, shield, threshing header (including the threshing cylinder and combs), and other components. The crop gathering nose is located at the front of the device, with the purpose of bending the rice to facilitate feeding it into the mechanism. The shield covers the entire threshing header, providing guidance for the movement of rice grains as they are combed and threshed around the header. The threshing combs are the core threshing element of the preharvest threshing device through rotating and striking to detach the rice grains from the plant and propel them backward for collection.
During the entire operational process, the following types of loss may occur: (a) Some rice grains, upon entering the header, may experience collisions with the shield or the threshing combs due to angle and orientation issues, causing them to fall out of the header and preventing them from entering subsequent processes. This loss is called the splash loss; (b) After rice grains have been threshed, during the process of being propelled backward, they may experience collisions with other rice grains, resulting in slow velocity. Consequently, these grains are carried out of the header by the rotating cylinder without being successfully collected. This loss is called the return loss; and (c) Following the pressing down of rice earheads by the crop gathering nose, and subsequent rebound, some rice grains fail to enter the working area of the threshing combs, resulting in them not being combed and threshed off the rice plant. Both situations a and b can result in rice grains falling to the ground and being unable to be successfully collected. As a result, we have merged the splash loss and return loss into a single definition referred to as the “falling loss”. Situation c can lead to rice grains remaining on the earheads without being successfully harvested. We define this type of operational loss as residual loss. The overall structure of the preharvest threshing device, field operational mechanism, and characteristics of each loss are illustrated in Figure 1a.
In this study, an innovative structural design of threshing combs that can achieve bias and sliding-cut effects on rice is proposed, as illustrated in Figure 1b. According to their different functions, the comb can be divided into three zones: the offset flattening zone, the sliding-cut threshing zone, and the straight-cut threshing zone. The contour edges of both the sliding-cut threshing zone and the straight-cut threshing zone were chamfered to enhance their sharpness, enabling a more efficient and rapid cutting of rice grains. The working principle of the threshing combs is as follows: When the rice enters the working area of the threshing cylinder, it initially interacts with the components of the offset pressing area (comprising the offset baffles and curved edges), causing it to tilt and deviate towards the direction of the sliding-cut threshing area. Subsequently, the rice plants enter the sliding-cut threshing zone, where the rice stems and earheads undergo a sliding-cut motion on the sharp edges. Sliding cut refers to the simultaneous cutting of rice while it slides relative to the edge curve, a method that boasts advantages such as a low cutting force and a high cutting efficiency [23]. During the continuous sliding-cutting process in this zone, a significant portion of the rice grains and earheads are separated from the rice plants. The few remaining rice grains and earheads then enter the straight-cut threshing zone, where the residual grains not yet detached by sliding cuts are cut off through straight cutting.

2.1.2. Structure Design and Theoretical Analysis

In the process of the harvesting operations, the threshing combs come into direct contact with the rice plants, serving as the critical component for achieving rice threshing. This study optimized the original plane comb with a function-oriented approach, introducing the efficient sliding-cutting into the comb design, which led to the design of an innovative comb that enables the offsetting and sliding-cutting of rice during the threshing process. The comparison in structure and size between the original plane comb and the offset sliding-cut comb is presented in Figure 1c. The baffle structure of the offset flattening zone and the contour design of the sliding-cut threshing zone are crucial for achieving the offsetting and sliding-cut threshing effectiveness of the combs on rice earheads. To achieve the efficient and low-power sliding-cut of rice earheads by the combs, this study selects the exponential function model for the design of the cutting-edge curve. The cutting-edge curve is shown in Figure 2, and the mathematical formulation of the curve is shown in Equation (1).
y = e cot α A cot α B / b x
From Equation (1), it can be concluded that the contour shape of the curve edge is defined by the initial sliding-cut angle αA, the final sliding-cut angle αB, and the threshing comb’s length H. Referring to the structural dimensions of the original plane combs, we set H and S to 90 mm and 45 mm, respectively. To investigate the correlation between the sliding-cut angle of the curve edge and the performance of sliding-cut, and to determine the range of sliding-cut angles, it is necessary to analyze the forces acting on the edge curve in Figure 3:
F z + F c + F n cos α + F f sin α = F d F n sin α = F f cos α
where
F f = μ F n
According to Equations (1) and (2), we can obtain the following:
α = arctan μ
F z = F d F c F n μ 2 + 1 sin α + ε
According to the relevant studies [24], the edge curve exhibits sliding-cut effectiveness only when the initial sliding-cut angle αA > φ (where φ is the friction angle between the edge curve material and the rice stem, and φ = 30°). Hence, this study sets αA = 30°. As shown in Figure 3, starting from point A, the initial point of the edge curve, the sliding-cut angle at each point on the edge curve AB gradually decreases. From Equation (5), it is evident that when α < 30°, a larger sliding-cut angle leads to low resistance in the sliding-cut process. In summary, the initial sliding-cut angle αA = 30°, and the final sliding-cut angle αB = 60°.

2.2. Establishment of the Discrete Element Model for Rice

2.2.1. Parameters of the Rice Model

(1)
Biometric parameters in simulation
With the gradual maturation of rice, the weight of the grains steadily increases. Under the influence of gravity, the earheads of rice induce the bending of the rice stems and earheads towards the ground, which is a typical physiological characteristic of rice [25]. Currently, some studies on rice harvesting [26] have established discrete element models for entire rice plants. However, due to the difficulty of modeling, the rice stems and earheads are usually assumed to be in an upright state, which is different from the actual morphology of rice in reality. To accurately replicate the conditions during rice harvesting, the extraction of biometric indices of rice during the harvesting period is crucial. Longjing-29 rice is extensively cultivated in the Heilongjiang region and is widely representative. Therefore, it was selected as the sample for model construction and parameter measurement in this study. On 21 September 2023, rice samples in good condition and free from diseases and pests were collected from farmland in Acheng District, Harbin, Heilongjiang Province (45°68′ N, 126°94′ E), China, for the extraction of biometric indices. The method was as follows: rice plants were cut at the roots in the field and laid flat on grid paper with dimensions of 2.5 mm × 2.5 mm. High-resolution digital cameras were used to capture orthographic images. The images were imported into Photoshop software (2021, Adobe Inc., San Jose, CA, USA), where an accurate proportional relationship between the background grid and the image pixels was established. Subsequently, precise statistics were conducted separately for the stem length and earhead length of 50 rice plants. Measurements were taken for the outer diameter of rice stems, branches, and grain stalks separately utilizing a caliper. The rice stems and rice branches were coordinately processed, and then Matlab software (R2022a, MathWorks Inc., Natick, MA, USA) was used to fit the statistical results. Finally, the equations describing the natural physiological curvature of the rice stems and substems were obtained. The overall process is shown in Figure 4a.
(2)
Mechanical properties in simulation
The relevant parameters of the entire-plant rice discrete element model were acquired through reference to the relevant literature or further calculated based on the available data. The specific values are outlined in Table S1 [15,20,22,27,28].

2.2.2. Establishment of Entire-Plant Rice Model

To explore the overall operational effect of preharvest threshing and the threshing mechanism, it is essential to accurately simulate the threshing process and its effects on rice plants under the action of the machinery. Therefore, an entire-plant rice discrete element model was established for simulation. To simplify the model and improve the modeling efficiency and simulation speed, the hollow features of the rice stems were simplified to solid features. Additionally, in the modeling process, small branches were disregarded. Only the main-stem, substem, and associated rachises and grains were taken into consideration. Based on the previously measured rice grain size parameters of the selected rice variety, a rice grain model was constructed through the sphere assembly method [29].
Building the discrete element model of the entire-plant rice relied on three-dimensional measurements of rice plants, as described in Section 2.2.1, and the extracted physiological curves as the foundational data. The rice stem and substem particles were uniformly distributed along their respective bionic curves, while the rice rachises and grains were subsequently distributed along the substems. Since the rice model could not stand upright on the ground by itself, a soil particle was introduced as a connecting medium between the rice plant and the ground. After constructing the numerical model for rice during the harvesting period, we extracted the spatial coordinates, angles, and other positional information for all particles in the model. Then, all the types of particles and their corresponding positional information were input into the metaparticle setting panel in EDEM software (2022.3, Altair Engineering Inc., Troy, MI, USA). To achieve a state of equilibrium under the combined influence of forces like gravity and cohesion, a five-second simulation was carried out for the constructed model. Finally, the entire-plant rice discrete element model during the harvesting period was obtained, as shown in Figure 4b.

2.3. Preharvest Threshing Operation Test

2.3.1. Preharvest Threshing Operation Simulation Test

With the assistance of the computer-aided design software SolidWorks (2021, Dassault System Corporation, IDF France, France) and the numerical simulation software EDEM (2022.3, Altair Engineering Inc., Troy, MI, USA), a simulation model was developed to replicate the dimensions of the preharvest threshing test bench. The bench test model was composed of several parts including the crop gathering nose, shield, threshing cylinder, sliding-cut combs, collection box, and ground. The rice plant model stands upright on the ground, supported by soil particles, to simulate the plant’s upright position in the field. Each row had four clusters of rice, and each cluster of rice consisted of five rice models. The distance between rice clusters was determined according to the actual rice planting density. The row spacing of rice was 300 mm, and the distance between adjacent rice plants within a cluster was 75 mm. Within the simulation calculation domain, there were 32 clusters of rice, comprising a total of 160 rice plant models. The whole simulation environment is presented in Figure 5. After completing the preparation for the simulation test, gravity was applied. At the same time, the device moved at a constant velocity, and the threshing cylinder began rotating with a consistent speed, initiating the simulation test for the harvesting process. The simulation tests were conducted on a high-performance workstation equipped with two Intel (R) Xeon (R) CPU E5-2680V4 @ 2.40 GHz CPUs and 128 GB of RAM to run the commercial software EDEM (2022.3, Altair Engineering Inc., Troy, MI, USA) for simulation tests. The simulation step was configured to 7.5% of the Rayleigh time step and the minimum size of the cell was configured as 3.5 R.

2.3.2. Preharvest Threshing Operation Bench Test

In September 2023, bench tests were conducted at the engineering training center of Northeast Agricultural University in Harbin, Heilongjiang Province (45°74′ N, 126°73′ E). The overall configuration of the bench test is illustrated in Figure 6a. The main instruments and equipment used predominantly comprised a laptop computer, fan, frequency converter control cabinet, trolley, crop gathering nose, threshing cylinder, sliding-cutting comb, supporting frame, driving motor, lighting strip, acrylic organic glass, vertical collection device, horizontal collection device, high-speed imaging device, data transfer cable, etc. The test bench for the preharvest threshing device was secured to the supporting frame. Through adjusting the relative position between the device and the supporting frame, the threshing height during operation can be controlled. Through belt transmission, a 380 V electric motor propelled the rotation of the threshing cylinder. The rice clamping devices were mounted on the platform, which was situated on a trolley moving at a constant speed. The frequency converter control cabinet facilitated the regulation of the threshing cylinder’s rotation speed and the velocity of the trolley. An acrylic transparent panel was installed on the outside of the device to facilitate observation of the state and the composition of the threshing materials and the material during operation, as well as for image recording. The PCO Dimax CS1 high-speed imaging device (PCO Company, Kelheim, Bayern, Germany) was connected to a laptop computer using a data transfer cable, allowing for high-speed video recording. The density of rice loaded on the rice clamping devices conformed to the factual field growth condition as well as the planting density in the simulation test. Three key working parameters of preharvest threshing were selected as test factors: the forward velocity, rotation speed, and threshing height. The ‘forward velocity’ refers to the horizontal relative speed between the preharvest threshing device and the rice plants during operation (m/s). The ‘rotation speed’ denotes the rotational velocity of the threshing cylinder during the device’s operation (r/min). The ‘threshing height’ is the distance from the axis of the threshing cylinder to the base of the rice plant, (mm). To evaluate the harvest quality, the grain loss rate and impurity rate were selected as the key test indicators. The bench test was carried out in adherence with the pertinent stipulations of ISO 8210:2021 [30]. At the start of each test, the rice clamping device was refilled and positioned on the trolley in line with the field density guidelines. The threshing cylinder was accelerated to the designated speed, after which the trolley was activated (adequate acceleration room was provided for the trolley). The threshing cylinder and trolley were stopped only after the threshing process was completely finished. After each test, the losses of grains and impurities were collected and weighed for statistical analysis. Immediate input of data into the computer was carried out in real time.
After completing the bench test, the statistics of each test indicator under different operating parameters were calculated. The grains remaining on the rice headears after harvesting (Figure 6b) were weighed, and their mass was recorded as the residual loss l1. The grains and headears (Figure 6c) that fell on the trolley after the test were weighed and the mass was recorded as the falling loss l2. The threshing materials within the device were predominantly rice grains, accompanied by a small fraction of stems and leaves (Figure 6d). The mass of the rice grains was denoted as the grain mass m1, and the mass of the nongrain threshing materials was recorded as the impurity mass m2. The grain loss rate and impurity rate were selected as the test indicators, and the mathematical equations are as follows:
R l = l 1   +   l 2 l 1   +   l 2   +   m 1 × 100 % R i = m 2 m 1   +   m 2 × 100 %
(1) To explore the influence of the different working conditions on the harvesting quality, and building on the results attained from the previous simulation tests and pretests, the forward velocity was set at 0.7, 0.9, 1.1, 1.3, and 1.5 m/s, the rotation speed at 300, 400, 500, 600, and 700 r/min, and the threshing height at 770, 795, 820, 845, and 870 mm. Single-factor tests were carried out with one variable test factor while maintaining the other two factors at constant values. The constant working parameters were set at 1.1 m/s for the forward velocity, 500 r/min for the rotation speed, and 820 mm for the threshing height. A total of 13 sets of tests were conducted, with each set replicated three times.
(2) To investigate the optimal operational parameter combination for the preharvest threshing device and achieve the best harvesting quality, a three-factor, five-level response surface optimization experiment was designed and implemented stemming from the data results of the single-factor experiment. The purpose of which was to narrow down the range of test factors. The test factors and test indicators were the same as those in the single-factor tests. The coding table designed for the response surface optimization experiment is presented in Table 1. A total of 20 sets of tests were conducted, with each set replicated three times.

3. Results and Discussion

3.1. Analysis of the Harvesting Process

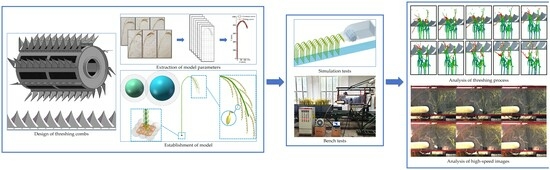
To explore the interactive effects and threshing mechanism of the preharvest threshing device on rice during the harvesting process, a simulation test was conducted with the working parameters set at a rotation speed of 300 r/min, a forward velocity of 1.1 m/s, and a threshing height of 795 mm. In this section, this set of simulation tests was used to analyze the position change and earhead state of the rice plant during the threshing process. The entire process of rice from contact with machinery to completion of harvesting could be divided into four stages: (a) pressing stage, (b) feeding stage, (c) threshing stage, and (d) extraction stage, as depicted in 
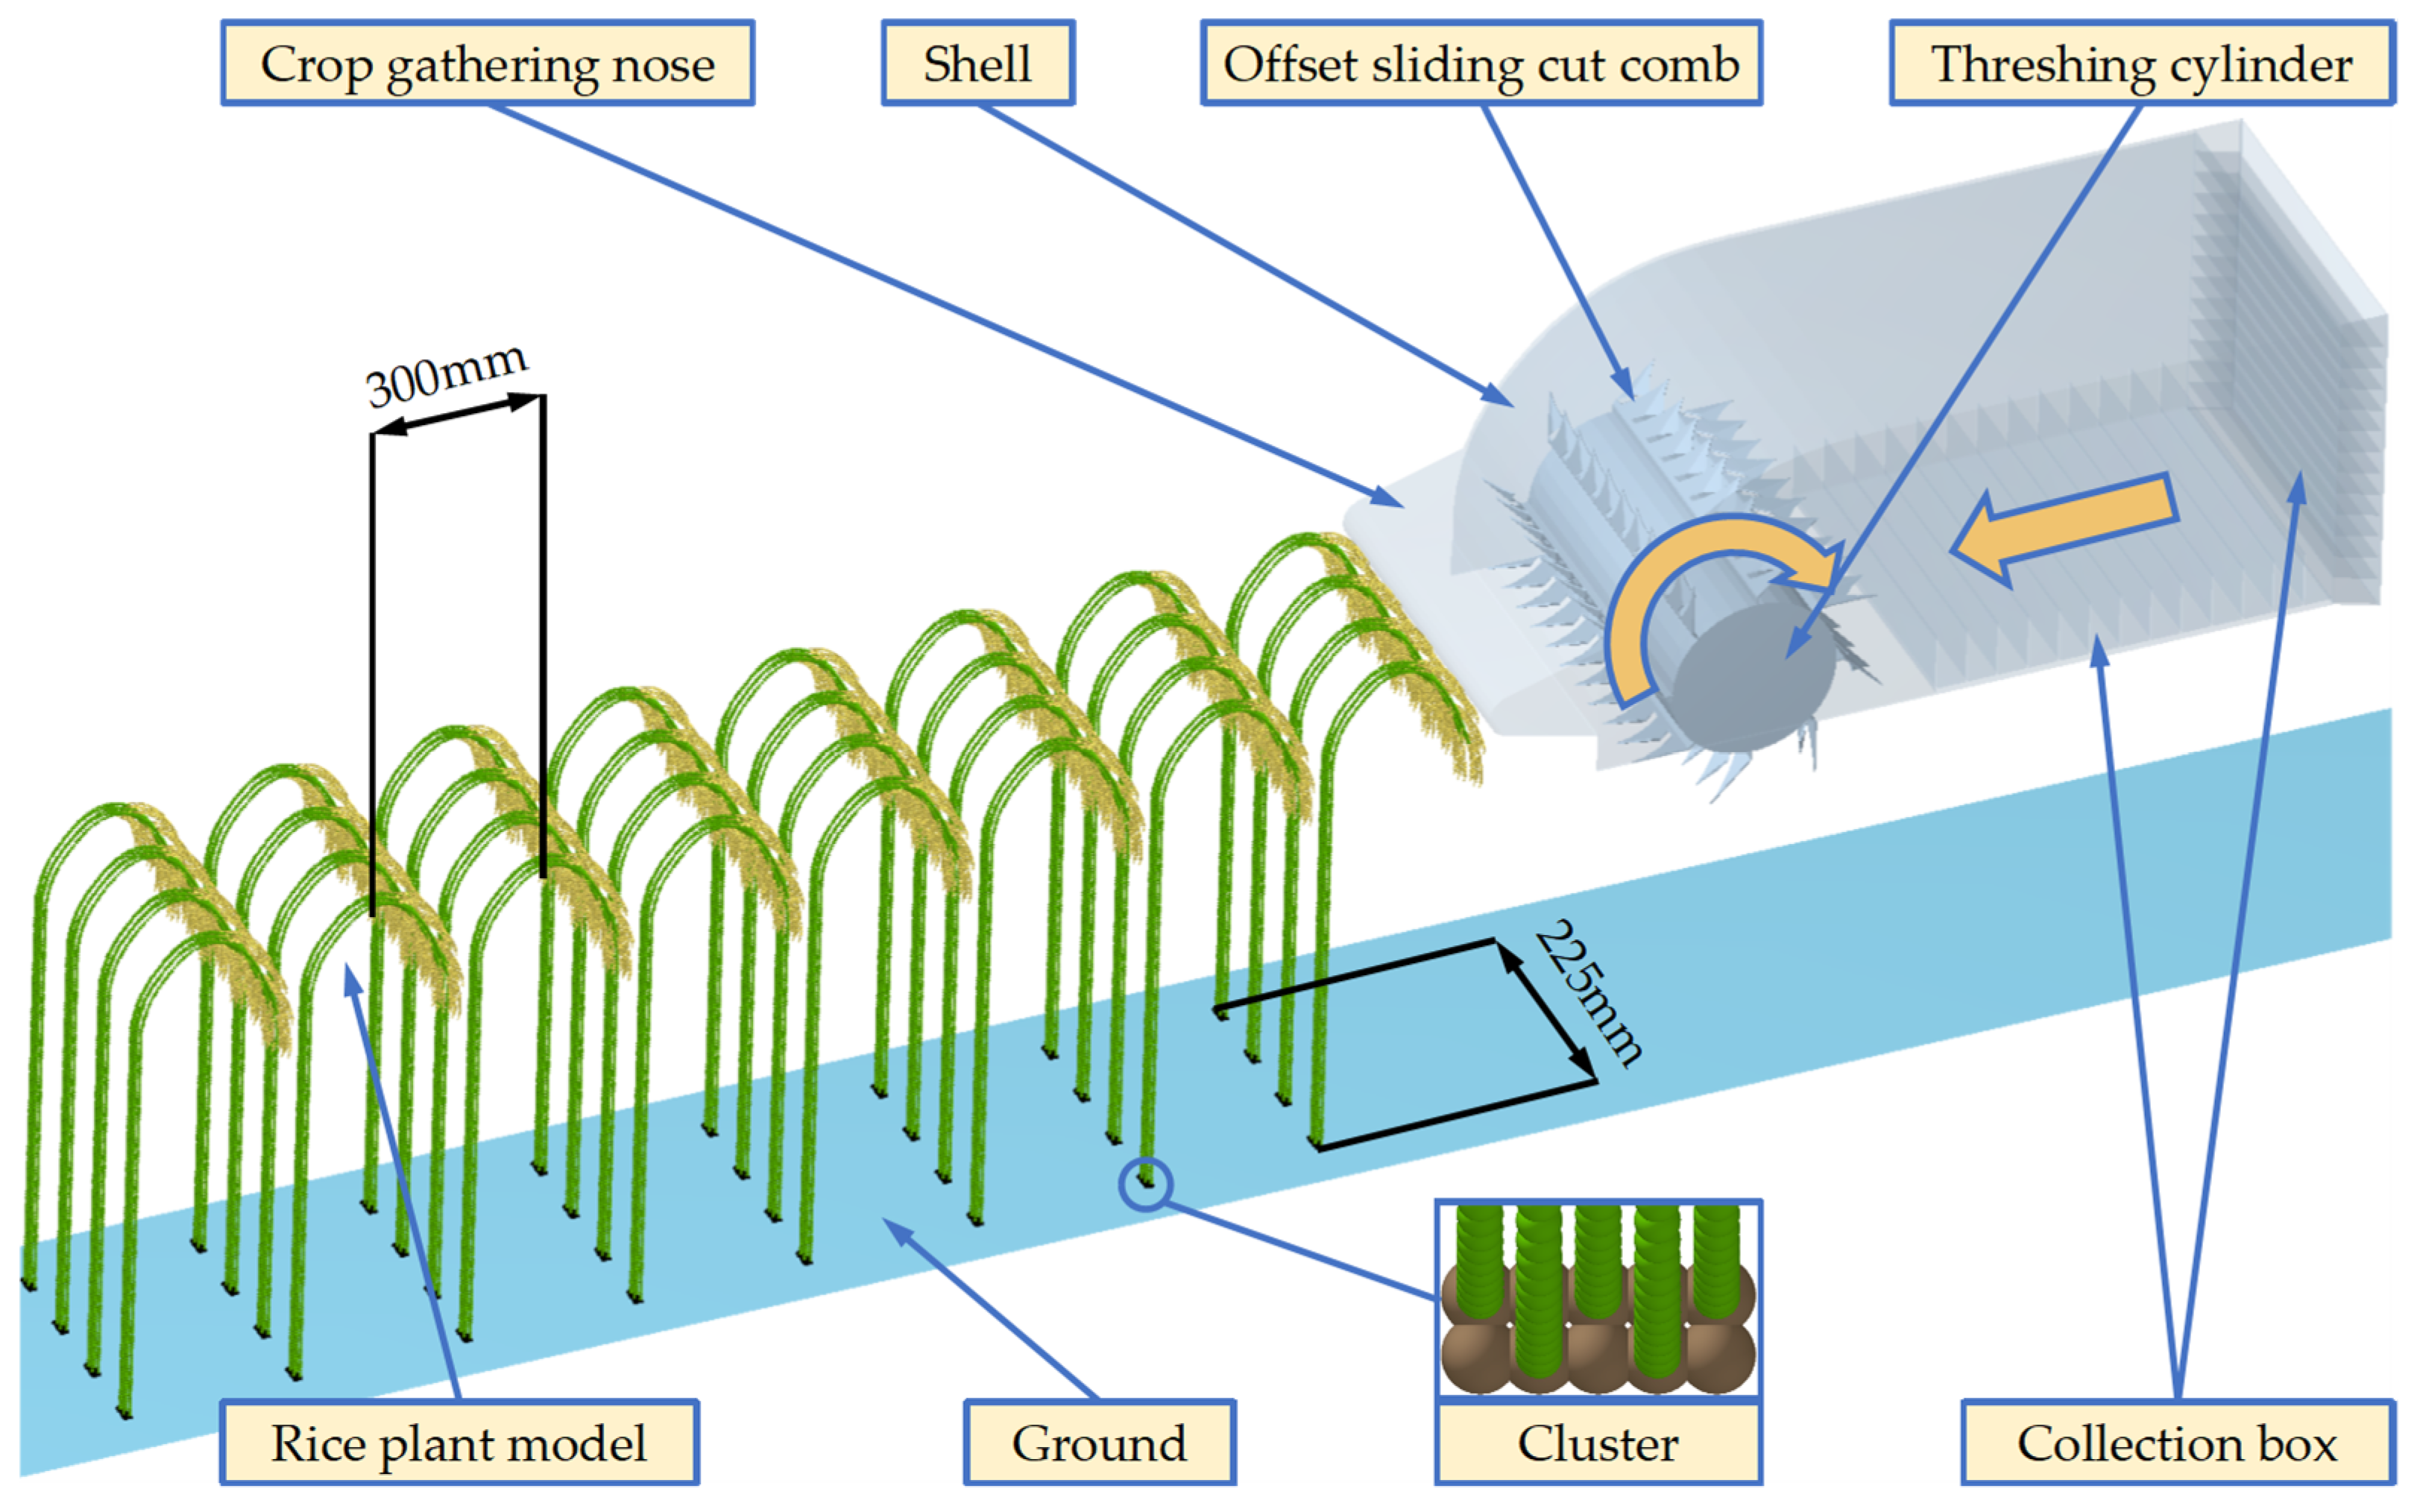
Figure 7a. During the pressing stage, the upright entire-plant rice came into contact with the crop gathering nose of the device and began to be bent downward. Due to the flexible nature of rice and its fixed root system, the speed and deflection of the rice increased progressively from the root to the earhead. As the rice moved towards the end of the crop gathering nose, both the deformation and the accumulated elastic potential energy reached their maximum values. After escaping the pressing from the crop gathering nose, the rice plants rebounded towards the direction of the threshing cylinder and fed themselves into the rotating cylinder area. This stage was defined as the feeding stage. Subsequently, the rice began to interact with the rotating combs on the cylinder, marking the beginning of the threshing stage. The earheads that hung low to the ground due to their own weight were lifted upward by the clockwise rotation of the combs, and the previously accumulated elastic potential energy was partially released. The rice earheads began to sweep rapidly towards the combs in an extended posture, sliding along the curved edge towards the base of the combs. From a functional and structural perspective, the two sides of the combs can be divided into the offset flattening zone and the sliding-cut threshing zone as depicted in Figure 1b in Section 2.1. During the process of sliding towards the base of the combs in the offset flattening zone, the rice plants were subjected to a lateral displacement perpendicular to the flattening plane, leading to a tilting motion towards the sliding-cut threshing zone of the combs. Under the combined influence of the device’s forward movement and the high-speed rotation of the threshing cylinder, the rice plants initiated their sliding cut along the edge of the sliding-cut threshing zone. This process occurred repeatedly during the period when rice came into contact with the combs, detaching a significant quantity of rice grains, earheads carrying rice grains, and a small fraction of other rice components from the stems of the rice plants. This stage was defined as the threshing stage, as illustrated in Figure 7b. Finally, the rice plants gradually withdrew from the rotation area, and the threshing materials during the operation were continuously thrown backwards under the combined action of the speed imparted by the rotating cylinder and their own inertia. This stage was defined as the extraction stage.
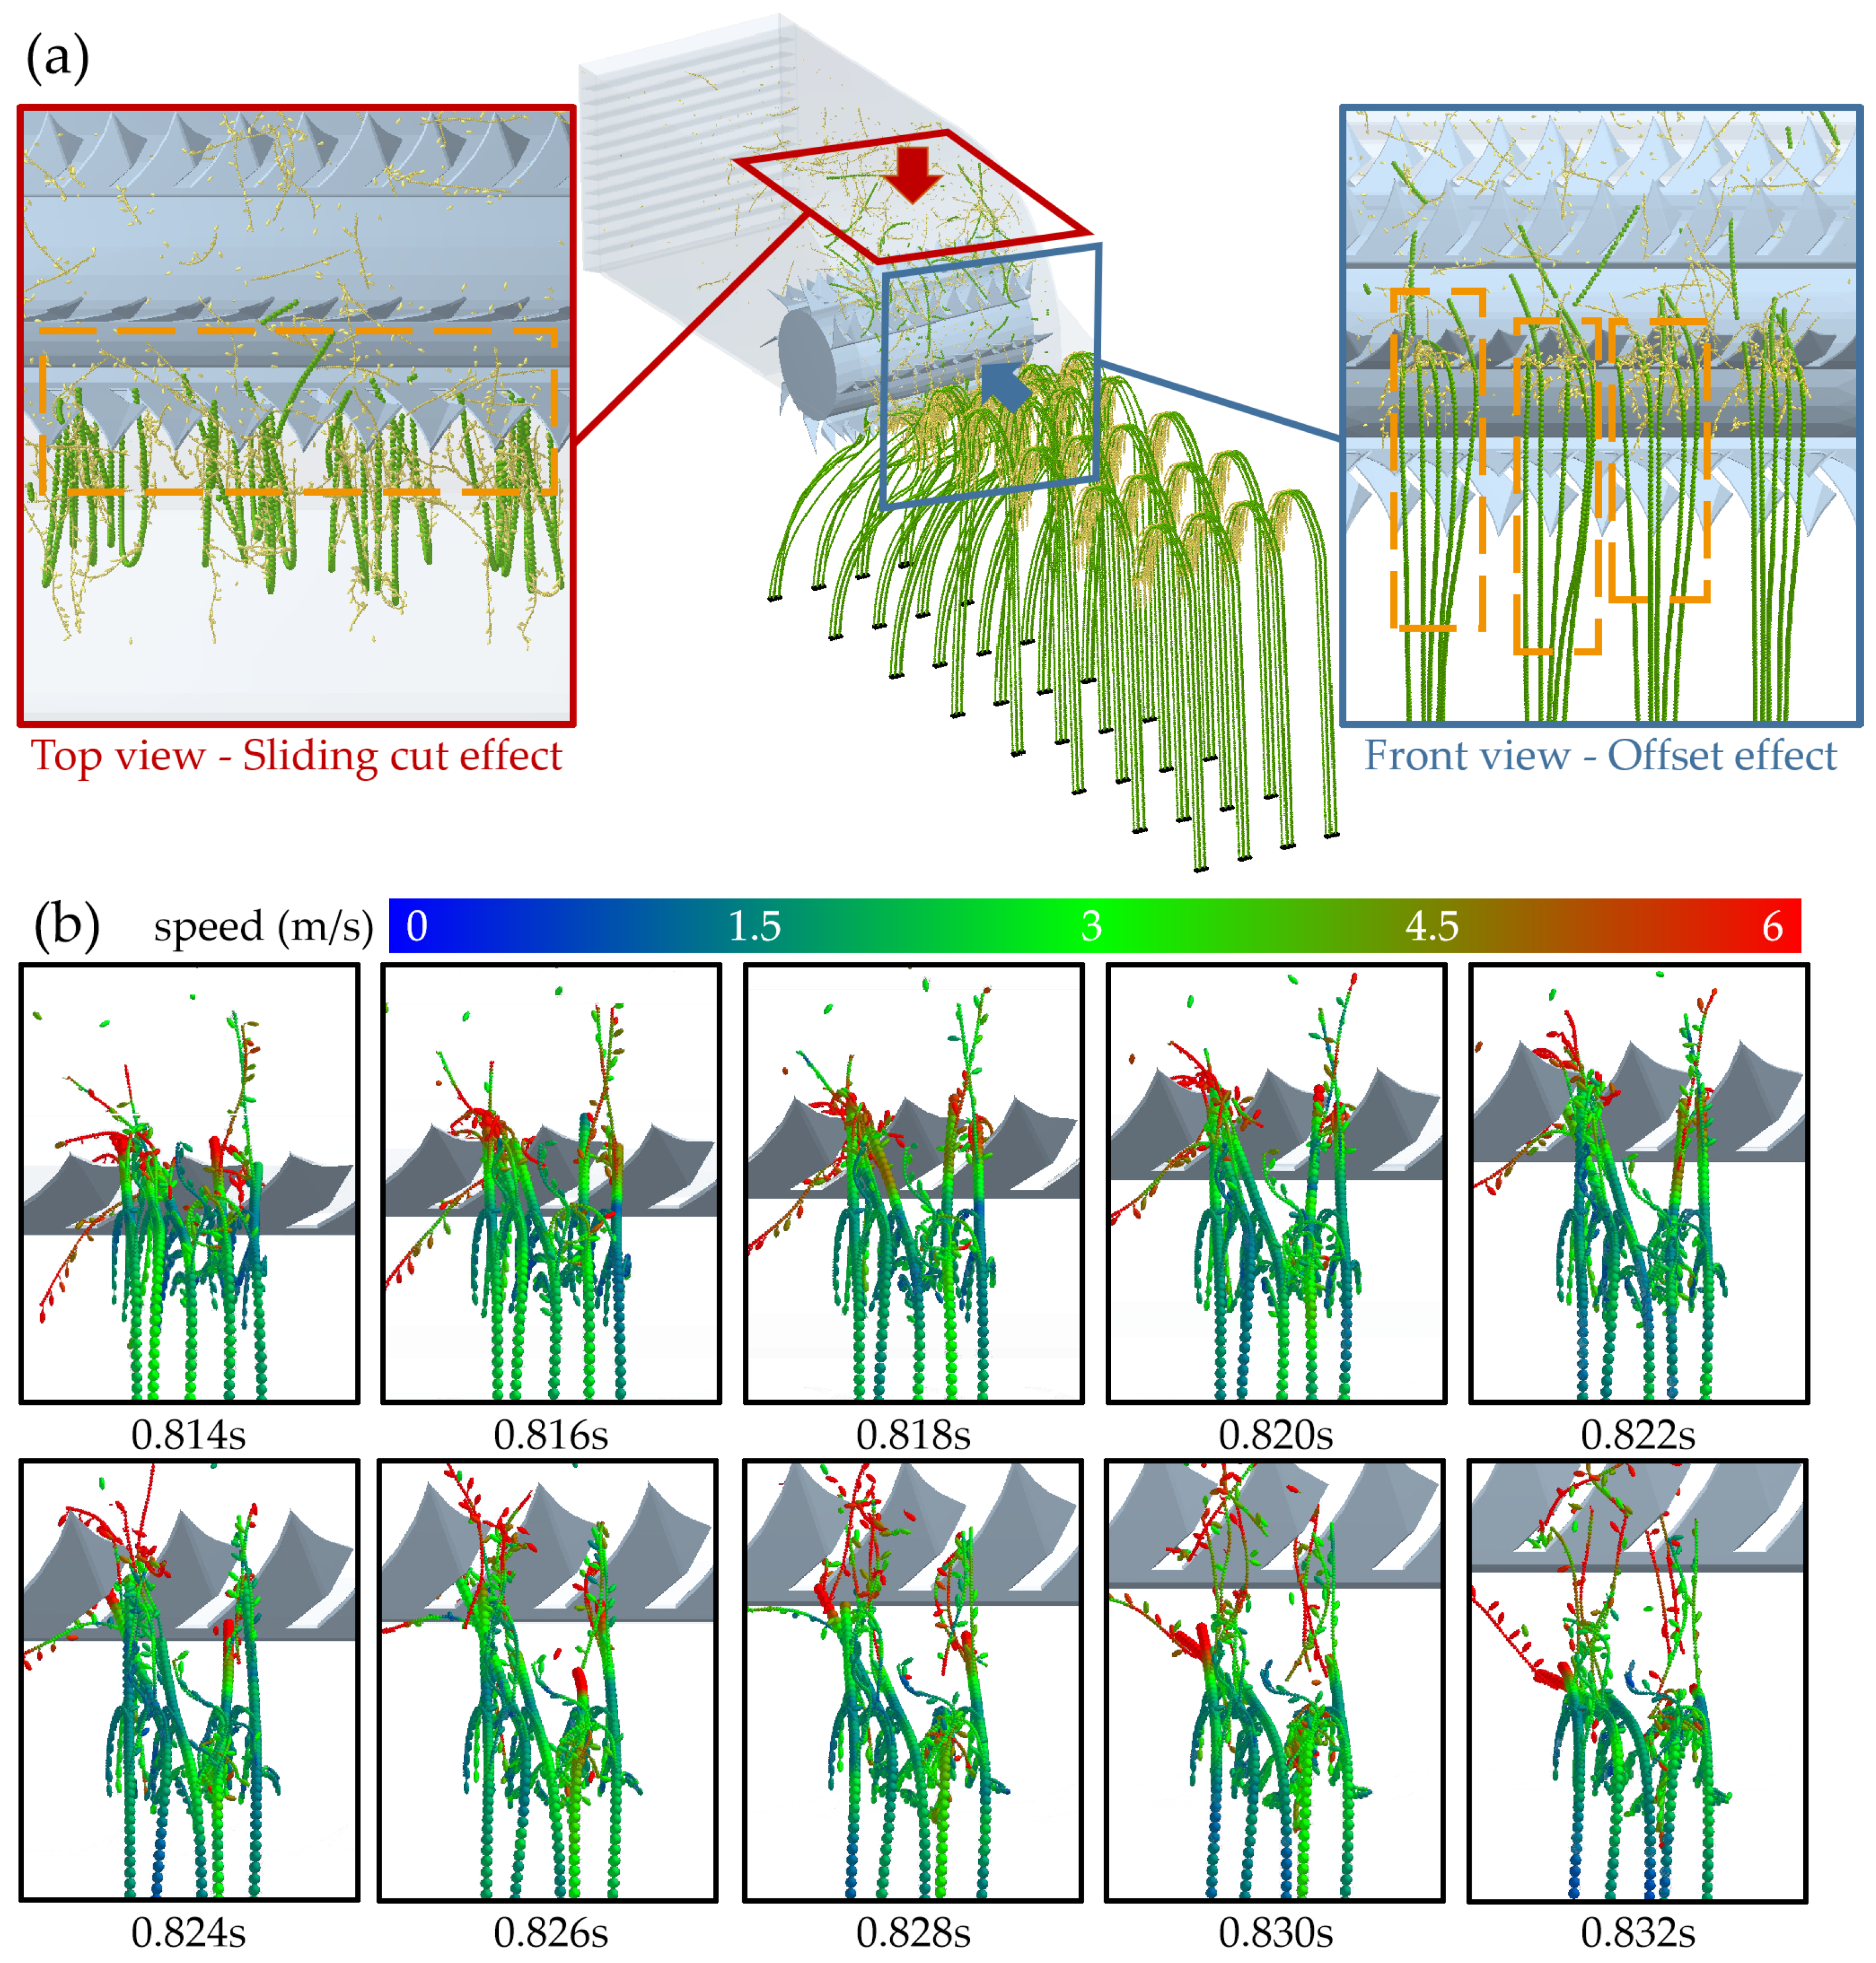
The interaction between rice and the comb during the threshing process is observed from above and in front of the threshing cylinder. From the top view, the sliding-cut motion of rice on the comb’s curved edge can be seen as the cylinder rotates. From a frontal view, the continuous compression of the rice from stem to earhead by the offset flattening zone structure, causing a shift towards the sliding-cut threshing zone, is observable, as shown in Figure 8a.
To further observe the interaction details between the rice and the comb, structures other than the comb were hidden for a clearer view of rice movement under the influence of a single row of combs. The time interval from 0.814 s to 0.832 s was selected to analyze the interaction details between the rice and the combs during operation. From the top view of the cylinder, as shown in Figure 8b, at 0.814 s, the rice was about to contact the combs. At this moment, the movement of the rice earheads divided into two scenarios: some approached the sliding-cut zone of the comb, while others neared the offset flattening zone. From 0.814 s to 0.822 s, as the cylinder rotated, the rice near the sliding-cut zone began to undergo sliding-cuts, while other grains started offset displacement after contact, leaning towards the sliding-cut zone. By 0.822 s, all the rice earheads were offset into the sliding-cut zone. From 0.822 s to 0.828 s, the earheads sliding cut along the contour of the combs in the sliding-cut zone, where numerous rice grains and branches were seen to slide off the plant. From 0.828 s to 0.832 s, the earheads began to disengage from the combs they initially contacted and approached another row below, repeating the described threshing process. Throughout the operation, the rice earheads continuously moved along the contours of the combs. According to the velocity nephogram, the rice’s speed was high and constantly changing during the threshing process, consistent with sliding-cut characteristics. This also caused the lower rice stems to swing back and forth along the cylinder’s axial direction with variable speed. This motion was beneficial for further enhancing the sliding-cut efficiency of the combs [31]. Based on visual analysis of the above simulation, it could be concluded that throughout the entire process of the harvesting each functional zone of the combs was effectively performing its designated function, achieving a favorable bias displacement and sliding-cut effect on the rice.

3.2. Analysis of Sliding-Cut Rules

For the purpose of investigating the influence of various working parameters on the sliding-cut effect of combs on rice, the duration of contact between the rice and the combs was defined as ‘contact time’. The time period from contact to complete separation between combs and a row of rice was selected as the duration of the contact time. Utilizing the working parameters of the device as test factors, we conducted single-factor simulation tests, with the average velocity of rice grains during the threshing process and the amount of broken bonds (acquired by postprocessing the simulation results) as test indicators. The variation of rice grain velocity with time can reflect the movement of rice grains during threshing. The amount of broken bonds with rice grains (the bonds between rice grains and rice rachis, denoted as BWG) can reflect the direct cutting of grains by combs, while the amount of broken bonds with impurities (the bonds between the stem, substem, and rice rachis, denoted as BWI) indicates the degree of impurity dispersion and the overall trend of the impurity rate during the threshing process. The sum of these two values effectively represents the sliding-cut efficiency of the combs.
K = 8 n 60 v
We define the number of times the combs hit the rice per unit distance as K, and the mathematical expression is shown in Equation (7). It is evident that this indicator correlates with the rotation speed n (r/min) and forward velocity v (m/s). When other factors remain constant, the faster the cylinder rotates, the more times the combs hit the rice, and the shorter the time the combs are in contact with the rice at one time.
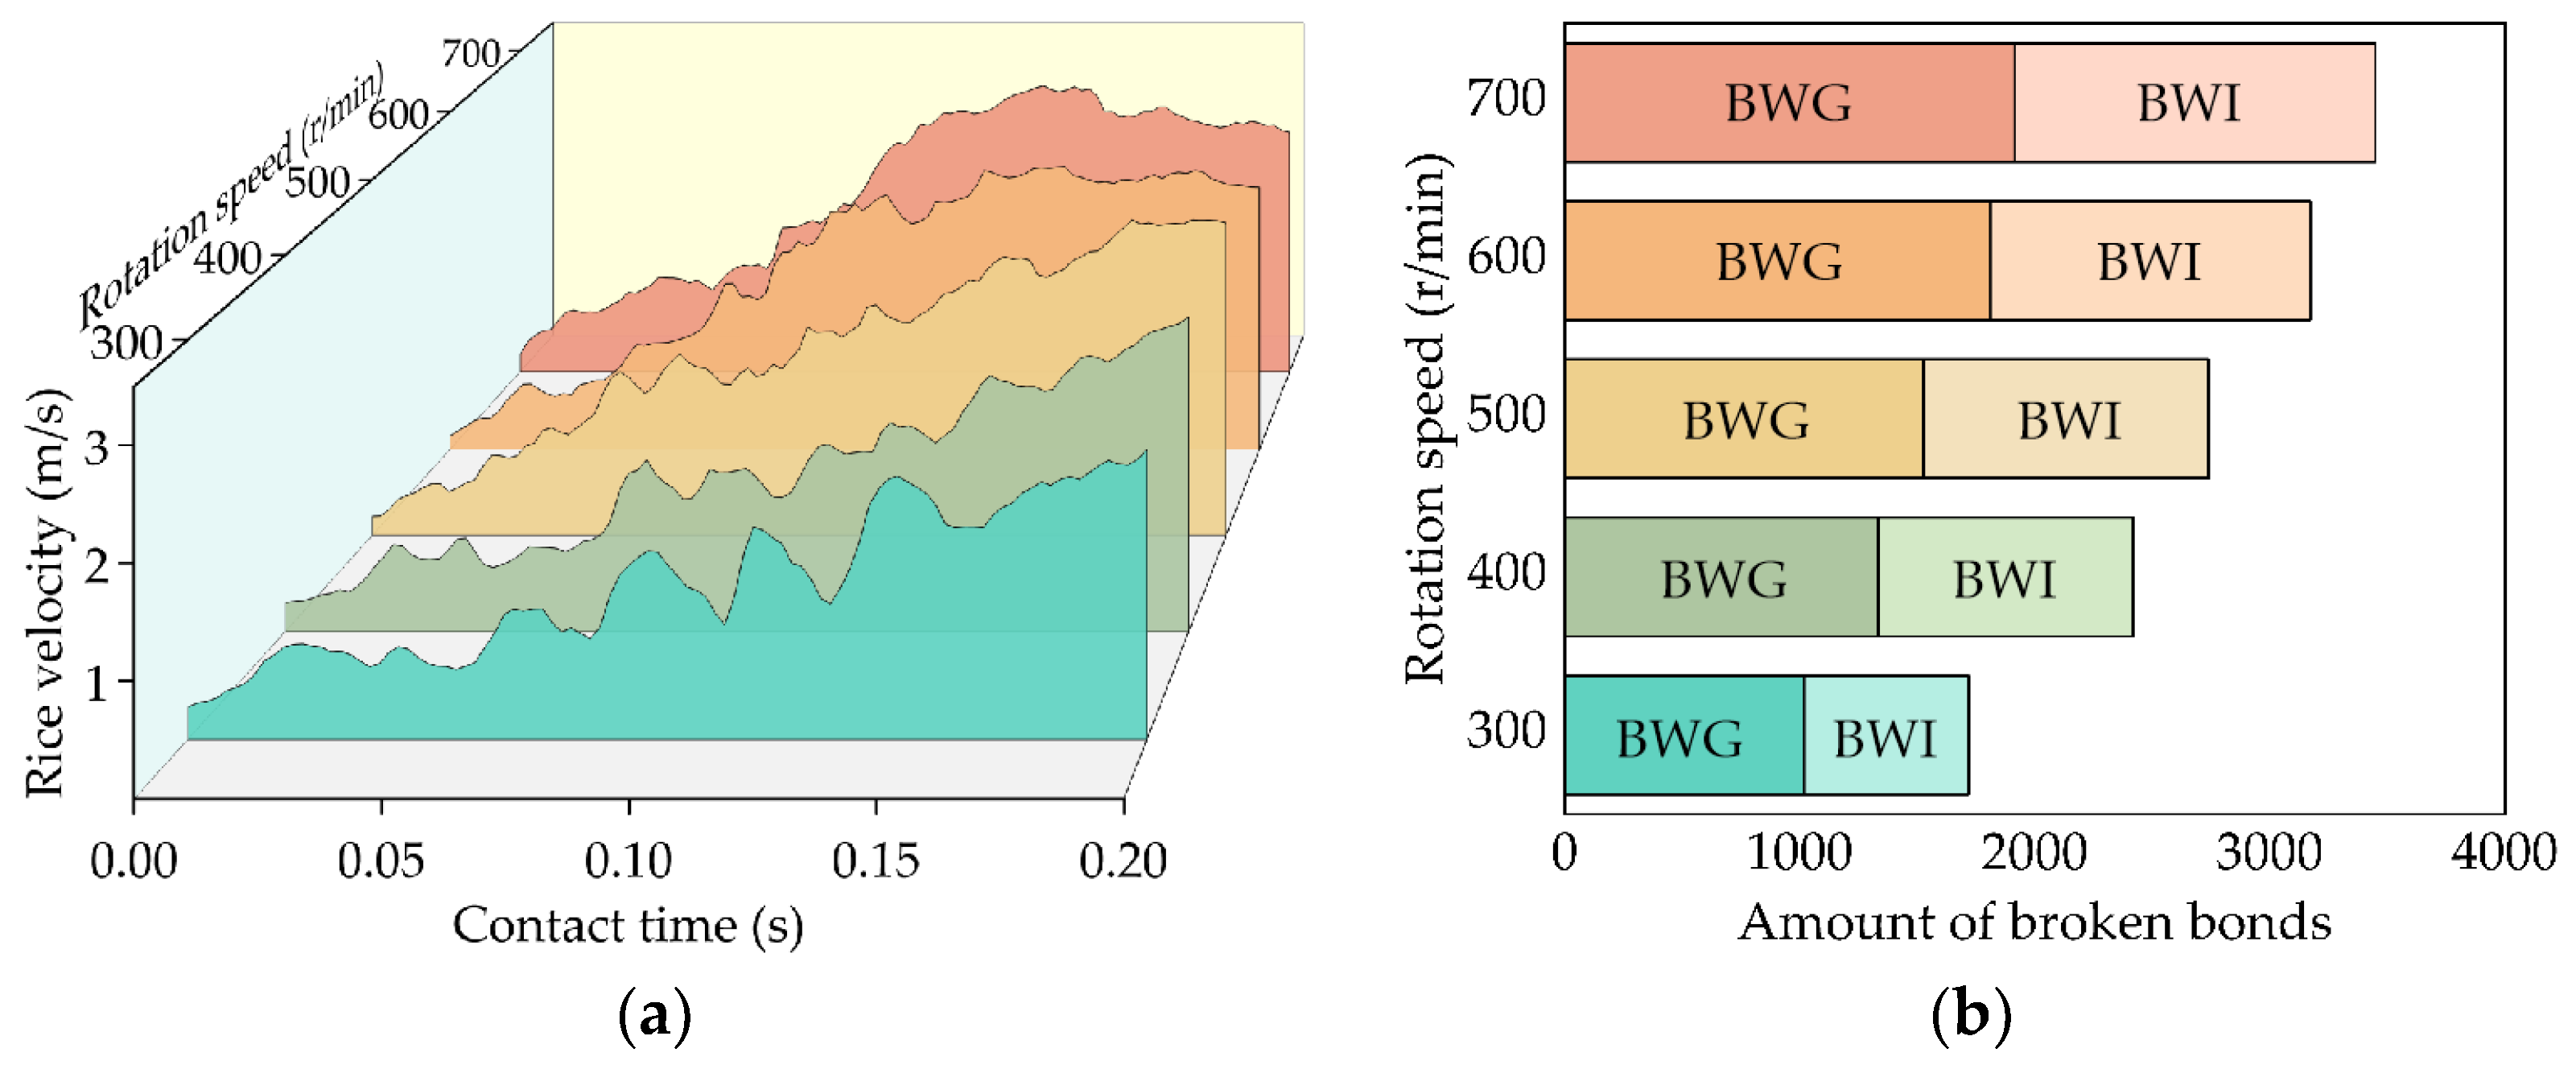
Firstly, an analysis of the rotation speed was conducted. As depicted in Figure 9a, an increase in the rotation speed correlated with a gradual rise in the number of velocity wave peaks for rice grains, whereas the velocity wave height decreased. It showed that during the operation process, the frequency of the sliding-cut of rice by the combs gradually increased, while the single sliding-cut time gradually decreased. Simultaneously, the overall velocity of the grains increased with the increase in the rotation speed, indicating that the average velocity of grains rises with an increase in rotation speed during the sliding-cut process. A high speed and small fluctuation in the sliding-cut could more effectively separate grains from the stems of rice plants [23]. The analysis of sliding-cut effectiveness was conducted based on the amount of broken bonds, as illustrated in Figure 9b. With the elevation of the rotation speed, there was a gradual increase in the amount of broken bonds for both the rice grains and other rice components. This implied an improvement in sliding-cut effectiveness as the rotation speed increased. In conditions of a high rotation speed, the frequent yet short duration sliding cut mentioned above could effectively separate the rice grains from the rice stems, which resulted in a more efficient reduction in the residual loss attributed to incomplete threshing.
When the threshing height was considered as the test variable, it can be observed from Figure 10a that as the threshing height increased, the velocity of grains continuously increased. This was attributed to the expanded contact area between the combs and the rice plants when the threshing height was low, resulting in an increased workload during the threshing process. Under the same cylinder rotation speed, the combs contacted more materials, resulting in a lower average sliding-cut velocity of the rice grains. With an excessively high threshing height, the contact between the combs and materials was relatively reduced, and the duration of the single sliding-cut actions shortened. As shown in Figure 10a, the velocity peaks were lower and the frequency was uncertain. From the perspective of the amount of broken bonds, under the working condition of an excessive threshing height, the amount of broken bonds of rice grains was significantly lower than that of other conditions, while the amount of broken bonds of rice grains at other height levels was relatively uniform. This indicated that an unreasonable threshing height could have an adverse impact on the effectiveness of the sliding cuts by the combs.
When the forward velocity was taken as a test variable, Figure 11a indicates that the contact time between the combs and rice plants was inversely proportional to the device’s forward velocity. As the forward velocity increased, the velocity peaks on the graph became higher and more densely distributed, indicating a greater fluctuation in the velocity of rice grains during the sliding-cut process and a shorter duration of a single sliding cut, resulting in unsatisfactory sliding-cut effectiveness. Conversely, as the forward velocity decreased, the contact time between the combs and rice increased, resulting in smoother velocity variations during the sliding-cut process, which contributed to an enhancement in sliding-cut effectiveness [32]. The results in Figure 11a,b verified each other. The amount of broken bonds gradually decreased with the increase of the forward velocity, which indicated that the higher the forward velocity, the worse the sliding-cut effectiveness was, while the other working parameters remained constant.

3.3. Single-Factor Bench Test

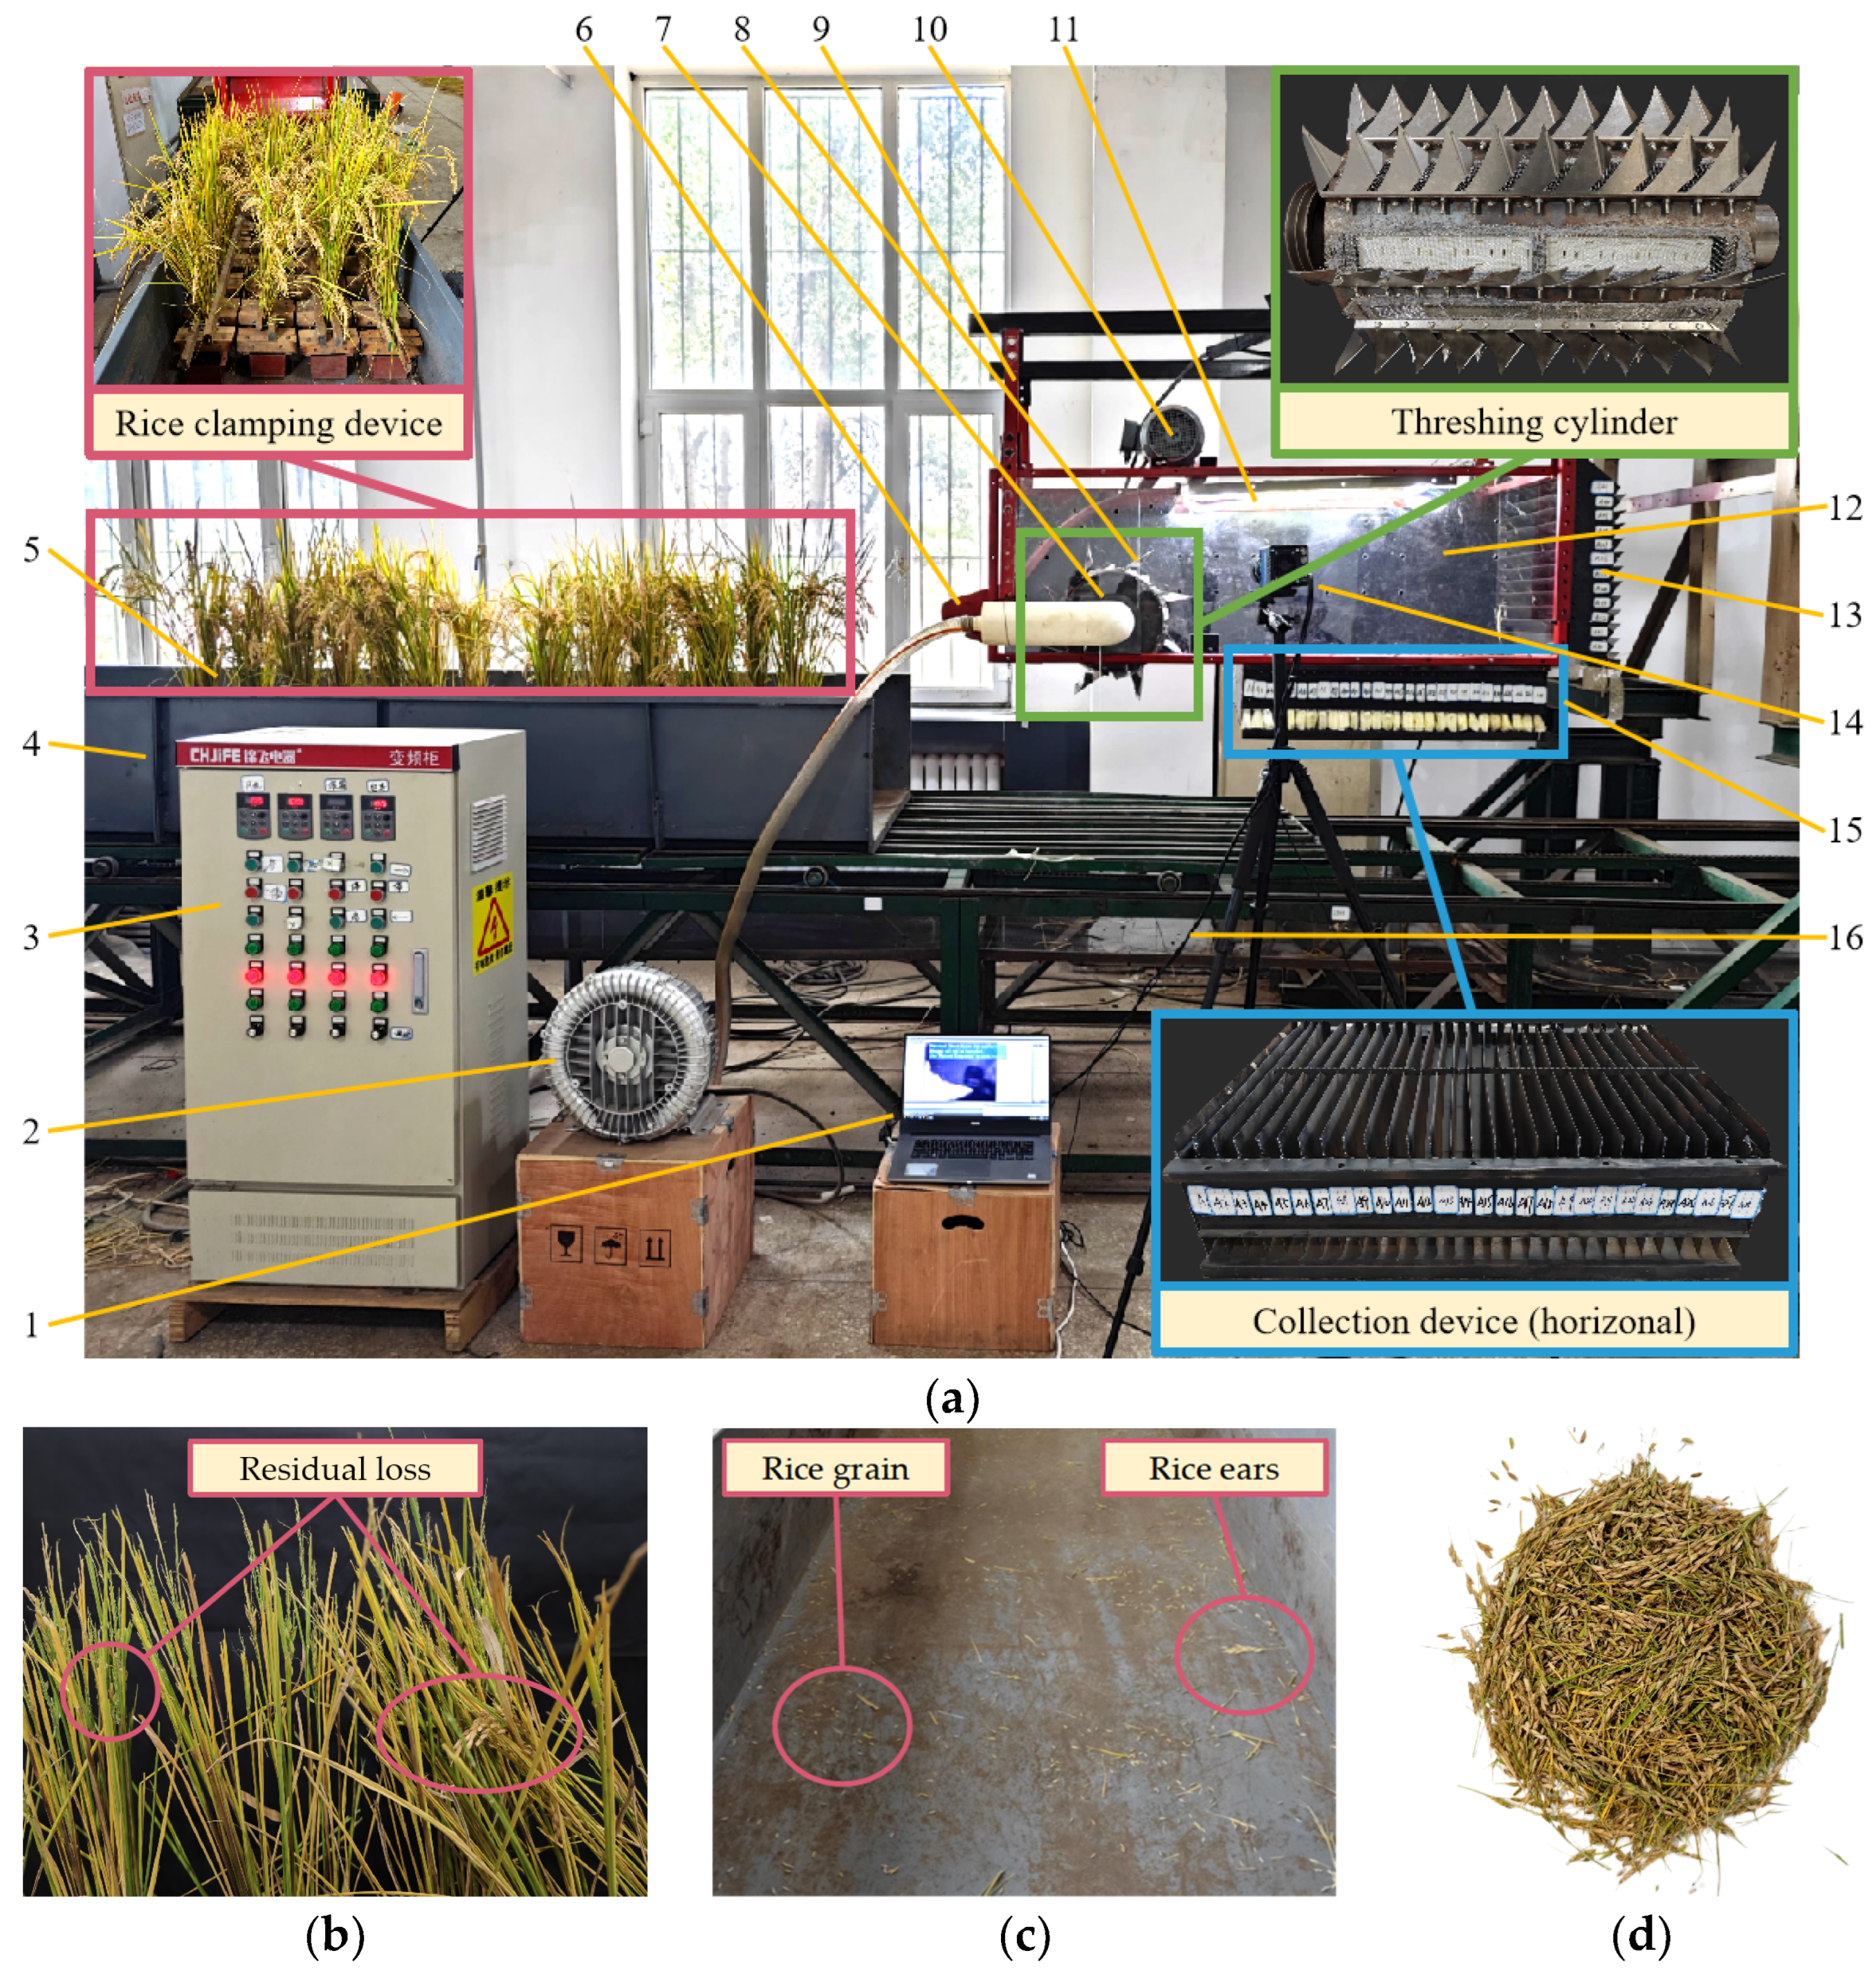
For the purposes of investigating the impact patterns of the experimental results and the various working parameters on harvest quality, a high-speed imaging device was applied to acquire images of the detailed characteristics at a frame rate of 500 fps during the harvesting process for auxiliary analysis.
(1)
Results of the single-factor bench test
With an invariable forward velocity and threshing height, the rice grain loss rate exhibited a tendency of initially decreasing and subsequently increasing with the increase in the rotation speed. At a rotation speed of 600 r/min, the grain loss rate reached its minimum value at 3.24%, with decreases of 4.84% (300 r/min), 0.14% (400 r/min), 1.33% (500 r/min), and 2.37% (700 r/min) relative to other levels. Additionally, the impurity rate of the threshing material showed a pattern of initially decreasing followed by an increase. When the rotation speed was 500 r/min, the impurity rate of the threshing material achieved its minimum at 5.49%, indicating reductions of 3.83% (300 r/min), 1.39% (400 r/min), 0.11% (600 r/min), and 0.99% (700 r/min) compared to other levels.
With the rotation speed and threshing height held constant, the grain loss rate exhibited a tendency to decrease initially and then increase as the forward velocity increased. When the device’s forward velocity reached 0.9 m/s, the grain loss rate attained its minimum value (4.44%). In comparison to the other levels, it decreased by 0.47% (0.7 m/s), 0.13% (1.1 m/s), 0.7% (1.3 m/s), and 1.15% (1.5 m/s). The impurity rate exhibited a tendency to start with a decrease and then transition to an increase. At the time when the device’s forward velocity attained 0.9 m/s, the impurity rate reached its minimum value (5.33%). In comparison to the other levels, it decreased by 0.88% (0.7 m/s), 0.16% (1.1 m/s), 0.94% (1.3 m/s), and 1.62% (1.5 m/s).
When the forward velocity and rotation speed remained unchanged, as the threshing height increased, the grain loss rate exhibited an initial decrease, followed by an increase. When the threshing height was 795 r/min, the grain loss rate reached its minimum value at 4.31%. Compared to other levels, it decreased by 0.57% (770 mm), 0.26% (820 mm), 0.56% (845 mm), and 1.36% (870 mm). The impurity rate demonstrated a pattern of initially decreasing and subsequently increasing. When the threshing height was 795 r/min, the impurity rate reached its minimum value of 5.42%. Relative to other levels, it decreased by 1.23% (770 mm), 0.07% (820 mm), 0.36% (845 mm), and 0.91% (870 mm). The indicator data obtained from the bench tests are depicted in Figure 12.
(2)
Discussion of the single-factor bench test
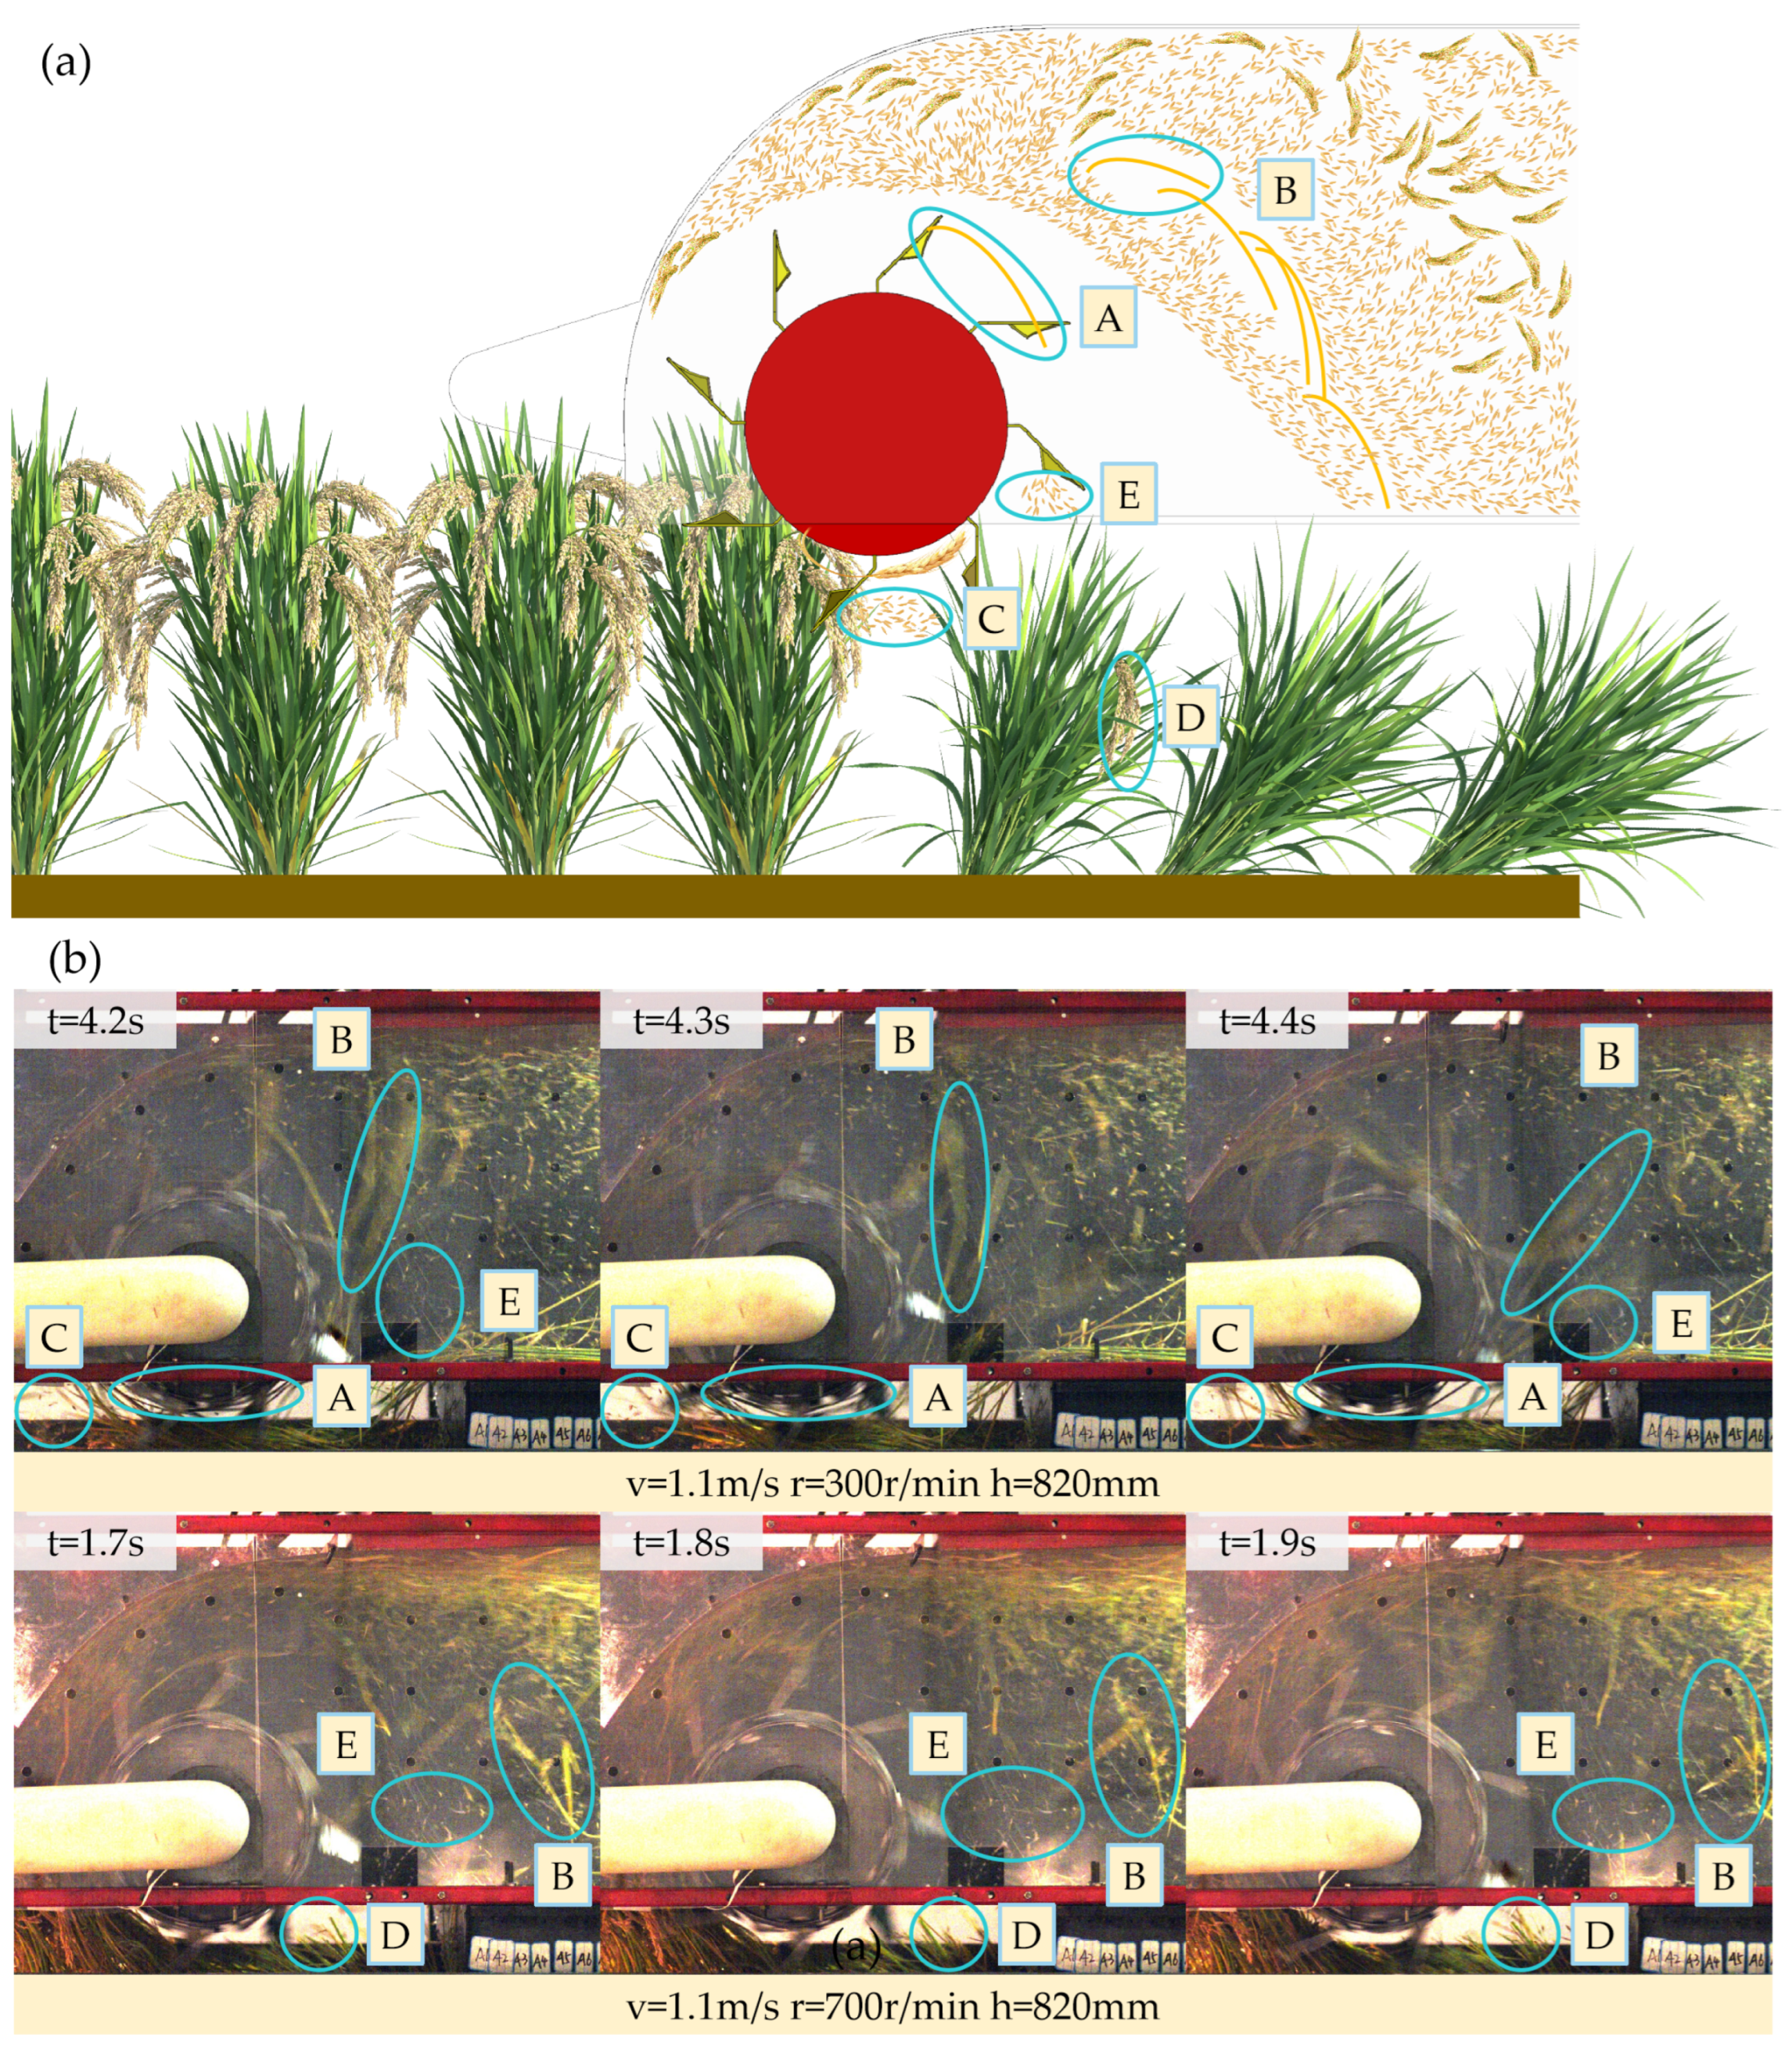
In the bench test, by conducting high-speed filming of the test process, we identified five typical detail characteristics of threshing materials that significantly affected the harvest quality. The schematic diagram for better comprehension of these features is illustrated in Figure 13a, while the attributes captured through the high-speed imaging device are depicted in Figure 13b. In conjunction with the experimental results, an analysis was conducted on the impact patterns and effect of the test factors on the harvesting quality.
The sliding-cut effect of the combs was less effective at lower rotation speeds. Some grains were unable to be threshed, and at the same time, larger-sized impurities were difficult to cut, leading to entanglement on the combs (Characteristic A). After several rotations, these impurities were thrown into the collection box (Characteristic B). Consequently, both the grain loss rate and impurity rate were at relatively high values under this condition. When the rotation speed increased, the sliding-cut effectiveness gradually improved and the residual loss began to decrease. At the same time, the impurities were also cut more discretely, making them less likely to become entangled, and the impurity rate also began to gradually decrease. As the cylinder rotation speed increased further, a portion of the rice that was not completely fed into the header was threshed but failed to move backward; instead, it splashed forward, resulting in splash loss (Characteristic C), which contributed to an additional increase in the grain loss rate. The impurities became more discrete, with a reduction in both mass and volume, which enabled them to attain sufficient velocity to be thrown into the collection box during the transportation process. As a result, the impurity rate rebounded.
As the forward speed increased, the accumulated elastic potential energy and deflection of the rice plants became greater before the feeding stage. The excessive elastic potential energy caused the rice to rapidly fall towards the cylinder during the feeding stage, preventing part of the rice from being fully sliding cut, resulting in an increase in the residual loss (Characteristic D). The large deflection also prevented some rice from fully entering the working area of the combs during the harvesting process, resulting in increased splash loss (Characteristic C). Therefore, there was a positive correlation between the loss rate and forward velocity. The sliding-cut effectiveness of the combs deteriorated with the increase in the forward velocity, making it difficult for the impurities to be thrown into the collection box; so, the impurity rate began to gradually decrease. However, as the forward velocity further increased, the sliding-cut effectiveness decreased and the deflection of the rice increased. The impurities that could not be cut began to wrap around the cylinder (Characteristic A) and were thrown into the collection box (Characteristic B), causing the impurity rate to increase again.
The grain loss rate exhibited an initial decrease, followed by an increase, as the threshing height increased. This was because, when the threshing height was low, more impurities would be cut off from the stems by the combs. As a larger mass and volume of impurities were thrown backwards, they would generate a barrier behind the cylinder (Characteristic B), obstructing the transfer of grains to the collection box, resulting in return loss (Characteristic E). With the increase in the threshing height, the rice obstructed from collection gradually decreased, resulting in a gradual decline in the grain loss rate and a corresponding decrease in the impurity rate. However, when the threshing height was excessively high, some rice earheads could not enter the reasonable working range of the combs, resulting in residual loss (Characteristic D) and causing an escalation in rice grain loss rate. Since the impact force of the cylinder rotation remained constant, there was less material in contact with the threshing cylinder, resulting in a higher impact force on the rice components. This caused more nongrain components to be cut off from the rice, causing the impurity rate to rise again.

3.4. Multi-Factor Optimization Bench Test

A three-factor, five-level response surface optimization experiment was undertaken, with the rotation speed, forward velocity, and threshing height as the test factors and the grain loss rate and impurity rate as the test indicators. Analysis of the experiment results was conducted by Design-Expert 13 software (2020, StatEase, Inc., Minneapolis, MN, USA) (Table 2). The regression model demonstrated high significance, and the lack of significant mismatch suggested the accuracy and effectiveness of the established model. By fitting the values of the regression terms that had a significant impact on the model, Equation (8) was derived.
Y 1 = 2 0.2249 X 1 0.1445 X 2 + 0.0907 X 3 0.105 X 1 X 2 + 0.0425 X 1 X 3 + 0.055 X 2 X 3 + 0.4372 X 1 2 + 0.2286 X 2 2 + 0.2463 X 3 2 Y 2 = 4.1 0.082 X 1 + 0.0923 X 2 + 0.0943 X 3 + 0.1637 X 1 X 2 + 0.1962 X 1 X 3 0.1263 X 2 X 3 + 0.2544 X 1 2 + 0.272 X 2 2 + 0.2756 X 3 2
Based on the F-values obtained in the analysis of variance for each test factor, the factors influencing the grain loss rate followed this sequence: X 1 2 > X 3 2 > X 2 2 > X 1 > X 2 > X 3 > X 1 X 2 > X 2 X 3 > X 1 X 3 , and the sequence of factors affecting the impurity rate was as follows: X 3 2 > X 2 2 > X 1 2 > X 1 X 3 > X 1 X 2 > X 2 X 3 > X 3 > X 2 > X 1 
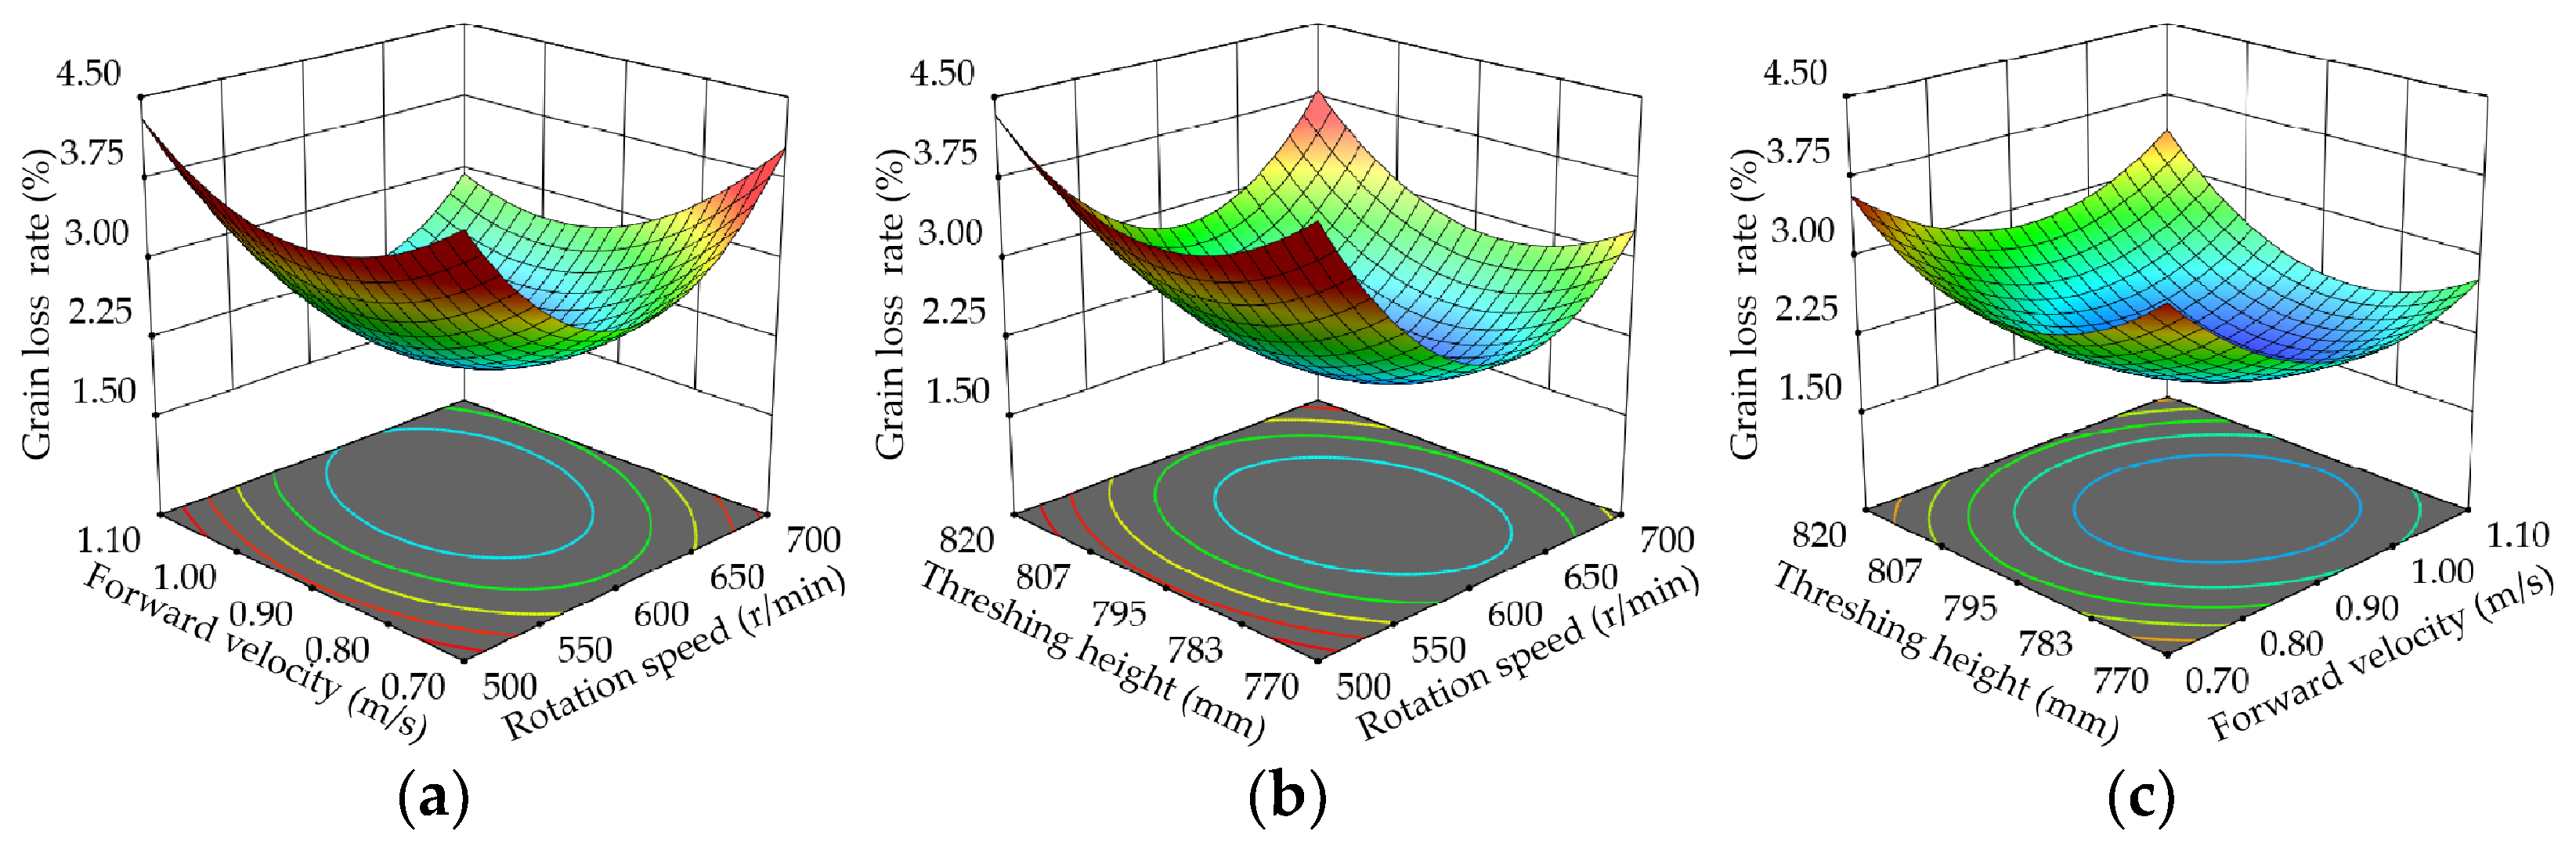
. For the purpose of visually depicting the influence of each experiment factor and interactions on the experiment indicators, a response surface graph is plotted (Figure 14).
It was evident that there were significant interactions between the forward velocity and rotation speed, the threshing height and rotation speed, and the threshing height and forward velocity in their influence on the grain loss rate. When the forward velocity interacted with the rotation speed, as the forward velocity increased, the grain loss rate exhibited an initial decrease, followed by a subsequent increase; with the increase in rotation speed, the rice grain loss rate initially decreased and then increased. When the threshing height interacted with the rotation speed, as the threshing height increased, the grain loss rate initially decreased and then increased; the grain loss rate demonstrated an initial decrease followed by an increase as the rotation speed increased. When the threshing height interacted with the forward velocity, as the threshing height increased, the loss rate initially showed a decline and then rose again; and with the increase in forward velocity, the grain loss rate initially decreased and then increased.
There were significant interactions between the forward velocity and rotation speed, the threshing height and rotation speed, and the threshing height and forward velocity in their influence on impurity rate. When the forward velocity interacted with the rotation speed, as the forward velocity increased, the impurity rate rose initially and then declined; as the rotation speed increased, the impurity rate initially rose and then declined. When the threshing height interacted with the rotation speed, as the threshing height increased, the impurity rate rose and then declined; as the rotation speed increased, the impurity rate rose initially and then declined. When the threshing height interacted with the forward velocity, as the threshing height increased, the impurity rate declined initially and then rose; and when the forward velocity increased, the impurity rate declined initially and then rose.
The optimization solution was implemented to explore the optimal combination of working parameters for each test factor within the feasible range of design parameters. The goal was to minimize both the grain loss rate and impurity rate. The objective function and the range of working parameters are shown in Equation (9).
min Y 1 ( X 1 , X 2 , X 3 ) min Y 2 ( X 1 , X 2 , X 3 ) s . t . 300   r / min < X 1 < 700   r / min 0.7   m / s < X 2 < 1.5   m / s 770   mm < X 3 < 870   mm
Utilizing Design Expert-13 software (2020, StatEase, Inc., Minneapolis, MN, USA), the optimization solution was implemented. The result revealed that when the rotation speed was 615.668 r/min, the forward velocity was 0.913 m/s, and the threshing height was 791.613 mm, the grain loss rate was 1.942%, and the impurity rate was 4.095%. The best working parameter combination of the preharvest threshing device was obtained through the optimization solution.
According to the optimization result, a bench verification test was conducted to validate the accuracy of the solution under the condition of the optimal working parameter combination. The result of the verification test revealed that when the rotation speed was 616 r/min, the forward velocity was 0.91 m/s, and the threshing height was 792 mm, the grain loss rate was 1.997%, and the impurity rate was 4.073%. The relative error compared to the model’s estimation was relatively small. Compared with the performance of the original combs in our previous research, both the residual loss and the falling loss were much lower than the original plane combs [16].
This study designed an offset sliding-cut comb and, based on an innovatively constructed discrete element model of rice plants during the harvesting period, explored the sliding-cut interaction mechanism between the combs and rice plants in the threshing process. It investigated the effects of different operational parameters on the threshing quality, effectively addressing the issue of excessive harvesting losses in preharvest threshing combine harvesters. This provides a theoretical foundation and data support for the innovative design and further development of preharvest threshing device combs. The test results revealed that rotation speed, forward velocity, and threshing height all have a significant impact on the harvest quality. Furthermore, through targeted optimization design, the offset sliding-cut combs, compared to the original plane combs, reduced residual loss by 23%. Since the falling loss accounts for a high proportion of the grain loss, reducing the falling loss to improve harvest quality is one of the issues that needs to be solved urgently in subsequent research.
The discrete element model of rice developed for the harvesting period effectively represents characteristics such as drooping earheads and field planting density. However, the issue of uniform orientation in the simulation requires improvement in future research, alongside studies aimed at creating a more broadly representative rice model. The simulation tests conducted in this study primarily analyzed the threshing process of rice. Due to factors like airflow affecting the throwing process, DEM simulations cannot fully replicate this phase. Future research will explore the throwing process and its impact on the operation quality using CFD-DEM coupled simulations. Additionally, since the rice harvesting period is prolonged and factors like the moisture content and maturity level change during this time, affecting the harvest quality, further studies will investigate the influence of varying the moisture content on the harvest quality.
Additionally, the designed components have not been integrated and configured into the preharvest threshing harvester. Therefore, the working parameter combination obtained in this study has not been validated in field tests. Due to the continuous vibration of the harvester during actual field operations, the strong vibrations complicate the interaction between the machine and rice plants, preventing the attainment of the most ideal working conditions and adversely affecting the quality of the harvesting. Consequently, further field harvesting tests will be conducted to validate the harvest quality on various terrains. Future research will also involve further exploration of related agricultural implements.

4. Conclusions

In this research, a self-designed offset sliding-cut comb tooth was employed as the study object and simulation tests were conducted based on DEM to analyze the interaction mechanism between the combs and rice plants. The sliding-cut effect of the offset sliding-cut combs on the rice plants during the harvesting process of the preharvest threshing device was analyzed. Through bench tests, the influence of various working parameters of the preharvest threshing device on the harvest quality and the optimal working parameters combination was explored. The following conclusions were obtained:
(1) The harvesting process and the interaction mechanism between the preharvest threshing device and rice were analyzed, and it was demonstrated that the various functional zones of the designed sliding-cut combs can achieve their respective functions during the operation, collaborating to efficiently sliding cut rice grains.
(2) A DEM model was created to effectively represent the characteristics of rice at harvest time, and simulations were performed utilizing this model. According to the simulation findings, the optimal sliding-cut effect was observed with a rotation speed of 700 r/min, a forward velocity of 0.7 m/s, and a threshing height of 845 mm.
(3) Interactions exist between the forward velocity and rotation speed, the threshing height and rotation speed, and the threshing height and forward velocity, all of which significantly influence the loss rate and the rate of impurities in the harvest. As the numerical values of these experimental factors increase, there is a notable trend where both the loss rate and the impurity rate first decrease and then subsequently increase.
(4) When the rotation speed was 616 r/min, the forward velocity was 0.91 m/s, and the threshing height was 792 mm, the grain loss rate and the impurity rate reached their lowest values, which were 1.997% and 4.073%, respectively. Subsequent research will include field verification tests to further confirm the efficacy of this parameter combination.

Supplementary Materials

The following supporting information can be downloaded at: https://www.mdpi.com/article/10.3390/agriculture14020183/s1, Table S1. Discrete element model parameters for entire-plant rice.

Author Contributions

Conceptualization, J.W.; methodology, H.T. and Y.X.; software, F.G.; validation, F.G., J.Z. and R.L.; formal analysis, F.G.; investigation, J.Z.; resources, H.T. and X.S.; data curation, F.G.; writing—original draft preparation, J.W.; writing—review and editing, F.G.; visualization, F.G.; supervision, H.T., W.Z. and Q.W.; project administration, H.T.; funding acquisition, J.W. All authors have read and agreed to the published version of the manuscript.

Funding

This research was funded by the Program on Industrial Technology System of National Rice (CN), grant number CARS-01.

Institutional Review Board Statement

Not applicable.

Data Availability Statement

Data is contained within the article or Supplementary Materials.

Acknowledgments

The authors would like to thank their schools and colleges, as well as the funding providers of the project. All support and assistance are sincerely appreciated.

Conflicts of Interest

The authors declare no conflicts of interest.

Abbreviations

Notation
αAInitial sliding-cut angle (deg)
αBFinal sliding-cut angle (deg)
φFriction angle between the edge curve material and rice stem (deg)
μCoefficient of rolling friction between main-stem and steel, the value is 0.208
FdTraction of the device (N)
FfTangential friction force between rice stem and cutting edge (N)
FnNormal pressure of rice stem on cutting edge (N)
FcCentripetal force on cutting edge (N)
FzResistance force of the rice stem to the cutting edge in the forward direction (N)
SWidth of the comb (mm)
HHeight of the comb (mm)
l1Residual loss (g)
l2Falling loss (g)
m1Grain mass (g)
m2Impurity mass (g)
RlGrain loss rate (%)
RiImpurity rate (%)
rRotation speed (r/min)
vForward velocity (m/s)
hThreshing height (mm)
KNumber of times the combs hit the rice per unit length

References

  1. Ma, Z.; Zhu, Y.; Chen, S.; Traore, S.N.; Li, Y.; Xu, L.; Shi, M.; Zhang, Q. Field Investigation of the Static Friction Characteristics of High-Yielding Rice during Harvest. Agriculture 2022, 12, 327. [Google Scholar] [CrossRef]
  2. Bandumula, N. Rice Production in Asia: Key to Global Food Security. Proc. Natl. Acad. Sci. India Sect. B Biol. Sci. 2018, 88, 1323–1328. [Google Scholar] [CrossRef]
  3. Fahad, S.; Adnan, M.; Noor, M.; Arif, M.; Alam, M.; Khan, I.A.; Ullah, H.; Wahid, F.; Mian, I.A.; Jamal, Y.; et al. Major Constraints for Global Rice Production. In Advances in Rice Research for Abiotic Stress Tolerance; Elsevier: Amsterdam, The Netherlands, 2019; pp. 1–22. ISBN 978-0-12-814332-2. [Google Scholar]
  4. Muthayya, S.; Sugimoto, J.D.; Montgomery, S.; Maberly, G.F. An Overview of Global Rice Production, Supply, Trade, and Consumption. Ann. N. Y. Acad. Sci. 2014, 1324, 7–14. [Google Scholar] [CrossRef]
  5. Chandio, A.A.; Gokmenoglu, K.K.; Khan, I.; Ahmad, F.; Jiang, Y. Does Internet Technology Usage Improve Food Production? Recent Evidence from Major Rice-Producing Provinces of China. Comput. Electron. Agric. 2023, 211, 108053. [Google Scholar] [CrossRef]
  6. Peng, S.; Zheng, C.; Yu, X. Progress and Challenges of Rice Ratooning Technology in China. Crop Environ. 2023, 2, 5–11. [Google Scholar] [CrossRef]
  7. Shi, M.; Paudel, K.P.; Chen, F. Mechanization and Efficiency in Rice Production in China. J. Integr. Agric. 2021, 20, 1996–2008. [Google Scholar] [CrossRef]
  8. Qu, X.; Kojima, D.; Nishihara, Y.; Wu, L.; Ando, M. Impact of Rice Harvest Loss by Mechanization or Outsourcing: Comparison of Specialized and Part-Time Farmers. Agric. Econ. Zemědělská Ekon. 2020, 66, 542–549. [Google Scholar] [CrossRef]
  9. Hasan, K.; Tanaka, T.S.; Alam, M.; Ali, R.; Saha, C.K. Impact of Modern Rice Harvesting Practices over Traditional Ones. Rev. Agric. Sci. 2020, 8, 89–108. [Google Scholar] [CrossRef]
  10. Yamasaki, H.; Horio, M.; Fujita, K. Research on Fuel Consumption in Harvesting Paddy Rice Plant with Head-Feeding Combine Harvesters. Biosyst. Eng. 2021, 202, 96–105. [Google Scholar] [CrossRef]
  11. Bhanage, G.B.; Shahare, P.U.; Aware, V.V.; Dekhale, J.S. Development of Paddy Stripper Header Mechanism. Int. J. Agric. Eng. 2017, 10, 179–185. [Google Scholar] [CrossRef]
  12. Ince, A.; Say, S.M.; Kara, O.; Bilgili, E. Comparing of different harvesting systems in wheat harvesting. J. Agric. Mach. Sci. 2011, 7, 89–93. [Google Scholar]
  13. Wilkins, D.E.; Douglas, C.L., Jr.; Pikul, J.L., Jr. Header Loss for Shelbourne Reynolds Stripper-Header Harvesting Wheat. Appl. Eng. Agric. 1996, 12, 159–162. [Google Scholar] [CrossRef]
  14. Siemens, M.C.; Hulick, D.E. A New Grain Harvesting System for Single-Pass Grain Harvest, Biomass Collection, Crop Residue Sizing, and Grain Segregation. Trans. ASABE 2008, 51, 1519–1527. [Google Scholar] [CrossRef]
  15. Tang, H.; Xu, C.; Zhao, J.; Wang, J. Stripping Mechanism and Loss Characteristics of a Stripping-Prior-to-Cutting Header for Rice Harvesting Based on CFD-DEM Simulations and Bench Experiments. Biosyst. Eng. 2023, 229, 116–136. [Google Scholar] [CrossRef]
  16. Wang, J.; Xu, C.; Tian, L.; Wang, J.; Tang, H. Study on the Throwing Mechanism and Loss Characteristics of Three-Dimensional Disturbance Comb. Comput. Electron. Agric. 2022, 201, 107283. [Google Scholar] [CrossRef]
  17. Zhao, H.; Huang, Y.; Liu, Z.; Liu, W.; Zheng, Z. Applications of Discrete Element Method in the Research of Agricultural Machinery: A Review. Agriculture 2021, 11, 425. [Google Scholar] [CrossRef]
  18. Wang, Q.; Mao, H.; Li, Q. Simulation of Vibration Response of Flexible Crop Stem Based on Discrete Element Method. Nongye Jixie XuebaoTransactions Chin. Soc. Agric. Mach. 2020, 51, 131–137. [Google Scholar] [CrossRef]
  19. Wang, Q.; Mao, H.; Li, Q. Modelling and Simulation of the Grain Threshing Process Based on the Discrete Element Method. Comput. Electron. Agric. 2020, 178, 105790. [Google Scholar] [CrossRef]
  20. Jia, H.; Deng, J.; Deng, Y.; Chen, T.; Wang, G.; Sun, Z.; Guo, H. Contact Parameter Analysis and Calibration in Discrete Element Simulation of Rice Straw. Int. J. Agric. Biol. Eng. 2021, 14, 72–81. [Google Scholar] [CrossRef]
  21. Liu, Y.; Li, Y.; Zhang, T.; Huang, M. Effect of Concentric and Non-Concentric Threshing Gaps on Damage of Rice Straw during Threshing for Combine Harvester. Biosyst. Eng. 2022, 219, 1–10. [Google Scholar] [CrossRef]
  22. Xu, C.; Xu, F.; Tang, H.; Wang, J. Determination of Characteristics and Establishment of Discrete Element Model for Whole Rice Plant. Agronomy 2023, 13, 2098. [Google Scholar] [CrossRef]
  23. Zhang, C.; Chen, L.; Xia, J.; Zhang, J. Effects of Blade Sliding Cutting Angle and Stem Level on Cutting Energy of Rice Stems. Int. J. Agric. Biol. Eng. 2019, 12, 75–81. [Google Scholar] [CrossRef]
  24. Yang, X.; Chen, B.; Xing, H.; Zhen, W.; Qi, L. Design and experiments of the side-deep fertilization device with slidingknife furrow opener and pneumatic ejector for a liquid fertilizer atomizer. Trans. Chin. Soc. Agric. Eng. 2023, 39, 13–25. [Google Scholar] [CrossRef]
  25. Li, D.; Li, B.; Long, S.; Feng, H.; Xi, T.; Kang, S.; Wang, J. Rice Seedling Row Detection Based on Morphological Anchor Points of Rice Stems. Biosyst. Eng. 2023, 226, 71–85. [Google Scholar] [CrossRef]
  26. Xu, L.; Li, Y. Modeling and experiment to threshing unit of stripper combine. Afr. J. Biotechnol. 2011, 10, 4106–4113. [Google Scholar]
  27. Wang, J.; Xu, C.; Xu, Y.; Wang, Z.; Qi, X.; Wang, J.; Zhou, W.; Tang, H.; Wang, Q. Influencing Factors Analysis and Simulation Calibration of Restitution Coefficient of Rice Grain. Appl. Sci. 2021, 11, 5884. [Google Scholar] [CrossRef]
  28. Massah, J.; Khazaei, J. Simultaneous Measurement of Rice Grain Friction Coefficient and Angle of Repose Using Rotating Cylinders. J. Appl. Bot. Food Qual. 2022, 95, 60–66. [Google Scholar] [CrossRef]
  29. Han, Y.; Li, G.; Jia, F.; Meng, X.; Chu, Y.; Chen, P.; Bai, S.; Zhao, H. Analysis of Breakage Behavior of Rice under Impact. Powder Technol. 2021, 394, 533–546. [Google Scholar] [CrossRef]
  30. ISO 8210:2021; Equipment for Harvesting Combine Harvesters Test Procedure and Performance Assessment. International Organization for Standardization: Vernier, Switzerland, 2021.
  31. Wang, B.; Lei, J.; Qin, X.; Wang, W.; Wang, J.; Ren, Z.; Zhai, Z. Analysis and experiments of the cutting parameters for seabuckthorn branches double movable blades. Trans. Chin. Soc. Agric. Eng. 2023, 39, 26–36. [Google Scholar] [CrossRef]
  32. Liu, J.; Zhao, D.; Zhao, J. Study of the Cutting Mechanism of Oil Tree Peony Stem. Forests 2020, 11, 760. [Google Scholar] [CrossRef]
Figure 1. Structure of preharvest threshing device: (a) overall structure and working principle; (b) structure of sliding-cut comb and threshing cylinder; and (c) physical structure of sliding-cut comb.
Agriculture 14 00183 g001
Figure 2. Diagram of cutting-edge curve.
Agriculture 14 00183 g002
Figure 3. Force analysis on point M along the cutting-edge curve.
Agriculture 14 00183 g003
Figure 4. Extraction of bionic indices of rice and establishment of discrete element models: (a) extraction of bionic indices of rice; and (b) establishment of a discrete element model for entire-plant rice.
Agriculture 14 00183 g004
Figure 5. Simulation test environment for the preharvest threshing device.
Agriculture 14 00183 g005
Figure 6. Bench test. (a) Environment and equipment of the bench test; (b) residual loss; (c) falling loss; and (d) threshing materials of mixed grains and stems. 1—laptop computer, 2—fan, 3—frequency converter control cabinet, 4—trolley, 5—rice clamping device, 6—paddy nose, 7—threshing cylinder, 8—sliding-cutting comb, 9—supporting frame, 10—driving motor, 11—lighting strip, 12—acrylic organic glass, 13—vertical collection device, 14—high speed camera, 15—horizonal collection device, and 16—data transfer cable.
Agriculture 14 00183 g006
Figure 7. Various stages of preharvest threshing: (a) stages of preharvest threshing (side view); and (b) threshing stage (axonometric view).
Agriculture 14 00183 g007
Figure 8. Sliding-cut effect and offset effect in threshing process: (a) overview diagram of the threshing process; and (b) detailed characteristics of the interaction and particle velocity during the harvesting stage.
Agriculture 14 00183 g008
Figure 9. Movement of the rice grains and amount of the broken bonds during the sliding-cut process under different rotation speeds: (a) variation curve of the rice grain speed with the contact time under different rotation speeds; and (b) amount of broken bonds under different rotation speeds. BWG represents the amount of broken bonds with grain; BWI represents the amount of broken bonds with impurities.
Agriculture 14 00183 g009
Figure 10. Movement of rice grains and amount of broken bonds during the sliding-cut process under different threshing heights: (a) variation curve of the rice grain velocity with contact time under different threshing heights; and (b) amount of broken bonds under different threshing heights. BWG represents the amount of broken bonds with grain; BWI represents the amount of broken bonds with impurities.
Agriculture 14 00183 g010
Figure 11. Movement of rice grains and amount of broken bonds during the sliding-cut process under different forward velocities: (a) variation curve of the rice grain total energy with contact time under different forward velocities; and (b) amount of broken bonds under different forward velocities. BWG represents the amount of broken bonds with grain; BWI represents the amount of broken bonds with impurities.
Agriculture 14 00183 g011
Figure 12. Results of the single-factor bench test: (a) variation in the grain loss rate and impurity rate under different rotation speeds; (b) variation in the grain loss rate and impurity rate under different forward velocities; and (c) variation in the grain loss rate and impurity rate under different threshing heights.
Agriculture 14 00183 g012
Figure 13. Typical detail characteristics of threshing materials: (a) schematic diagram of typical detail characteristics of threshing materials; and (b) typical detail characteristics of threshing materials captured by the high-speed camera. Characteristic A—impurity wrapped around the cylinder; Characteristic B—impurity thrown after several rotations; Characteristic C—splash loss; Characteristic D—residual loss; Characteristic E—return loss.
Agriculture 14 00183 g013
Figure 14. Effect of the working parameters on the grain loss rate and impurity rate: (a) effect of the forward velocity and the rotation speed on grain loss rate; (b) effect of the threshing height and the rotation speed on grain loss rate; (c) effect of the threshing height and the forward velocity on grain loss rate; (d) effect of the forward velocity and the rotation speed on impurity rate; (e) effect of the threshing height and the rotation speed on impurity rate; and (f) effect of the threshing height and the forward velocity on impurity rate.
Agriculture 14 00183 g014aAgriculture 14 00183 g014b
Table 1. Response surface optimization experiment coding table.
LevelTest Factor
Rotation Speed r (r/min)Forward Velocity v (m/s)Threshing Height h (mm)
1.6827001.10820
16601.02810
06000.90795
−15400.78780
−1.6825000.70770
Table 2. Analysis of variance.
SourceSum of SquaresDegree of FreedomMean SquareF-Valuep-ValueSignificance
Y1Model4.9890.5531236.31<0.0001**
X10.690510.6905295.01<0.0001**
X20.285210.2852121.85<0.0001**
X30.112310.112347.96<0.0001**
X1X20.088210.088237.680.0001*
X1X30.014410.01446.170.0323*
X2X30.024210.024210.340.0092*
X 1 2 2.7612.761177.09<0.0001**
X 2 2 0.753410.7534321.88<0.0001**
X 3 2 0.874410.8744373.58<0.0001**
Residual0.0234100.0023
Lack of Fit0.011650.00230.98360.507#
Pure error0.011850.0024
Cor Total519
Y2Model3.5690.3957164.43<0.0001**
X10.091910.091938.160.0001*
X20.116410.116448.37<0.0001**
X30.121310.121350.41<0.0001**
X1X20.214510.214589.13<0.0001**
X1X30.308110.3081128.02<0.0001**
X2X30.127510.127552.98<0.0001**
X 1 2 0.932410.9324387.42<0.0001**
X 2 2 1.0711.07443.14<0.0001**
X 3 2 1.0911.09454.74<0.0001**
Residual0.0241100.0024
Lack of Fit0.010650.00210.7850.6015#
Pure error0.013550.0027
Cor Total3.5919
Note: ** denotes extremely significant (p < 0.01), * denotes significant (p < 0.05), # denotes insignificant (p > 0.05).
Disclaimer/Publisher’s Note: The statements, opinions and data contained in all publications are solely those of the individual author(s) and contributor(s) and not of MDPI and/or the editor(s). MDPI and/or the editor(s) disclaim responsibility for any injury to people or property resulting from any ideas, methods, instructions or products referred to in the content.

