Article

Insights into Drought Tolerance of Tetraploid Wheat Genotypes in the Germination Stage Using Machine Learning Algorithms

1
Department of Field Crops, Faculty of Agriculture, Ankara University, 06110 Ankara, Türkiye
2
Department of Agricultural Biotechnology, Faculty of Agriculture, Igdır University, 76000 Igdir, Türkiye
3
Department of Field Crops, Faculty of Agriculture, Necmettin Erbakan University, 42310 Konya, Türkiye
4
Department of Field Crops, Faculty of Agriculture, Atatürk University, 25240 Erzurum, Türkiye
5
Department of Field Crops, Faculty of Agriculture, Erciyes University, 38000 Kayseri, Türkiye
6
Department of Biosystems Engineering, Faculty of Environmental and Mechanical Engineering, Poznań University of Life Sciences, Wojska Polskiego 50, 60-627 Poznań, Poland
7
Department of Botany and Nature Protection, Institute of Biology, Pomeranian University in Słupsk, 22b Arciszewskiego St., 76-200 Słupsk, Poland
*
Authors to whom correspondence should be addressed.
Agriculture 2024, 14(2), 206; https://doi.org/10.3390/agriculture14020206
Submission received: 4 December 2023 / Revised: 16 January 2024 / Accepted: 20 January 2024 / Published: 27 January 2024
(This article belongs to the Special Issue Digital Innovations in Agriculture—Series II)

Abstract

:
Throughout germination, which represents the initial and crucial phase of the wheat life cycle, the plant is notably susceptible to the adverse effects of drought. The identification and selection of genotypes exhibiting heightened drought tolerance stand as pivotal strategies aimed at mitigating these effects. For the stated objective, this study sought to evaluate the responses of distinct wheat genotypes to diverse levels of drought stress encountered during the germination stage. The induction of drought stress was achieved using polyethylene glycol at varying concentrations, and the assessment was conducted through the application of multivariate analysis and machine learning algorithms. Statistical significance (p < 0.01) was observed in the differences among genotypes, stress levels, and their interaction. The ranking of genotypes based on tolerance indicators was evident through a principal component analysis and biplot graphs utilizing germination traits and stress tolerance indices. The drought responses of wheat genotypes were modeled using germination data. Predictions were then generated using four distinct machine learning techniques. An evaluation based on R-square, mean square error, and mean absolute deviation metrics indicated the superior performance of the elastic-net model in estimating germination speed, germination power, and water absorption capacity. Additionally, in assessing the criterion metrics, it was determined that the Gaussian processes classifier exhibited a better performance in estimating root length, while the extreme gradient boosting model demonstrated superior performance in estimating shoot length, fresh weight, and dry weight. The study’s findings underscore that drought tolerance, susceptibility levels, and parameter estimation for durum wheat and similar plants can be reliably and efficiently determined through the applied methods and analyses, offering a fast and cost-effective approach.

1. Introduction

Wheat holds the distinction of being the primary staple food [1]. Tetraploid wheat is a species that displays heightened vulnerability to abiotic pressures, particularly showing susceptibility to drought [2]. This species exhibits a discerning preference for specific climatic and soil conditions to attain optimal yield and quality and is more responsive to environmental challenges compared to bread wheat [3]. In 2021, durum wheat production in Türkiye decreased by around 21% compared to the previous year [4].
The anticipated climate change and global warming are expected to exacerbate the magnitude of stressors [5]. Plants commonly face a combination of biotic and abiotic stressors within their native environment [6]. However, among all the stressors influenced by climate change, drought emerges as the primary factor hindering plant productivity [7]. Climate change may have varying impacts on crop performance depending on the timing and duration of drought events, as well as whether drought stress occurs alone or in combination with heat stress. In the Mediterranean region, low rainfall and irregularities in the rainfall regime can cause significant yield losses for crops grown under rainfed conditions, such as durum wheat [8]. Drought stress during germination can have severe consequences for the success of the plant’s life cycle, as an inadequate water supply at this stage can hinder the robust growth of roots and shoots, resulting in significant crop losses [9,10].
The global population is undergoing a significant and rapid growth trajectory, with projections estimating that it will reach approximately 9.74 billion individuals by the year 2050 [11]. Simultaneously, there will be an escalating demand for sustenance. To meet the nutritional requirements, it is crucial to cultivate new cultivars that demonstrate high productivity and resilience to both biotic and abiotic challenges [12]. To facilitate the development of novel drought-tolerant cultivars, it is essential to ascertain the tolerance status of existing genotypes [13].
According to Rai et al. [14], obtaining accurate and dependable outcomes may be achieved by performing selection during the first development phase in controlled laboratory settings. In laboratory settings, NaCl, polyethylene glycol (PEG), sorbitol, and mannitol are often used to induce drought stress in plants [15]. This manipulation serves to augment the dry conditions within the plant’s growth environment, hence impeding water uptake by the plant [16]. High molecular weight polyethylene glycols (PEGs) are often used as stress agents in various studies [17]. This is mostly attributed to their water-soluble nature, lack of toxicity, and inability to be absorbed by plant roots [18].
The examination of yield components, the assessment of yield stability, and the enhancement of stress tolerance represent conventional methodologies in plant breeding [19]. It is paramount to establish a clear and comprehensive understanding of the correlation between improved agricultural features and their reciprocal impacts [20]. In controlled breeding research, the effects of input elements (genotype and treatment factors) on observed plant characteristics (outputs) have been extensively investigated [21,22]. Traditional statistical approaches have been predominantly utilized for the examination and interpretation of outcome variables [23,24]. Analysis of variance, principal component analysis (PCA), and linear regression models are commonly employed techniques to determine the associations between independent input factors and dependent output variables [25].
Machine learning (ML) algorithms are increasingly being employed in various aspects of plant science and agriculture. In addition to these effective approaches, it is noteworthy that ML algorithms, as a subfield of artificial intelligence, possess the capacity to make precise predictions and enhance the efficacy of various intricate biological systems. Frequently employed for acquiring knowledge and constructing models optimized for specific tasks, ML algorithms undergo a learning process from data. Their objective is to provide predictions for a designated target variable using knowledge acquired from the data’s properties [20,26,27]. Presently, the determination of drought tolerance, susceptibility levels, and the estimation of observed parameters in plants can be reliably accomplished using ML systems in the fastest, most cost-effective, and practical manner through the applied methods and analyses.
The objective of this study was to investigate common tetraploid wheat genotypes in Türkiye to determine their drought tolerance at the initial growth stage using a multivariate analysis and stress tolerance indices. Furthermore, the study aimed to employ ML algorithms to predict the parameters observed during the early development phase of tetraploid wheat under drought conditions and to present a range of available ML models. Consequently, this research sought to unveil the drought tolerance of varieties and characterize genotypes suitable as parental plants for future breeding-focused studies.

2. Materials and Methods

2.1. Plant Materials

This research was conducted at Ankara University, Faculty of Agriculture, Department of Field Crops. The study utilized eleven varieties extensively employed in durum wheat cultivation in Türkiye, along with one hulled tetraploid wheat genotype, emmer (Triticum dicoccum), sourced from the Kars province of Türkiye (Table 1). The selected genotypes in our study have been registered in arid and semi-arid regions of Türkiye.

2.2. Treatment Conditions and Plant Growth

The seeds underwent sterilization in 5% commercial bleach (NaClO) for a duration of twenty minutes, followed by thorough washing with distilled water. Germination was carried out in dark conditions at a temperature of 25 ± 1 °C. Drought stress was induced using high molecular weight polyethylene glycol (PEG 6000) following the protocol outlined by Michel and Kaufmann [28]. The levels of drought intensity (−0.50, −1.48, −2.95, and −4.91 bar) were determined based on the work of previous researchers who deemed them appropriate [29]. Data collection was conducted in accordance with the measurements and counts established on the fourth and eighth days, following the guidelines provided by the International Seed Testing Association (ISTA) [30].
Germination was considered complete when the radicles reached a length of 2 mm. Subsequently, on the fourth day, the number of germinated seeds was recorded, and the germination rate (GS) was calculated. On the eighth day, the germination strength (GP) was determined by counting the germinated seeds. Additionally, the root length (RL) was measured as the longest root formed by the seed, the shoot length (SL) was measured as the endpoint of the plumule emerging from the coleoptile, and the fresh weight (FW) was determined by weighing all embryonic roots, the coleoptile, and the plumule immediately [31,32]. To calculate the dry weight (DW) of the plants, fresh samples underwent a drying process at 105 °C for two hours, and the subsequent mass was recorded. The water absorption capacity (WAC) was determined by calculating the difference between the FW and DW, and the percentage rate was subsequently computed.
Fischer and Maurer [33] proposed the stress susceptibility index (SSI) as a means of measuring trait stability, considering changes in both potential and actual traits in variable environments. Clarke et al. [34] evaluated the drought tolerance of wheat genotypes using the SSI and found different annual variations in the SSI for different genotypes, allowing a ranking of their patterns. An SSI > 1 in spring wheat cultivars indicates an above-average susceptibility to drought stress, according to Guttieri et al. [35]. A smaller value of SSI is preferred as larger values indicate a greater sensitivity to stress. Fernandez [36] proposed the Stress Tolerance Index (STI) as a tool for identifying genotypes that exhibit high grain yield under contrasting conditions. The STI is designed to identify genotypes with favorable characteristics for the examined traits under both stressful and normal conditions.
Ypi = The value of observed feature of each genotype under normal conditions (control)
Ysi = The value of the feature of each genotype under stressful conditions
Yp = The mean of the features of the genotypes examined under normal conditions (control)
Ys = The mean of the features of the genotypes examined under stressful conditions
-
Stress tolerance index: STI =   Y p i   ×   Y s i Y p 2
-
Stress intensity: SI = 1 Y s Y p
-
Stress susceptibility index: (SSI) = 1 ( Y s i Y p i ) S I

2.3. Experiment Design and Statistical Analysis

A completely randomized design was employed with four replications per genotype and per stress level. A unit of replication were a Petri dish containing 50 seeds. Statistical analyses of the acquired data were conducted using JMP 13.2.0 with SAS software version 9.4. The impacts of genotype and stress level on germination responses were assessed through analysis of variance and Duncan tests. PCA was carried out using standardized average values for each germination parameter and the STI value for genotypes, providing insight into their tolerance or susceptibility to drought stress. The dissimilarity between genotypes was calculated using Ward’s method of clustering. Correlations between the examined traits of tetraploid wheat genotypes under control and drought stress treatments were computed using JMP 13.2.0 [37].

2.4. Machine Learning Analysis and Model Assessment

The primary aim of this study was to determine the relationships between input variables (genotype and drought stress) and the output variable (observed germination parameters) to develop a predictive model. Four ML techniques were employed, namely support vector machines (SVM) [38], extreme gradient boosting (XGBoost) [39], elastic-net (ELANET) [40], and the Gaussian processes classifier (GPC) [41]. The evaluation of algorithm performance utilized three key metrics: root mean square error (MSE), R-squared (R2), and mean absolute deviation (MAD). The coefficient of determination, denoted as R2, gauges the extent to which the model (Equation (1)) replicates the observed data. MSE measures the proximity between the predicted and actual values, as expressed by Equation (2). Additionally, the root MAD characterizes the overall distribution of prediction errors, as outlined in Equation (3) [20,26,27]. The dataset was randomly divided into two sets using the caret package in the R software (version 4.3.2): the training set (70%) and the testing set (30%). The Grid Search Cross-Validation (GCV) method was employed to identify the optimal hyperparameters for each ML model, as indicated by Equation (4) [42].
R 2 = 1 i = 1 n y i y i p 2 i = 1 n y i y ¯ 2
M S E = 1 n i = 1 n y i y i p 2
M A D = 1 n i = 1 n y i y i p
GCV ( λ ) = i = 1 n y i y ip 2 1 M ( λ ) n 2
where n is the training/testing sample size in the dataset, y i is the measured real value, y i p is the predicted value, and y ¯ is the measured values mean. M(λ) is the penalty function for the complexity of the model covering λ terms. The R program was used for the computation of ML algorithms and performance metrics [26,27].

3. Results

According to the variance analysis of the data, it was determined that the differences among genotypes and stress levels were significant at p < 0.01 for all examined parameters. Additionally, the Genotype × Stress interaction was found to have a significant effect at p < 0.01 on all parameters, except for germination power (Table 2). Figure 1 displays the mean, minimum, and maximum values resulting from the interaction between genotype and stress.

3.1. Germination Speed and Germination Power

The results suggest that the impact of drought stress on germination rate is more significant than its effect on GP. Specifically, compared to the control group, the germination rate of genotypes under −1.48 bar drought stress was significantly reduced. Notably, Artuklu exhibited the highest GS, particularly at −4.91 bar, representing the highest level of drought stress. At this maximum stress level, T. dicoccum displayed the lowest GS (66.6%) (Supplementary Table S1). Considering stress-tolerance indices, the varieties demonstrating the highest tolerance in terms of GS were Eminbey, Kızıltan-91, and Mirzabey 2000 at −0.50 bar drought stress, Altın-40/98 at −1.48 bar drought stress, and Artuklu at −2.95 and −4.91 bar drought stress (Supplementary Table S2). Conversely, based on the SSI, Kunduru-1149, Eminbey, Selçuk-97, and Meram-2002 were significantly affected by drought stress, resulting in a notable reduction in GS. The highest stress-susceptibility indices were observed in Kunduru-1149 at −0.50 bar stress, Eminbey and Selçuklu-97 at −1.48 bar stress, and Meram-2002 at −2.95 bar and −4.91 bar stress levels. Moreover, drought stress had a comparatively lower impact on the germination rate of tetraploid wheat genotypes. It was observed that the GP of these varieties was not affected by the -0.50 bar level, representing the lowest drought stress level, and remained comparable to the control group (Supplementary Table S1). Across the different levels of drought stress, Altın-40/98 displayed the highest average GP, while T. dicoccum exhibited the lowest. According to the STI, Altın-40/98 achieved the highest tolerance values at all stress levels. Conversely, based on the SSI, the varieties whose germination power was most affected by drought stress were identified as Artuklu, Kunduru-1149, and Selçuklu-97 at −0.50 bar, Selçuklu-97 at −1.48 bar, Eminbey at −2.95 bar, and Eminbey and Kunduru-1149 at −4.91 bar (Supplementary Table S2). When the genotypes were analyzed in terms of GS and GP, it became evident that there were significant decreases, especially at the fourth and fifth stress levels.
Even though −0.50 bar represented the lowest drought stress level, it caused a significant reduction in the root length of all genotypes compared to the control group. The decreases in root length persisted with increasing stress levels. Notably, Kızıltan-91 and Sarıçanak 98 exhibited the highest mean root length at different drought stresses. Specifically, Kızıltan-91, at −0.50 bar, −1.48 bar, and −4.91 bar stress levels, and T. dicoccum at the −2.95 bar stress level showed the most robust root formation (Supplementary Table S2). The most tolerant genotypes in terms of root development, according to the STI, were Kızıltan-91 at −0.50 bar and −1.49 bar stresses, Eminbey at −2.95 bar stress, and Kızıltan-91 at −4.91 bar stress. On the other hand, based on the SSI, the genotypes where drought stress significantly affected root development were Çeşit-125 at the −0.50 bar, −1.48 bar, and −2.95 bar drought levels, and Altın-40/98 and Çakmak-79 at −4.91 bar stress (Supplementary Table S2).
Moreover, drought stress had a more pronounced impact on shoot development compared to root development in tetraploid wheat genotypes. When examining the average shoot length of the genotypes, there was an approximately 61% decrease compared to the control group at −0.50 bar, the lowest drought level in the study. The sharp declines in shot length continued with increasing stress levels. Shoots did not occur in some genotypes at drought stresses of −2.95 bar (Çeşit-1252, Meram-2002, and Selçuklu-97) and −4.91 bar (Çakmak-79, Çeşit-1252, Eminbey, Kızıltan-91, Meram-2002, and Selçuklu-97). Eminbey formed the highest shoot length in terms of the general shoot length average of genotypes but could not produce shoots at high-stress levels. However, according to the results under stress pressure, the genotype that produced the most shoots was Sarıçanak 98. When stress tolerance values were considered based on shoot-forming abilities, Eminbey at −0.50 bar stress, Kızıltan-91 at −1.49 bar stress, Altın-40/98 at −2.95 bar stress, and Altın-40/98 and Sarıçanak 98 varieties at −4.91 bar stress had the highest index values. However, according to the SSI, at −0.50 bar drought, Çeşit-1252; at −1.49 bar, Meram-2002; at −2.95 bar, Çeşit-1252, Meram-2002, and Selçuklu-97; at −4.91 bar, Çakmak-79, Çeşit-1252, Eminbey, Kızıltan-91, Kunduru-1149, Meram-2002, and Selçuklu-97 were identified as the most susceptible varieties in terms of shoot elongation (Supplementary Table S2).

3.2. Fresh Dry Weight and Water Absorption Capacity

The FW of tetraploid wheat genotypes were not as significantly affected as root and shoot formation under the pressure of drought. The highest mean FW was observed in the control group, with gradual decreases occurring with increasing stress levels. Specifically, the highest average FW was observed in Eminbey, while the lowest was in Selçuklu-97. FW was measured to be the highest in the control group and at −0.50 bar for Eminbey, at −1.49 bar for Altın 40/98, and at −2.95 and −4.91 bar for Mirzabey-2000 (Supplementary Table S1). According to the STI, the genotype most tolerant regarding FW was Eminbey at −0.50 bar, −2.95 bar, and −4.91 bar stresses, and Altın-40/98 at −1.48 bar stress. On the other hand, based on the SSI in terms of FW, the most vulnerable genotypes were Çeşit-1252 at the −0.50 bar drought level, Meram 2002 at the −1.48 bar, −2.95 bar, and −4.91 bar drought levels (Supplementary Table S2). The DW average was highest in Eminbey and lowest in T. diccoccum. Eminbey consistently had the highest DW values in both the control group and under all stress conditions (Supplementary Table S1). According to the STI, Eminbey displayed the highest tolerance values at all stresses regarding DW. However, based on the SSI, it showed the highest susceptibility in terms of DW, with Çakmak-79 being the most susceptible at the −0.50 bar, −2.95 bar, and −4.91 bar drought levels, and Kunduru-1149 being the most susceptible at the −1.49 bar and 2.95 bar drought levels (Supplementary Table S2).
Furthermore, the water absorption abilities of the tetraploid wheat genotypes exhibited a significant decrease with the increasing pressure of drought because of drought stress. There was a 53% decrease in water absorption averages of the genotypes between stress-free conditions and the highest stress level. The WAC averages at all stress levels were highest for Mirzabey 2000 and lowest for Selçuklu 97. According to the STI, the most tolerant genotypes regarding WAC were Artuklu at −0.50 bar, Altın-40/98 at −1.48 bar, and Mirzabey 2000 at −2.95 bar and −4.91 bar stress. The STI for WAC was highest for Artuklu at −0.50 bar stress, Altın-40/98 at −1.48 bar stress, and Mirzabey 2000 at −2.95 bar and −4.91 bar stresses. Conversely, based on the SSI, the most sensitive varieties in terms of water absorption were Çeşit-1252 at the −0.50 bar and −2.95 bar drought levels, Meram 2002 at the −1.48 bar drought level, and Eminbey at the −4.91 bar drought level.

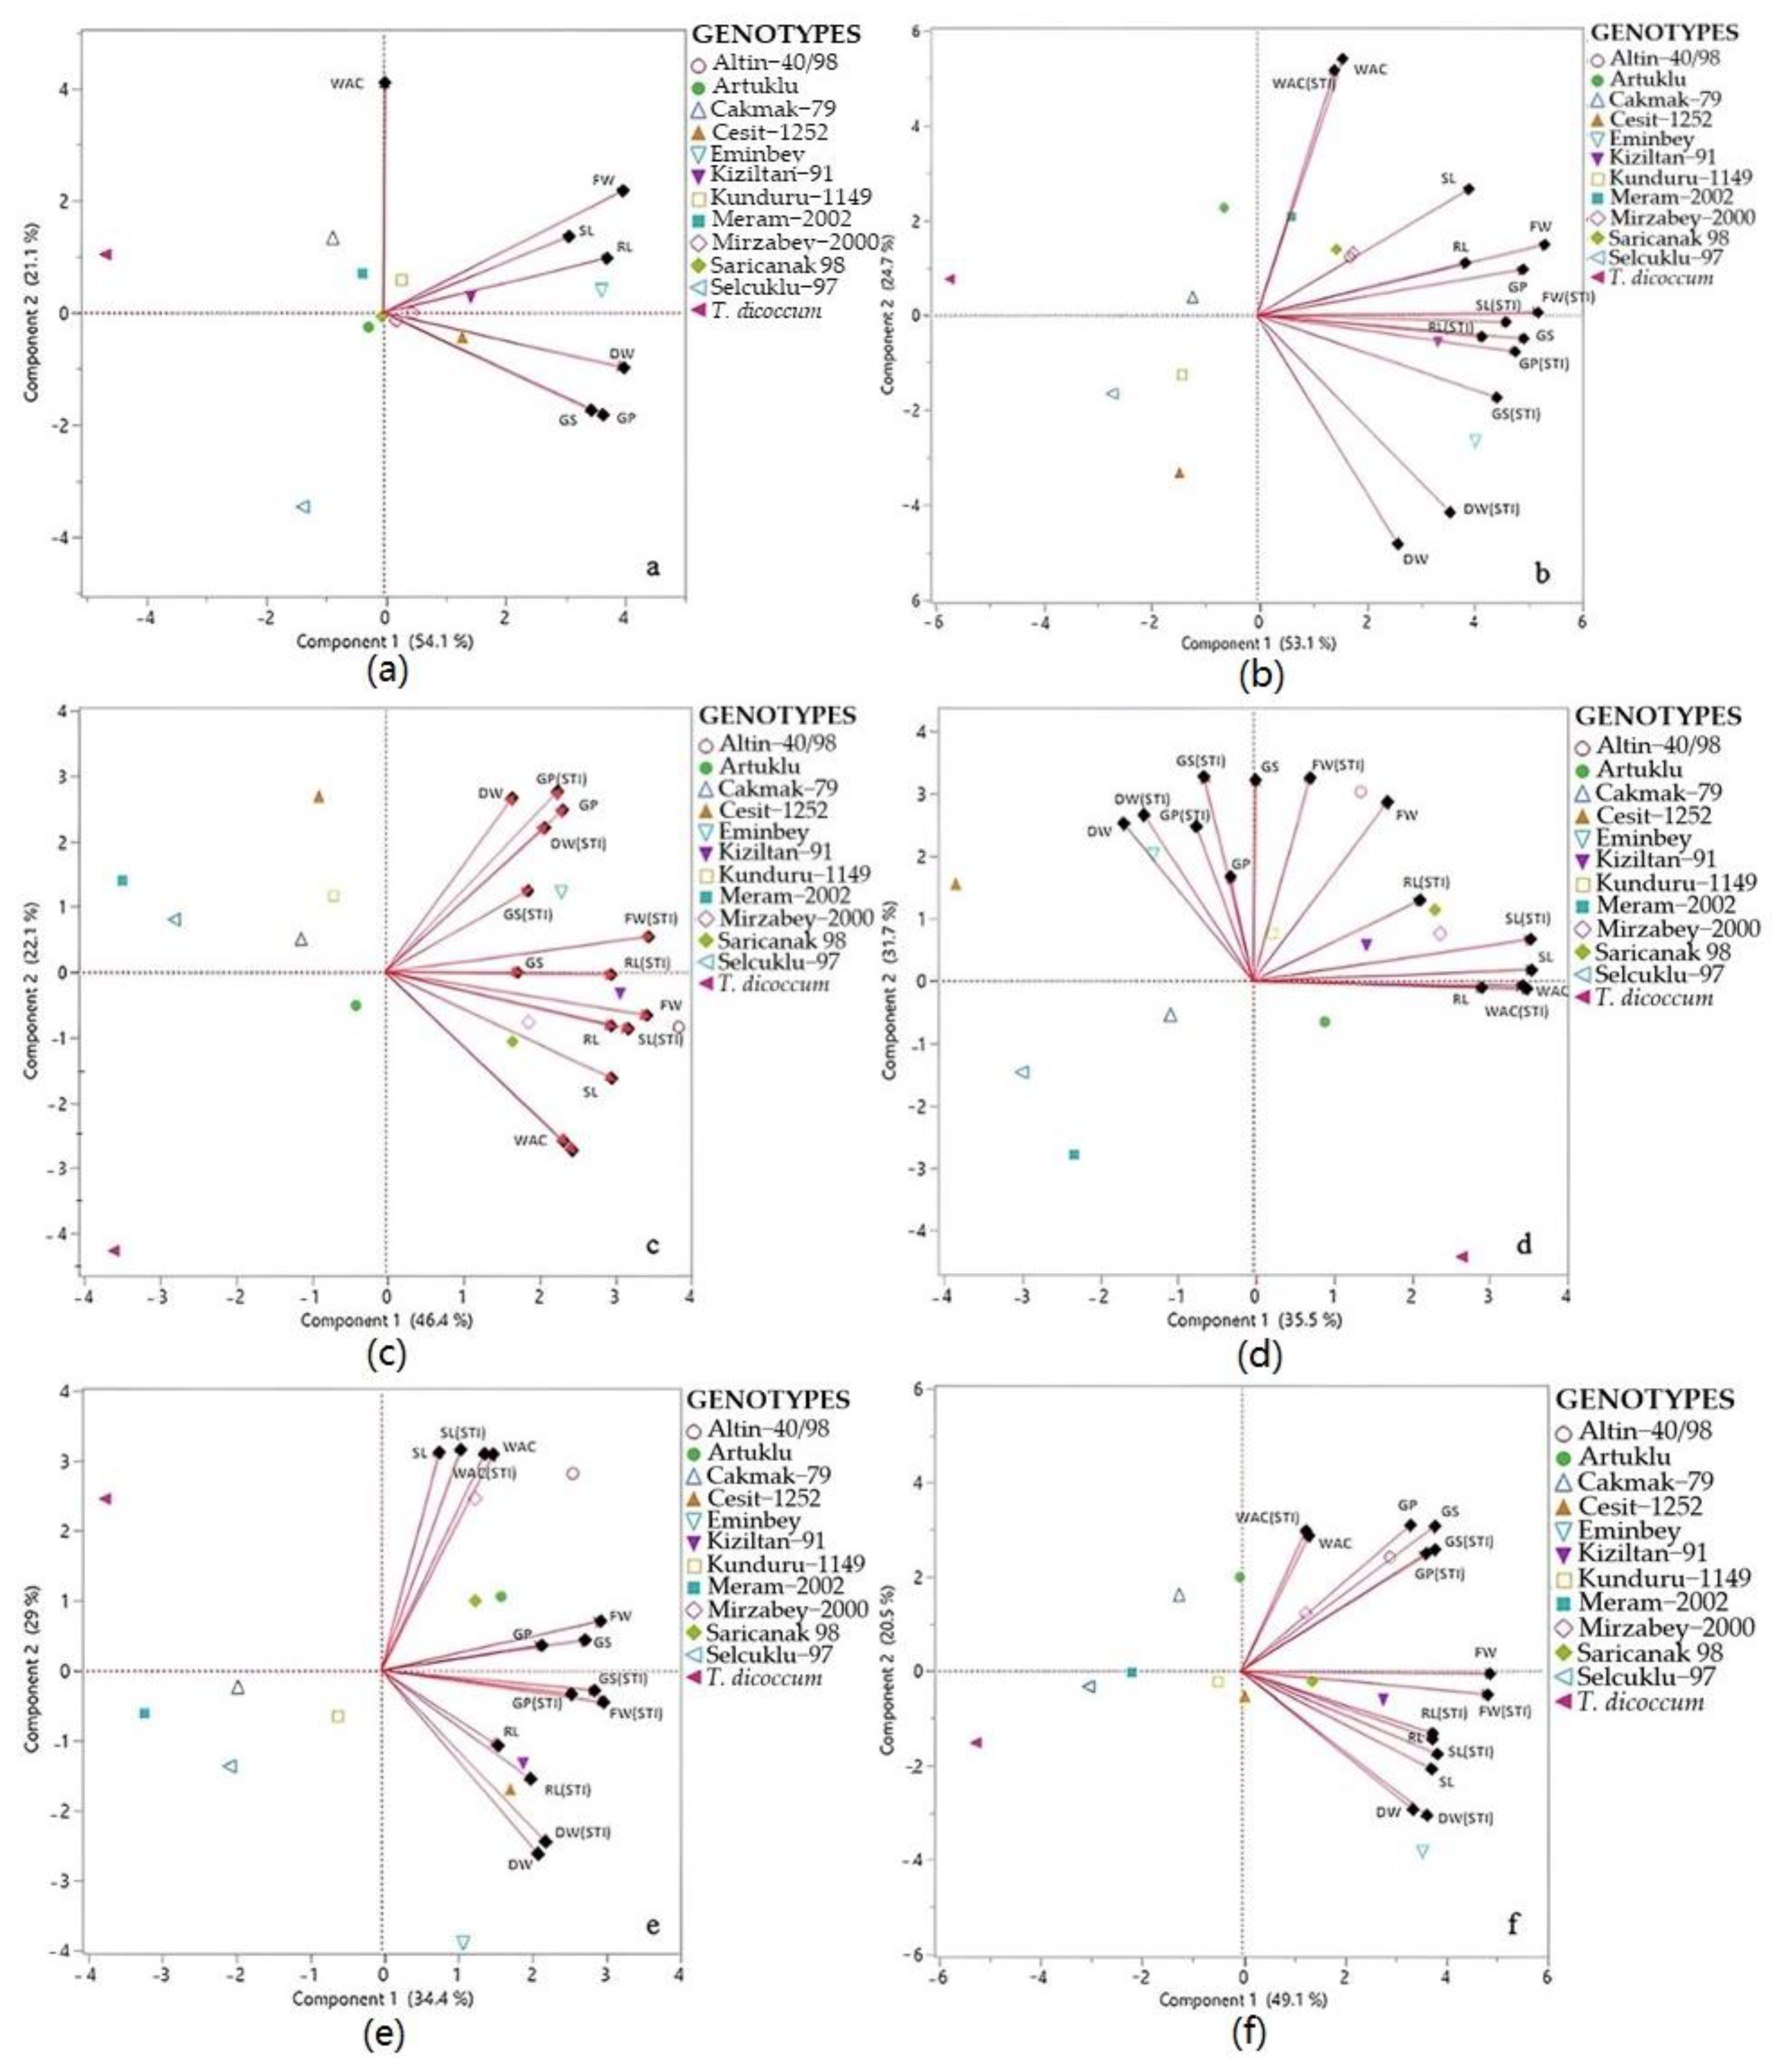
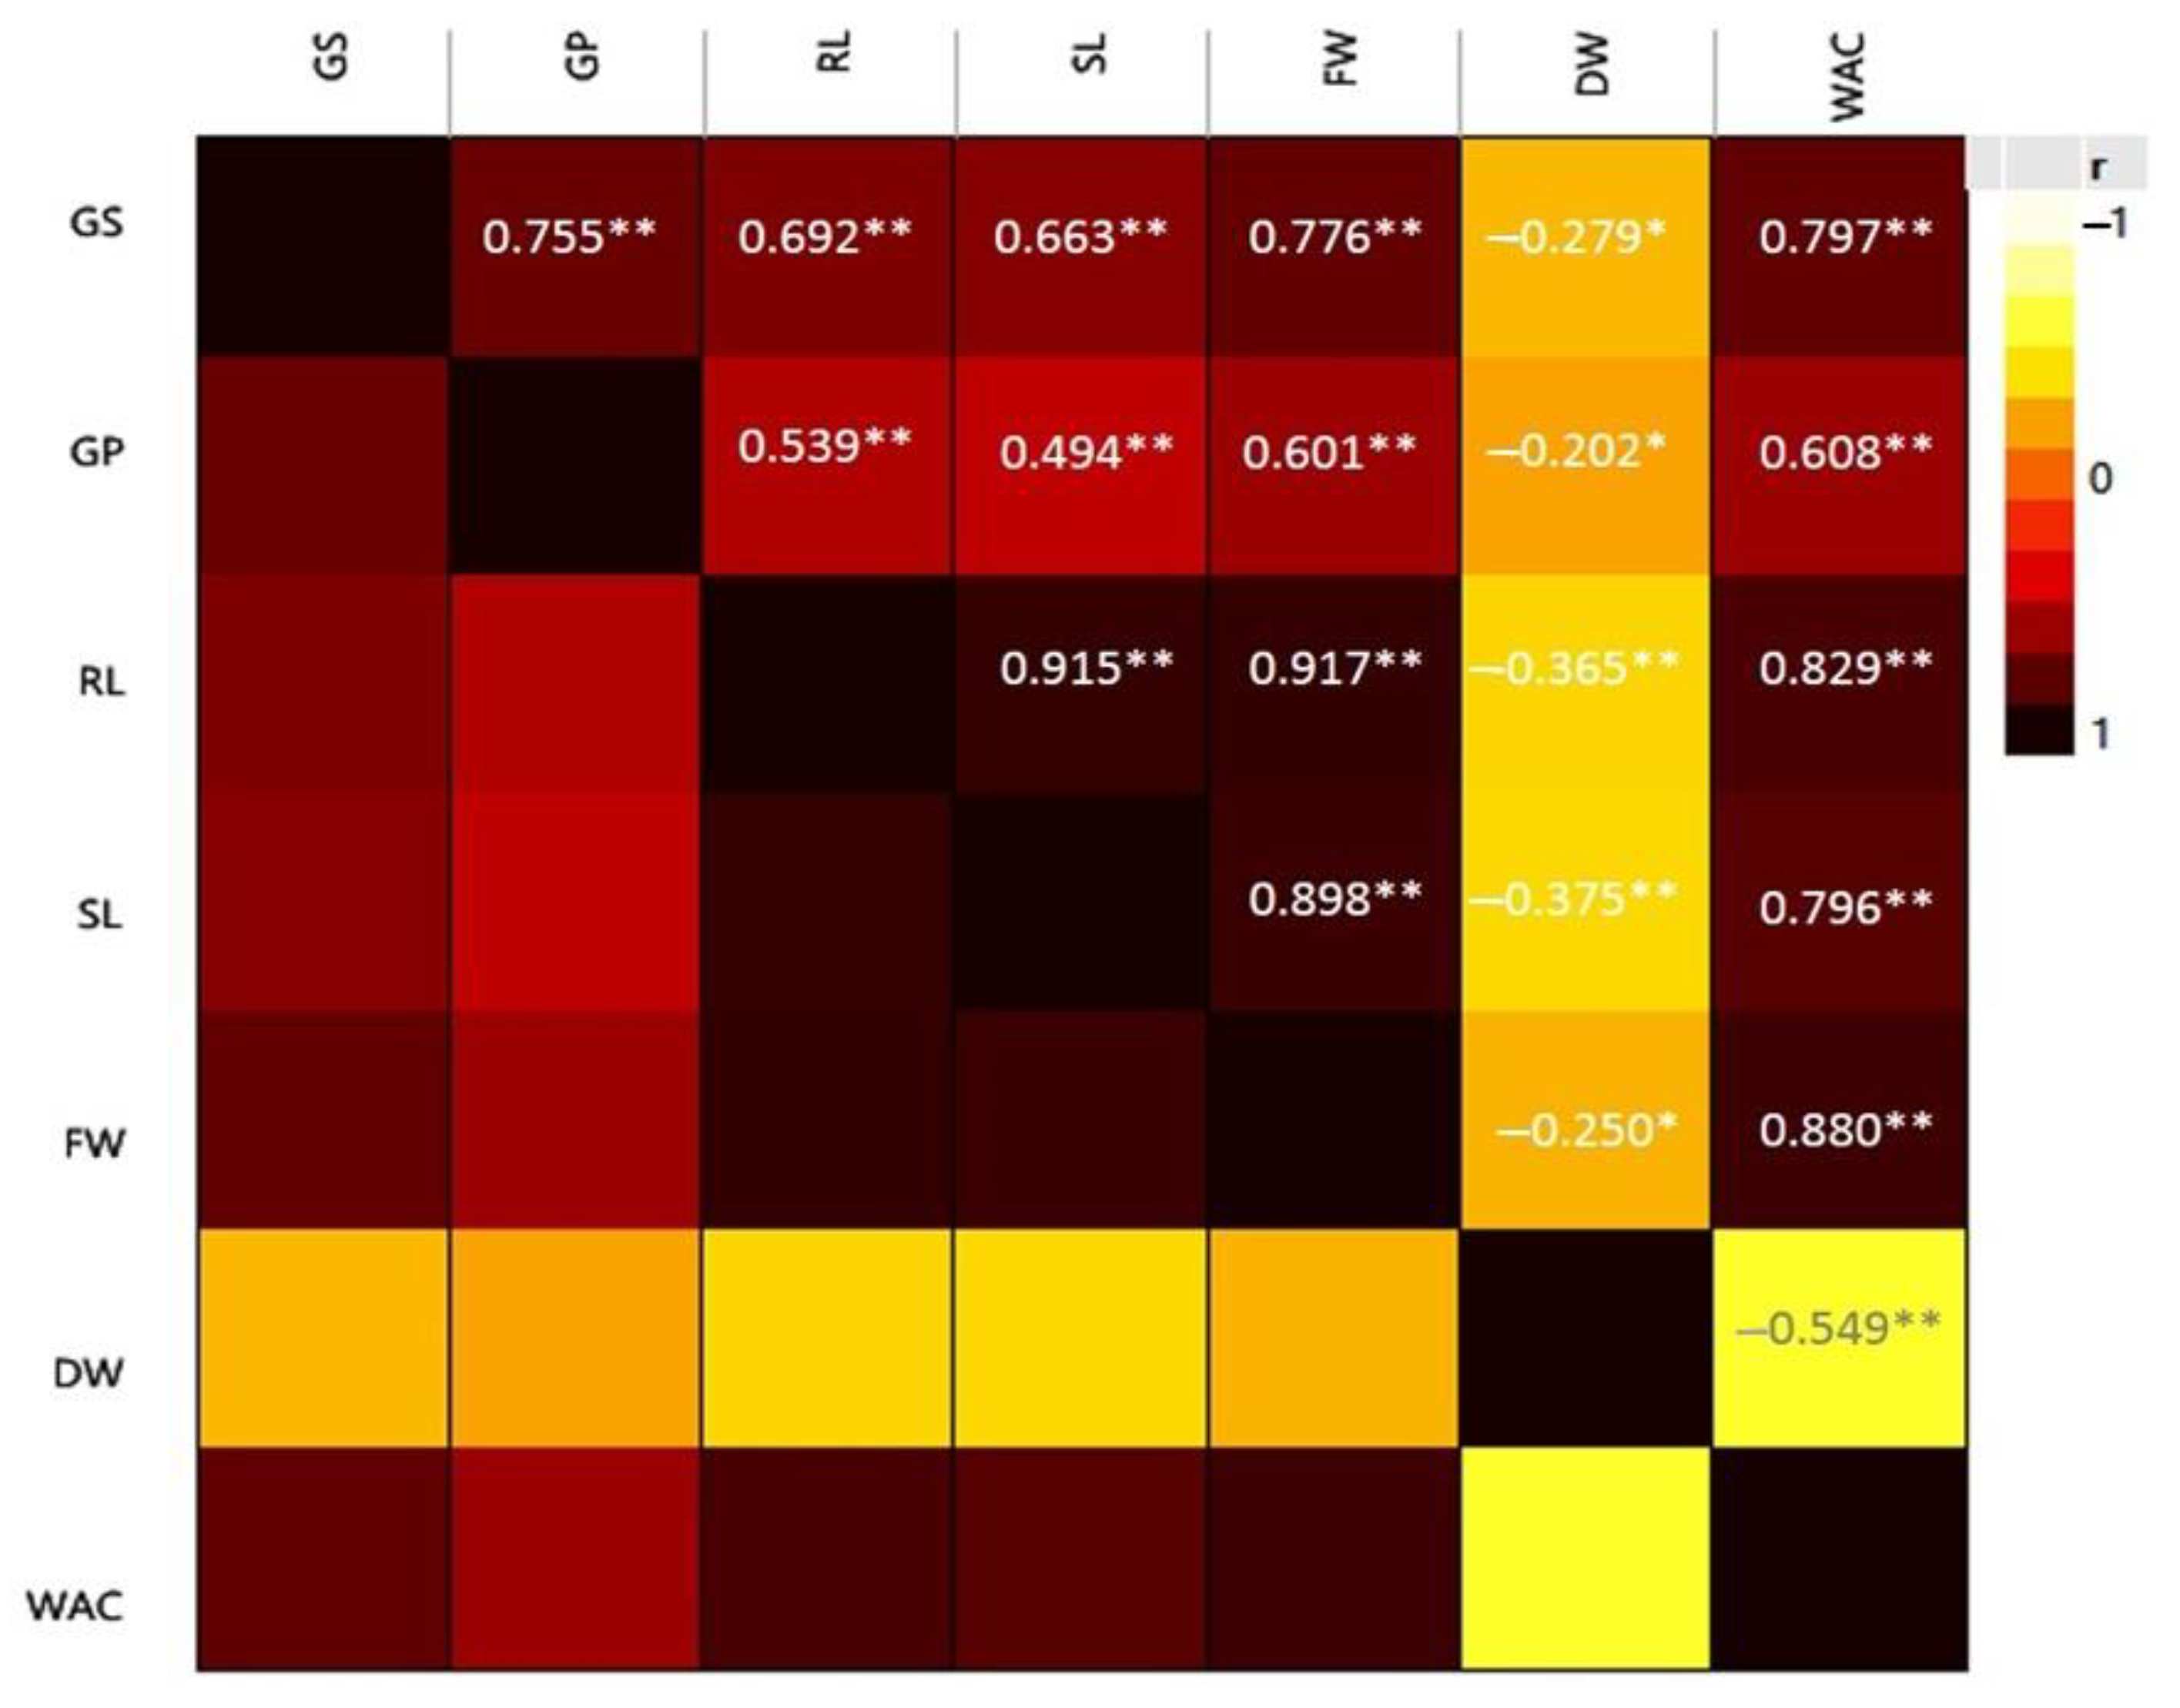
3.3. Multivariate Analysis

The STI and SSI demonstrated inversely proportional values. Therefore, the STI was used in the first PCA. The PCA revealed a high level of variation among the tetraploid wheat genotypes. The distribution of tetraploid wheat genotypes concerning the first two principal components under different drought levels, based on morphological characteristics and STI values, was tabulated in a biplot (Figure 2). The variation examined with PCA indicated that the first two principal components contributed 75.20% of the total variance among the seven variable germination traits under normal conditions. Furthermore, the first two principal components contributed to 77.75%, 68.47%, 67.20%, and 63.37% of the total variance among the seven germination traits and seven STI values for the −0.50 bar, −1.48 bar, −2.95 bar, and −4.91 bar drought stress levels, respectively. Taking into consideration the means of the fourteen values examined, it was determined that the first two principal components constituted 69.63% of the total variation (Supplementary Table S3).
The first two principal components were graphically plotted to illustrate the similarities among genotypes at different drought stress levels (Figure 2). The biplot graphs were designed by computing each feature individually to separate the stress levels, demonstrating the variability of genotypes for the seven morphological traits and seven STI values in the study. The graphical representation on the biplot indicates a wide genetic variability among the genotypes based on their distribution model under different drought stresses (Figure 2). Considering the positive and high values of these two principal components on the biplot, genotypes located near the investigated traits are likely to be highly efficient under both stressed and unstressed conditions. Notably, in the biplot graphs, Selçuklu-97 and Meram-2002 are seen to be in the negative direction of the first two principal components. This suggests that these genotypes are more susceptible to drought stress than others. Throughout all the biplot graphs, T. dicoccum was observed to be located at a distance from the other genotypes, indicating a potential difference in its genetic structure. In the biplot charts, it is evident that Artuklu, Eminbey, Kızıltan-91, and Sarıçanak-98 were distributed near tolerance indicators. This suggests that these genotypes may possess a higher stress tolerance compared to others. The biplot analysis provides valuable insights into the genetic variability and stress response of the tetraploid wheat genotypes under different drought conditions.
In the second biplot analysis (Figure 2), conducted to reveal the relationships among genotypes and all parameters examined, a total of 11 principal component axes were obtained, with five principal component axes having an eigenvalue greater than 1.0. The eigenvalues of these five principal component axes, which collectively account for 91.85% of the total variation, range between 1.06 and 7.45. Upon examining the angles between the axes, a high angle among the SSI(WAC), SSI(GS), and SSI(SL) axes and the STI(WAC), WAC axes suggests a highly negative correlation among these parameters. Conversely, the slight angle between the GP axis and the axes of STI(GS), STI(GP), and GS in the same region reveals a highly positive relationship among these parameters. Considering the axis regions and lengths of all parameters, as well as their angles with each other and the positions of genotypes, T. dicoccum is located alone and in a region opposite to the axes. Considering this analysis, T. dicoccum appears to have the lowest values regarding the examined properties compared to the other genotypes. The biplot analysis provides a comprehensive view of the relationships among the genotypes and various parameters, aiding in the interpretation of the dataset and highlighting the characteristics that contribute most to the observed variability.
Additionally, according to Figure 3, T. dicoccum is positioned in the highest class in parameters close to the Eminbey axis tip, clustered in the same region with the Kızıltan 91 and Altın 40/98 varieties. Upon examining the WAC and STI (WAC) axes, Mirzabey-2000 and Sarıçanak 98 emerge as the leading genotypes (Figure 3, Supplementary Table S2).
To analyze the interactions between genotypes throughout the germination period and to decide which genotypes are appropriate for future breeding programs, a cluster analysis was conducted using the evaluated characteristics of the genotypes that were subjected to drought stress. Understanding the diversity in parents is crucial for the improvement of breeding programs aimed at developing new, tolerant varieties. According to the cluster analysis, the genotypes with the least genetic diversity distance between them concerning GP and stress indexes were identified as Çeşit-1252 and Kunduru-1149. On the other hand, the genotypes with the furthest genetic diversity distance between them were Artuklu and T. dicoccum (Figure 4). The findings suggest that T. dicoccum exhibits distinctive genetic characteristics compared to the other genotypes, particularly in terms of germination performance under drought stress. This differentiation is further emphasized by both the principal component analysis and cluster analysis. These insights can inform future breeding strategies for developing improved, drought-tolerant wheat varieties.
The correlation analysis revealed statistically significant relationships among all parameters. According to the analysis, the highest positive correlation among the quantitative traits was identified between FW and RL (0.917). Conversely, the highest negative correlation was observed between WAC and DW (−0.549). Notably, there was a consistent negative correlation between DW and all the other parameters (Figure 5).

3.4. Machine Learning (ML) Analysis

The responses of Triticum durum wheat to drought stress were modeled with respect to various variables, including GS, GP, RL, SL, FW, DW, and WAC. Predictions were generated using four different ML techniques: SVM, XGBoost, Elastic Net (ELNET), and GPC. The modeling approach employed a total of twelve wheat genotypes (Table 1) and involved five levels of drought stress (0, −0.50, −1.48, −2.95, and −4.91 bar) applied to the genotypes. Separate models were developed for each of the seven variables studied as output parameters. The study’s findings are presented comprehensively in Table 3, providing an overview of the outcomes generated by the ML models utilized in the investigation. Evaluation metrics, such as MSE and MAD, were employed to assess the overall performance of the algorithms. A reduction in the values of these metrics indicates that the model predictions are becoming closer to the actual observed values. Additionally, the study evaluated the extent to which the R2 model could elucidate the variability observed between the independent factors and the dependent variable under investigation. The performances of the SVM, XGBoost, ELNET, and GPC models were assessed using a GCV approach. Among the various evaluation metrics, the XGBoost model exhibited the lowest MSE and MAD values, indicating a superior predictive accuracy for the training data. The MSE values for the variables GS, GP, RL, SL, FW, DW, and WAC were found to be 3.280, 2.291, 0.355, 0.263, 0.058, 0.012, 0.008, and 1.259, respectively. Additionally, the MAD values for the same variables were determined to be 2.591, 1.426, 0.245, 0.157, 0.039, and 0.795, respectively. Furthermore, this model demonstrated the highest R2 coefficient while making predictions for the variables (GS, GP, RL, SL, FW, DW, and WAC) using the training dataset (0.890, 0.789, 0.992, 0.995, 0.980, 0.974, and 0.993, respectively). For the training dataset, the XGBoost model emerged as the top-performing model compared to the other models (Table 3). Each trained ML model underwent evaluation by making predictions based on the test dataset (Table 3). This helps estimate how well the model is likely to perform on new, unseen data. Based on the evaluation of the R2, MSE, and MAD metrics, the ELNET model demonstrated a superior performance in predicting GS, GP, and WAC. Furthermore, while evaluating the criteria metrics, it was concluded that the GPC model had a better performance in predicting RL, but the XGBoost model had a better performance in estimating SL, FW, and DW. Figure 6 displays the linear regression graph depicting the projected values of the models that provide the most accurate prediction model for the variables under examination, alongside the observed actual values.

4. Discussion

The successful cultivation of tetraploid wheat, with its high yields, hinges upon its ability to withstand drought stress during early development. A pivotal aspect in achieving resilient strains is the identification of drought tolerance levels in existing varieties, a crucial step in effective breeding programs. This emphasis on drought tolerance is underscored by prior research conducted by Sayar et al. [43] and Aslan et al. [44], where the assessment of wheat responses to drought stress during germination, using PEG like our current study, aligns with the present research focus. Both studies emphasized the significance of determining tolerance levels, particularly during germination, as an essential measure in addressing challenges posed by drought. Notably, Badr et al. [45] stressed the importance of studying stress-responsive traits in genotype germination performance as a swift and effective screening method for identifying drought-resistant genotypes. The current research aimed to expand upon these insights by delving into the drought tolerance of diverse tetraploid wheat genotypes during the initial growth stage, employing a multivariate analysis and ML algorithms.
The research findings highlight a noticeable impairment in the germination performance of tetraploid wheat genotypes with increasing drought stress. This aligns with the observations of Aslan et al. [44] and Benlioglu and Ozgen [2], who similarly reported a negative impact of drought on the germination of tetraploid wheat. Root length emerges as a critical factor influencing wheat tolerance to drought during the early growth stages [44]. A longer root allows the plant to penetrate deeper into the soil, accessing more water resources. Varieties that excel in root formation during germination in arid conditions tend to exhibit better shoot development in subsequent growth stages. Therefore, both RL and SL are important features in evaluating drought tolerance [46]. In this study, Artuklu, Eminbey, Kızıltan-91, Sarıçanak-98, and T. dicoccum stood out in terms of root development under high drought stress. The results indicate that drought stress significantly affected shoot development compared to root growth, consistent with previous studies [47]. Sarıçanak 98 and Mirzabey 2000 outperformed other genotypes, demonstrating superior shoot formation and development, particularly under conditions of high drought stress. The increasing drought pressure in the external environment hampers seed absorption of sufficient water for germination [48]. Thus, drought stress hinders the use of stored nutrients in the seed for shoot and root development [49]. In this study, an increase in dry weight during the germination phases of tetraploid wheat varieties was observed to coincide with escalating stress levels. This phenomenon may be attributed to limited water access due to the heightened drought stress, which prevents the optimal utilization of storage nutrients [50]. Consequently, the impact of drought stress on FW was more pronounced than on DW, which is consistent with the findings of Sayar et al. [43]. In contrast to studies conducted on barley [50] and wheat [46], our results suggest a tendency for DW to increase with elevated stress levels.
Many studies conducted at different ploidy levels have consistently indicated that drought stress significantly reduces grain yield, yield components, harvest index, plant height, leaf area, and DW [51]. The utilization of STI and SSI provides a clear differentiation among tetraploid wheat genotypes based on their germination performance under varying drought stress levels [52]. However, it is important to note that STI and SSI may not always yield parallel results, especially when there is no statistically significant difference between genotypes and treatments. This discrepancy was evident in our study, particularly in the GP parameter, where the difference between genotypes and treatments was statistically insignificant. Similarly, in the DW parameter, which exhibits an inverse relationship with stress levels, these indexes may be deemed inappropriate for assessing tolerance. This discrepancy in results could be attributed to the sensitivity of these indices to statistical variations and their effectiveness in capturing differences under specific conditions. Researchers should be cautious and consider alternative indices or additional statistical analyses when dealing with parameters that may not align well with STI and SSI, especially in cases where there is no statistically significant difference between genotypes and treatments.
Selection based on a combination of indices can be a valuable strategy for developing drought tolerance in tetraploid wheat. Utilizing methods like PCA is crucial for characterizing genotypes under stress conditions. A narrow vector angle of axes in the same region indicates significant positive relationships among these elements [53]. Moreover, for the efficient use of PCA and accurate interpretation of results, it is recommended that the first two or three principal components explain at least 25% of the total variation [25]. The biplot graphs generated in our study revealed that Artuklu, Eminbey, Kızıltan-91, and Sarıçanak-98 were positioned near the tolerance indicators, indicating a higher drought stress tolerance compared to the other genotypes. Conversely, Selçuklu-97, Meram-2002, and T. dicoccum were located further away from tolerance indicators, suggesting a lower drought tolerance. This observation aligns with the findings of [54], who noted that domestication, selection, and breeding of wheat have positively influenced the improvement of above-ground biomass, ultimately increasing wheat yield. Similarly, our study indicated that T. dicoccum exhibited a low drought tolerance during the germination period. The germination performance of tetraploid wheat varieties under different drought stress levels unveiled a wide variation among genotypes, emphasizing the importance of a multifaceted approach for selecting genotypes with robust drought tolerance.
Methods based on ML offer the advantage of creating nonlinear correlations between yield factors and independent samples [20,26]. ML has demonstrated significant advancements compared to traditional regression models that rely on linear associations [27,32,55]. This technique allows for a comprehensive examination of multitemporal field sample data, facilitating the optimization of plant growing conditions and crop output [56,57,58]. The utilization of historical sampling and prediction models is crucial for enhancing future crop management strategies, providing valuable insights into the impact of previous farming practices and abiotic variables on observed target metrics [5]. Moreover, the selection of algorithms used in the estimation process holds significant importance. Various measures, such as MSE, MAD, and R2, are employed to determine the most optimal and superior performing algorithms [27]. Based on the results obtained from this research, it can be concluded that the ELNET model demonstrated a higher level of effectiveness in forecasting GS, GP, and WAC. The analysis also revealed that the GPC model exhibited superior predictive performance in relation to RL, while the XGBoost model demonstrated a better predictive performance for SL, FW, and DW. The models that exhibited the highest predictive accuracy in relation to the observed variables had a range of values between 0.7324 and 0.9932, as indicated by the linear regression R2 metric (Figure 6). The SL parameter estimate yielded the highest accuracy in the R2 value measurement. The use of these algorithms in forthcoming breeding investigations has the potential to enhance the decision-making process in tetraploid wheats under drought situations using data-driven methodologies. Furthermore, this study provides a fast and cost-effective method to determine the tolerance of genotypes to drought stress.

5. Conclusions

The responses and tolerance levels of tetraploid wheat genotypes to drought stress during the early period were assessed based on germination performance, STI, SSI, and a multivariate analysis. All PEG treatments led to reduced germination rates and delayed seedling growth. Severe drought stress levels of −2.95 bar and −4.91 bar in the early period inhibited further growth in some genotypes, indicating the sensitivity of these genotypes to these stress levels. The STI and SSI effectively conveyed the tolerance and susceptibility levels of the genotypes. The PCA provided valuable insights into tolerance levels and relationships among different parameters by analyzing the distribution of genotypes in the direction of tolerance indicators. The cluster analysis confirmed the results of the PCA, demonstrating a divergence across genotypes with respect to the characteristics under investigation. Moreover, the study suggests that employing a combined ML technique, potentially incorporating additional ML methods, could provide a reliable approach to establish the relationship between tetraploid wheats subjected to drought stress and their observed parameters during the early phases of growth. This integrated approach may offer a time-saving and cost-effective means of determining drought tolerance and susceptibility levels in tetraploid wheat. Overall, the methods and analyses applied in this study present a comprehensive and efficient approach for assessing drought stress in tetraploid wheat genotypes.

Supplementary Materials

The following supporting information can be downloaded at: https://www.mdpi.com/article/10.3390/agriculture14020206/s1, Table S1. The mean values and Duncan groups of germination parameters of tetraploid wheat genotypes under different drought stress levels. Table S2: Stress tolerance index (STI) and stress sensitive index (SSI) values of tetraploid wheat genotypes. Table S3: Eigenvalues and percent of total variation for the principal components.

Author Contributions

Conceptualization, B.B., F.D. and G.N.; methodology, B.B., F.D., A.T., K.H., H.Ö. and G.N.; software, B.B., A.T., F.D., S.K., M.P., T.W. and G.N.; validation, A.T., K.H., F.D., M.P. and G.N.; formal analysis, A.T., K.H., F.D. and G.N.; investigation, B.B., F.D. and G.N.; resources, B.B., F.D. and G.N.; data curation, A.T., K.H., F.D., S.K., M.P., T.W. and G.N.; writing—original draft preparation, B.B., F.D., A.T. and G.N.; writing—review and editing, B.B., F.D., A.T., K.H., H.Ö., S.K., M.P., T.W. and G.N.; visualization, B.B., F.D. and G.N.; supervision, B.B., H.Ö. and G.N.; project administration, B.B., F.D, A.T. and G.N.; funding acquisition, A.T. and K.H. All authors have read and agreed to the published version of the manuscript.

Funding

This research received no external funding.

Institutional Review Board Statement

Not applicable.

Data Availability Statement

All data supporting the conclusions of this article are included in this article.

Conflicts of Interest

The authors declare no conflicts of interest.

References

  1. Loura, D.; Dhankar, A.; Kumar, S. Weed management practices in wheat (Triticum aestivum L.): A review. Agric. Rev. 2023, 44, 1–11. [Google Scholar]
  2. Benlioglu, B.; Ozgen, M. In vitro selection of drought tolerant regenerants in durum wheat (Triticum durum desf.). Appl. Ecol. Environ. Res. 2021, 19, 1813–1825. [Google Scholar] [CrossRef]
  3. Zingale, S.; Guarnaccia, P.; Matarazzo, A.; Lagioia, G.; Ingrao, C. A systematic literature review of life cycle assessments in the durum wheat sector. Sci. Total Environ. 2022, 844, 157230. [Google Scholar] [CrossRef] [PubMed]
  4. TUIK. TSI: 2022 Türkiye Agricultural Production Values; TUIK: Ankara, Türkiye, 2023.
  5. Varga, I.; Radočaj, D.; Jurišić, M.; Kulundžić, A.M.; Antunović, M. Prediction of sugar beet yield and quality parameters with varying nitrogen fertilization using ensemble decision trees and artificial neural networks. Comput. Electron. Agric. 2023, 212, 108076. [Google Scholar] [CrossRef]
  6. Balestrini, R.; Chitarra, W.; Ghirardo, A.; Nardini, A.; Nerva, L. A stressful life: How plants cope with multiple biotic and abiotic adverse factors. Plant Stress 2022, 5, 100095. [Google Scholar] [CrossRef]
  7. Cohen, I.; Zandalinas, S.I.; Huck, C.; Fritschi, F.B.; Mittler, R. Meta-analysis of drought and heat stress combination impact on crop yield and yield components. Physiol. Plant. 2021, 171, 66–76. [Google Scholar] [CrossRef] [PubMed]
  8. De Santis, M.A.; Soccio, M.; Laus, M.N.; Flagella, Z. Influence of drought and salt stress on durum wheat grain quality and composition: A review. Plants 2021, 10, 2599. [Google Scholar] [CrossRef] [PubMed]
  9. Gitz, V.; Meybeck, A.; Lipper, L.; Young, C.D.; Braatz, S. Climate Change and Food Security: Risks and Responses; FAO: Rome, Italy, 2016. [Google Scholar]
  10. Yu, H.; Zhang, Q.; Sun, P.; Song, C. Impact of droughts on winter wheat yield in different growth stages during 2001–2016 in Eastern China. Int. J. Disaster Risk Sci. 2018, 9, 376–391. [Google Scholar] [CrossRef]
  11. Desa, U. World Population Prospects 2019: Highlights; United Nations Department for Economic and Social Affairs: New York, NY, USA, 2019; Volume 11, p. 125. [Google Scholar]
  12. Özgen, M.; Birsin, M.A.; Benlioglu, B. Biotechnological characterization of a diverse set of wheat progenitors (Aegilops sp. and Triticum sp.) using callus culture parameters. Plant Genet. Res. 2017, 15, 45–50. [Google Scholar] [CrossRef]
  13. Ahmad, A.; Aslam, Z.; Javed, T.; Hussain, S.; Raza, A.; Shabbir, R.; Mora-Poblete, F.; Saeed, T.; Zulfiqar, F.; Ali, M.M. Screening of wheat (Triticum aestivum L.) genotypes for drought tolerance through agronomic and physiological response. Agronomy 2022, 12, 287. [Google Scholar] [CrossRef]
  14. Rai, R.; Agrawal, M.; Agrawal, S. Threat to food security under current levels of ground level ozone: A case study for Indian cultivars of rice. Atmos. Environ. 2010, 44, 4272–4282. [Google Scholar] [CrossRef]
  15. Gopal, J.; Iwama, K. In vitro screening of potato against water-stress mediated through sorbitol and polyethylene glycol. Plant Cell Rep. 2007, 26, 693–700. [Google Scholar] [CrossRef] [PubMed]
  16. Verslues, P.E.; Agarwal, M.; Katiyar-Agarwal, S.; Zhu, J.; Zhu, J.K. Methods and concepts in quantifying resistance to drought, salt and freezing, abiotic stresses that affect plant water status. Plant J. 2006, 45, 523–539. [Google Scholar] [CrossRef] [PubMed]
  17. Mustamu, N.E.; Tampubolon, K.; Basyuni, M.; Al-Taey, D.K.; Janabi, H.J.K.A.; Mehdizadeh, M. Drought stress induced by polyethylene glycol (PEG) in local maize at the early seedling stage. Heliyon 2023, 9, e20209. [Google Scholar] [CrossRef] [PubMed]
  18. Caruso, A.; Chefdor, F.; Carpin, S.; Depierreux, C.; Delmotte, F.M.; Kahlem, G.; Morabito, D. Physiological characterization and identification of genes differentially expressed in response to drought induced by PEG 6000 in Populus canadensis leaves. J. Plant Physiol. 2008, 165, 932–941. [Google Scholar] [CrossRef]
  19. Türkoğlu, A.; Bolouri, P.; Haliloğlu, K.; Eren, B.; Demirel, F.; Işık, M.I.; Piekutowska, M.; Wojciechowski, T.; Niedbała, G. Modeling callus induction and regeneration in hypocotyl explant of fodder pea (Pisum sativum var. arvense L.) using machine learning algorithm method. Agronomy 2023, 13, 2835. [Google Scholar] [CrossRef]
  20. Demirel, F.; Eren, B.; Yilmaz, A.; Türkoğlu, A.; Haliloğlu, K.; Niedbała, G.; Bujak, H.; Jamshidi, B.; Pour-Aboughadareh, A.; Bocianowski, J. Prediction of grain yield in wheat by CHAID and MARS algorithms analyses. Agronomy 2023, 13, 1438. [Google Scholar] [CrossRef]
  21. Niazian, M.; Niedbała, G. Machine learning for plant breeding and biotechnology. Agriculture 2020, 10, 436. [Google Scholar] [CrossRef]
  22. Wahab, A.; Abdi, G.; Saleem, M.H.; Ali, B.; Ullah, S.; Shah, W.; Mumtaz, S.; Yasin, G.; Muresan, C.C.; Marc, R.A. Plants’ physio-biochemical and phyto-hormonal responses to alleviate the adverse effects of drought stress: A comprehensive review. Plants 2022, 11, 1620. [Google Scholar] [CrossRef]
  23. Kırnak, H.; Uzun, S.; Irik, H.A.; Özaktan, H.; Arslan, M. Water–yield relations of drip-irrigated peas under semi-arid climate condition. Int. J. Agric. Nat. Sci. 2021, 14, 85–95. [Google Scholar]
  24. Sivakumar, J.; Prashanth, J.E.P.; Rajesh, N.; Reddy, S.M.; Pinjari, O.B. Principal component analysis approach for comprehensive screening of salt stress-tolerant tomato germplasm at the seedling stage. J. Biosci. 2020, 45, 141. [Google Scholar] [CrossRef]
  25. Özaktan, H. Technological characteristics of chickpea (Cicer arietinum L.) cultivars grown under natural conditions. Turkish J. Field Crops 2021, 26, 235–243. [Google Scholar] [CrossRef]
  26. Demirel, F.; Uğur, R.; Popescu, G.C.; Demirel, S.; Popescu, M. Usage of Machine learning algorithms for establishing an effective protocol for the in vitro micropropagation ability of black chokeberry (Aronia melanocarpa (Michx.) Elliott). Horticulturae 2023, 9, 1112. [Google Scholar] [CrossRef]
  27. Eren, B.; Türkoğlu, A.; Haliloğlu, K.; Demirel, F.; Nowosad, K.; Özkan, G.; Niedbała, G.; Pour-Aboughadareh, A.; Bujak, H.; Bocianowski, J. Investigation of the influence of polyamines on mature embryo culture and DNA methylation of wheat (Triticum aestivum L.) using the machine learning algorithm method. Plants 2023, 12, 3261. [Google Scholar] [CrossRef] [PubMed]
  28. Michel, B.E.; Kaufmann, M.R. The osmotic potential of polyethylene glycol 6000. Plant Physiol. 1973, 51, 914–916. [Google Scholar] [CrossRef] [PubMed]
  29. El-Rawy, M.A.; Hassan, M.I. A diallel analysis of drought tolerance indices at seedling stage in bread wheat (Triticum aestivum L.). Plant Breed. Biotechnol. 2014, 2, 276–288. [Google Scholar] [CrossRef]
  30. ISTA. International Rules for Seed Testing. Intentional Seed Testing Association; ISTA: Bassersdorf, Switzerland, 2013. [Google Scholar]
  31. Haliloğlu, K.; Türkoğlu, A.; Aydin, M. Determination of imazamox herbicide dose in in vivo selection in wheat (Triticum aestivum L.). Eregli J. Agric. Sci. 2022, 2, 1–11. [Google Scholar]
  32. Türkoğlu, A.; Tosun, M.; Haliloğlu, K.; Karagöz, H. Effects of early drought stress on germination and seedling growth parameters of Kırik bread wheat (Triticum aestivum L.). Eregli J. Agric. Sci. 2022, 2, 75–80. [Google Scholar] [CrossRef]
  33. Fernandez, G.C. Stress tolerance index-a new indicator of tolerance. HortScience 1992, 27, 626d. [Google Scholar] [CrossRef]
  34. Clarke, J.M.; DePauw, R.M.; Townley-Smith, T.F. Evaluation of methods for quantification of drought tolerance in wheat. Crop Sci. 1992, 32, 723–728. [Google Scholar] [CrossRef]
  35. Guttieri, M.J.; Stark, J.C.; O’Brien, K.; Souza, E. Relative sensitivity of spring wheat grain yield and quality parameters to moisture deficit. Crop Sci. 2001, 41, 327–335. [Google Scholar] [CrossRef]
  36. Fernandez, G.C. Effective selection criteria for assessing plant stress tolerance. In Proceedings of the International Symposium on Adaptation of Vegetables and Other Food Crops in Temperature and Water Stress, Shanhua, Taiwan, 13–16 August 1992; pp. 257–270. [Google Scholar]
  37. Yuan, Y. Multiple imputation using SAS software. J. Stat. Softw. 2011, 45, 1–25. [Google Scholar] [CrossRef]
  38. Noble, W.S. What is a support vector machine? Nat. Biotechnol. 2006, 24, 1565–1567. [Google Scholar] [CrossRef]
  39. Chen, T.; Guestrin, C. Xgboost: A scalable tree boosting system. In Proceedings of the 22nd ACM Sigkdd International Conference on Knowledge Discovery and Data Mining, San Francisco, CA, USA, 13–17 August 2016; pp. 785–794. [Google Scholar]
  40. John, M.; Haselbeck, F.; Dass, R.; Malisi, C.; Ricca, P.; Dreischer, C.; Schultheiss, S.J.; Grimm, D.G. A comparison of classical and machine learning-based phenotype prediction methods on simulated data and three plant species. Front. Plant Sci. 2022, 13, 932512. [Google Scholar] [CrossRef] [PubMed]
  41. Rasmussen, C.E. Gaussian processes in machine learning. In Summer School on Machine Learning; Springer: Cambridge, MA, USA, 2003; pp. 63–71. [Google Scholar]
  42. Camacho-Pérez, E.; Lugo-Quintal, J.M.; Tirink, C.; Aguilar-Quiñonez, J.A.; Gastelum-Delgado, M.A.; Lee-Rangel, H.A.; Roque-Jiménez, J.A.; Garcia-Herrera, R.A.; Chay-Canul, A.J. Predicting carcass tissue composition in Blackbelly sheep using ultrasound measurements and machine learning methods. Trop. Anim. Health Prod. 2023, 55, 300. [Google Scholar] [CrossRef] [PubMed]
  43. Sayar, R.; Bchini, H.; Mosbahi, M.; Ezzine, M. Effects of salt and drought stresses on germination, emergence and seedling growth of durum wheat (Triticum durum Desf.). J. Agric. Res. 2010, 5, 2008–2016. [Google Scholar]
  44. Aslan, D.; Aktaş, H.; Ordu, B.; Zencirci, N. Evaluation of bread and einkorn wheat under in vitro drought stress. J. Anim. Plant Sci. 2017, 27, 1974–1983. [Google Scholar]
  45. Badr, A.; El-Shazly, H.H.; Tarawneh, R.A.; Börner, A. Screening for drought tolerance in maize (Zea mays L.) germplasm using germination and seedling traits under simulated drought conditions. Plants 2020, 9, 565. [Google Scholar] [CrossRef] [PubMed]
  46. Datta, J.; Mondal, T.; Banerjee, A.; Mondal, N. Assessment of drought tolerance of selected wheat cultivars under laboratory condition. J. Agric. Technol. 2011, 7, 383–393. [Google Scholar]
  47. Benlioglu, B.; Ozkan, U. The influence of salinity and drought stress on some oat cultivars (Avena sativa L.) by determining some stress indexes and growth performances at the germination stage. Fresenius Environ. Bull. 2021, 31, 771–778. [Google Scholar]
  48. Yang, X.; Lu, M.; Wang, Y.; Wang, Y.; Liu, Z.; Chen, S. Response mechanism of plants to drought stress. Horticulturae 2021, 7, 50. [Google Scholar] [CrossRef]
  49. Khaeim, H.; Kende, Z.; Jolánkai, M.; Kovács, G.P.; Gyuricza, C.; Tarnawa, Á. Impact of temperature and water on seed germination and seedling growth of maize (Zea mays L.). Agronomy 2022, 12, 397. [Google Scholar] [CrossRef]
  50. Benlioğlu, B. Determination of responses of some barley cultivars (Hordeum vulgare L.) to salt stress in different doses at the germination period. J. Cent. Res. Inst. Field Crops 2015, 24, 109–114. [Google Scholar]
  51. Wang, J.Y.; Turner, N.C.; Liu, Y.X.; Siddique, K.H.; Xiong, Y.C. Effects of drought stress on morphological, physiological and biochemical characteristics of wheat species differing in ploidy level. Funct. Plant Biol. 2016, 44, 219–234. [Google Scholar] [CrossRef]
  52. Zencirci, N.; Ulukan, H.; Bülent, O.; Aslan, D.; Mutlu, H.T.; Örgeç, M. Salt, cold, and drought stress on einkorn and bread wheat during germination. Int. J. Second. Metab. 2019, 6, 113–128. [Google Scholar] [CrossRef]
  53. Ozaktan, H.; Doymaz, A. Mineral composition and technological and morphological performance of beans as influenced by organic seaweed-extracted fertilizers applied in different growth stages. J. Food Compos. Anal. 2022, 114, 104741. [Google Scholar] [CrossRef]
  54. Wang, J.Y.; Xiong, Y.C.; Li, F.M.; Siddique, K.H.; Turner, N.C. Effects of drought stress on morphophysiological traits, biochemical characteristics, yield, and yield components in different ploidy wheat: A meta-analysis. Adv. Agron. 2017, 143, 139–173. [Google Scholar]
  55. Aasim, M.; Katırcı, R.; Akgur, O.; Yildirim, B.; Mustafa, Z.; Nadeem, M.A.; Baloch, F.S.; Karakoy, T.; Yılmaz, G. Machine learning (ML) algorithms and artificial neural network for optimizing in vitro germination and growth indices of industrial hemp (Cannabis sativa L.). Ind. Crops Prod. 2022, 181, 114801. [Google Scholar] [CrossRef]
  56. Jafari, M.; Daneshvar, M.H.; Jafari, S.; Hesami, M. Machine learning-assisted in vitro rooting optimization in Passiflora caerulea. Forests 2022, 13, 2020. [Google Scholar] [CrossRef]
  57. Kirtis, A.; Aasim, M.; Katırcı, R. Application of artificial neural network and machine learning algorithms for modeling the in vitro regeneration of chickpea (Cicer arietinum L.). Plant Cell Tissue Organ Cult. 2022, 150, 141–152. [Google Scholar] [CrossRef]
  58. Pepe, M.; Hesami, M.; Small, F.; Jones, A.M.P. Comparative analysis of machine learning and evolutionary optimization algorithms for precision micropropagation of Cannabis sativa: Prediction and validation of in vitro shoot growth and development based on the optimization of light and carbohydrate sources. Front. Plant Sci. 2021, 12, 757869. [Google Scholar]
Figure 1. The meaning of parameters examined according to genotype and stress levels. GS: germination speed; GP: germination power; RL: root length; SL: shoot length; FW: fresh weight; DW: dry weight; WAC: water absorption capacity; RMSE: root mean square error; R2: coefficient of determination.
Agriculture 14 00206 g001
Figure 2. Classification of tetraploid wheat genotypes for different drought stress levels along with the first and second principal components on biplots ((a) control, (b) −0.50 bar, (c) −1.48 bar, (d) −2.95 bar, (e) −4.91 bar, and (f) mean of all). GS: germination speed; GP: germination power; RL: root length; SL: shoot length; FW: fresh weight; DW: dry weight; WAC: water absorption capacity; STI: stress tolerance index.
Agriculture 14 00206 g002
Figure 3. Principal component analysis (biplot) and output values of genotypes as well as examined parameters. GS: germination speed; GP: germination power; RL: root length; SL: shoot length; FW: fresh weight; DW: dry weight; WAC: water absorption capacity; STI: stress tolerance index.
Agriculture 14 00206 g003
Figure 4. Phylogenetic tree of tetraploid wheat genotypes according to germination performance and tolerance indices under different drought stresses.
Agriculture 14 00206 g004
Figure 5. Heat map showing the correlation between germination parameters in tetraploid wheat genotypes under various levels of drought stress. * Significant at the 0.05 probability level; ** significant at the 0.01 probability level; ns: non-significant. GS: germination speed; GP: germination power; RL: root length; SL: shoot length; FW: fresh weight; DW: dry weight; WAC: water absorption capacity; r: Pearson’s correlation.
Agriculture 14 00206 g005
Figure 6. Based on the test set forecast, linear regression of the best models’ expected values and their real values. GS: germination speed; GP: germination power; RL: root length; SL: shoot length; FW: fresh weight; DW: dry weight; WAC: water absorption capacity; SVM: support vector machines; XGBoost: extreme gradient boosting; ELNET: elastic-net; GPC: Gaussian processes classifier.
Agriculture 14 00206 g006
Table 1. Tetraploid wheat genotypes used in the research.
GenotypeTypeRegistration YearGrowth Habit Breeding Company
Altın-40/98Cultivar1998AlternativeField Crops Central Research Institute, Ankara, Türkiye
ArtukluCultivar2008SpringGAP International Agricultural Research and Training Center, Diyarbakir, Türkiye
Çakmak-79Cultivar1979AlternativeField Crops Central Research Institute, Ankara, Türkiye
Çeşit-1252Cultivar1999AlternativeField Crops Central Research Institute, Ankara, Türkiye
EminbeyCultivar2009WinterField Crops Central Research Institute, Ankara, Türkiye
Kızıltan-91Cultivar1991AlternativeField Crops Central Research Institute, Ankara, Türkiye
Kunduru-1149Cultivar1967WinterField Crops Central Research Institute, Ankara, Türkiye
Meram-2002Cultivar2002AlternativeBahri Dagdas International Agricultural Research Institute, Konya, Türkiye
Mirzabey-2000Cultivar2000AlternativeField Crops Central Research Institute, Ankara, Türkiye
Sarıçanak 98Cultivar1998SpringGAP International Agricultural Research and Training Center, Diyarbakir, Türkiye
Selçuklu-97Cultivar1997AlternativeBahri Dagdas International Agricultural Research Institute, Konya, Türkiye
T. dicoccum (Emmer)Landrace-AlternativeCollected from Kars Province, Türkiye
Table 2. Variance analysis of tetraploid wheat genotypes’ germination performances under different drought stress levels.
Variation SourcedfMean Square
GSGPRLSLFWDWWAC
Genotype (G)11184.833 **97.391 **17.668 **10.879 **0.290 **0.047 **242.055 **
Stress level (S)42981.008 **642.359 **628.871 **522.911 **5.938 **0.057 **9299.92 **
G × S4435.308 **16.267 ns2.936 **6.641 **0.053 **0.005 **72.837 **
GS: germination speed; GP: germination power; RL: root length; SL: shoot length; FW: fresh weight; DW: dry weight; WAC: water absorption capacity. ** 0.01 significant at the probability level; ns: non-significant.
Table 3. Algorithms’ goodness-of-fit criteria for prediction of variables.
Observed VariableML CriterionSVMXGBoostELNETGPC
TrainTestTrainTestTrainTestTrainTest
GS 1R20.8010.6000.8900.7300.7960.7620.8710.715
MSE4.4066.3203.2805.1904.4554.8733.5405.339
MAD3.3894.8312.5913.8613.6083.7552.9904.266
GPR20.6550.3100.7890.3520.6210.5140.7580.349
MSE2.9345.8942.2915.7133.0744.9462.4555.725
MAD1.7944.2641.4263.9152.2673.5811.7304.092
RLR20.8660.7360.9920.9800.9440.9490.9870.981
MSE1.4542.0720.3550.5710.9360.9150.4490.552
MAD0.8021.2170.2450.4090.7060.7050.3290.407
SLR20.7790.6730.9950.9620.8870.8520.9900.942
MSE1.7232.2440.2630.7611.2341.5120.3680.944
MAD0.7581.1470.1570.4570.7940.9120.2300.501
FWR20.9030.7590.9800.9620.9150.8920.9740.945
MSE0.1280.1930.0580.0770.1200.1290.0660.092
MAD0.0800.1250.0390.0560.0930.1060.0470.070
DWR20.9010.8070.9740.9440.7330.7930.9350.886
MSE0.0230.0330.0120.0180.0380.0340.0190.025
MAD0.0150.0220.0080.0140.0290.0280.0140.020
WACR20.9240.8300.9930.8910.9490.9020.9890.880
MSE4.3096.7501.2595.4193.5055.1401.6575.684
MAD2.9034.7380.7953.9142.8442.4921.2383.235
1 GS: germination speed; GP: germination power; RL: root length; SL: shoot length; FW: fresh weight; DW: dry weight; WAC: water absorption capacity; MSE: root mean squared error; MAD: mean absolute deviation; SVM: support vector machines; XGBoost: extreme gradient boosting; ELNET: elastic-net; GPC: Gaussian processes classifier.
Disclaimer/Publisher’s Note: The statements, opinions and data contained in all publications are solely those of the individual author(s) and contributor(s) and not of MDPI and/or the editor(s). MDPI and/or the editor(s) disclaim responsibility for any injury to people or property resulting from any ideas, methods, instructions or products referred to in the content.

